
Automated Estimation of Construction Equipment Emission Using Inertial Sensors and Machine Learning Models


1
Computational Science Research Center, San Diego State University, San Diego, CA 92182, USA
2
Department of Civil, Construction, and Environmental Engineering, San Diego State University, San Diego, CA 92182, USA
*
Author to whom correspondence should be addressed.
Sustainability 2022, 14(5), 2750; https://doi.org/10.3390/su14052750
Submission received: 8 November 2021
/
Revised: 21 February 2022
/
Accepted: 23 February 2022
/
Published: 26 February 2022
(This article belongs to the Special Issue Data Analytics and Artificial Intelligence for Sustainable Construction Engineering and Built Environment)
Abstract
:The construction industry is one of the main producers of greenhouse gasses (GHG). With the looming consequences of climate change, sustainability measures including quantifying the amount of air pollution during a construction project have become an important project objective in the construction industry. A major contributor to air pollution during construction projects is the use of heavy equipment. Therefore, efficient operation and management can substantially reduce a project’s carbon footprint and other environmental harms. Using unintrusive and indirect methods to predict on-road vehicle emissions has been a widely researched topic. Nevertheless, the same is not true in the case of construction equipment. This paper describes the development and deployment of a framework that uses machine learning (ML) methods to predict the level of emissions from heavy construction equipment. Data is collected via an Internet of Things (IoT) approach with accelerometer and gyroscope sensors as data collection nodes. The developed framework was validated using an excavator performing real-world construction work. A portable emission measurement system (PEMS) was used along with the inertial sensors to record the amount of CO, NOX, CO2, SO2, and CH4 pollution emitted by the equipment. Different ML algorithms were developed and compared to identify the best model to predict emission levels from inertial sensors data. The results show that Random Forest with the coefficient of determination (R2) of 0.94, 0.91, and 0.94, and normalized root-mean-square error (NRMSE) of 4.25, 6.42, and 5.17 for CO, NOX, and CO2, respectively, was the best algorithm among different models evaluated in this study.
1. Introduction
Climate change is one of the most serious challenges faced by humankind today. A rise in the concentration of greenhouse gases (GHGs) such as CO2, CH4, NO2, and water vapor in the atmosphere is responsible for the increase in the average earth surface temperature, and CO2 plays a key role in contributing to this temperature growth [1,2]. Since the 1970s, human activities have been the main cause of global warming, which in turn has many negative effects on climate change, agriculture, and human health [3,4,5,6]. The construction industry produces 23% of the total CO2 emissions released by human activities [7]. Construction materials production, transportation of building materials and modules, and a large amount of construction equipment fuel consumption are all responsible for the large amounts of GHG emissions [8,9,10]. Construction equipment typically consumes a large amount of fuel and contributes significantly to GHG emissions and global warming. Yan et al. showed that 12–17% of the total GHG emissions in building construction are from the transportation of building materials and construction equipment energy consumption [11]. In 2005, there were more than two million pieces of construction and mining heavy equipment in the United States, consuming more than 6 billion gallons of diesel fuel annually [12], a figure that most certainly has not decreased since. Thus, sustainable management and use of construction equipment can have a great effect on reducing global warming, environmental threats, and earth temperature. Heavy equipment often uses powerful engines and produces different types of gasses even during idling. Currently, such accurate measurements are manual, time-consuming, and labor-intensive [13].
This paper describes the development of a novel framework that uses machine learning (ML) methods to predict the emissions of heavy construction equipment using data collected by the accelerometer and gyroscope sensors and the validation of this framework using an excavator performing real-world construction work. Emissions were measured using a portable emission measurement system (PEMS) with a probe inserted into the exhaust pipe of the equipment to record the quantities of CO, NOX, CO2, SO2, and CH4 emission in ppm. The PEMS device allows measuring the emissions of combustion engine vehicles and equipment while they are being operated instead of those used only on stationary rollers on a dynamometer that simulates real-world driving [14]. Previous studies have largely focused on predicting emissions from on-road vehicles, turbines, and diesel engines, leveraging engine features and direct measurements [15,16,17,18,19]. However, this is the first research study that enables ML-based emission estimation of construction equipment using non-intrusive sensing of the equipment movement with no regard to the machine engine, fuel consumption, and or speed.
The contribution of this study to the body of knowledge and practice is a demonstration of the fact that activity-based emission estimation can be made more practical, less tedious, and automated. The proposed process does not rely on direct PEMS-based measurements and can be performed while the equipment is engaged in actual work without the need to sample from the equipment exhaust pipe. Therefore, the objective of this study is to verify if the movement of articulated parts of given construction equipment captured by inertial sensors can be reliable predictors to quantify equipment emission using ML methods.
2. Literature Review
The literature on transportation emissions generated by combustion engines can be divided into studies that focused on on-road and those that studied off-road vehicles. Each category of research is characterized by unique features, processes, standards, and limitations that deserve a full review to establish the state of the research. In addition, the use of IoT methods with accelerometer and gyroscope sensors for indirect measurement of different phenomena or physical properties have recently gained significant research attention. Therefore, this section provides a comprehensive literature review in each of these three domains: (a) prediction of the emissions from on-road vehicles; (b) prediction of the emissions from construction (i.e., off-road) equipment; and (c) the use of accelerometer and gyroscope data to train ML models for measuring quantities varied by movement or physical activity.
2.1. On-Road Vehicles
The emission performance of on-road combustion engine vehicles is influenced by the size and type of the engine, fuel type, and exhaust after-treatment system used [20]. Most of the studies in this area concentrated on particulate emissions [21] including NOX emissions [22,23,24,25,26,27]. Some studies used ML methods to predict the emissions, using dynamometer tests and the parameters to develop these models. Si et al. developed a model to predict NOX emissions using a neural network (NN) where the actual values were measured by a Continuous Emissions Monitoring System (CEMS) [28]. PEMS, which is the device used in the study presented in this paper, was designed to provide an alternative to the drawbacks of the CEMS [29]. Built upon the findings of their first study, Si et al. incorporated gradient boosting techniques in subsequent research to improve their results [30]. Other researchers have shown that the combination of NN and heuristic algorithms would further enhance the results [14]. In another study, multiple factors such as road environment, atmospheric, and after-treatment performance were considered when analyzing NOX concentrations from Euro 6 diesel engines during real-world driving experiments [31]. Wen et al. considered data such as vehicle speed, vehicle acceleration, and flow rate as inputs to train an NN nonlinear autoregressive exogenous model (NARX) [32]. Khurana et al. reviewed different supervised learning algorithms to predict emissions from automobiles and concluded that NN had accurate answers in addressing this kind of problem [33]. Fei et al. used a classification model based on the CatBoost algorithm to categorize emission levels [34]. Le-Cornec et al. clustered vehicles with similar emissions performance and modeled instantaneous emissions [35]. In a more recent study, Yu et al. developed a deep learning algorithm to predict the instantaneous NOx emissions from diesel engines [36].
Previous studies in this area have focused on on-road vehicles and have demonstrated promising results. Nevertheless, measuring and predicting on-road vehicles emission pose fewer challenges compared with off-road equipment. The more diverse set of activities and operations of off-road vehicles require a variety of engine modes and thus fuel consumption and emission levels. In addition, the uncertainty of such activities adds another level of complexity and challenge to developing predictive models of any sort.
2.2. Off-Road Vehicles
Compared with emission estimation research for on-road vehicles, off-road vehicles have received much less attention. The dearth of research is even more severe with respect to the adoption of advanced technologies that can result in more simplified and accurate emission prediction. A number of studies conducted by federal organizations such as the Environmental Protection Agency (EPA), academic institutions, and private organizations, used onboard instruments to measure construction equipment emissions [37,38,39,40]. While the insights provided by these studies inspire new research, it has been reported that in none of these cases were the collected data verified for quality and made available for public use [41]. Heidari and Marr compared real-time emissions from construction equipment with model predictions proposed by the EPA [13]. Their findings indicate that although model predictions agreed with actual emissions in some cases, in others they were up to 100 percent higher. In addition, they obtained very different emission rates during various operating conditions. Abolhasani et al. assessed the fuel use and emissions of excavators during field duty cycles and concluded that in non-idle modes, mass per time emission rates were seven times higher than in idle modes [42]. Data collected on the emissions of backhoes, motor graders, and wheel loaders using B20 biodiesel and petroleum diesel were compared by Frey et al. where a robust methodology for designing the study, collecting field data, screening and ensuring the quality of the data, and analyzing the data was developed. They showed that using B20 instead of petroleum diesel would lead to a 1.8% decline in NO emissions, as well as significant decreases in opacity, HC, and CO emissions [43]. A study of selected motor graders fueled by petroleum diesel and B20 biodiesel characterized their field activity, fuel use, and emissions and concluded that using B20 instead of petroleum diesel results in a negligible decrease in emissions [44]. Lewis et al. developed recommendations for reducing the emissions from construction equipment and recommended using field emissions data instead of engine dynamometer data to reduce emissions [45]. In another study, the development and use of an emissions inventory system for a fleet of backhoes, front-end loaders, and motor graders were discussed to support the decision-making process regarding the replacement of older equipment with more efficient ones [46]. Using engine dynamometer data from nonroad mobile sources such as construction, farming, and industrial engines, Frey and Bammi developed probabilistic emission factors for NOX and HC [47]. Frey et al. undertook a sensitivity analysis to predict fuel consumption and emissions for construction equipment through engine attribute data including horsepower, displacement, model year, engine tier, and engine load and showed that in petroleum diesel engines, fuel use and pollutant emission rates increase with gear ratio, horsepower, and torque and decrease with model year and engine tier [48]. By analyzing field data, a quantitative model was developed by Barati and Shen (2016) to more accurately estimate the various emission rates of construction equipment [49]. An operational level emission model has been developed based on ordinary least square (OLS) and multivariate linear regression (MLR) analysis of field data. The results of that study verified the high correlation between emission rates, operational parameters, and engine data.
As stated earlier, there is a general scarcity of research in the area of off-road vehicle emission estimation. Of the limited studies in this area, a small subset focused on construction equipment. This is while the understanding of construction heavy machinery emissions is critical to prevent GHG emissions as well as to support the decision-making process in bidding and other project phases [50]. Standards such as those suggested by the EPA and other academic research do not represent an adequate level of prediction accuracy and they do not consider different operating states. In addition, none of the previous studies in this area leveraged the potential of movement-based methods such as using accelerometer and gyroscope sensors in conjunction with advanced ML methods.
2.3. Training ML Models with Inertial Data
There are generally two types of inertial measurement systems that are pervasively used and commonly found in daily lives (such as in smartphones): a sensor that measures acceleration called an accelerometer, and a sensor that measures the velocity of rotation about a circular axis (i.e., angular velocity) called a gyroscope [51]. A magnetometer could be added to the two sensors in which case they are collectively called an inertial measurement unit (IMU). Researchers have used wearable devices equipped with one or two of these sensors or a complete IMU to report instantaneous and sudden vibrations of the human body since the 1990s [52,53,54,55]. Micro-Electro-Mechanical Systems (MEMS) inertial sensors have proved extremely useful, accurate, and computationally efficient for activity recognition with applications in health care, sports, and engineering [56,57,58]. For instance, researchers analyzed soccer players’ movement patterns using wireless accelerometers to gain insight into pattern recognition [59]. With the advancement of smartphones, mobile accelerometer sensors were later used to identify human activity [60]. Motoi et al. proposed taking measurements of the speed at which subjects walk and monitoring their posture and movement [61]. Combined with a body-worn microphone, accelerometers were used in a wood workshop to segment and recognize typical user gestures [62]. Similar research has recently gained significant traction in engineering applications [63,64]. For example, Johnson and Trivedi used accelerometers to detect, recognize, and record driving styles for a driving safety application [65]. Using different types of sensors, researchers have also explored simulation-based heavy equipment emission estimation [66]. The use of ML models trained by accelerometer and gyroscope data has been explored in construction research as well. Akhavian and Behzadan (2015) developed an ML-based methodology to use smartphone sensors as ubiquitous, multi-modal data collection and transmission nodes to detect detailed construction workers [67] and equipment [68] activities. More recently, and with the advancement of deep learning, Salton et al. (2021) developed a framework for recognizing heavy construction equipment activity via accelerometers based on convolutional and recurrent neural network architectures [69].
As shown in this section, the concentration of previous studies using inertial sensors has focused on activity recognition in humans and equipment. Previous studies have often developed a classification model to differentiate between several defined activities. Frameworks that use ML models trained with inertial sensors have never been adopted before to seamlessly predict emissions from heavy equipment. Currently, there is no simple and integrated framework of data collection, analysis, and communication capable of unobtrusively detecting heavy equipment emissions involved in real-world activities. Thus, a new approach that does not rely on sophisticated installation and maintenance can streamline the quantification of emissions. A suitable framework for this purpose should be simple and cost-effective for implementation. This study introduces a framework that predicts the amount of emissions produced by construction equipment during each activity using two inertial sensors and a computer. Since these sensors are commonly available in smartphones, the proposed methodology also has the potential to be ubiquitous where a smartphone can replace both the data collection (i.e., sensors) and analysis (i.e., computer) nodes. Nevertheless, using smartphones for this purpose is beyond the scope of this study, wherein it is only the performance of ML models to predict emissions using inertial data that is evaluated.
3. Methodology
In this section, first the data collection method is outlined and then a description of the feature extraction process is provided. Next, the learning algorithms employed as well as metrics to evaluate their performance are discussed. Figure 1 provides an overview of the developed methodology, indicating the input and output of the ML models for training and implementation.
As shown in Figure 1, the accelerometer and gyroscope inertial sensors capture the motions of the excavator’s body and arm and transmit them to the computer in real-time. Data obtained by sensors is divided into segments for feature extraction. The extracted features were used as the input of ML models while data collected using the PEMS device served as the output for training. ML models trained with this data will then be ready to predict the amount of emissions given inertial data fed into them. The data used at this stage (i.e., the test dataset) has not been seen by the ML model in the training stage to enable assessing the generalizability power in their prediction.
3.1. Data Collection
To generate high-fidelity outputs, the data collection process was performed in an uncontrolled environment where the construction equipment was involved in routine daily activities without any interruptions from the researchers. Data were collected from a Caterpillar 305D CR excavator which was working to expand a trench around an underground pipeline as shown in Figure 2. Two Noraxon MyoMotion integrated accelerometer and gyroscope sensors [70] were used to collect the equipment body acceleration (i.e., vibration) data. One sensor (Sensor 1) was attached inside the excavator cabin and another one was affixed to its stick (Sensor 2), near the bucket. In addition, data describing engine emissions generated by the equipment were logged by an E-Instruments E9000 Plus Gas Analyzer PEMS [71]. Table 1 shows the sensors’ specifications [70].
The accelerometer data were logged using the sensors’ Noraxon myoRESEARCH software and stored in a laptop secured inside the equipment cabin during data collection to maintain wireless connectivity. A camera was also attached inside the cabin to record the entire data collection session. The laptop was plugged into a porTable 200-Watt Caterpillar power station to ensure it was powered on throughout data collection. The sampling frequency was set at 100 Hz. This frequency ensured that no noteworthy movement was neglected and at the same time, the volume of recorded data was not restrictively expansive. Data were stored in comma-separated value (CSV) format for further pre-processing. As shown in Table 2, the PEMS recorded NO, NO2, CO2, CO, O2, SO2, CH4, and H2S as well as pressure and temperature [71]. PEMS uses electrochemical sensors for most gasses. Electrochemical sensors detect interactions between the sensing surface and the analytes and convert them into quantitative and qualitative evidence by using electrodes [72]. The other sensor is nondispersive infrared (NDIR) and carbon dioxide is typically measured with this type of sensor. In these sensors, light waves are emitted from an infrared (IR) lamp through a tube filled with air toward an optical filter in front of an IR light detector. Then, infrared detectors measure the light that is not absorbed by CO2 molecules or the optical filter. Gas emission units are measured in parts per million (ppm) and are based on the volume fraction (m3/m3) [73]. In Table 2, Tair and Tgas are the temperatures of the air and gas respectively. During the operation, the ambient temperature was 16 to 18 °C, the pressure was 1017 to 1020 mbar, the humidity was 63% to 90%, and the maximum wind speed was 17 km/h. This study focuses on NO, NO2, CO2, and CO emissions as major diesel engine pollutants [13]. Furthermore, the sum of NO and NO2 measured emissions will be used as NOx to enable comparison between the results of this study and previous work that measured this pollutant.
3.2. Feature Extraction
In supervised ML algorithms, training the models with raw data as opposed to descriptive features may increase the computational cost (particularly in the case of high-dimensional, high-volume data). Also in some cases, it may lead to an accuracy drop due to overfitting [74]. Therefore, extracting certain features serves as an important pre-processing step before model training. These features often include statistically derived values such as mean, variance, peak, interquartile range (IQR), correlation, and root mean square (RMS). Training ML models with accelerometer and gyroscope data has been subject to a great deal of previous research as stated in the literature review section. According to a comprehensive survey study of research papers focusing on online activity recognition using mobile phone sensors (e.g., accelerometers and gyroscopes), features such as mean, maximum, minimum, correlation between axes, and IQR are among the most frequently used for activity recognition [75]. However, those studies target human activity recognition and not machines or heavy equipment. A recent, similar study conducted by a previous author examining activity recognition of construction equipment leveraged ReliefF and correlation-based feature selection (CFS) to select distinguishing features among several features extracted from accelerometer and gyroscope data [68]. Given the similar nature of the presented work and the aforementioned previous research, the same subset of features was extracted. These features include (1) the mean value of gyroscope sensor data in z direction, (2) the mean value of gyroscope sensor data in x direction, (3) the mean value of accelerometer sensor data in x direction, (4) mean value of accelerometer sensor data in y direction, (5) mean value of accelerometer sensor data in z direction, (6) the IQR of accelerometer sensor data in the z direction, and (7) the maximum of accelerometer sensor data in x direction. These seven features were extracted from each data segment created by breaking down the dataset into windows of equal size. Typically, a 50% overlap between the segments is considered to ensure continuity in capturing all patterns in the data based on previous studies [58]. A window size of 0.25 s (25 data points per segment) at a sampling frequency of 100 Hz was used based on the research conducted by Akhavian and Behzadan (2015) where the researchers concluded that this is the optimal size for the segments in the accelerometer and the gyroscope data for construction equipment activity recognition. Cycles of activities such as traveling, scooping, dropping, and rotating can be adequately captured with this window size [68].
3.3. Learning Algorithms and Performance Metrics
This study aims to develop different types of ML models and evaluate their performance in predicting the level of emissions of certain pollutants produced by construction equipment. Data extracted from accelerometers and gyroscopes are used as inputs to the model and the outputs are the amount of each pollutant’s emission. The outcome of this supervised learning approach is a model that can best describe the relationship between inertial sensor data and the level of emission of the given construction equipment. In a supervised learning method, inputs and associated outputs (i.e., ground truth) are provided to the model during the training phase. Learning algorithms use training data to produce inferred functions, which are then used to map new examples using a test dataset that has not been seen by the model during training [76]. In this research, the training portions constituted 70% of the dataset selected randomly, and the rest was kept out for testing.
In order to identify the best model, classic ML algorithms have been used to see if they are capable of predicting emission levels directly from accelerometer and gyroscope sensor data. Four different learning algorithms were applied to develop the models for this study using MATLAB 2020a: Neural Network (NN), Regression Trees (RT), Random Forest (RF), and Linear Regression (LR). In the case of LR, a MATLAB built-in fit linear regression function is employed. However, for other algorithms, the researchers developed the code in MATLAB from scratch. Each algorithm is described briefly in the following subsections.
3.3.1. Linear Regression (LR)
LR is the simplest among the algorithms tested in this research. Nevertheless, its simplicity sometimes results in acceptable results calculated in a fast computation process. Regression analysis is a technique for estimating relationships between dependent and independent variables. In LR, the model assumes that input variables (x) and output variables (y) are linearly related. Precisely, the LR model calculates y from a linear combination of the input variables x’s [77]. The literature from statistics often refers to LR as multiple linear regression when there are multiple input variables such as the case in this research. This method of modeling corresponds explanatory variables to a scalar response with a linear approach. LR, similar to all regression analysis methods, targets conditional probability distributions of response, rather than their joint probability distributions as is in the case with multivariate analysis (i.e., where there is more than one dependent variable). Due to the nature of the data and the complexity of relationships between the variables in this study, it is not expected that the LR model leads to an acceptable result. However, LR models have been developed in this research for all three pollutants to verify this hypothesis.
3.3.2. Neural Network (NN)
NN is commonly used to solve a wide variety of scientific and engineering problems. A two-layer NN includes only one input layer, one hidden layer, and one output layer. A standard multilayer perceptron NN comprises an input layer, a hidden layer, and an output layer, and each layer consists of nodes. The number of layers and nodes (i.e., NN architecture) are important factors in determining the performance of the model. In this research, Gradient Descent was used as the optimization algorithm. Gradient Descent is one of the most commonly used optimization algorithms for NN models and is used heavily in both linear regression and classification problems. Gradient Descent depends on the first-order derivative of the loss function. The function calculates how the weights should be altered to reach the minimum loss. By backpropagation, the loss is passed from one layer to another in the model and its parameters, or weights, are modified based on the loss for the best result. At the start of the network, the weights are set to arbitrary small values which is equivalent to choosing a random point on the error surface. By calculating the local gradient of the error surface, backpropagation changes the weights to point in the direction of the steepest local gradient. Assuming a reasonably smooth error surface, weights should eventually converge to the global minimum [78]. The proposed model in this research uses the learning rate of 0.01 which is a hyperparameter that affects the speed of learning by changing the model to a degree each time its weights are updated. In addition, the Sigmoid function was used as an activation function to set all values in the input data to a value between 0 and 1.
3.3.3. Regression Trees (RT)
RT is an ML method commonly used to predict continuous values in regression problems. RTs are based on tree structures, which build regression models. RT builds a tree from numeric data. RTs are a variant of decision trees in which each leaf represents a numeric value. The predictor compares the input at each node and selects the most relevant node. The RT structure consists of two or more nodes with a number of branches at each node. An internal node has outgoing edges and leaves are other nodes. There is an internal node that divides the regression instance into two or more groups based on a specific function. A particular function in the training stage is considered in the values of the input variables [79]. RTs are generated by algorithms that generate decision trees based on instances. In the performed algorithm, the fitness function is minimized to determine the optimal RT. RT is developed incrementally as a dataset is broken down into ever-smaller subsets. As a result, a tree is created with decision nodes and leaf nodes. For each independent variable, the dataset is split at several split points. The performed algorithm calculates the difference between the expected value and the actual value regarding the pre-defined fitness function at every split point. Taking the variable with the lowest fitness function value as the split point, the split point errors are compared across the variables. Although an RT creates an accurate tree for input data, it is vulnerable to overfitting [80]. RT has different variables that affect the results. Different values have been assigned to these variables in this research to enable finding the best answer. Finding the best answer among all the tested models with different values for these variables is discussed in Section 4.
3.3.4. Random Forest (RF)
RF is a combination of several decision trees. For regression problems, the mean or average prediction of the individual trees is calculated as the answer. As such, RF usually outperforms the decision tree. RF begins by creating a bootstrap dataset, which consists of randomly selected samples from the original dataset in which repeated data are allowed. Then, it uses a random subset of variables and attributes to make a decision tree based on the bootstrap dataset. In other words, the kinds and number of nodes and the roots are chosen by chance. This process is repeated and new bootstrapped datasets and a large number of trees are built considering a subset of variables at each step. Random selection produces a wide variety of trees that makes RF more effective than RT. The value that has been repeated the most will be selected as the output after running the data through all of the trees in an RF. The data that are not selected in the bootstrap dataset are known together as the out-of-bag dataset, which can be used to test the model. As a result, overfitting can be prevented. Although RF increases bias in a single tree, it generally reduces the variance. This results in a higher accuracy because a more complex or flexible model will typically have a higher variance and bias due to overfitting. The model, however, predicts the target variable more accurately when averaged over several predictions. While an underfit or oversimplified model has a lower variance, it will likely be more biased since it lacks the tools to capture trends in the data [81]. Thus, the number of trees is an important variable in RF. RF is used in this study with a different number of trees for each gas to obtain the best answer. The other parameters are set according to the results for RT.
3.3.5. Performance Metrics
ML models can be used for classification or regression problems. In classification, the goal is to separate the data into multiple categorical groups through the discovery of a model or function. In regression, a function or model is developed to assist in separating the data into continuous real values, rather than using discrete classes or values [82]. Due to the continuous space of the problem in this research, regression models are used to predict the amount of each pollutant released. The accuracy of the models is determined by performance metrics that show how well a model can predict the results. For regression models, there are four most commonly used performance metrics: coefficient of determination (R2), root-mean-square error (RMSE), mean absolute error (MAE), and normalized root-mean-square error (NRMSE) as shown in Equations (1)–(4).
In these equations, is the actual value or ground truth, is the predicted value, is the mean, n is the number of examples used to determine the accuracy, and and are the minimum and maximum actual values in the set.
4. Results
Each learning algorithm includes several variables such as hyperparameters and model architecture, the choices of which have a great effect on the performance of the model. Therefore, in this section, the results of adjusting various variables are described and the performance of the models are compared for each algorithm to determine the best algorithm and architecture.
4.1. LR
As indicated before, LR is not expected to produce acceptable results and is tested to ensure a simple algorithm is not overlooked. To explain this poor performance, it is worth noting that all other learning methods that are tested in this study use nonlinear functions that better suit the nature of the data and relationships between the independent and dependent variables used in this research. Table 3 shows the subpar performance of LR according to all four performance measures.
4.2. NN
The results of the different NN architectures are shown in Table 4. In this table, the number of nodes in each hidden layer for each model are shown in the layer architecture column in square brackets (the number of nodes in the input layer is equal to the number of features used and the output layer has only one node). On average, the R2 value for the NN models to estimate the CO gas produced by the excavator is 0.805. In other words, the NN model indicates that 80.5% of the variation in the CO emission for this equipment can be explained by the data captured by the accelerometer and gyroscope sensors attached to the equipment. Table 1 also shows the other performance metrics identified in the previous section. Results indicate that more layers and more nodes did not improve the performance of the model by a significant margin. Therefore, model architecture with three hidden layers of 100, 90, and 80 nodes, which resulted in a slightly better performance than the others, was selected as the NN model to compare with the other learning algorithms.
The two other emission types investigated in this study are NOx and CO2. A similar process was adopted to examine the effect of model architecture on the prediction output. Results are presented in Table 5 and Table 6. As an example, for CO2 a visualized representation of the models is also provided in Figure 3.
As shown in Table 6 for the NOx, there is not much difference in the results of the models with 200 and 100 nodes in the first hidden layer and the metric factors converge after 100 neurons (the R2 of 0.65 is considered for further comparison). For the CO2 the best architecture is the same as the CO and the R2 is 0.78. The performance of the best model for all the pollutants is presented in Table 7 where the results of the NO and NO2 are included for comparison.
4.3. RT
In the RT, there are variables such as the maximum number of decision splits, the minimum number of leaf node observations (minLeafSize), and the minimum number of branch node observations (minParentSize) that control the depth of the tree and thus affect its performance. The maximum number of decision splits determines the maximum number of the nodes in each branch and the optimum result is obtained when this variable is equal to the number of training data minus one. The two variables that determine the accuracy of the model are minLeafSize and minParentSize.
Figure 4 shows the regression lines developed by adjusting these variables in the RT model. In Figure 4a minLeafSize (the minimum number of leaf node observations) is equal to 1 and minParentSize (the minimum number of branch node observations) is 5. With a fixed minParentSize, the increase in minLeafSize results in a lower R2 and a higher value of different errors (i.e., RMSE, MAE, and NRMSE) after minLeafSize is equal to two. Therefore, the optimum number for minLeafSize is two. No significant growth in accuracy was observed as the minParentSize was gradually increased to 10. Consequently, the optimum state for the decision tree is represented in Figure 4d with performance factors: R2 = 0.85, RMSE = 17.69, MAE = 6.78, NRMSE = 6.43. Also, the performance metrics for NOx and CO2 are presented in Table 8 and Table 9. Table 10 shows the best results obtained using RT by changing its configuration. The optimum setting for NO and NO2 is assumed to be the same as NOX.
4.4. RF
The most important feature in RF is the minimum samples at each leaf (minLeafSize) and the number of trees. In this study, minLeafSize was set according to the best answer in the decision tree for each pollutant. The accuracy is expected to increase as the number of trees goes up. Figure 5 plots R2 against the number of trees for the RF model to identify the convergence point from which this performance metric remains constant as the number of trees goes up.
Results of this analysis indicate that the performance factors converge after about 90 trees are employed. Although the optimum solution may result in different numbers of trees for each gas, a separately performed sensitive analysis reveals slight differences (less than 0.01%) in results after 90 trees. The 0.01% is considered an insignificant difference for the purpose of this research. Therefore, in order to stay consistent for all five emission types and provide a threshold that is both acceptable and computationally inexpensive, 100 trees is determined as the cutoff point. All performance metrics for the optimum number of trees are presented in Table 11.
5. Discussion
In this section, first the performance of the four algorithms developed in this study are compared using the metrics used as the benchmark. Following this comparison, the results of previous studies in the field of emission prediction are evaluated to contextualize the findings of this study within the literature.
5.1. Model Performance and Pollutants Predictability
Table 12 shows R2 for training and testing datasets. As shown, the accuracy for trained and test data is close. While it is expected to see higher training performance in all cases, the results of the RT model do not show this behavior which is due to overfitting, as discussed previously. In general, training performance is not a reliable evaluation metric and testing performance should be taken into consideration when deciding about deploying a model.
An analysis of the calculated R2 metrics indicates that RF outperformed the three other algorithms used in this research in predicting the emission levels for all three pollutants, which were 0.94, 0.91, and 0.94 for CO, NOx, CO2, respectively. Therefore, it can be concluded that with an appropriate number of trees, RF can be a superb model when the equipment emission levels are explained by inertial sensor data. NN ranks third and shows a lower performance compared with RF and RT. Table 13 shows the R2 values for the best models in each case.
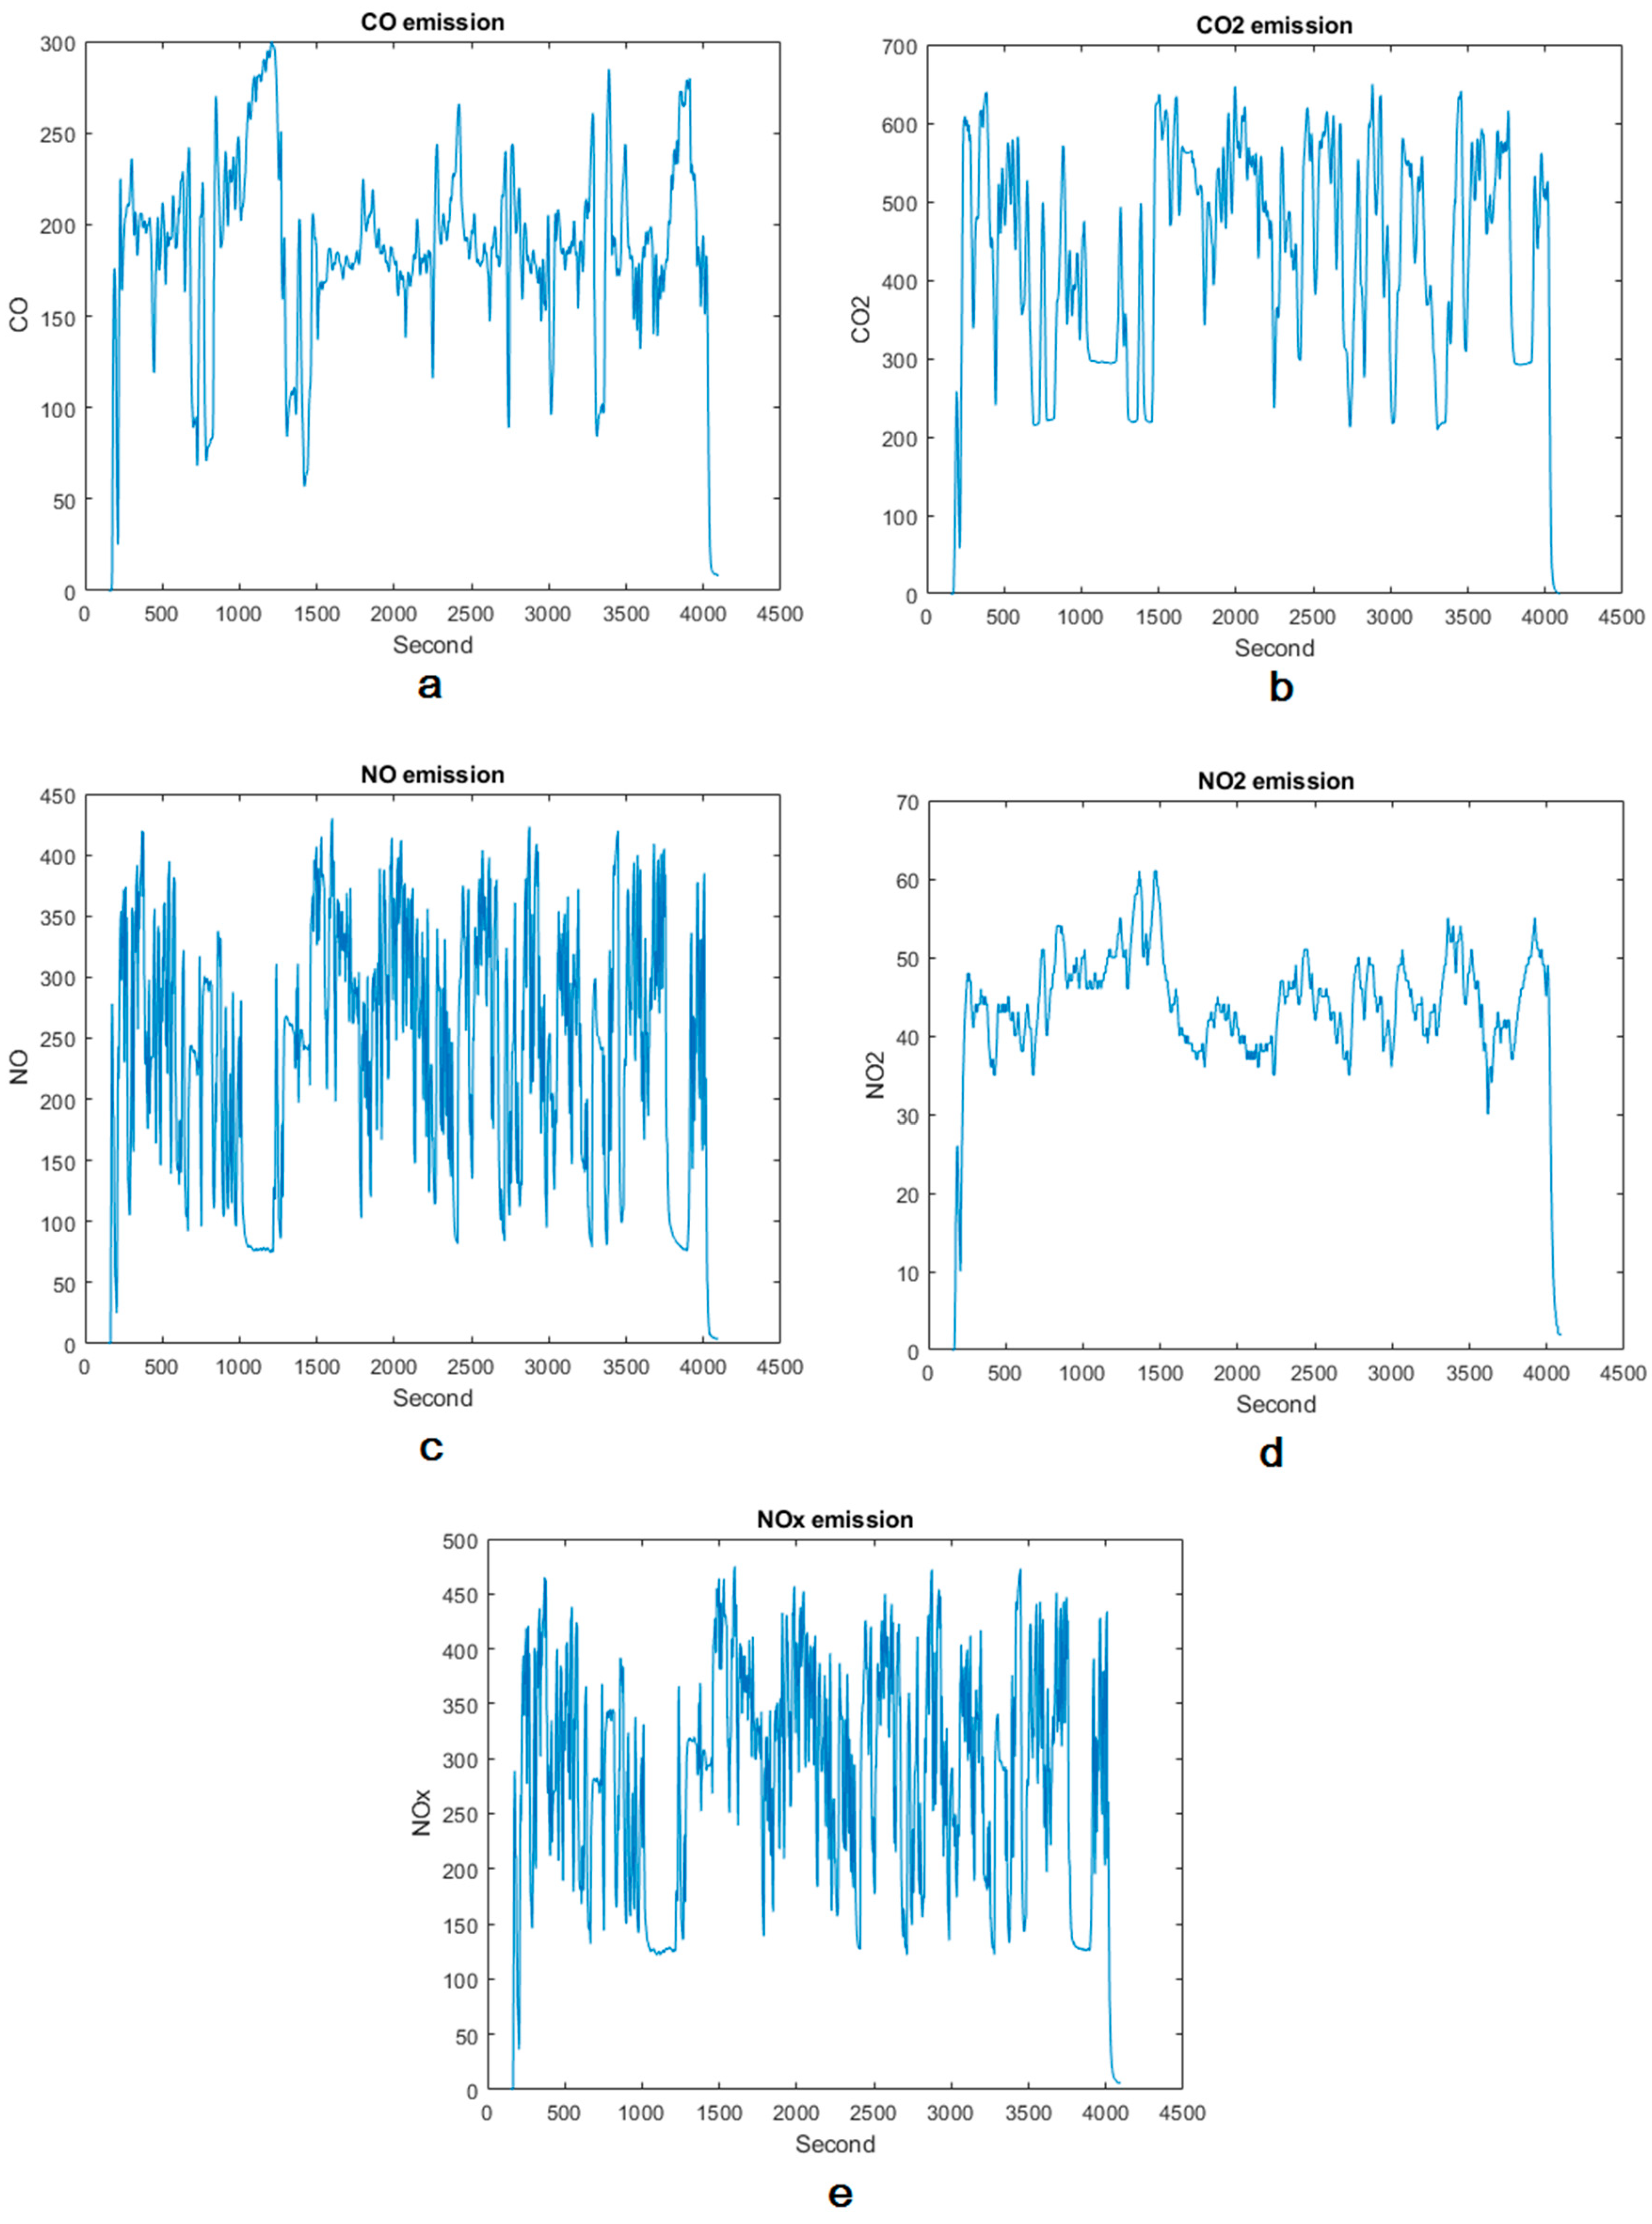
According to Table 11, the RF model performed similarly in the case of CO and CO2 and resulted in a very high R2 value. A close examination of NOX prediction (which followed these two pollutants very closely) indicates that the R2 metric for NO2 was, in fact, equal to that of CO and CO2 whereas this value for NO was significantly lower in the case of all four algorithms (see Table 3, Table 7, Table 10 and Table 11). Plotting the collected raw emission data against time (Figure 6) reveals that NO exhibits a different pattern in terms of the number and range of fluctuations per time unit compared with other pollutants. While this different pattern does not explain the lower performance, it does indicate the difference that exists in the nature of the collected data that may call for different learning methodologies.
5.2. Evaluation of the Results in the Context of Previous Studies
Several studies have aimed at forecasting the emission of combustion engines in transportation vehicles. As stated earlier, most of the previous studies in this area of research targeted on-road vehicles. The present paper describes the first study with the objective of predicting emissions of the construction equipment only through the evaluation of vehicle movement and without collecting data related to factors such as engine parameters, weather conditions, speed of the equipment, or fuel consumption. Therefore, the purpose of outlining the results of similar work in the literature in this section is not a point-to-point comparison between the methodologies or numerical values of the results between this research and those studies. Rather, it is to contextualize the outcome of this research against similar work and compare the results of predicting emissions for heavy equipment versus on-road vehicles. The coefficient of determination or R2 is used as a comparison metric since it is a common metric in most of the previous similar studies.
Xu et al. (2020) developed a gradient boosting (i.e., XGBoost) model to predict CO2 and PM2.5 where they examined a variety of variables on trip-level emissions including meteorology, trip characteristics (such as time of day), driving characteristics (such as idling frequency), and driver characteristics (such as experience in driving). They obtained an R2 value of 0.84 [83]. A complete ensemble empirical mode decomposition with adaptive noise (CEEMDAN) and long short-term memory (LSTM) neural network has been proposed for estimating transient NOX emissions by Yu et al. (2021). They used engine attribute variables such as vehicle speed, engine speed, torque percentage, instantaneous fuel consumption, and accelerator pedal opening as the input of the CEEMDAN-LSTM model where they obtained an R2 of 0.98 [36]. Barati and Shen (2016) developed a multivariate linear regression (MLR) where engine attributes, operational parameters, environmental factors, and fuel type were the factors used as the input of the model for on-road construction equipment emissions. The R2 values for the MLR method were 0.96, 0.89, 0.93 and 0.90 for CO2, CO, NOx, HC, respectively [49]. Table 14 summarizes these results along with the final R2 values obtained in this study for comparison.
As shown in Table 14, previous work demonstrated that a combination of CEEMDAN and deep recurrent networks (i.e., CEEMDAN-LSTM) would result in a slightly higher accuracy compared with when CEEMDAN and XGBoost are used together for NOX prediction. However, both these methods applied to on-road vehicles outperform the RF model developed in this study, which was applied to off-road equipment. Also, MLR performance is higher than RF for CO2 detection and lower than RF for CO detection considering the fact that MLR was also applied to on-road vehicles versus the RF in this study which was applied to off-road equipment.
6. Conclusions
The objective of this study was to examine the performance of an IoT-ML integrated framework that includes collecting and transmitting multi-modal data to predict construction equipment emissions. In particular, this study examined the relationship between the movement of construction equipment chassis and their emission rates. As such, it laid the foundation for managing the level of equipment emissions in a simple yet effective way. A case study of an excavator involved in a real-world operation is outlined where the amount of equipment emissions was predicted using accelerometer and gyroscope sensors installed in its cabin and on its arm. No information with regards to the engine attributes such as load and size, environmental factors such as temperature, air pressure, slope, fuel type, and payload was collected. Four supervised learning algorithms were employed to predict emissions from the construction equipment. Results show that random forest by the coefficient of determination (R2) equal to 0.94, 0.91, and 0.94 for CO, NOX, and CO2, respectively, outperformed the other algorithms tested in this research.
As a first attempt to estimate heavy equipment emissions using inertial sensors, this study can inspire future research in this area. Nevertheless, there are a few limitations that can be addressed in future research. First, while this methodology is applicable to any kind of equipment, this specific work focused on one type of equipment (i.e., Caterpillar 305D CR excavator), and the trained model was used to predict emissions for the same machine. Thus, future research can expand the scope of this work by including more equipment types and subject-independent training and testing. This can be best achieved by collecting large amounts of data, something which requires access to a variety of projects and companies that, at the time of conducting data collection for this research, was not a possibility. Second, this research deploys traditional shallow learning algorithms, whereas recent advancements in the area of deep learning show that such a method could prove valuable to enhance the results of similar studies. Computational models with multiple layers of processing can learn abstractions of data through deep learning. In future studies, deep learning algorithms such as LSTM or convolutional neural network (CNN) can replace traditional methods. Third, even in the realm of traditional ML methods, the performance of other supervised algorithms such as Naive Bayes, Perceptron, relevance vector machine (RVM), and support vector machine (SVM) can be assessed. Fourth, a more comprehensive research project can focus on several pollutants including but not limited to the ones explored in this study.
Author Contributions
Conceptualization, R.A.; methodology, R.A. and F.S.; software, F.S.; validation, F.S.; formal analysis, F.S.; investigation, F.S., R.A.; resources, R.A.; data curation, F.S., R.A.; writing—original draft preparation, F.S.; writing—review and editing, R.A.; visualization, F.S., R.A.; supervision, R.A.; project administration, R.A.; funding acquisition, R.A. All authors have read and agreed to the published version of the manuscript.
Funding
This research was funded by California State University Transportation Consortium (CSUTC) grant number 1852.
Institutional Review Board Statement
Not applicable.
Informed Consent Statement
Not applicable.
Data Availability Statement
Restrictions apply to the availability of these data. Data was obtained from a Kiewit Corporation project site and are available from the authors with the permission of Kiewit Corporation.
Acknowledgments
The authors gratefully acknowledge CSUTC for their financial support. The authors would also like to thank Kiewit Corporation for allowing access to their job sites for data collection. Any opinions, findings, conclusions, and recommendations expressed in this paper are those of the authors and do not necessarily represent those of the CSUTC or Kiewit Corporation.
Conflicts of Interest
The authors declare no conflict of interest.
References
- Al-Ghussain, L. Global warming: Review on driving forces and mitigation. Environ. Prog. Sustain. Energy 2019, 38, 13–21. [Google Scholar] [CrossRef] [Green Version]
- Abanda, F.; Tah, J.; Cheung, F. Mathematical modelling of embodied energy, greenhouse gases, waste, time–cost parameters of building projects: A review. Build. Environ. 2013, 59, 23–37. [Google Scholar] [CrossRef]
- Mishra, A.K.; Singh, V.P.; Jain, S.K. Impact of global warming and climate change on social development. J. Comp. Soc. Welf. 2010, 26, 239–260. [Google Scholar] [CrossRef]
- Cline, W.R. The impact of global warming of agriculture: Comment. Am. Econ. Rev. 1996, 86, 1309–1311. [Google Scholar]
- Keatinge, W.; Donaldson, G. The impact of global warming on health and mortality. South. Med. J. 2004, 97, 1093–1100. [Google Scholar] [CrossRef]
- Ring, M.J.; Lindner, D.; Cross, E.F.; Schlesinger, M.E. Causes of the global warming observed since the 19th century. Atmos. Clim. Sci. 2012, 2, 401. [Google Scholar] [CrossRef] [Green Version]
- Huang, L.; Krigsvoll, G.; Johansen, F.; Liu, Y.; Zhang, X. Carbon emission of global construction sector. Renew. Sustain. Energy Rev. 2018, 81, 1906–1916. [Google Scholar] [CrossRef] [Green Version]
- González, M.J.; Navarro, J.G. Assessment of the decrease of CO2 emissions in the construction field through the selection of materials: Practical case study of three houses of low environmental impact. Build. Environ. 2006, 41, 902–909. [Google Scholar] [CrossRef]
- Teng, Y.; Li, K.; Pan, W.; Ng, T. Reducing building life cycle carbon emissions through prefabrication: Evidence from and gaps in empirical studies. Build. Environ. 2018, 132, 125–136. [Google Scholar] [CrossRef]
- Li, Z.T.; Akhavian, R. Carbon dioxide emission evaluation in construction operations using DES: A case study of carwash construction. In Proceedings of the 2017 Winter Simulation Conference (WSC), Las Vegas, NV, USA, 3–6 December 2017; pp. 2384–2393. [Google Scholar]
- Yan, H.; Shen, Q.; Fan, L.C.; Wang, Y.; Zhang, L. Greenhouse gas emissions in building construction: A case study of One Peking in Hong Kong. Build. Environ. 2010, 45, 949–955. [Google Scholar] [CrossRef] [Green Version]
- US EPA. User’s Guide for the Final NONROAD2005 Model; EPA420; U.S. Environmental Protection Agency: Washington, DC, USA, 2005.
- Heidari, B.; Marr, L.C. Real-time emissions from construction equipment compared with model predictions. J. Air Waste Manag. Assoc. 2015, 65, 115–125. [Google Scholar] [CrossRef] [PubMed] [Green Version]
- Frey, H.C.; Zhang, K.; Rouphail, N.M. Fuel use and emissions comparisons for alternative routes, time of day, road grade, and vehicles based on in-use measurements. Environ. Sci. Technol. 2008, 42, 2483–2489. [Google Scholar] [CrossRef] [PubMed]
- O’Driscoll, R.; ApSimon, H.M.; Oxley, T.; Molden, N.; Stettler, M.E.J.; Thiyagarajah, A. A Portable Emissions Measurement System (PEMS) study of NOx and primary NO2 emissions from Euro 6 diesel passenger cars and comparison with COPERT emission factors. Atmos. Environ. 2016, 145, 81–91. [Google Scholar] [CrossRef]
- Ceylan, İ.; Erkaymaz, O.; Gedik, E.; Gürel, A.E. The prediction of photovoltaic module temperature with artificial neural networks. Case Stud. Therm. Eng. 2014, 3, 11–20. [Google Scholar] [CrossRef] [Green Version]
- O’Driscoll, R.; Stettler, M.E.J.; Molden, N.; Oxley, T.; ApSimon, H.M. Real world CO2 and NOx emissions from 149 Euro 5 and 6 diesel, gasoline and hybrid passenger cars. Sci. Total Environ. 2018, 621, 282–290. [Google Scholar] [CrossRef]
- Sentoff, K.M.; Aultman-Hall, L.; Holmén, B.A. Implications of driving style and road grade for accurate vehicle activity data and emissions estimates. Transp. Res. Part D Transp. Environ. 2015, 35, 175–188. [Google Scholar] [CrossRef]
- Ben-Chaim, M.; Shmerling, E.; Kuperman, A. Analytic modeling of vehicle fuel consumption. Energies 2013, 6, 117–127. [Google Scholar] [CrossRef]
- de Lucas, A.; Durán, A.; Carmona, M.; Lapuerta, M. Modeling diesel particulate emissions with neural networks. Fuel 2001, 80, 539–548. [Google Scholar] [CrossRef]
- Alonso, J.M.; Alvarruiz, F.; Desantes, J.M.; Hernández, L.; Hernández, V.; Molto, G. Combining neural networks and genetic algorithms to predict and reduce diesel engine emissions. IEEE Trans. Evol. Comput. 2007, 11, 46–55. [Google Scholar] [CrossRef]
- Kesgin, U. Genetic algorithm and artificial neural network for engine optimisation of efficiency and NOx emission. Fuel 2004, 83, 885–895. [Google Scholar] [CrossRef]
- Obodeh, O.; Ajuwa, C. Evaluation of artificial neural network performance in predicting diesel engine NOx emissions. Eur. J. Sci. Res. 2009, 33, 642–653. [Google Scholar]
- Atkinson, C.M.; Long, T.W.; Hanzevack, E.L. Virtual sensing: A neural network-based intelligent performance and emissions prediction system for on-board diagnostics and engine control. Prog. Technol. 1998, 73, 2–4. [Google Scholar]
- Johri, R.; Filipi, Z. Neuro-fuzzy model tree approach to virtual sensing of transient diesel soot and NOx emissions. Int. J. Engine Res. 2014, 15, 918–927. [Google Scholar] [CrossRef]
- Traver, M.L.; Atkinson, R.J.; Atkinson, C.M. Neural network-based diesel engine emissions prediction using in-cylinder combustion pressure. SAE Trans. 1999, 108, 1166–1180. [Google Scholar]
- Si, M.; Tarnoczi, T.J.; Wiens, B.M.; Du, K. Development of Predictive Emissions Monitoring System Using Open Source Machine Learning Library—Keras: A Case Study on a Cogeneration Unit. IEEE Access 2019, 7, 113463–113475. [Google Scholar] [CrossRef]
- Roth, M.; Lawrence, P. A cost-effective alternative to continuous emission monitoring systems. Environ. Sci. Eng. Mag. 2010, 5, 6–57. [Google Scholar]
- Si, M.; Du, K. Development of a predictive emissions model using a gradient boosting machine learning method. Environ. Technol. Innov. 2020, 20, 101028. [Google Scholar] [CrossRef]
- Ciarlo, G.; Angelosante, D.; Guerriero, M.; Saldarini, G.; Bonavita, N. Enhanced PEMS Performance and Regulatory Compliance through Machine Learning. Sustain. Environ. 2018, 3, 329. [Google Scholar] [CrossRef]
- Lee, J.; Kwon, S.; Kim, H.; Keel, J.; Yoon, T.; Lee, J. Machine Learning Applied to the NOx Prediction of Diesel Vehicle under Real Driving Cycle. Appl. Sci. 2021, 11, 3758. [Google Scholar] [CrossRef]
- Wen, H.T.; Li, M.A.; Lu, J.H. The regression model of NOx emission in a real driving automobile. In Proceedings of the 2019 International Symposium on Intelligent Signal Processing and Communication Systems (ISPACS), Taipei, Taiwan, 3–6 December 2019; pp. 1–2. [Google Scholar] [CrossRef]
- Khurana, S.; Saxena, S.; Jain, S.; Dixit, A. Predictive modeling of engine emissions using machine learning: A review. Mater. Today Proc. 2021, 38, 280–284. [Google Scholar] [CrossRef]
- Fei, X.; Fang, Y.; Ling, Q. Discrimination of Excessive Exhaust Emissions of Vehicles based on Catboost Algorithm. In Proceedings of the 2020 Chinese Control and Decision Conference (CCDC), Hefei, China, 22–24 August 2020; pp. 4396–4401. [Google Scholar]
- Le Cornec, C.M.A.; Molden, N.; van Reeuwijk, M.; Stettler, M.E.J. Modelling of instantaneous emissions from diesel vehicles with a special focus on NOx: Insights from machine learning techniques. Sci. Total Environ. 2020, 737, 139625. [Google Scholar] [CrossRef] [PubMed]
- Yu, Y.; Wang, Y.; Li, J.; Fu, M.; Shah, A.N.; He, C. A Novel Deep Learning Approach to Predict the Instantaneous NOₓ Emissions From Diesel Engine. IEEE Access 2021, 9, 11002–11013. [Google Scholar] [CrossRef]
- May, D.; Fisher, L.; Tennis, C.; Parrish, T. Simple, portable, on-vehicle testing (SPOT) final report. Contract 2002, 86-C, 1–106. [Google Scholar]
- Gautam, M.; Carder, D.; Clark, N.; Lyons, D.W. Testing for Exhaust Emissions of Diesel Powered Off-Road Engines; Department of Mechanical and Aerospace Engineering: Morgantown, WV, USA, 2002. [Google Scholar]
- Vojtisek-Lom, M. Real-World Exhaust Emissions from Construction Equipment at the World Trade Center No. 7 Site; Clean Air Technologies International Inc.: Buffalo, NY, USA, 2003. [Google Scholar]
- United States Environmental Protection Agency. Quality Assurance Guidance Document-Model Quality Assurance Project Plan for the PM Ambient Air; United States Environmental Protection Agency: Washington, DC, USA, 2001.
- May, D.F. On-Vehicle Emissions Testing System; California Environmental Protection Agency: Sacramento, CA, USA, 2003.
- Abolhasani, S.; Frey, H.C.; Kim, K.; Rasdorf, W.; Lewis, P.; Pang, S.-H. Real-world in-use activity, fuel use, and emissions for nonroad construction vehicles: A case study for excavators. J. Air Waste Manag. Assoc. 2008, 58, 1033–1046. [Google Scholar] [CrossRef] [Green Version]
- Frey, H.C.; Rasdorf, W.; Kim, K.; Pang, S.-H.; Lewis, P. Comparison of real-world emissions of B20 biodiesel versus petroleum diesel for selected nonroad vehicles and engine tiers. Transp. Res. Rec. 2008, 2058, 33–42. [Google Scholar] [CrossRef]
- Frey, H.C.; Kim, K.; Pang, S.-H.; Rasdorf, W.J.; Lewis, P. Characterization of real-world activity, fuel use, and emissions for selected motor graders fueled with petroleum diesel and B20 biodiesel. J. Air Waste Manag. Assoc. 2008, 58, 1274–1287. [Google Scholar] [CrossRef]
- Lewis, P.; Rasdorf, W.; Frey, H.C.; Pang, S.-H.; Kim, K. Requirements and incentives for reducing construction vehicle emissions and comparison of nonroad diesel engine emissions data sources. J. Constr. Eng. Manag. 2009, 135, 341–351. [Google Scholar] [CrossRef]
- Lewis, P.; Frey, H.C.; Rasdorf, W. Development and use of emissions inventories for construction vehicles. Transp. Res. Rec. 2009, 2123, 46–53. [Google Scholar] [CrossRef]
- Frey, H.C.; Bammi, S. Probabilistic nonroad mobile source emission factors. J. Environ. Eng. 2003, 129, 162–168. [Google Scholar] [CrossRef]
- Frey, H.C.; Rasdorf, W.; Lewis, P. Comprehensive field study of fuel use and emissions of nonroad diesel construction equipment. Transp. Res. Rec. 2010, 2158, 69–76. [Google Scholar] [CrossRef]
- Barati, K.; Shen, X. Operational level emissions modelling of on-road construction equipment through field data analysis. Autom. Constr. 2016, 72, 338–346. [Google Scholar] [CrossRef]
- Somboonpisan, J.; Limsawasd, C. Environmental Weight for Bid Evaluation to Promote Sustainability in Highway Construction Projects. J. Constr. Eng. Manag. 2021, 147, 04021013. [Google Scholar] [CrossRef]
- Li, Q.; Stankovic, J.A.; Hanson, M.A.; Barth, A.T.; Lach, J.; Zhou, G. Accurate, fast fall detection using gyroscopes and accelerometer-derived posture information. In Proceedings of the 2009 Sixth International Workshop on Wearable and Implantable Body Sensor Networks, Berkeley, CA, USA, 3–5 June 2009; pp. 138–143. [Google Scholar]
- Van Laerhoven, K.; Cakmakci, O. What shall we teach our pants? In Proceedings of the Digest of Papers—Fourth International Symposium on Wearable Computers, Atlanta, GA, USA, 18–21 October 2000; pp. 77–83. [Google Scholar]
- Kochersberger, G.; McConnell, E.; Kuchibhatla, M.N.; Pieper, C. The reliability, validity, and stability of a measure of physical activity in the elderly. Arch. Phys. Med. Rehabil. 1996, 77, 793–795. [Google Scholar] [CrossRef]
- Alt, E. Medical Interventional Device with Accelerometer for Providing Cardiac Therapeutic Functions. U.S. Patent 5,472,453, 5 December 1995. [Google Scholar]
- Altun, K.; Barshan, B. Human activity recognition using inertial/magnetic sensor units. In Proceedings of the International Workshop on Human Behavior Understanding, Istanbul, Turkey, 22 August 2010; pp. 38–51. [Google Scholar]
- Casale, P.; Pujol, O.; Radeva, P. Human activity recognition from accelerometer data using a wearable device. In Proceedings of the Iberian Conference on Pattern Recognition and Image Analysis, Las Palmas de Gran Canaria, Spain, 8–10 June 2011; pp. 289–296. [Google Scholar]
- Bao, L.; Intille, S.S. Activity recognition from user-annotated acceleration data. In Proceedings of the International Conference on Pervasive Computing, Vienna, Austria, 21–23 April 2004; pp. 1–17. [Google Scholar]
- Ravi, N.; Dandekar, N.; Mysore, P.; Littman, M.L. Activity recognition from accelerometer data. In Proceedings of the AAAI, Pittsburgh, PA, USA, 9–13 July 2005; pp. 1541–1546. [Google Scholar]
- Namal, S.; Senanayake, A.; Chong, V.; Chong, J.; Sirisinghe, G.R. Analysis of soccer actions using wireless accelerometers. In Proceedings of the 2006 4th IEEE International Conference on Industrial Informatics, Singapore, 16–18 August 2006; pp. 664–669. [Google Scholar]
- Kwapisz, J.R.; Weiss, G.M.; Moore, S.A. Activity recognition using cell phone accelerometers. ACM SigKDD Explor. Newsl. 2011, 12, 74–82. [Google Scholar] [CrossRef]
- Motoi, K.; Tanaka, S.; Nogawa, M.; Yamakoshi, K.-I. Evaluation of a new sensor system for ambulatory monitoring of human posture and walking speed using accelerometers and gyroscope. In Proceedings of the SICE 2003 Annual Conference, Fukui, Japan, 4–6 August 2003; (IEEE Cat. No. 03TH8734). pp. 1232–1235. [Google Scholar]
- Lukowicz, P.; Ward, J.A.; Junker, H.; Stäger, M.; Tröster, G.; Atrash, A.; Starner, T. Recognizing workshop activity using body worn microphones and accelerometers. In Proceedings of the International Conference on Pervasive Computing, Vienna, Austria, 21–23 April 2004; pp. 18–32. [Google Scholar]
- Sherafat, B.; Ahn, C.R.; Akhavian, R.; Behzadan, A.H.; Golparvar-Fard, M.; Kim, H.; Lee, Y.-C.; Rashidi, A.; Azar, E.R. Automated methods for activity recognition of construction workers and equipment: State-of-the-art review. J. Constr. Eng. Manag. 2020, 146, 03120002. [Google Scholar] [CrossRef]
- Akhavian, R.; Brito, L.; Behzadan, A. Integrated mobile sensor-based activity recognition of construction equipment and human crews. In Proceedings of the 2015 Conference on Autonomous and Robotic Construction of Infrastructure, Ames, IA, USA, 2–3 June 2015; pp. 1–20. [Google Scholar]
- Johnson, D.A.; Trivedi, M.M. Driving style recognition using a smartphone as a sensor platform. In Proceedings of the 2011 14th International IEEE Conference on Intelligent Transportation Systems (ITSC), Washington, DC, USA, 5–7 October 2011; pp. 1609–1615. [Google Scholar]
- Akhavian, R.; Behzadan, A.H. Simulation-based evaluation of fuel consumption in heavy construction projects by monitoring equipment idle times. In Proceedings of the 2013 Winter Simulations Conference (WSC), Washington, DC, USA, 8–11 December 2013; pp. 3098–3108. [Google Scholar]
- Akhavian, R.; Behzadan, A.H. Smartphone-based construction workers’ activity recognition and classification. Autom. Constr. 2016, 71, 198–209. [Google Scholar] [CrossRef]
- Akhavian, R.; Behzadan, A.H. Construction equipment activity recognition for simulation input modeling using mobile sensors and machine learning classifiers. Adv. Eng. Inform. 2015, 29, 867–877. [Google Scholar] [CrossRef]
- Slaton, T.; Hernandez, C.; Akhavian, R. Construction activity recognition with convolutional recurrent networks. Autom. Constr. 2020, 113, 103138. [Google Scholar] [CrossRef]
- Noraxon. myoMOTION Software Module. Available online: https://www.noraxon.com/our-products/myomotion/ (accessed on 25 July 2021).
- Instruments—E-Instruments Emissions Tools. Available online: https://www.e-inst.com/?gclid=CjwKCAjwxo6IBhBKEiwAXSYBszYQ7plZKlx1MgJvvrslD2L4V5KTJctU2fnGPdT9KXbD6lTga8OP-RoC3B4QAvD_BwE (accessed on 25 July 2021).
- Inc, A.T. How Do Electrochemical Sensors Work? Available online: https://www.analyticaltechnology.com/analyticaltechnology/gas-water-monitors/blog.aspx?ID=1327&Title=How%20Do%20Electrochemical%20Sensors%20Work (accessed on 20 August 2021).
- CO2meter. How Does an NDIR CO2 Sensor Work? Available online: https://www.co2meter.com/blogs/news/6010192-how-does-an-ndir-co2-sensor-work (accessed on 20 August 2021).
- Maksoud, E.A.A.; Barakat, S.; Elmogy, M. Medical images analysis based on multilabel classification. In Machine Learning in Bio-Signal Analysis and Diagnostic Imaging; Elsevier: Amsterdam, The Netherlands, 2019; pp. 209–245. [Google Scholar]
- Shoaib, M.; Bosch, S.; Incel, O.D.; Scholten, H.; Havinga, P.J. A survey of online activity recognition using mobile phones. Sensors 2015, 15, 2059–2085. [Google Scholar] [CrossRef]
- Caruana, R.; Niculescu-Mizil, A. An empirical comparison of supervised learning algorithms. In Proceedings of the 23rd International Conference on Machine Learning, Pittsburgh, PA, USA, 25–29 June 2006; pp. 161–168. [Google Scholar]
- Uyanık, G.K.; Güler, N. A study on multiple linear regression analysis. Procedia-Soc. Behav. Sci. 2013, 106, 234–240. [Google Scholar] [CrossRef] [Green Version]
- Gardner, M.W.; Dorling, S. Artificial neural networks (the multilayer perceptron)—A review of applications in the atmospheric sciences. Atmos. Environ. 1998, 32, 2627–2636. [Google Scholar] [CrossRef]
- Loh, W.Y. Classification and regression trees. Wiley Interdiscip. Rev. Data Min. Knowl. Discov. 2011, 1, 14–23. [Google Scholar] [CrossRef]
- Pekel, E. Estimation of soil moisture using decision tree regression. Theor. Appl. Climatol. 2020, 139, 1111–1119. [Google Scholar] [CrossRef]
- Hastie, T.; Tibshirani, R.; Friedman, J. Random forests. In The Elements of Statistical Learning; Springer: Berlin/Heidelberg, Germany, 2009; pp. 587–604. [Google Scholar]
- Kuhn, M. Caret: Classification and regression training. Astrophys. Source Code Libr. 2015, ascl:1505.1003. [Google Scholar]
- Xu, J.; Saleh, M.; Hatzopoulou, M. A machine learning approach capturing the effects of driving behaviour and driver characteristics on trip-level emissions. Atmos. Environ. 2020, 224, 117311. [Google Scholar] [CrossRef]
Figure 1.
Training and implementation of the ML model. Box (1) shows the training process and box (2) illustrates the implementation.
Figure 1.
Training and implementation of the ML model. Box (1) shows the training process and box (2) illustrates the implementation.
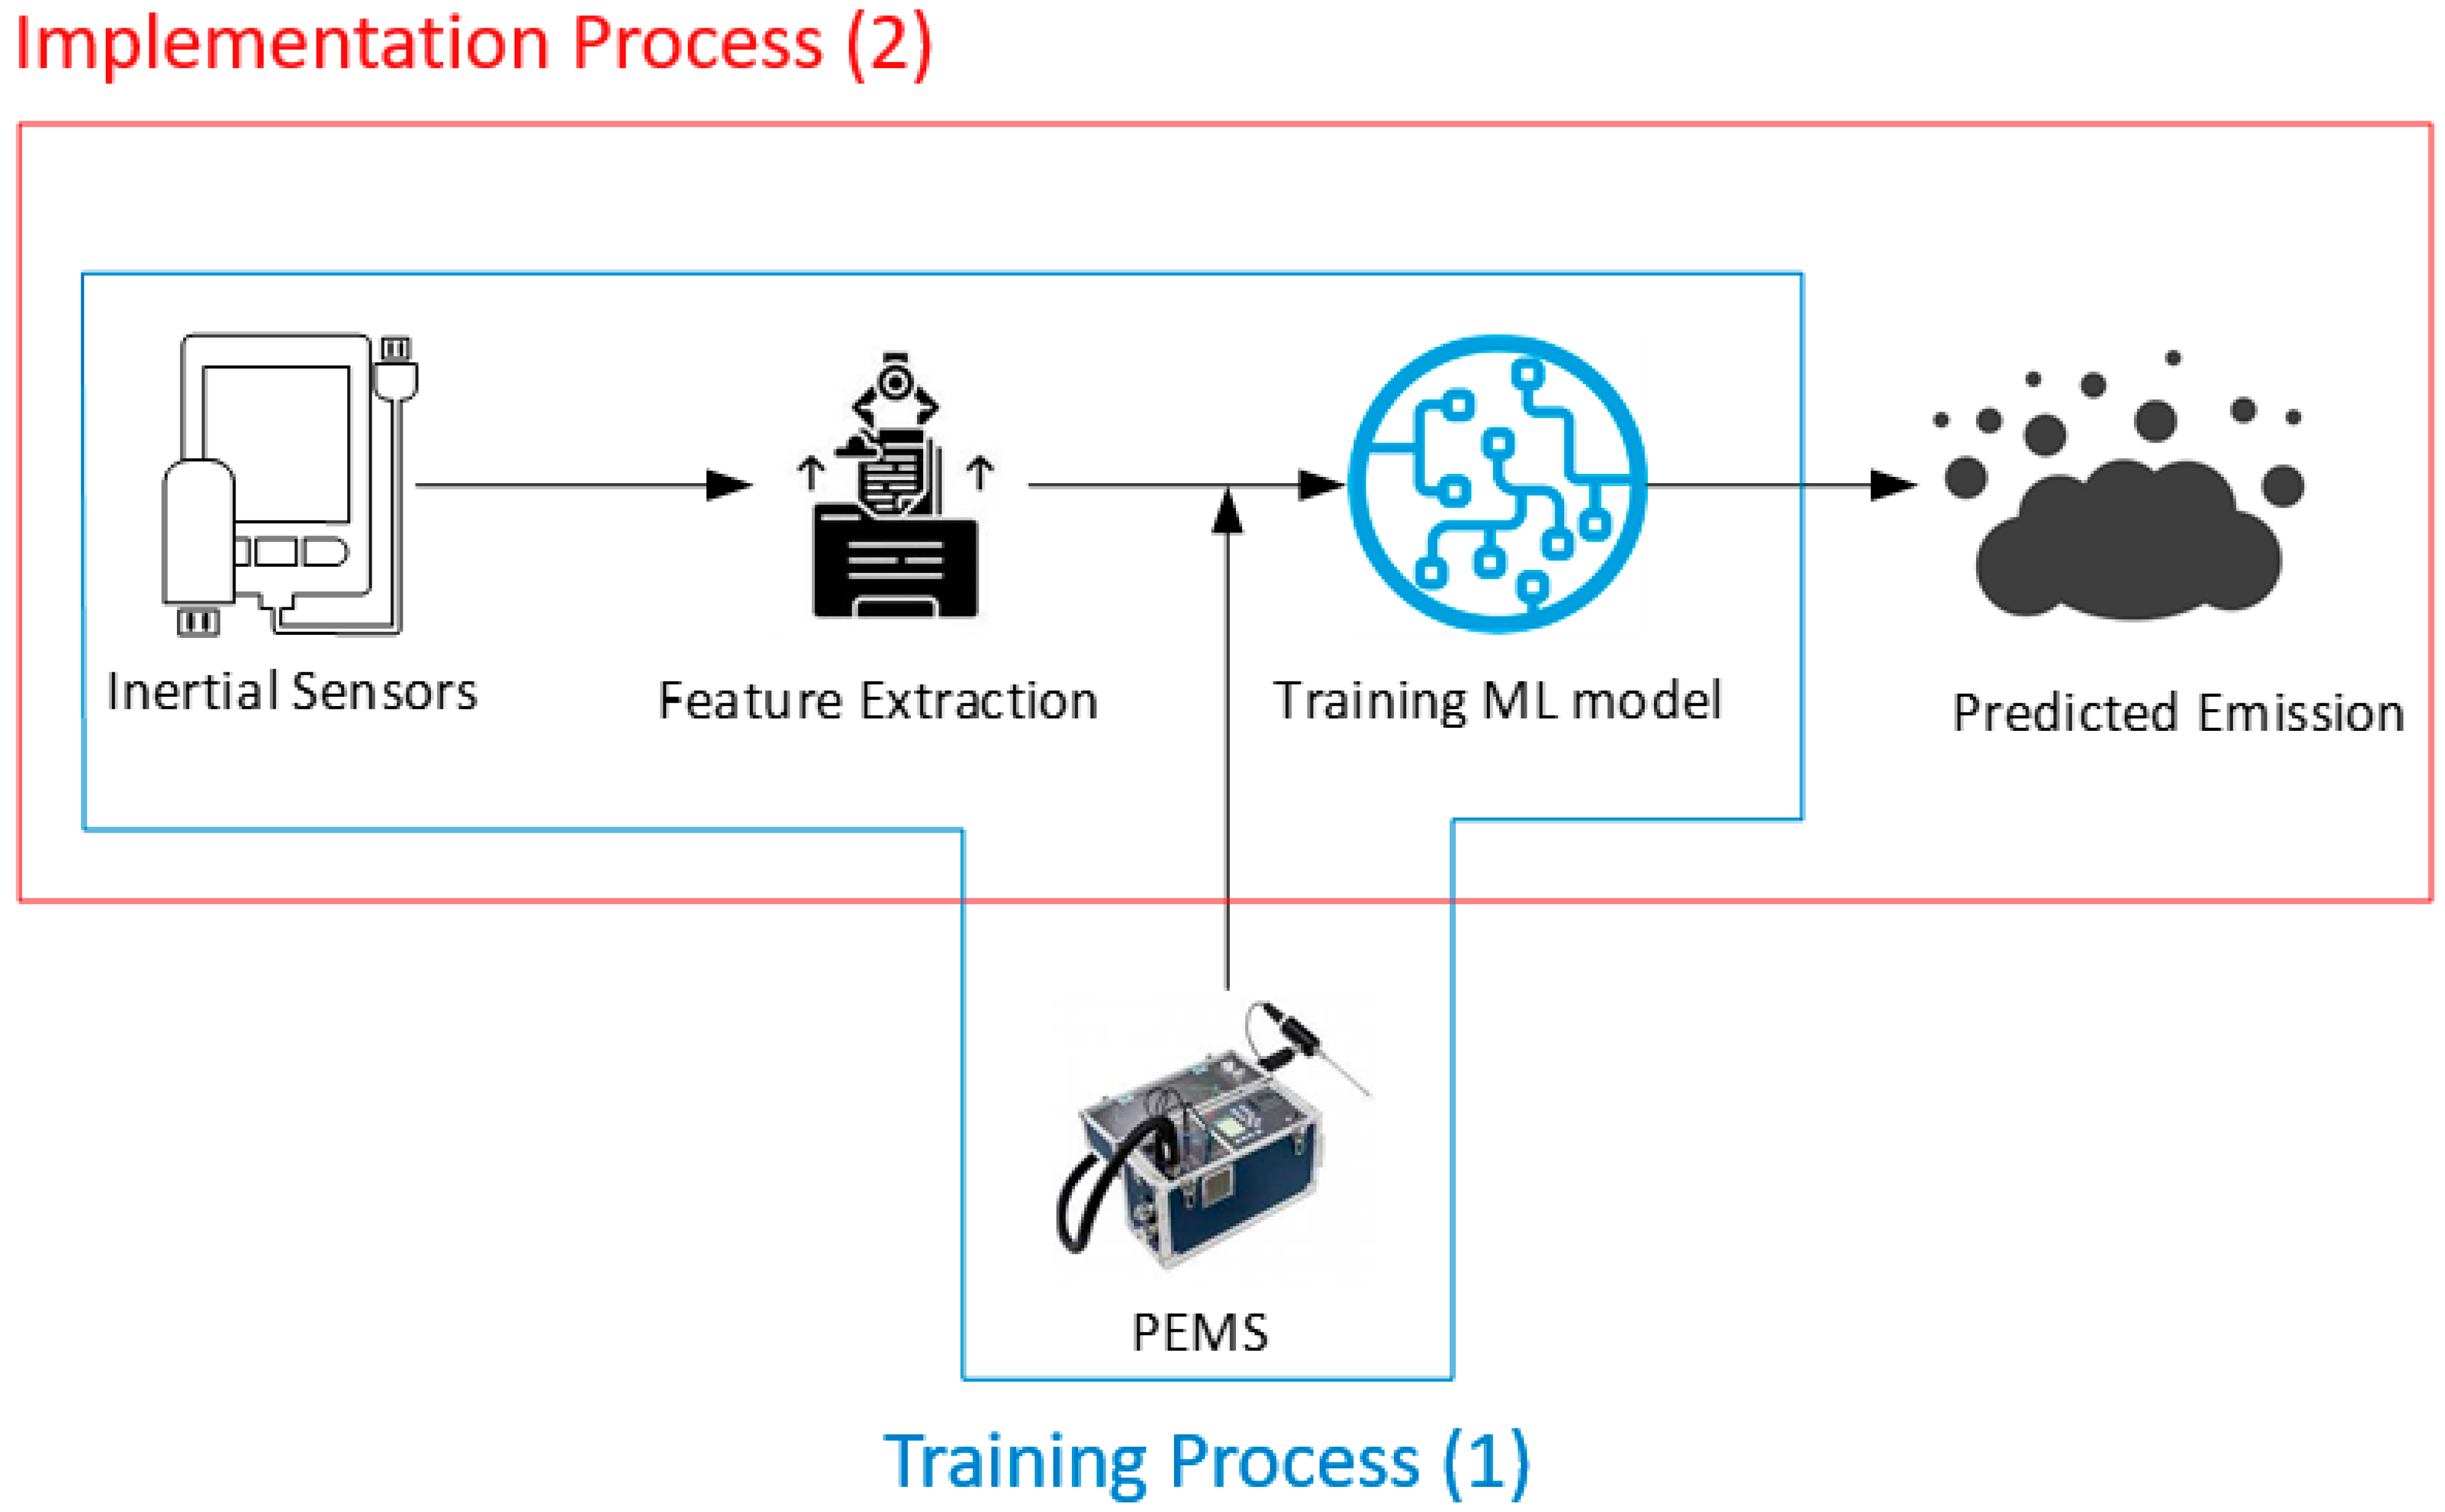
Figure 2.
Data collection setup with IoT sensors.
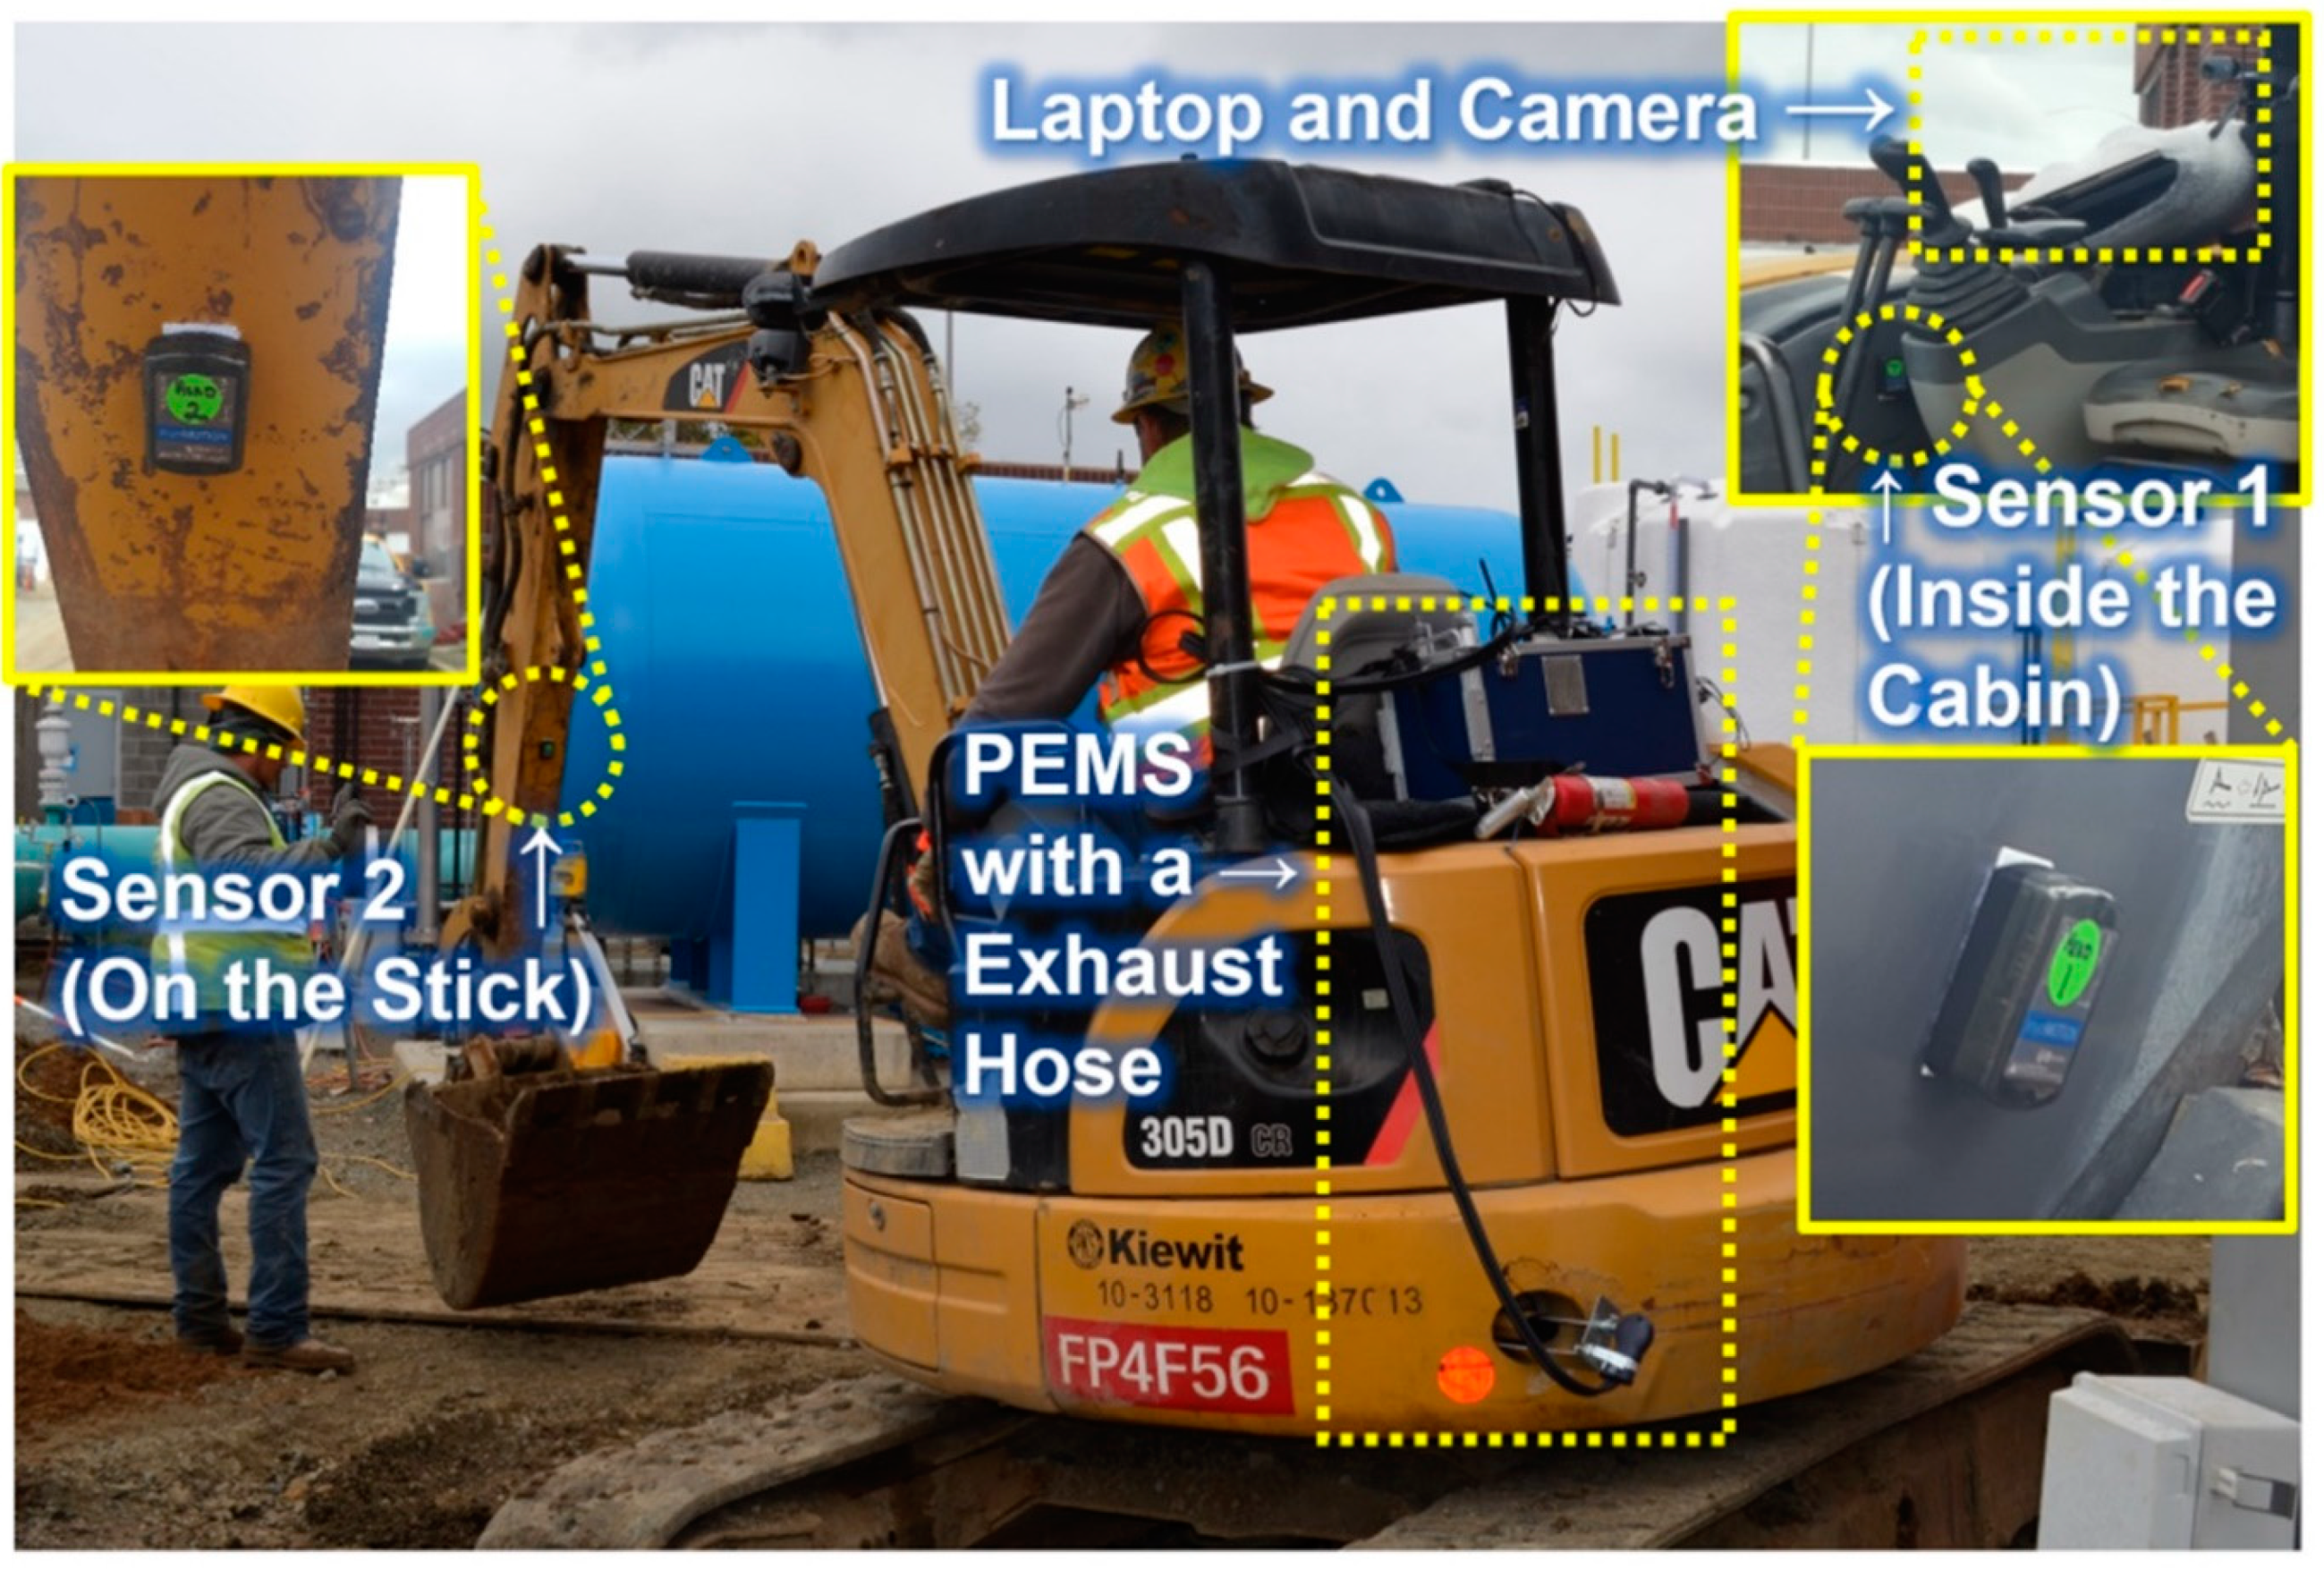
Figure 3.
The CO2 regression lines are trained by the neural network. (a) NN with two layers, 40 and 30 neurons. (b) NN with three layers, 40, 30, and 20 neurons. (c) NN with three layers, 100, 90, and 80 neurons. (d) NN with three layers, 200, 190, and 180 neurons.
Figure 3.
The CO2 regression lines are trained by the neural network. (a) NN with two layers, 40 and 30 neurons. (b) NN with three layers, 40, 30, and 20 neurons. (c) NN with three layers, 100, 90, and 80 neurons. (d) NN with three layers, 200, 190, and 180 neurons.
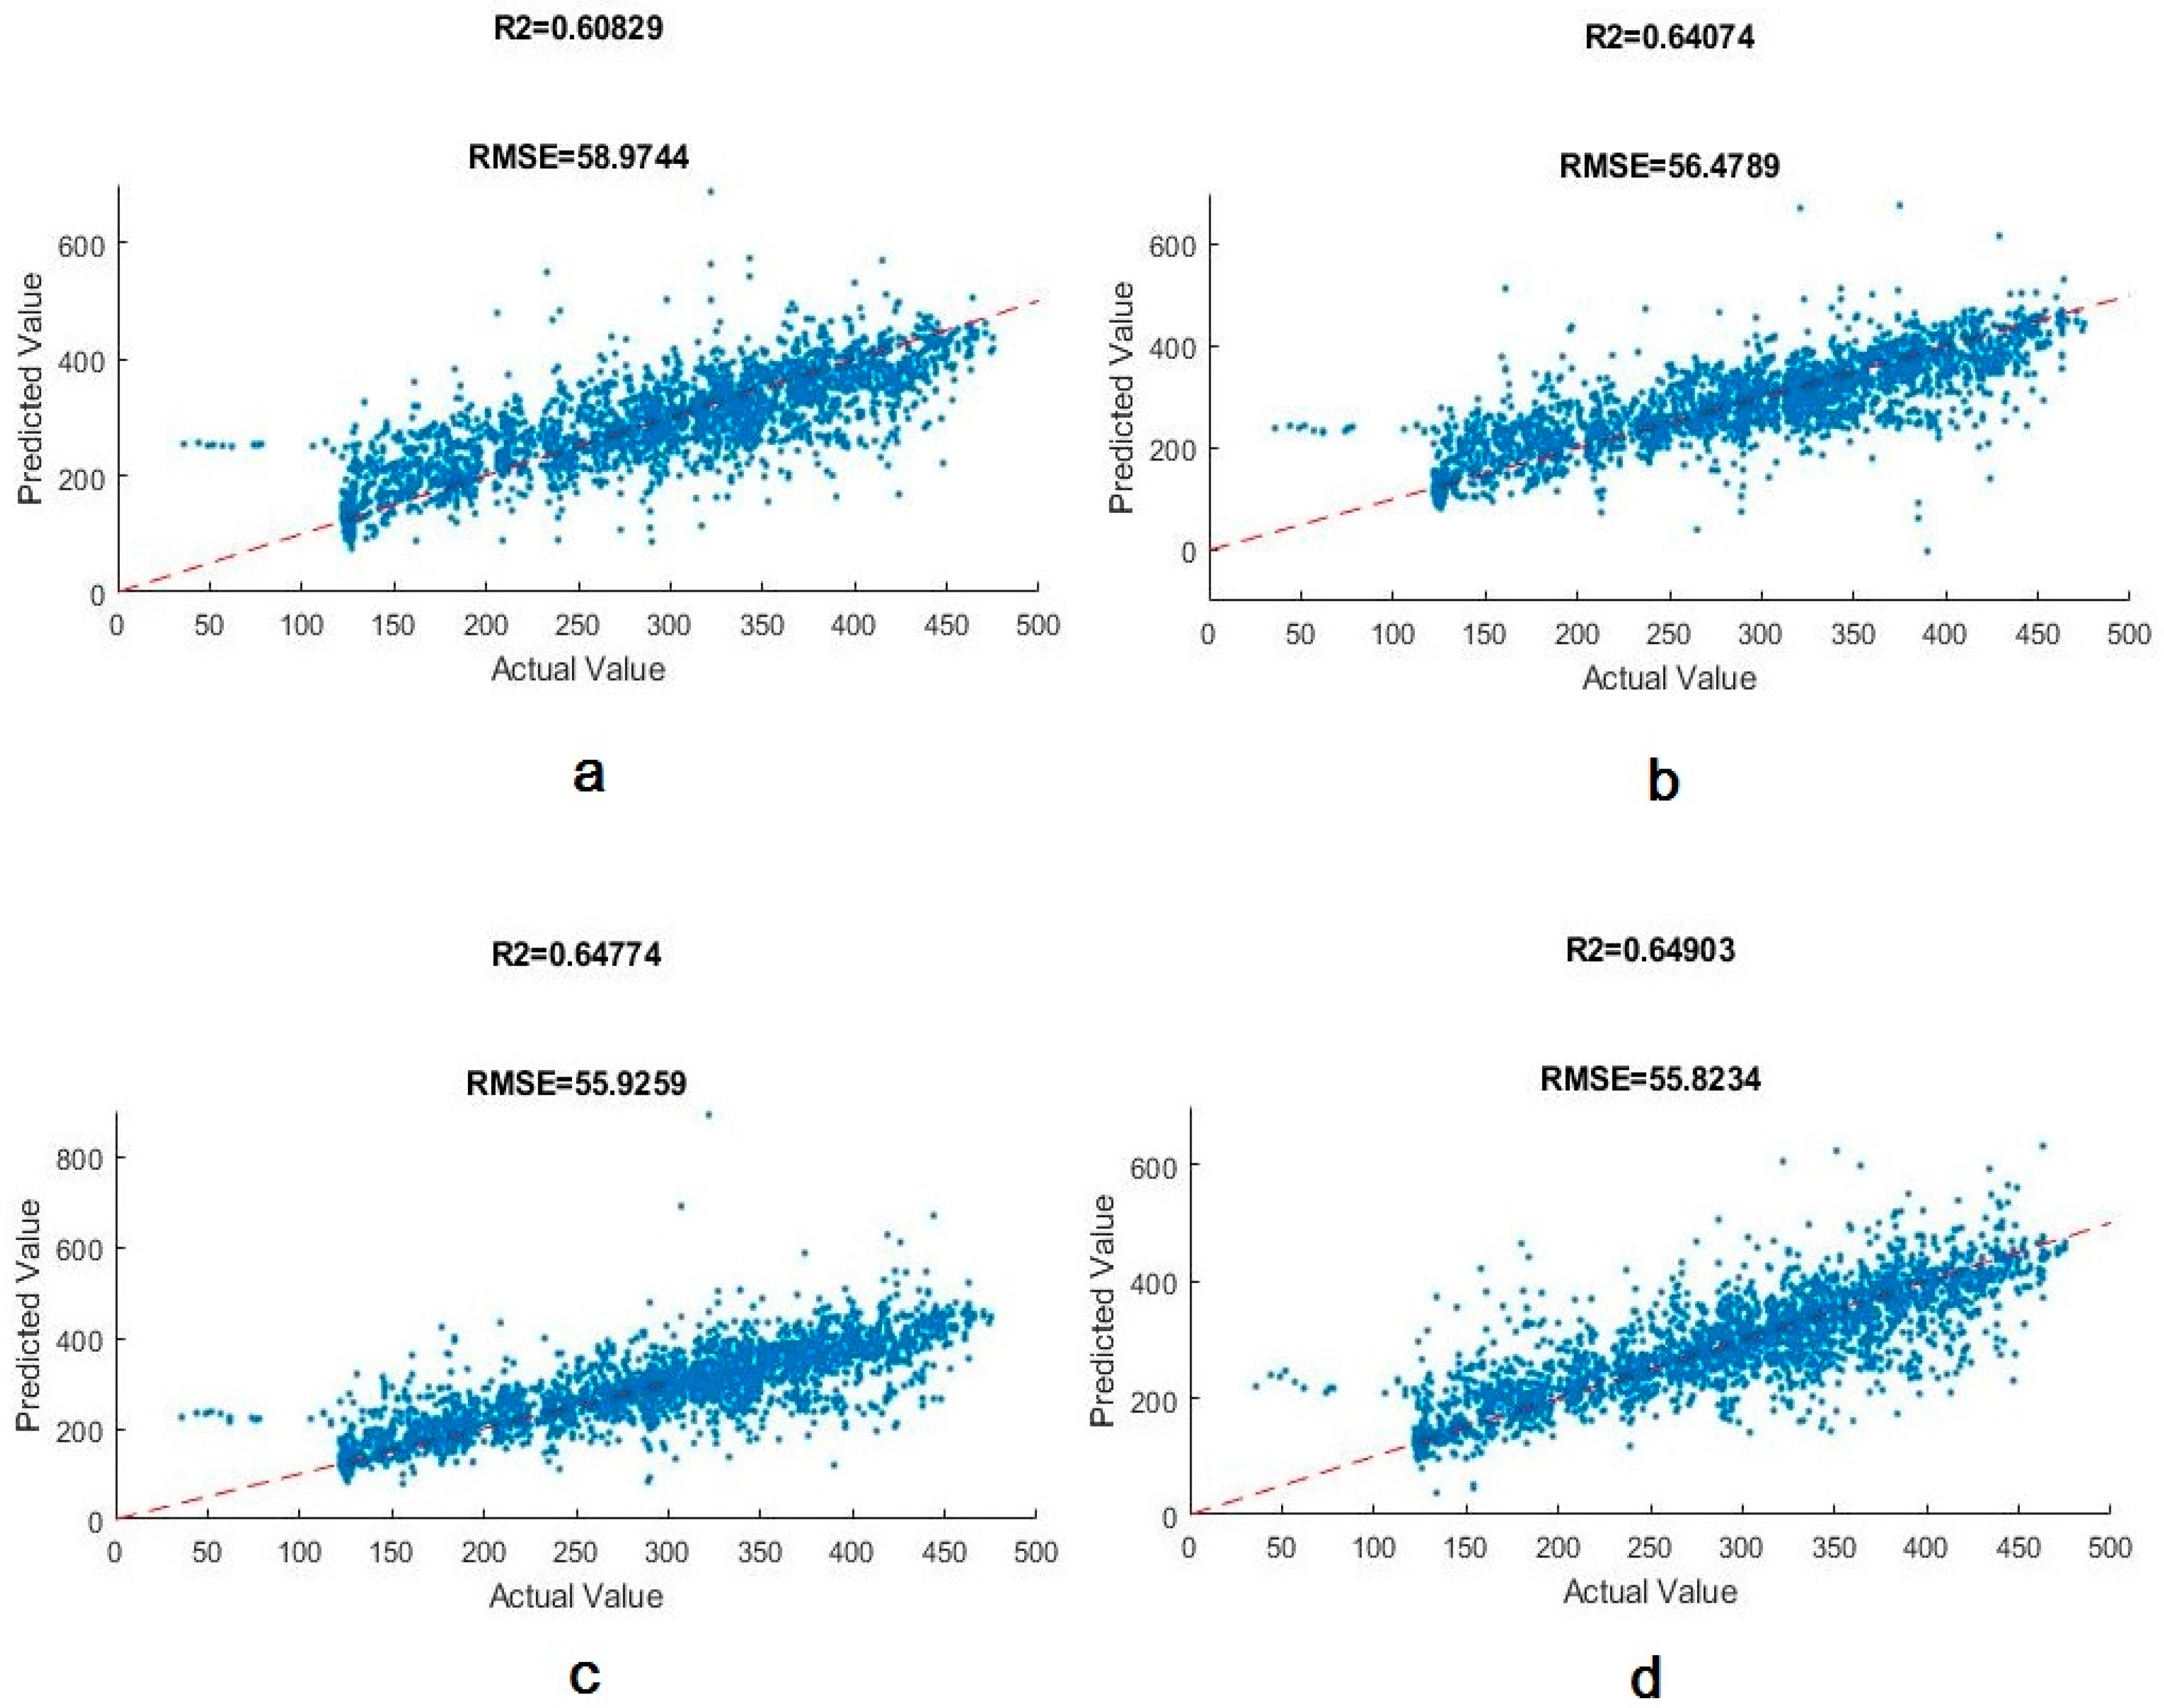
Figure 4.
The CO regression lines analyzed by decision tree algorithm. (a) MinLeafSize=1, MinParentSize = 5. (b) MinLeafSize = 1, MinParentSize = 10. (c) MinLeafSize = 2, MinParentSize = 5. (d) MinLeafSize = 2, MinParentSize = 10. (e) MinLeafSize = 5, MinParentSize = 5. (f) MinLeafSize = 3, MinParentSize = 10.

Figure 5.
Amount of coefficient of determination in different trees for the random forest.
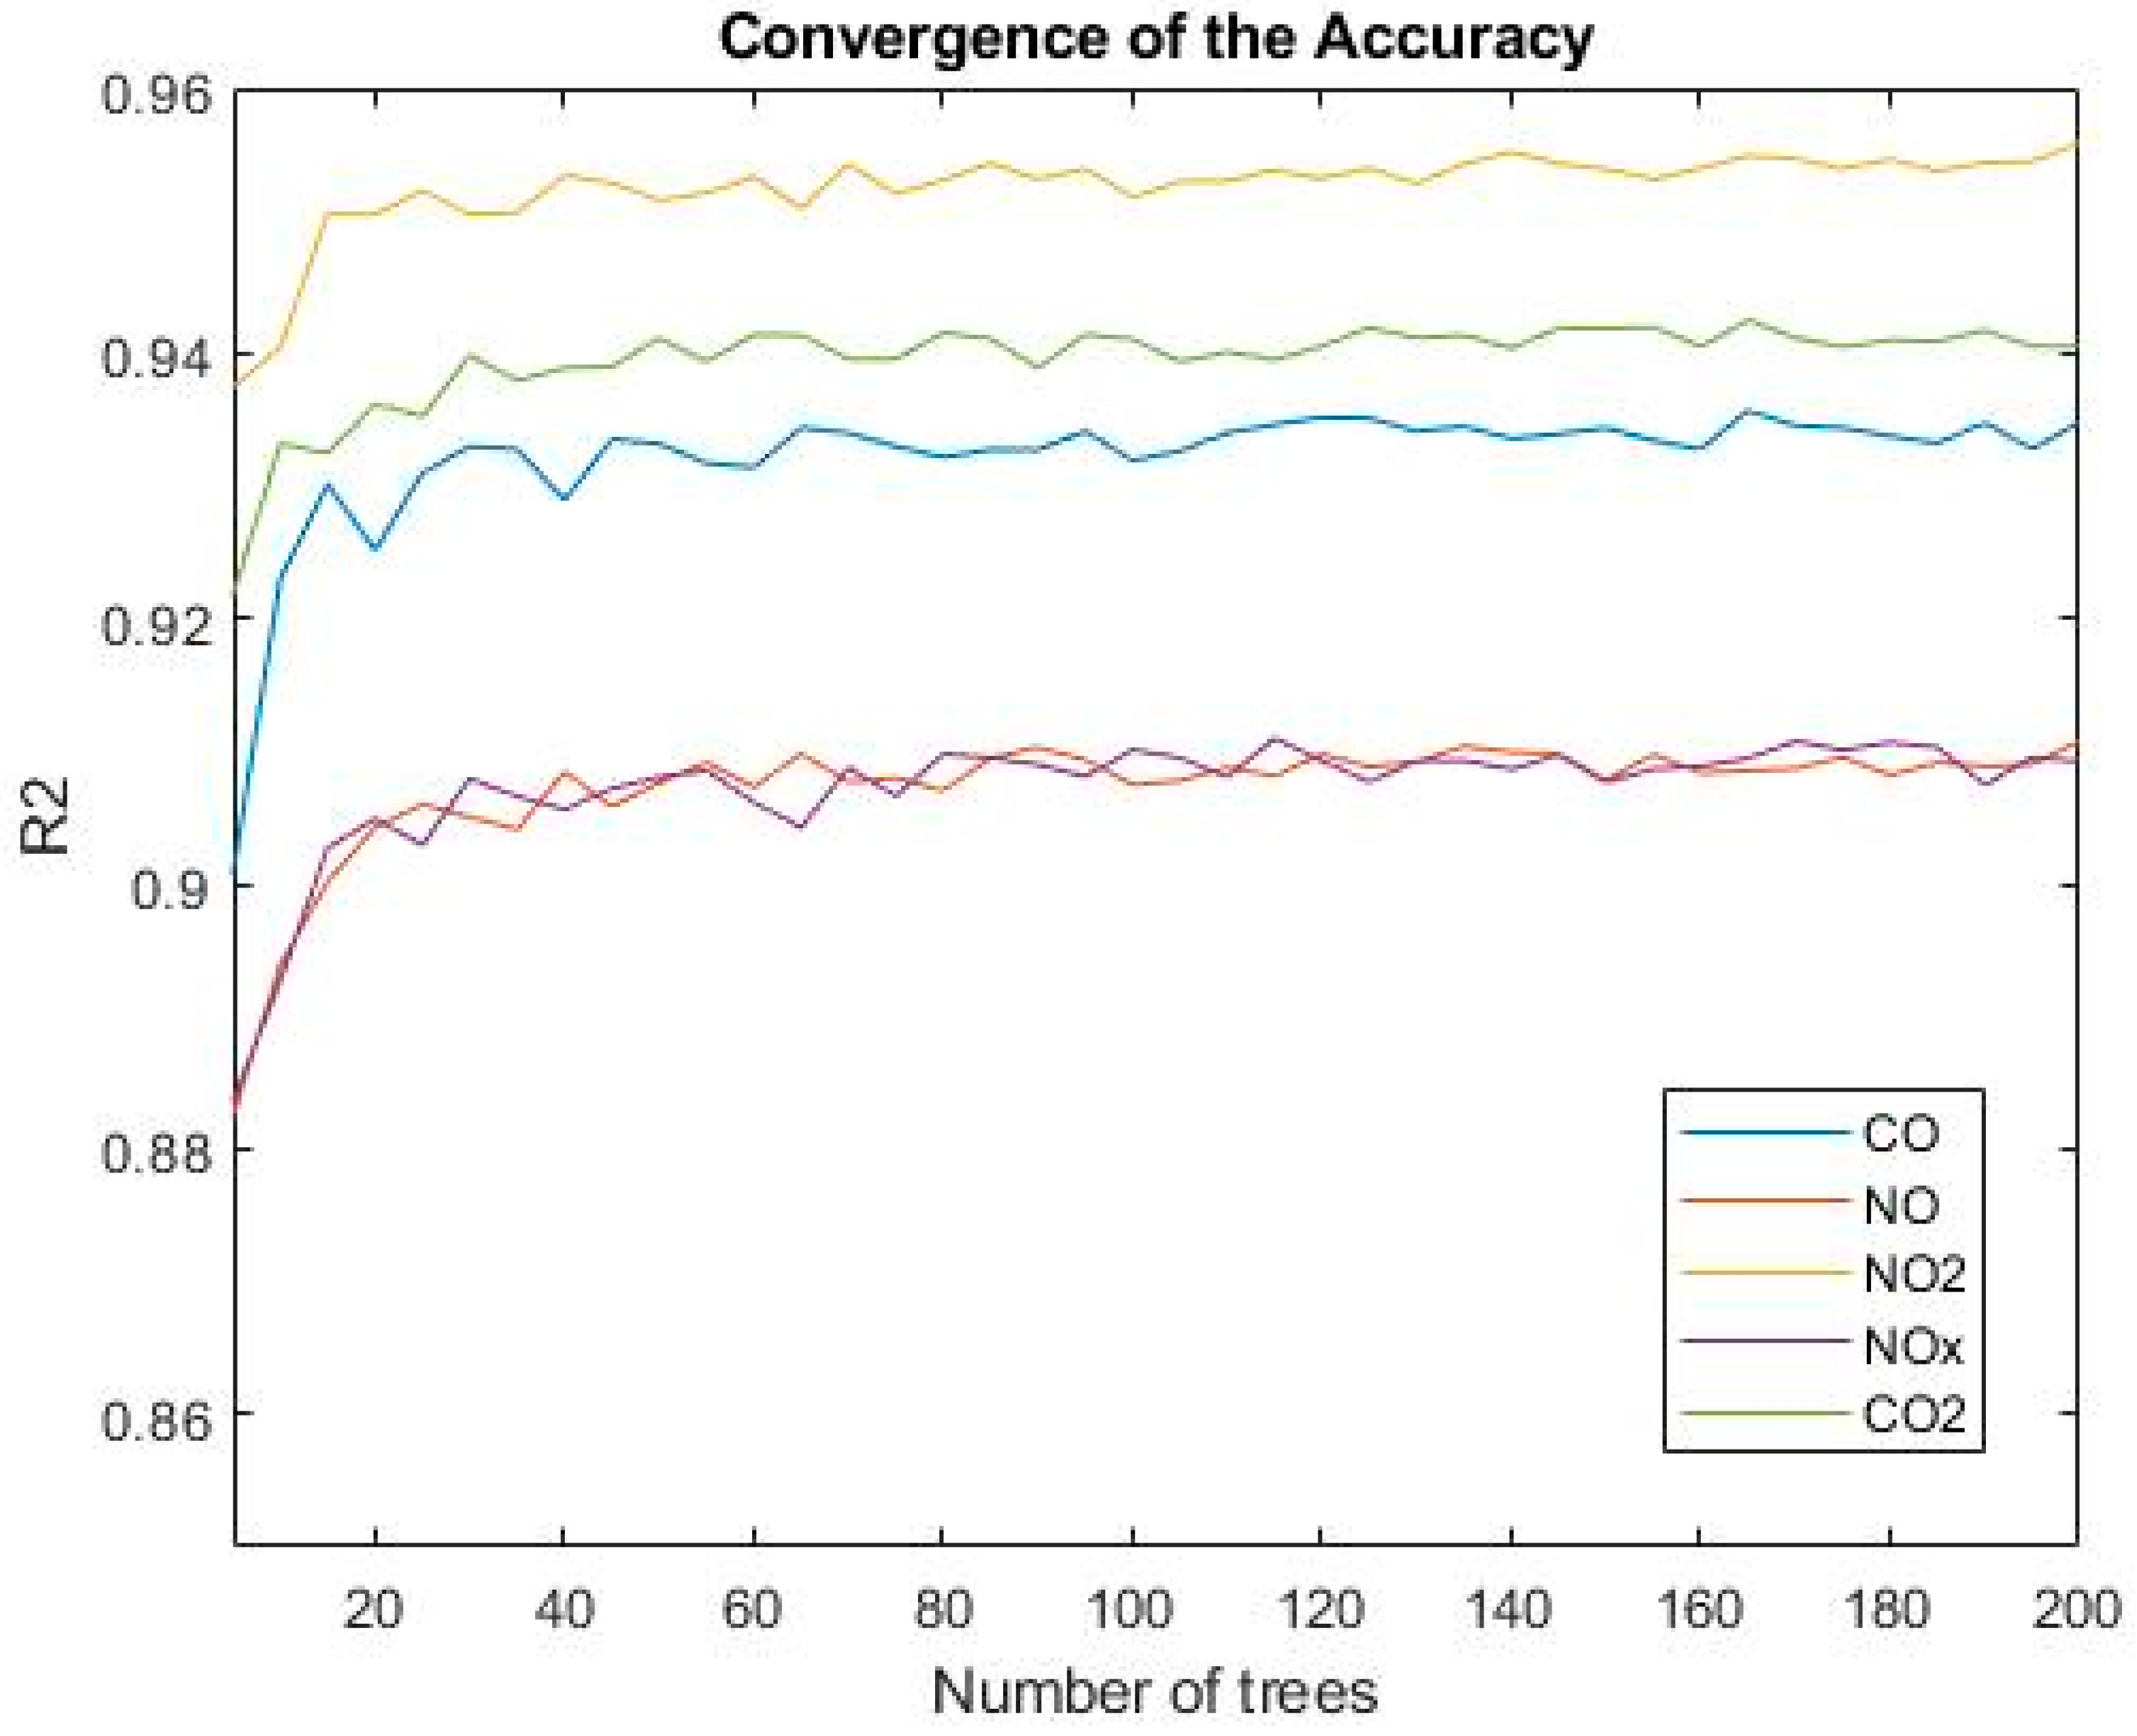
Figure 6.
Amount of the emissions in ppm for (a) CO. (b) CO2. (c) NO. (d) NO2. (e) NOx.

Table 1.
Specifications of the accelerometer and gyroscope sensors used in the experiment.
| Channel | Up to 16 Sensors |
|---|---|
| Static accuracy | ±0.4˚ |
| Dynamic accuracy | ±1.2˚ |
| Sampling frequency | 100 Hz |
| Data output | Joint angles, acceleration, rotation quaternions |
| Maximum output rate | 400 Hz |
| Orientation angel frequency | 0.25 degree (pitch/roll); 1.25 degrees (heading) |
| Anatomical angel frequency | +/− 1.0 degree (static); +/− 2.0 degrees (dynamic) |
| Angular velocity (Gyroscope) | +/− 7000 degrees/sec; Internal Sampling Rate 1600 Hz |
| Acceleration (Accelerometer) | +/− 200 g; Internal Sampling Rate 1600 Hz |
| Motion sensor dimensions | 1.75″ L × 1.3″ W × 0.48″ H (4.45 cm L × 3.3 cm W × 1.22 cm H) |
| Weight | Less than 0.67 oz (19 g) |
Table 2.
PEMS specifications.
| Parameter | Sensor | Range | Resolution | Accuracy |
|---|---|---|---|---|
| NO | Electrochemical | 0–5000 ppm | 1 ppm | ±5 ppm < 100 ppm ±5% rdg for >100 ppm |
| NO2 | Electrochemical | 0–1000 ppm | 1 ppm | ±5 ppm < 100 ppm ±5% rdg for >100 ppm |
| CO2 | NDIR | 0–50.0% | 0.1% | ±3% rdg < 8% ±5% rdg < 50% |
| O2 | Electrochemical | 0–25% | 0.1% | ±0.2% vol |
| SO2 | Electrochemical | 0–5000 ppm | 1 ppm | ±5 ppm < 100 ppm ±5% rdg for >100 ppm |
| CH4 | NDIR | 0–50,000 ppm | 1 ppm | ±50 ppm < 2500 ppm ±2% >2500 ppm |
| H2S | Electrochemical | 0–500.0 ppm | 0.1 ppm | ±5 ppm <125 ppm ±4% rdg for <500 ppm |
| Tair | Pt100 | −4 to 248 °F −20 to 120 °C | 0.1 °F 0.1 °C | ±1 °F ±1 °C |
| Tgas | Tc K | −4 to 2280 °F −20 to 1250 °C | 0.1 °F 0.1 °C | ±2 °F ±2 °C |
Table 3.
The performance metrics were analyzed by linear regression.
| Emitted Gas | R2 | RMSE | MAE | NRMSE |
|---|---|---|---|---|
| CO | 0.06 | 45.12 | 32.12 | 16.40 |
| NO | 0.19 | 84.42 | 71.39 | 20.84 |
| NO2 | 0.33 | 4.92 | 3.65 | 9.85 |
| NOX | 0.18 | 85.35 | 72.26 | 19.44 |
| CO2 | 0.22 | 113.98 | 92.25 | 18.65 |
Table 4.
Performance metrics related to NN analysis for CO emission.
| Layer Architecture | R2 | RMSE | MAE | NRMSE |
|---|---|---|---|---|
| [40 30] | 0.81 | 20.72 | 12.41 | 7.55 |
| [40 30 20] | 0.80 | 20.77 | 12.43 | 7.56 |
| [100 90 80] | 0.82 | 19.85 | 11.79 | 7.22 |
| [200 190 180] | 0.79 | 20.88 | 12.36 | 7.59 |
Table 5.
Performance metrics related to NN analysis for NOx emission.
| Layer Architecture | R2 | RMSE | MAE | NRMSE |
|---|---|---|---|---|
| [40 30] | 0.62 | 58.97 | 43.17 | 13.73 |
| [40 30 20] | 0.64 | 56.48 | 39.80 | 12.86 |
| [100 90 80] | 0.65 | 55.92 | 39.47 | 12.74 |
| [200 190 180] | 0.65 | 55.82 | 38.67 | 12.71 |
Table 6.
Performance metrics related to NN analysis for CO2 emission.
| Layer Architecture | R2 | RMSE | MAE | NRMSE |
|---|---|---|---|---|
| [40 30] | 0.71 | 69.94 | 45.78 | 11.45 |
| [40 30 20] | 0.71 | 69.94 | 45.78 | 11.45 |
| [100 90 80] | 0.78 | 60.51 | 37.32 | 9.90 |
| [200 190 180] | 0.77 | 60.61 | 36.46 | 9.92 |
Table 7.
The best performance factors for all gasses.
| Emitted Gas | R2 | RMSE | MAE | NRMSE |
|---|---|---|---|---|
| CO | 0.82 | 19.85 | 11.79 | 7.22 |
| NO | 0.66 | 54.71 | 38.02 | 13.51 |
| NO2 | 0.78 | 2.85 | 1.65 | 5.70 |
| NOx | 0.65 | 55.82 | 38.67 | 12.71 |
| CO2 | 0.78 | 60.51 | 37.32 | 9.90 |
Table 8.
Performance metrics related to Decision Tree analysis for NOx emission.
| [MinLeafSize MinParentSize] | R2 | RMSE | MAE | NRMSE |
|---|---|---|---|---|
| [1 5] | 0.77 | 44.46 | 19.63 | 10.12 |
| [1 10] | 0.78 | 43.98 | 20.42 | 10.02 |
| [2 5] | 0.76 | 45.82 | 20.92 | 10.43 |
| [2 10] | 0.77 | 45.08 | 21.16 | 10.26 |
| [3 5] | 0.76 | 45.22 | 21.30 | 10.30 |
| [3 10] | 0.77 | 44.87 | 21.47 | 10.22 |
Table 9.
Performance metrics related to Decision Tree analysis for CO2 emission.
| [MinLeafSize MinParentSize] | R2 | RMSE | MAE | NRMSE |
|---|---|---|---|---|
| [1 5] | 0.86 | 47.52 | 18.00 | 7.77 |
| [1 10] | 0.86 | 47.28 | 18.53 | 7.73 |
| [2 5] | 0.87 | 46.97 | 18.17 | 7.67 |
| [2 10] | 0.86 | 47.45 | 19.05 | 7.76 |
| [3 5] | 0.86 | 48.02 | 19.46 | 7.86 |
| [3 10 | 0.86 | 47.79 | 19.77 | 7.82 |
Table 10.
Performance metrics related to RT.
| Gas | [MinLeafSize MinParentSize] | R2 | RMSE | MAE | NRMSE |
|---|---|---|---|---|---|
| CO | [2 10] | 0.85 | 117.69 | 6.78 | 6.43 |
| NO | [1 10] | 0.79 | 42.39 | 19.66 | 10.47 |
| NO2 | [1 10] | 0.87 | 2.15 | 0.74 | 4.31 |
| NOx | [1 10] | 0.78 | 43.98 | 20.42 | 10.02 |
| CO2 | [2 5] | 0.87 | 46.97 | 18.17 | 7.67 |
Table 11.
Performance metrics related to RF.
| Gas | Number of Trees | R2 | RMSE | MAE | NRMSE |
|---|---|---|---|---|---|
| CO | 100 | 0.94 | 11.70 | 5.48 | 4.25 |
| NO | 100 | 0.91 | 28.35 | 16.77 | 7.00 |
| NO2 | 100 | 0.95 | 1.30 | 0.64 | 2.60 |
| NOx | 100 | 0.91 | 28.19 | 16.74 | 6.42 |
| CO2 | 100 | 0.94 | 31.63 | 15.98 | 5.17 |
Table 12.
R2 for test and train data.
| Gas | R2—Test Performance | R2—Train Performance | |
|---|---|---|---|
| LR | CO | 0.06 | 0.08 |
| NO | 0.19 | 0.25 | |
| NO2 | 0.33 | 0.33 | |
| NOX | 0.18 | 0.21 | |
| CO2 | 0.22 | 0.22 | |
| NN | CO | 0.82 | 0.81 |
| NO | 0.66 | 0.71 | |
| NO2 | 0.78 | 0.78 | |
| NOx | 0.65 | 0.68 | |
| CO2 | 0.78 | 0.78 | |
| RT | CO | 0.85 | 0.99 |
| NO | 0.79 | 0.98 | |
| NO2 | 0.87 | 0.99 | |
| NOx | 0.78 | 0.99 | |
| CO2 | 0.87 | 0.99 | |
| RF | CO | 0.94 | 0.94 |
| NO | 0.91 | 0.94 | |
| NO2 | 0.95 | 0.95 | |
| NOx | 0.91 | 0.94 | |
| CO2 | 0.94 | 0.94 |
Table 13.
Best coefficient of determination calculated by different algorithms.
| R2 | NN | RT | RF | LR |
|---|---|---|---|---|
| CO | 0.82 | 0.85 | 0.94 | 0.06 |
| NOX | 0.65 | 0.77 | 0.91 | 0.18 |
| CO2 | 0.78 | 0.87 | 0.94 | 0.22 |
Publisher’s Note: MDPI stays neutral with regard to jurisdictional claims in published maps and institutional affiliations. |
© 2022 by the authors. Licensee MDPI, Basel, Switzerland. This article is an open access article distributed under the terms and conditions of the Creative Commons Attribution (CC BY) license (https://creativecommons.org/licenses/by/4.0/).
Share and Cite
MDPI and ACS Style
Shahnavaz, F.; Akhavian, R. Automated Estimation of Construction Equipment Emission Using Inertial Sensors and Machine Learning Models. Sustainability 2022, 14, 2750. https://doi.org/10.3390/su14052750
AMA Style
Shahnavaz F, Akhavian R. Automated Estimation of Construction Equipment Emission Using Inertial Sensors and Machine Learning Models. Sustainability. 2022; 14(5):2750. https://doi.org/10.3390/su14052750
Chicago/Turabian StyleShahnavaz, Farid, and Reza Akhavian. 2022. "Automated Estimation of Construction Equipment Emission Using Inertial Sensors and Machine Learning Models" Sustainability 14, no. 5: 2750. https://doi.org/10.3390/su14052750
Note that from the first issue of 2016, this journal uses article numbers instead of page numbers. See further details here.