Article

How to Find the Key Participants in Crowdsourcing Design? Identifying Lead Users in the Online Context Using User-Contributed Content and Online Behavior Analysis

1
Tianjin Key Laboratory of Equipment Design and Manufacturing Technology, Tianjin University, Tianjin 300072, China
2
Department of Mechanical Engineering, Tianjin Ren’ai College, Tianjin 301636, China
3
School of Design, Jiangnan University, Wuxi 214122, China
*
Authors to whom correspondence should be addressed.
Sustainability 2022, 14(4), 2094; https://doi.org/10.3390/su14042094
Submission received: 2 January 2022 / Revised: 7 February 2022 / Accepted: 9 February 2022 / Published: 12 February 2022

Abstract

:
Lead users are the most valuable innovation sources in crowdsourcing design; how to identify these users is a research hotspot in the field of design and management. Existing approaches to discover lead users in the context of the online community, such as the manual method and ordering algorithm, have some limitations, for instance, low coverage and accuracy. To address these deficiencies, this article proposes a method that applies text-mining techniques, analysis of user behavior, and contributed content to identify lead users. We suggest a three-step analytical approach: First, a criterion system to evaluate the user’s leading-edge status is constructed. Second, we utilize a fuzzy analytical hierarchy process to assess the weighted value of each indicator and develop the reference sequence of the indicators. Third, grey relational analysis is employed to analyze the correlations between users’ indicators and reference sequences, and lead users are recognized based on each user’s correlation ranking. An empirical analysis is used to examine the effectiveness of the proposed method. The results reveal that the method has good precision and recall rate, can automatically process large-scale data, and has no strict requirements for respondents. Finally, the article discusses the limitations and provides possible directions for future research.

1. Introduction

In recent years, the flourishing of crowdsourcing triggered a transformation in the field of product development [1]. More and more companies have realized that customers are crucial external innovation sources and are expected to establish long-term relationships; some enterprises have started collaborating with customers to design/develop new products or services [2]. The advancement of Internet technologies has offered a stable channel for consumers to participate in design activities. Many firms, such as Lego, P&G, Haier, and Dell, have launched online platforms, i.e., the crowdsourcing design community (CDC). It encourages customers to contribute content (e.g., designs and ideas) via posting topics and messages, which is the main pathway for users to participate in enterprises’ new product development (NPD) projects [3,4]. For instance, Dell initiated a crowdsourcing platform called Ideastorm for NPD. Dell posts its needs (e.g., bottleneck problems the company encounter during the process of NPD) on Ideastorm and invites users to contribute ideas, designs, experience, and knowledge to solve these issues. With the Ideastorm strategy, Dell’s NPD productivity has increased by almost 50 percent; many of Dell’s best-selling products are coming from Ideastorm [5]. The CDC extends the communication channel between companies and customers, providing a new approach for enterprises to continuously acquire new ideas and external knowledge [6]. Moreover, as a critical innovation force, users can exert significant effects on the success of NPD.
In the research field of sustainable crowdsourcing design, scholars have acknowledged that companies should employ users with rich experience, extensive knowledge, and great skill concerning technologies and usage of various types of products as long-time partners to develop new products [7]. With these individuals’ assistance, enterprises can effectively decrease the research and development (R and D) costs, shorten development cycles, increase the probability of project success, and improve design efficiency [8]. Eric von Hippel defined these individuals as lead users and considered customers of a product/service. The current experience needs will be general in a marketplace in the future and benefit gratefully if they obtain a solution to these needs [9]. These individuals may speed up product R and D and promote the sustainable development of enterprises. Lead users have two typical features: first, their needs represent the development trends of the product/service; second, they are keen to participate in design projects to translate their needs into new products/services [10]. Since lead users are the most valuable participants in sustainable crowdsourcing design activities, how to identify these individuals with high efficiency is an important research issue in the area of open innovation and information systems.
The CDC is the primary medium for enterprises to organize crowdsourcing design events. The operators may launch product development projects and design challenges within the community. Users can participate in their preferred activities and contribute content via posting feedback and messages to solve design-related issues. Additionally, the enterprise encourages users to interact with others in the community; many members often initiate topic discussions on technology, product improvement, usage experience, requirements, et al. and reply to other users’ posts. Members’ contributed content can fully reflect their capabilities, expertise, and active degree, which may assist the company managers in discovering critical users (e.g., lead users and opinion leaders) [11].
Research on the discovery of lead users in social media (e.g., social network sites and online communities) is still at the initial stages. In particular, strategies to identify these users in the context of online communities have not been sufficiently explored [12,13]. The existing literature primarily introduced two kinds of methods to discover lead users: manual screening and an ordering algorithm based on influence rank [11]. The main goal of the former method is to let the community members recommend lead users. It has multiple tools, such as surveying, interviewing, and discussing. Although the manual screening method has been extensively applied in the research area of product development, it has some limitations, such as low coverage, high cost, and intense subjectivity [9]. The latter method aims to identify the lead users by evaluating the frequency of content contributed by community members and their social influence. Such a method can be utilized to handle large samples sizes. However, their accuracy is relatively low. Most of the users identified by the ordering algorithm are opinion leaders who may have a poor understanding of technologies and usage of products [13]. To accurately and efficiently recognize the lead users in the context of the CDC, this work proposes an integrated method combined with user-contributed content and online behavior (mainly contribution behavior) analysis. The content analysis is performed using text-mining technology, while the behavior analysis is implemented adopting the statistical tool of online user behavior. The main contributions of this study are as follows:
(1)
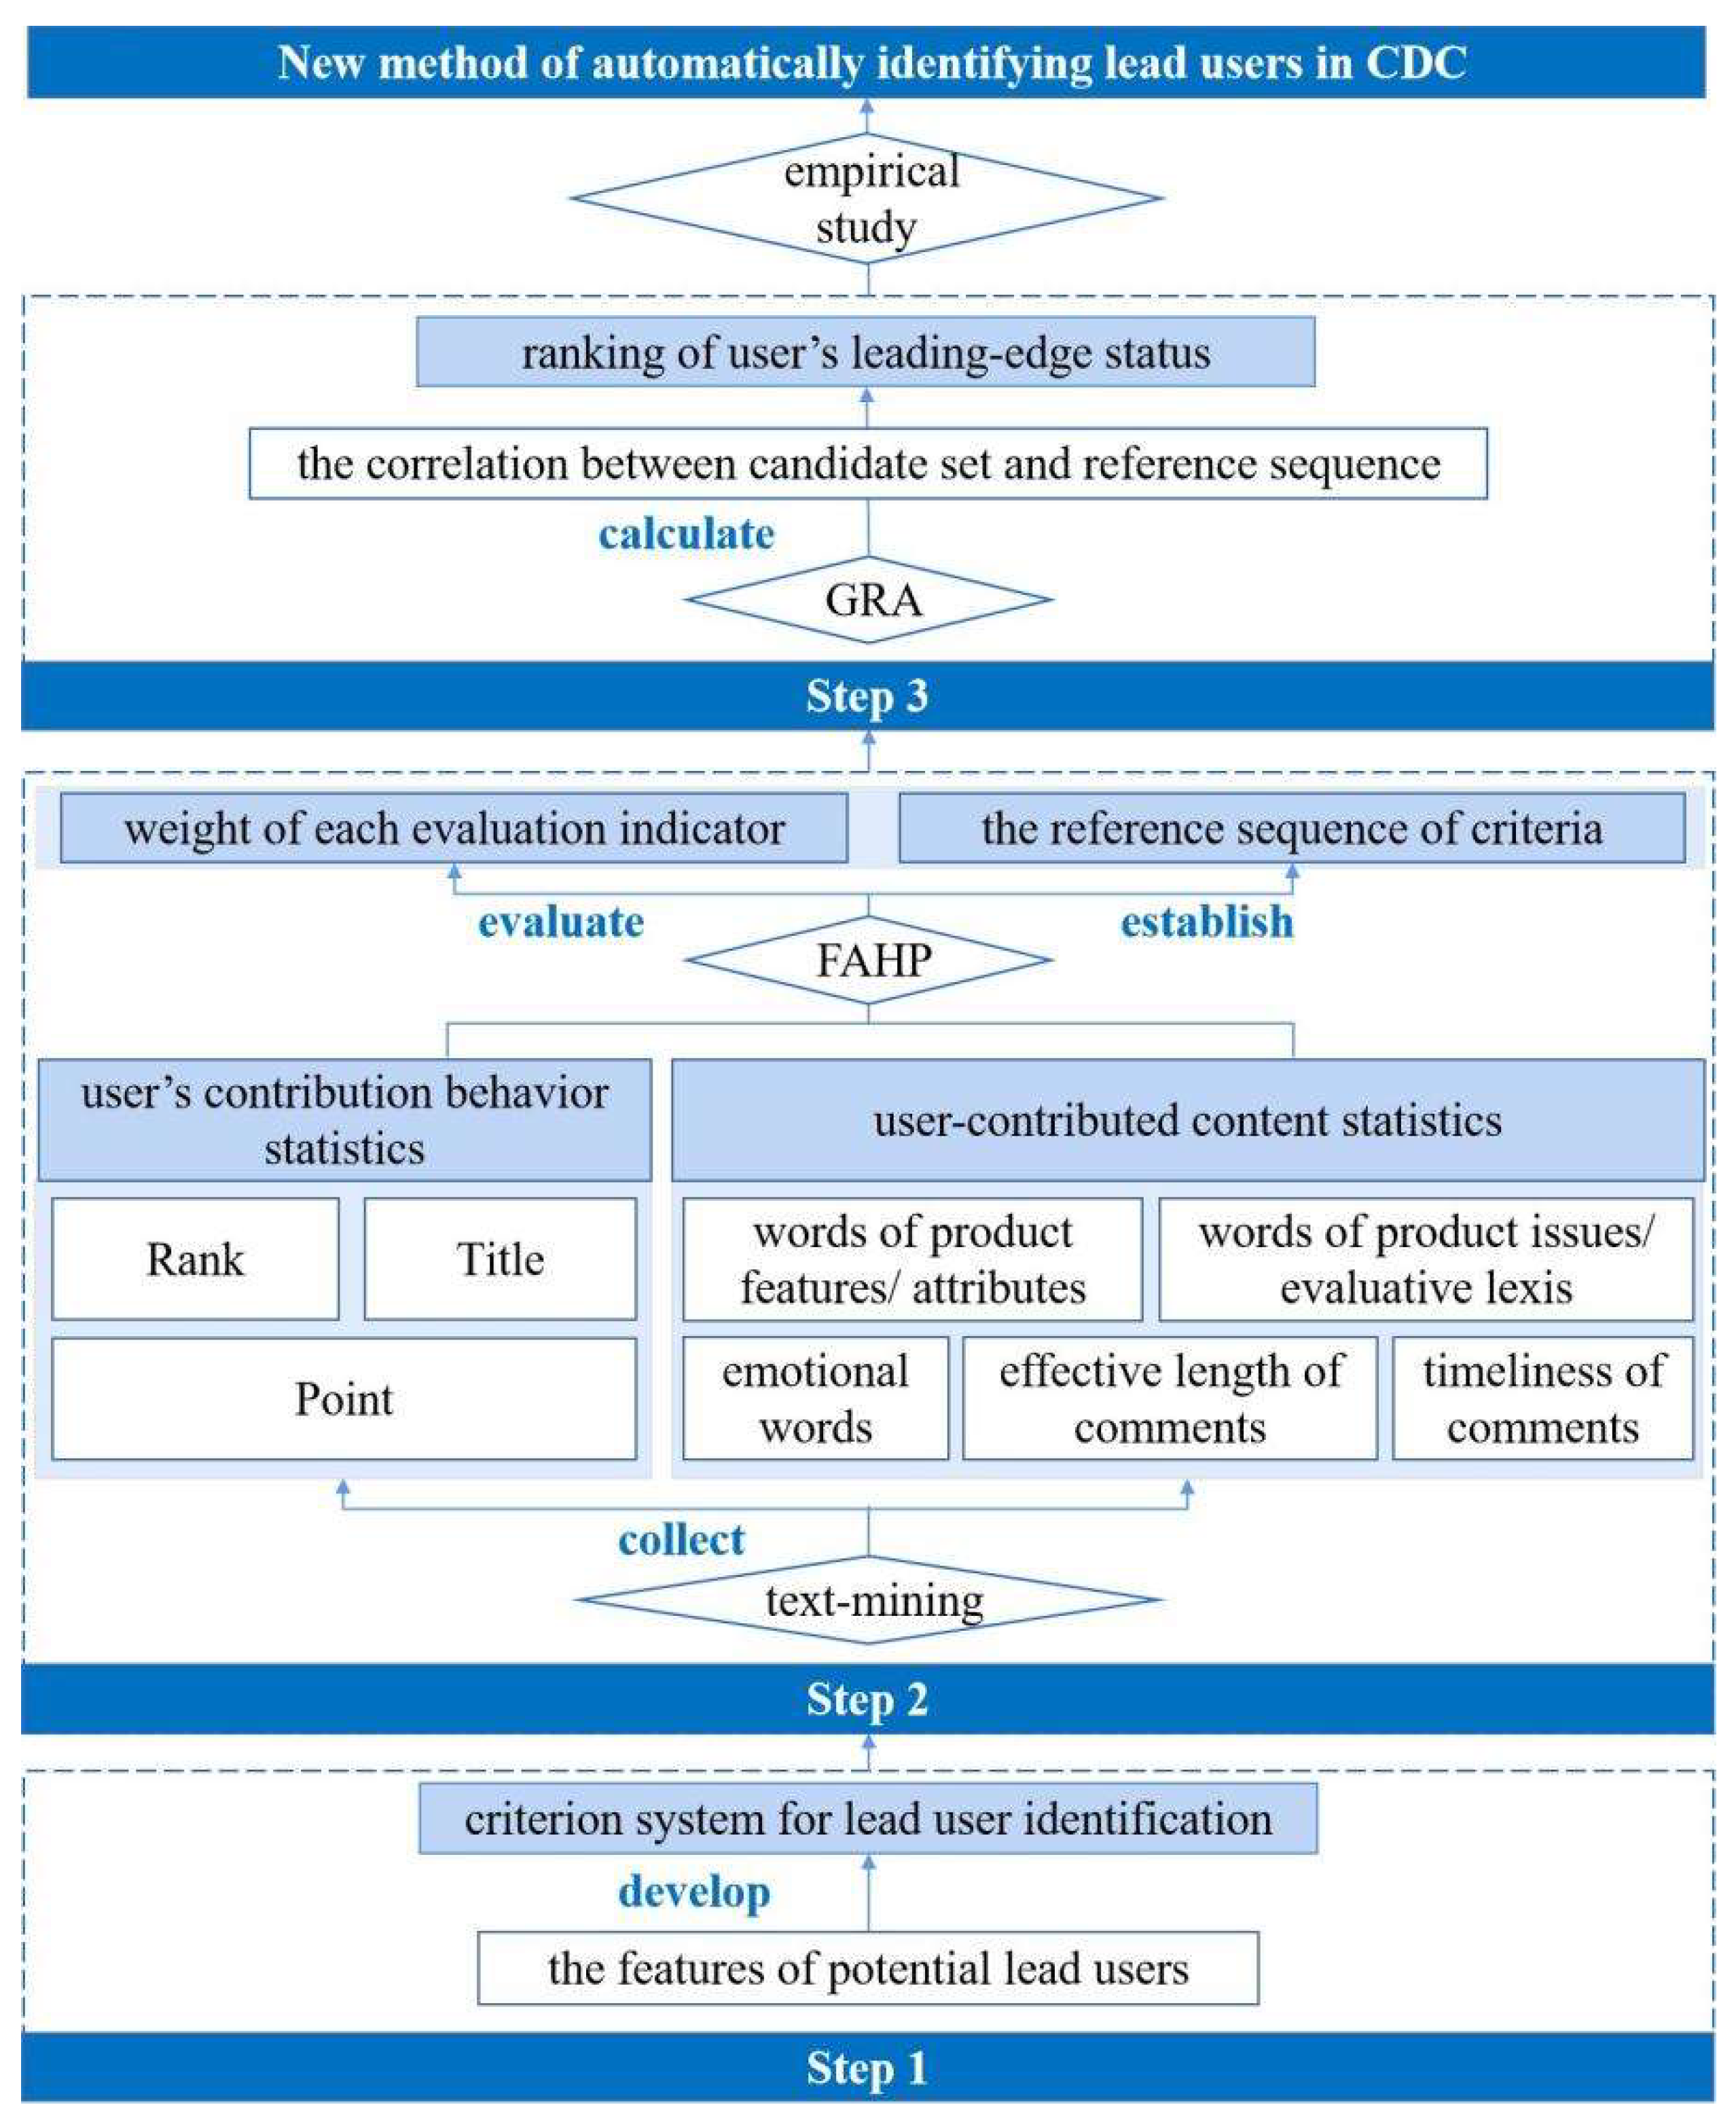
We propose integrated criteria that measure individuals’ expertise and active degree.
(2)
Text-mining techniques are applied to extract product-related, innovation-related, user demand-related, et al. information from user-contributed content in CDC.
(3)
A ranking system based on fuzzy analytic hierarchy process (FAHP) and grey relational analysis (GRA) is developed to identify lead users.
(4)
We demonstrate the efficacy of our proposed methodology utilizing a case study of user behavior data from a well-known CDC in China.
To sum up, the critical contribution of this study is to propose an innovative lead user identification method. On the one hand, this method can help the traditional manual method quickly screen target users in the ordinary network environment (such as microblog, Facebook, and Twitter). On the other hand, it can quickly and automatically identify lead users in the specific network environment of a crowdsourcing innovation platform.
The remainder of this article is organized as follows. Section 2 reviews the relevant literature on lead user identification. In addition, Section 3 describes our proposed method in detail. Next, Section 4 presents the case study. Section 5 discusses the experimental results. Finally, Section 6 draws the conclusions.

2. Related Works

2.1. Crowdsourcing Design in the Context of Online Platforms

Companies that desire to perform sustainable crowdsourcing design should continuously motivate users to contribute knowledge, ideas, designs, and innovations. An approach for enterprises to collect these resources is to run a CDC. Such a community often starts as a consumer support platform (e.g., brand community). Customers exchange information (e.g., usage attentions and tips) of the company’s products and evolve into a way by which users can put forward suggestions on product improvement and develop extensions [14,15]. Companies may adopt some of the good ideas contributed by the customers and develop the products according to their needs [16]. Besides, enterprises often post the issues they meet in NPD and encourage users to contribute content to solve these problems. Sometimes users may provide unconventional but effective solutions. Although CDC has been widely used for implementing open innovation, previous studies have paid little attention to systematically exploring users’ features and participation behavior in such a context. Therefore, more in-depth research is necessary.
Another method for firms to initiate sustainable crowdsourcing design is launching a design contest website [17,18]. Enterprises put their needs (for technology, products, e-commerce, et al.) on specific sections within the platform. Members can find the need that matches their innovation capability through the retrieval system [19]. The operators will choose the best designs/ideas as solutions for the needs and pay the members for their contributions [20]. Members will try their best to beat the opponents to get the reward. OpenIDEO hosted by IDEO, HOPE hosted by Haier, and Cuusoo hosted by LEGO are typical design contest website representatives [21].

2.2. Manual Method to Discover Lead User

Research on the lead user in product design and innovation is mainly focused on identifying consumers who contribute innovative ideas that are ahead of market preferences and trends [11,22]. In the offline context, manual screening of a significant number of potentially relevant customers is the primary method to evaluate and identify lead users [23]. Hippel et al. first probed the identification methodology and proposed a screening and pyramiding method to search lead users [9,24]. A representative sample or a predefined population is screened for users who satisfy a particular criterion via questionnaires to perform screening [9,13]. The examined sample should be sufficiently large to discover the real lead users. Pyramiding is the improvement of screening; it is a more targeted method that dramatically reduces screening efforts. To implement pyramiding, researchers must build the pyramid of expertise that contains three layers: the lead users, the users who have good knowledge of the product and can find the lead users, and the users who have an understanding of the product domain and may find the advanced experts [24]. The researchers may contact any users of these layers and follow the chain of user recommendations to find the next-level users. This method is effective since respondents with vital interests in specific topics tend to know the senior experts in the area [12].
Many scholars have further developed Hippel’s strategy: Lüthje [25] empirically explored the features of innovation participants and considered that researchers should incorporate more indicators such as user influence, innovation ability, and forward-looking expectations to perform screening. Morrison et al. [26] applied leading-edge status to measure the users’ level of expertise. Their research results revealed that applications’ innovativeness is one of the most critical features of lead users. Tietz et al. [27] proposed a signaling method that utilized advertising tools to discover lead users; such an approach can broadcast the survey information to attract more target users. Brem and Bilgram [13] found in the sample of 24 lead user projects that screening, pyramiding, and signaling remained the most frequently applied search strategies to identify lead users. Hienerth and Lettl [28] explored the measurement of the lead user construct; they considered that social media, data mining, and modern search technologies might be employed to improve the effectiveness of the manual method. These works provide feasible manual methods for scholars to identify lead users in the offline context; however, such methods have some significant shortcomings: time-consuming procedure, high search costs, low sampling efficiency, intense subjectivity, and cannot contact all the lead users in the user space [11,12,29]. Hence, the manual method should be improved to suit the online environment.

2.3. Ordering Algorithm to Identify Lead User

With the rapid development of information technologies, many scholars considered that monitoring social media may replace the manual method to collect the information of customers [22]. They put forward a new method to measure user influence based on the user interaction relationship of a community network from the perspective of user interaction characteristics [30]. Tang and Yang [31] proposed a user-rank algorithm that combined content and network analysis to discover influential members in online communities. Song et al. [32] developed an influence-rank algorithm to identify opinion leaders in blogospheres; their method adopted social networks among community members, which are not always practicable in some online platforms. Hajian and White [33] proposed an index (Magnitude Of Influence (MOI)) to quantify the influence of online social network users on their neighbors, further using the PageRank algorithm to weight the MOI through the influence ranking of neighbors to determine the final influence ranking of the user. Tuarob and Tucker [11] developed a matching algorithm that connected the relationships between lead users and product features to identify lead users with special interests in certain areas. Pajo et al. [12] proposed a classification model to subdivide the users; such a method can reasonably identify the characteristics of different users. To optimize the identification of lead users, scholars have explored the additional features of lead users in the context of online communities. For instance, most lead users are influential and active members in cyberspace. They often generate product-related and service-related content, and their opinions represent most users’ perceptions [34,35]. Although the ordering algorithms suggested by the existing works have improved the efficiency of lead user discovery, they have some drawbacks: (1) the definition of lead users in most of these works relates to how the users’ views propagate throughout the online platform. In contrast, the lead users in the innovation field should be individuals who have extensive knowledge and unknown demands. That is to say, most of the existing methods are developed to identify opinion leaders [11,13]. (2) Most approaches need network connectivity among members, which is not always available in communities [11]. Thus, the ordering algorithm should be further developed to analyze the characteristics of lead users from the perspectives of knowledge and demand.

3. Method

3.1. Research Framework

The CDC is constructed based on the online forum that motivates users to generate content and interact with other members. Within the CDC, enterprises disclose the design-related problems they face through posts and encourage customers, fans, experts, et al. to contribute (through post image, text, and videos in the community) to settle these design challenges [3]. Additionally, operators also encourage members to post their demands in the forum so that the companies can understand the customers’ trends of demand development and initiate new projects of product development [13]. Hence, the CDC users may generate a large amount of content that can reflect their capabilities.
This work develops an identification method that considers multiple characteristics of lead users, including active degree, expertise, and quality of demands. The method contains three steps: first, we develop a criterion system based on previous literature to measure the features of potential lead users; second, text-mining techniques are utilized to collect user-contributed content and user’s online behavior statistics from the CDC, and then, we apply the FAHP to evaluate the weight of the indicators and establish the reference sequence of criteria; third, the GRA is employed to calculate the correlation between candidate set (the potential users’ indicator set) and reference sequence, and the users are ranked based on their correlations. At last, the top-ranking users (the enterprises decide the scales) will be considered lead users. After these steps, a case study is performed to verify the efficiency of the proposed approach. Figure 1 shows the research framework.

3.2. The Criterion System for Lead User Identification

Since CDC users generate design-related content primarily through posting topics and feedback, the frequency of content contribution and the correlation between content and innovation may reflect the user’s leading-edge status [2,12,25,26]. Additionally, some researchers suggested that the user’s influence in the community may be a vital characteristic of the lead user [30,36]. However, from the analysis of online innovation platforms (e.g., CDCs and crowdsourcing websites), we noticed that many professional discussion topics posted by users who have extensive knowledge and great skill on technologies and innovation attract very little attention from other members. These users meet the criteria for lead user identification proposed by Hippel, but their visibility in the community is relatively low. Thus, we considered that social attributes (e.g., individual influence) are not the essential features of lead users.
Following previous studies [12,25,26], we employ characteristics of contribution behavior (e.g., contribution frequency) and correlations between user-contributed content and product, innovation, design, and technology as evaluation indicators to measure the individual’s leading status. In particular, Guo et al. [3] considered that the ranking system of the online community, which is a kind of statistical tool, can well reflect the features of the users’ online behavior. Hence, we apply this system to analyze users’ contribution behavior. Besides, text-mining and analysis techniques are utilized to evaluate the relationships between users’ contributions and innovation.

3.3. The Calculation of Evaluation Indicators

3.3.1. The Indicators of Features of User’s Contribution Behavior

Nowadays, most online communities have developed a ranking system that can reflect the member’s reputation, active degree, and community influence by analyzing their online behavior such as posting, replying, likes, sharing, and consumption. The system gives the user a corresponding rank based on the statistics of individual behavior and assists the operator in managing the community. Table 1 shows the introduction of indicators from the standard ranking system.
As shown in Table 1, contribution value reflects the depth of community members’ participation in online events. In the context of the open innovation platform, this indicator also reflects the breadth and depth of users’ expertise and usage experience. A point is calculated based on statistical information of the user’s online behavior, which describes the frequency of posting, replying, et al. and reflects the individual’s active degree. Rank is a comprehensive reflection of the user’s contribution level in the community, reflecting the user’s relative position in the member group. These three indicators can well reflect the user’s leading-edge status. Therefore, the contribution value, point, and rank are applied to measure the behavior characteristics of users in this work.

3.3.2. The Indicators of Correlations between User-Contributed Content and Innovation

The projects of NPD initiated by the enterprise are mainly carried out around the structure, function, and appearance; hence, the online comments from users that contain these contents are often focused on by the product developers [37]. Users who contribute such content may likely include lead users. Huang et al. [38] considered that the users’ highly positive emotional trust affects users’ decision-making in virtual communities. Li [39] proposed an ordering algorithm that can be used to evaluate the effectiveness of user comments. He suggested that the individual’s reputation, number of thumbs up, timeliness, effective length, words of product features (i.e., attributes), and emotional words may be applied to estimate the correlation between online comments and innovation. Therefore, following prior literature and combining the analysis results of open innovation communities, we utilize product features and issues, emotional words, effective length, and timeliness of comments as indicators to evaluate the user-contributed content. Table 2 shows the introduction and calculation basis of indicators of contribution behavior characteristics and correlations between user-contributed content and innovation.
The quantitative methods for calculating the indicators of correlations between user-contributed content and innovation are as follows.
1.
The calculation of indicator of words of product features.
When users post their opinions (such as evaluation, demand, etc.) on products in the community, they often use words of product features to describe them. Attributes reflect the product’s inherent characteristics, such as structure, appearance, etc.; most of these words are nouns. Therefore, we considered that when the comments contain product attributes, the comments may reflect product-related content (e.g., use experience, product problems, improvement suggestions, etc.). The more attribute words are included, the more information is transmitted, the more significant the auxiliary role for product development and improvement, and the higher the effective contribution level of users.
This study employs the single comment (i.e., a complete comment) users post as the analysis objects. A self-developed spider tool is used to collect users’ comments from CDC, and we apply jiebaR to segment the collected Chinese texts into words and tag them with proper Part-of-Speech (PoS) tags (e.g., noun, verb, adverb, and adjective). After deleting the stopwords and punctuation characters, the comment is transformed into a word set U1i = (u11,u12,…,u1m), containing Nw words. The R programming language is utilized to match the words in U1i one by one with the words of product features in a lexicon U2 developed by the Institute of Computing Technology, Chinese Academy of Sciences [40]. When a word is matched, the number of attributes of the comment is increased by one. We use Na to represent the number of attributes in a single comment.
2.
The calculation of indicator of words of product issues
The words of product issues (i.e., evaluative lexis) are often used to describe consumers’ intuitive perception of the product functions, appearance, and other attributes. These words often reflect users’ demand expectations and attitudes towards the product. For instance, “too large” in “car fuel consumption is too large” is the user’s intuitive feeling towards car fuel consumption. Therefore, when a comment contains words of product issues, the users may post content about the product use experience, product defects, and personal needs. The more words of product issues are included in the content, the more detailed the description of the product problem, and the more profound users’ engagement.
The product issues are often described with adjectives and verbs, usually used with adverbs. For example, within the comment “the motor performance is not good,” “motor” and “performance” are words of product features; the adverb “not” modifies the adjective “good,” and they constitute the word of a product issue. We apply the R programming language to identify the comments’ adverbs, adjectives, and verbs. When an adjective or a verb appears in U1i, the number of words of product issues of the comment is increased by one. Additionally, when an adverb appears in U1i together with an adjective or a verb, the number of words of product issues is also increased by one. We use Ni to represent the number of words of product issues in a single comment.
3.
The calculation of indicator of emotional words.
When users post their opinions on products in communities, they often express their emotional tendencies through their vocabulary. For instance, “perfect,” “good,” and “satisfied” express positive emotions, while “bad,” “terrible,” and “disappointed” express negative ones. The emotion expressed by the users on the functional attributes of the product can be regarded as an open test result for the product [41]. When users express positive emotions, it indicates that the product has satisfied their expectations in a particular aspect. There is no need to improve the product at the moment. However, when users express negative emotions, it indicates that specific attributes of the product have not met their expectations, and the enterprise should improve the product as soon as possible. Positive and negative emotions can reflect an individual’s demand tendency and provide essential references for product improvement. Hence, when the comment contains emotional vocabulary, it may reflect the users’ product evaluation and demand tendencies. Moreover, the more emotional words are included, the stronger the user’s emotional trend is reflected.
We use the R programming language to match the words in U1i with the emotional words in the lexicon U3 of ICTCLAS [40]. When a word is matched, the comment’s emotional words are increased by one. We use Ne to represent the number of emotional words in a single comment.
4.
The calculation of indicator of the effective length of comments.
In the Chinese language environment, the length of an online comment is usually quantified by the number of Chinese characters included in the comment. However, most online comments contain a large number of meaningless content, and some of them include numerous characters that have nothing to do with innovation. Thus, we should apply the effective length of the comments to evaluate the leading-edge status of the users. In this work, the ratio of the number of emotional words, product features, and issues in the comment to the number of words in U1i is utilized as the quantized value of the effective length of the comment. Meanwhile, to reduce the deviation caused by the abnormal length (e.g., too long or too short) of comments, the logarithm is used to weaken the difference of the denominator, as shown in Equation (1):
P = log ( N a + N i + N e ) log N w ,
5.
The calculation of indicator of timeliness of comments.
The timeliness of comments refers to the difference value between the time when the user posts a comment and when the researchers fetch the comment; the smaller the value, the higher the timeliness [39]. The more content the user posts in a period, the higher the user’s participation and the higher the user’s leading-edge status. For product innovation, the more time-sensitive comments reflect the newer needs of users, and the less likely they are to be discovered and resolved by competing companies.
Meng and Ding [42] suggested that the newer the comments, the higher the credibility. The influential users’ effect would diminish with time [43]. Based on the previous study’s results, we divide those into two groups: the comments posted in the last three months and those posted three months ago. The former’s value is 2, while the latter is 1.

3.4. The Ordering Algorithm of Evaluation Indicators

The identification of lead users is mainly achieved by ranking the leading-edge status of the users. The rules are as follows: the weight of each evaluation indicator is calculated by FAHP. Then, the optimal value of each indicator in the research sample is selected to form a reference sequence, and the correlation between each candidate user’s indicator sequence and the reference sequence is calculated by GRA. The greater the degree of association, the higher the user’s leading-edge status. Based on the research purpose and requirements, a certain relevance threshold can be set to distinguish between lead users and regular users.

3.4.1. The Calculation of Indicator Weight Based on FAHP

FAHP is a research method widely applied in analyzing and decision-making complex systems [44]. It can simplify complex problems into ordered hierarchical structures. In this work, such a method is used to determine the weights of various indicators. The analysis steps are as follows:
Step 1: Construct a judgment matrix.
The judgment matrix reflects individuals’ thinking and judgment; it can be employed to collect the users’ opinions on the weight of the indicators. Since the users of the CDC are the analysis objects of this work, the data that constitutes the judgment matrix mainly comes from the network survey of community members. The judgment matrix will be sent to the user’s mailbox in a web questionnaire during the investigation process. Then, the members compare and score the importance of indicators according to their experiences and feelings. The scale applied in the matrix is the 0-0.5-1 standard; its descriptions are shown in Table 3.
Step 2: Construct fuzzy consistent matrix.
After constructing the judgment matrix, we utilize the method proposed by Korvin and Kleyle [45] to transform the matrix into the fuzzy consistent matrix.
The rows and columns of the judgment matrix are respectively summed, that is,
a i = j = 1 m a i j ,   i = 1 , 2 , , m ,
a j = i = 1 m a i j , j = 1 , 2 , , m ,
After summing, transform each element in the matrix, that is,
a i j = ( a i a j ) 2 m + 0.5 ,   i ,   j = 1 , 2 , , m ,
Step 3: Calculate indicator weights.
The consistency test is performed to examine the fuzzy consistent matrix, and then the weight wi of each indicator ai is evaluated by the matrix, that is,
w i = 1 m 1 2 A + 1 m A j = 1 m a i j ,   i ,   j = 1 , 2 , , m ,
In the Equations (2)–(5), m represents the number of indicators. Additionally, in order to improve the resolution of the sorting result, researchers often set A = (m − 1)/2. Finally, the average values of each indicator weight W = (w1, w2,…, wm) are obtained.

3.4.2. The Ranking of User’s Leading-Edge Status Based on GRA

GRA is a multi-factor statistical analysis method [46]. Its basic idea is to determine whether the correlation between multiple sequences and the reference sequence is close and then describe the relationship’s size, strength, and order among factors according to the degree of association. For lead users, the greater the value of each indicator, the higher the leading-edge status. Compared with the traditional statistical analysis methods, the advantages of GRA are principally as follows: GRA is analyzed according to the development trend of the research objects. Therefore, there is no excessive requirement for the sample size, and no data are required to have a specific distribution law. The calculation amount is relatively small, and the result agrees with the qualitative analysis result [47]. The analysis steps are as follows:
Step: 1 The dimensionless processing of the data.
Xk(i) and Y(i) represent the user’s indicator sequence and the reference sequence, respectively; k = 1, 2, …, n, i = 1, 2, …, m. n represents the number of users to be ranked; and m represents the number of indicators. Since different indicators often have different dimensions and orders of magnitude, direct comparisons cannot be made, and normalization is required. In the related research of GRA, scholars often use the min–max method for dimensionless processing. However, since the data composition in the criterion system is quite complicated, the magnitude of the difference between the different indicators is enormous, and the min–max method is not applicable in our work. Hence, in order to eliminate the singular data, make the data index in the same order of magnitude, have comparability, and make it suitable for comprehensive comparative evaluation, we employed the averaging method to perform the dimensionless processing to the original data, that is,
x k ( i ) = x k ( i ) x i ¯ ,   k = 1 , 2 , , n , i = 1 , 2 , , m ,
y i = y i x i ¯ ,   i = 1 , 2 , , m ,
Xk(i) is the quantized value of the i-th indicator of the k-th user; xi is the average value of the i-th indicator of the candidate users’ sequence; yi is the quantized value of the i-th indicator of the reference sequences. The users whose indicator values are the same as the corresponding indicator values in the reference sequence need to be eliminated to avoid invalid results.
Step 2 The calculation of the grey correlation coefficient.
The formula for calculating the grey correlation coefficient is as shown in Equation (8):
ξ k ( i ) = min k N { min i M Δ k ( i ) } + ρ min k N { max i M Δ k ( i ) } Δ k ( i ) + ρ min k N { max i M Δ k ( i ) } ,   k = 1 , 2 , , n ,   i = 1 , 2 , , m ,
In the equation, Δ k ( i ) = | Y ( i ) X k ( i ) | , N = {1,2,…,n}, M = {1,2,…,m}. ρ is the resolution coefficient, and its value is taken in the interval [0, 1]. Normally, ρ = 0.5.
Step 3 The calculation of grey correlation.
The weighted method is used to calculate the gray correlation, and the formula is as shown in Equation (9):
r k = 1 m i = 1 m w i ξ k ( i ) ,   k N ,
In the equation, wi is the value of the indicator weight obtained by FAHP, i = 1 m w i = 1 . Sorting each user’s correlation, we can then obtain the ranking of the user’s leading-edge status. We are setting the relevance threshold (dynamic) according to the semantic environment and the specific purpose of the research. Then, we can distinguish between lead users and regular users.

4. Empirical Study

4.1. Data Crawling

In this work, a case study of lead user identification is conducted to verify the effectiveness and practicality of our proposed method. We examine the method with samples collected from a CDC, Xiaomi Forum, with over 50 million registered members and about 65 percent active users [3]. Xiaomi is a mobile Internet company focused on designing and manufacturing smartphones; its CDC collects many valuable ideas and designs from community members [2]. Hence, it is an ideal source for the research. Figure 2 shows the user interface of Xiaomi Forum.
We applied a self-developed spider program to collect 9500 users’ comments (including topic posts and feedback) and their recent ID information (including contribution value, rank, and point) from 1 November 2018 to 20 May 2019. The R programming language and SPSS tool were utilized to perform the analysis.

4.2. Data Analysis and Results

Among the related comments published by the 9500 users, the maximum number of occurrences of words of product features in the user comments is 1722; the number of words of product issues is 207; and the number of emotional words is 1079. The statistical value is processed by R programming language regarding the effective length of comments; and the maximum quantized value is 0.697. In terms of the timeliness of comments, the maximum average value of all users’ posts is 1.7. In terms of the contribution value, the highest value is 11,328. In terms of the rank, the highest value is 8. In terms of the point, the highest value is 213,176. We applied these values as the reference sequence:
Y = {1722, 207, 1079, 0.697, 1.7, 11328, 8, 213176}
Next, based on the data collected through the social survey, we utilized FAHP to calculate the weight of different indicators for lead user identification and then constructed the judgment matrix as shown in Table 4.
Then, we used Formulas (2)–(4) to convert the judgment matrix into fuzzy consistent matrix, as shown in Table 5.
After the consistency verification of the matrix, the weight value of each evaluation index was calculated by Formula (5):
W = (0.126, 0.136, 0.108, 0.117, 0.100, 0.148, 0.141, 0.123)
Afterward, we used GRA to calculate the quantitative value of each user’s evaluation index, compared the correlation degree between the sequence and the reference sequence, and then realized the user criticality ranking by comparing the correlation degree. Since Hippel considered that only about three percent of customers are lead users [9], we took the top three percent of the 9500 users as the lead user.
To verify the validity of the method set out in the present study, we compared the recognition results of the manual method with our approach. Following the method suggested by Brem and Bilgram [13], we selected 500 Xiaomi Forum users who have used the community for more than one year and sent a survey invitation to them through the mail system. We required them to select the 50 most representative community members based on their feelings and experience. The respondents rated these users in terms of expertise, experience, demand, and participation level (each scored 1/4), and the top 20 users were ranked as the lead users of the community. In order to ensure the effectiveness of the comparison verification, a 60 day online behavior tracking was conducted for these 20 lead users. A total of 272 respondents returned valid information.
These posts were analyzed by seven scholars and technical experts from enterprises/colleges. They found that in addition to the five users ranked 1st, 4th, 10th, 13th, and 19th, the other 15 users had a high leading-edge status. Through the analysis, we found that each of these users posts at least ten topics per week, and most of the posts are related to market, product, and technology. However, although those five users post many topics and are well-known in the community, only a tiny part of their posts are related to technology, market, experience, demand, etc. Therefore, they are just simple active users. As shown in Table 6, the top 10 lead users identified by our method are compared with the lead users recognized by the manual method. The ID in the table is the user’s identity number in Xiaomi Forum.

5. Discussion

5.1. Key Findings

The results revealed that the identification method proposed in this study has good precision and recall rate. Besides, it was evident that the comparison showed some differences between the two methods, owing to the manual method being highly dependent on manpower. It takes considerable time to find qualified respondents. Then, in the analysis stage, the participating users will be affected by their own perception and cognitive judgment when selecting the lead user. If there is a lack of interactions between lead users and other users, in this case, their influence is limited, and other users lack a basic understanding of them; such users will not be recognized. According to Table 6, so far as we know, ID 437500596 and 23957255 contributed many product experience posts and product evaluation posts in the community and have a rich user experience and product knowledge. However, due to the relative absence of interactions between these two users and other users, they have not attracted widespread attention, so they have been ignored. Therefore, the manual method needs to carry out cumbersome data processing to reduce the subjective feelings of the survey results. The whole process is complicated, and it is difficult to guarantee the quality of the survey.
Compared with the manual method, the approach suggested by our work mainly uses the contribution content and statistical information retained by the community members to identify the lead users. That is because a series of suggestions and comments generated by user contributions in CDC can generate valuable and novel solutions [48]. Furthermore, the technological progress of machine learning technology for natural language understanding, such as semantic word space model and semantic network analysis, made it feasible to capture open text content on the Internet. In order to overcome the high dependence of traditional lead users identification methods (such as manual screening and ordering algorithm) on manual recommendation, we constructed a criterion system for lead user identification for the field of innovative product design. It can combine with the judgment mechanism of artificial methods and automatically process large-scale data with a machine learning algorithm, without strict requirements for respondents. Therefore, our method has advantages in efficiency and accuracy. It can automatically process large-scale data and has no strict requirements for the respondents. Hence, our method has advantages in terms of efficiency and accuracy.

5.2. Theoretical and Practical Implications

With the application and development of the new generation of Internet and digital technology, economic subjects’ interaction models and information matching modes are undergoing profound changes. The integrated development of crowdsourcing and innovative design has quietly subverted the traditional industrial structure. It is the reflection of enterprises on the innovation model. A crowdsourcing design allows enterprises to assign some or all of their design tasks to organizations or individuals with the appropriate capabilities and resources through online platforms and then collaborate to complete the work. It uses a series of means to give play to the wisdom of platform users, sustainably optimizes the allocation efficiency of knowledge resources and technical resources emerging in the implementation of crowdsourcing activities, shortens the response time, and realizes the rapid matching of supply and demand information. It also helps enterprises create better products or services that meet the market and consumers’ expectations. Therefore, crowdsourcing significantly improves the efficiency of resource allocation and labor productivity, reduces enterprises’ development costs, and promotes the collaborative value creation of crowdsourcing networks.
At present, numerous studies focus on the link between environmental aspects of sustainability and crowdsourcing [49,50]. As a valuable tool, crowdsourcing can successfully attract diverse stakeholders to generate novel ideas and develop these into sustainable solutions [51]. A previous study on the influence of the two sustainability dimensions of environmental and economical on consumer responses found an interaction between consumer support for sustainability and enterprise sustainability [52]. Hence, crowdsourcing could favor an improvement in environmental sustainability performance and economic and social ones. It is worth noting that the digitalization process strengthens the connection between products and factories, the value chains, and users to achieve a production cycle that is as sustainable as possible. Thereby, in the new development stage, business, information, engineering, and analytics perspectives on digitalization are connected [53], which could promote the sustainable development of the digital crowdsourcing economy to support the high-quality development of the economy.
As we mentioned above, this study contributes to research on product design by providing a new method that can automatically discover lead users in CDC. We developed a criterion system that includes the indicators of user contribution contents and online behavior to measure the leading-edge status of the CDC members. Then, an ensemble method that incorporates combination weighting and correlation analysis was constructed to analyze the indicators to search for the lead users. The experiment results confirmed that the proposed method could accurately and efficiently recognize lead users. Additionally, we also explored the characteristics of CDC members’ contribution behavior. Since the entire crowdsourcing design process was implemented online, most of the participants’ behaviors, such as post topics and feedback, were shown to the community managers. These behaviors can well reflect the individuals’ creativity, which may assist enterprises in finding suitable candidates as partners in the NPD projects.
Our study also provides operators with a set of practical implications for the management of CDC and lead user search. First, our method does not need to implement large-scale social surveys, reducing the operators’ manpower costs in recognizing lead users. The potential groups of lead users can be automatically identified by the method, and then enterprises may choose suitable collaborators from these groups according to product development needs. Second, the CDC managers can provide the identified lead users with incentives to enhance their loyalty, which may ensure the stability of the NPD projects.
Therefore, our study has significant theoretical value and practical significance. Firstly, inviting users to participate in the design process is the need for innovative product R and D. In the field of open innovation, mobile Internet and the community have realized a crowdsourcing model with multi-role and large-scale social-ecological interaction. Crowdsourcing encourages users to integrate into the development process of innovative products and services, cross-discipline barriers, and quickly obtain users’ needs. The participation of more users can enable enterprises to obtain more affluent user needs, which are the traction and driving factors of new product design. The viewpoint of user contribution can guide enterprises to meet design needs and carry out sustainable development continuously.
Moreover, in the era of a knowledge network economy with developed Internet, only depending on the internal resources of enterprises for innovation activities cannot meet and adapt to the growing social market demand. As a critical external knowledge resource, lead users can master the key technology of innovative product design and a large amount of open external knowledge and can have the future demand to produce innovative results. Crowdsourcing provides enterprises with new opportunities to support the integration of lead users. Therefore, recruiting lead users can enable enterprises to obtain extensive and objective innovative ideas, generate more creative cases, and improve new products’ innovation quality. Furthermore, they can assist enterprises to achieve sustainable and open innovation.
In addition, the lead user identification method also has a certain degree of applicability in the crowdsourcing platform based on English. Firstly, this method can be extended to the English environment from the operational level. However, it should be attentive to the characteristics of the English language environment. Due to the significant differences between English and Chinese, the evaluation method and judgment mechanism need to be adjusted in combination with the context. In addition, the difference in grammatical structure between English and Chinese leads to the difference in thesauruses between the two languages, so it is necessary to build the corresponding thesaurus in text content analysis. Therefore, after completing the relevant optimization work, the research method proposed in this article can be popularized.

6. Conclusions and Limitations

Lead users are the most valuable customer groups in the NPD. Therefore, accurately identifying and locating lead users is significant for enterprises to effectively organize and manage sustainable open design activities. This study proposes a lead user identification method based on user behavior data and contribution content analysis and constructs a criterion system to evaluate the user’s leading-edge status. Our approach has several advantages, such as high efficiency, accuracy, and coverage compared with the manual method. The effectiveness of the proposed method in this work is verified by comparative analysis.
Some limitations restrict this study. The method of the article is to identify lead users by sorting the correlations of the community members. The greater the degree of relevance, the higher the user’s leading-edge status. However, selecting the relevance threshold to distinguish between lead users and regular users is not yet clear. Based on Liao’s research results [54], we considered that the operators might determine the threshold by two methods: 1. The total amount (S) of valid information in the content contributed by the user can be used as the threshold value. When the user’s contributed valid content is more than S, she/he can be regarded as the lead user. The selection of the S value depends on the improvement rate of the product proposed by the enterprise. 2. According to the ranking of correlations, the top F percent of the candidate users are lead users. The selection of the F value depends on factors such as the size of research samples, the extent to which the company intends to improve the product, and the size of the potential customers who may purchase the improved product. Future research may verify these two threshold determination methods and discuss the context in which each method applies.

Author Contributions

Conceptualization, J.Z., W.G., R.L., L.W., Z.F. and J.S.; methodology, J.Z., W.G., R.L. and L.W.; formal analysis, J.Z. and R.L.; data curation, J.Z., R.L. and Z.F.; writing—original draft preparation, J.Z. and R.L.; writing—review and editing, J.Z., R.L. and W.G. All authors have read and agreed to the published version of the manuscript.

Funding

This research was funded by THE NATIONAL KEY R AND D PROGRAM OF CHINA, grant number 2018YFB1700800, THE XIE YOUBAI DESIGN SCIENCE RESEARCH FOUNDATION, grant number XYB-DS-202002, and TIANJIN RESEARCH INNOVATION PROJECT FOR POSTGRADUATE STUDENTS, grant number 2021KJ082.

Acknowledgments

The authors would like to convey their appreciation and gratitude to the anonymous reviewers. Their remarks and suggestions were extremely insightful and enabled us to improve the quality of manuscript.

Conflicts of Interest

The authors declare no conflict of interest.

References

  1. Howe, J. The rise of crowdsourcing. Wired Mag. 2006, 14, 1–4. [Google Scholar]
  2. Liang, R.Y.; Guo, W.; Zhang, L.H.; Wang, L. Investigating sustained participation in open design community in China: The antecedents of user loyalty. Sustainability 2019, 11, 2420. [Google Scholar] [CrossRef] [Green Version]
  3. Guo, W.; Liang, R.Y.; Wang, L.; Peng, W. Exploring sustained participation in firm-hosted communities in China: The effects of social capital and active degree. Behav. Inf. Technol. 2017, 36, 223–242. [Google Scholar] [CrossRef]
  4. Liang, R.Y.; Zhang, L.H.; Guo, W. Investigating active users’ sustained participation in brand communities: Effects of social capital. Kybernetes 2019, 48, 2353–2372. [Google Scholar] [CrossRef]
  5. Bayus, B.L. Crowdsourcing new product ideas over time: An analysis of the Dell IdeaStorm community. Manag. Sci. 2013, 59, 226–244. [Google Scholar] [CrossRef]
  6. Kyriakou, H.; Nickerson, J.V.; Sabnis, G. Knowledge reuse for customization: Metamodels in an open design community for 3d printing. MIS Q. 2017, 41, 315–332. [Google Scholar] [CrossRef] [Green Version]
  7. Fernandes, S.; Cesario, M.; Barata, J.M. Ways to open innovation: Main agents and sources in the Portuguese case. Technol. Soc. 2017, 51, 153–162. [Google Scholar] [CrossRef]
  8. Schweisfurth, T.G.; Dharmawan, M.P. Does lead userness foster idea implementation and diffusion? A study of internal shopfloor users. Res. Policy 2019, 48, 289–297. [Google Scholar] [CrossRef]
  9. Urban, G.L.; von Hippel, E. Lead user analyses for the development of new industrial products. Manag. Sci. 1988, 34, 569–582. [Google Scholar] [CrossRef] [Green Version]
  10. Herstatt, C.; von Hippel, E. From experience: Developing new product concepts via the lead user method: A case study in a low-tech field. J. Prod. Innovat. Manag. 1992, 9, 213–221. [Google Scholar] [CrossRef] [Green Version]
  11. Tuarob, S.; Tucker, C.S. Automated discovery of lead users and latent product features by mining large scale social media networks. J. Mech. Des. 2015, 137, 071402. [Google Scholar] [CrossRef]
  12. Pajo, S.; Vandevenne, D.; Duflou, J.R. Automated feature extraction from social media for systematic lead user identification. Technol. Anal. Strateg. 2017, 29, 642–654. [Google Scholar] [CrossRef] [Green Version]
  13. Brem, A.; Bilgram, V. The search for innovative partners in co-creation: Identifying lead users in social media through netnography and crowdsourcing. J. Eng. Technol. Manag. 2015, 37, 40–51. [Google Scholar] [CrossRef]
  14. Guo, W.; Zheng, Q.; An, W.J.; Peng, W. User roles and contributions during the new product development process in collaborative innovation communities. Appl. Ergon. 2017, 63, 106–114. [Google Scholar] [CrossRef]
  15. Yan, J.K.; Leidner, D.E.; Benbya, H.; Zou, W. Examining interdependence between product users and employees in online user communities: The role of employee-generated content. J. Strategic. Inf. Syst. 2021, 30, 101657. [Google Scholar] [CrossRef]
  16. Sun, H.; Guo, W.; Shao, H.Y.; Rong, B. Dynamical mining of ever-changing user requirements: A product design and improvement perspective. Adv. Eng. Inform. 2020, 46, 101174. [Google Scholar] [CrossRef]
  17. Seidel, V.P.; Langner, B. Using an online community for vehicle design: Project variety and motivations to participate. Ind. Corp. Chang. 2015, 24, 635–653. [Google Scholar] [CrossRef]
  18. Zheng, Q.; Guo, W.; An, W.J.; Wang, L.; Liang, R.Y. Factors facilitating user projects success in co-innovation communities. Kybernetes 2018, 47, 656–671. [Google Scholar] [CrossRef]
  19. Jeppesen, L.B.; Lakhani, K.R. Marginality and problem-solving effectiveness in broadcast search. Organ. Sci. 2010, 21, 1016–1033. [Google Scholar] [CrossRef] [Green Version]
  20. Afuah, A.; Tucci, C.L. Crowdsourcing as a solution to distant search. Acad. Manag. Rev. 2012, 37, 355–375. [Google Scholar] [CrossRef]
  21. Li, M.; Jia, S.; Du, W. Fans as a source of extended innovation capabilities: A case study of xiaomi technology. Int. J. Inform. Manag. 2019, 44, 204–208. [Google Scholar] [CrossRef]
  22. Bilgram, V.; Brem, A.; Voigt, K. User-centric innovations in new product development—Systematic identification of lead users harnessing interactive and collaborative online-tools. Int. J. Innov. Manag. 2008, 12, 419–458. [Google Scholar] [CrossRef] [Green Version]
  23. Belz, F.M.; Baumbach, W. Netnography as a method of lead user identification. Creat. Innov. Manag. 2010, 19, 304–313. [Google Scholar] [CrossRef]
  24. von Hippel, E.; Franke, N.; Prügl, R. Pyramiding: Efficient search for rare subjects. Res. Policy 2009, 38, 1397–1406. [Google Scholar] [CrossRef]
  25. Lüthje, C. Characteristics of innovating users in a consumer goods field: An empirical study of sport-related product consumers. Technovation 2004, 24, 683–695. [Google Scholar] [CrossRef]
  26. Morrison, P.D.; Roberts, J.H.; Midgley, D.F. The nature of lead users and measurement of leading edge status. Res. Policy 2004, 33, 351–362. [Google Scholar] [CrossRef]
  27. Tietz, R.; Füller, J.; Herstatt, C. Signaling—An innovative approach to identify lead users in online communities. Cust. Interact. Cust. Integr. 2006, 2, 453–468. [Google Scholar]
  28. Hienerth, C.; Lettl, C. Perspective: Understanding the nature and measurement of the lead user construct. J. Prod. Innovat. Manag. 2017, 34, 3–12. [Google Scholar] [CrossRef]
  29. von Hippel, E.; Thomke, S.; Sonnack, M. Creating Breakthroughs at 3M. Harv. Bus. Rev. 1999, 7, 47–57. [Google Scholar] [CrossRef]
  30. Zhang, J.; Guo, W.; Zhao, N.; Wang, J.; Wang, L. New product information diffusion in firm–hosted online communities based on user influence. Inf. Technol. Control 2020, 49, 348–377. [Google Scholar] [CrossRef]
  31. Tang, X.; Yang, C. Identifying influential users in an online healthcare social network. In Proceedings of the 2010 IEEE International Conference on Intelligence and Security Informatics (ISI), Vancouver, BC, Canada, 23–36 May 2010. [Google Scholar] [CrossRef]
  32. Song, X.; Chi, Y.; Hino, K.; Tseng, B. Identifying opinion leaders in the blogosphere. In Proceedings of the Sixteenth ACM Conference on Conference on Information and Knowledge Management (CIKM’07), New York, NY, USA, 6–9 November 2007. [Google Scholar] [CrossRef]
  33. Hajian, B.; White, T. Modelling influence in a social network: Metrics and evaluation. In Proceedings of the IEEE International Conference on Social Computing, Boston, MA, USA, 9–11 October 2011. [Google Scholar] [CrossRef]
  34. Hazeldine, M.F.; Miles, M.P. An exploratory role analysis of opinion leaders, adopters, and communicative adopters with a dynamically continuous innovation. J. Bus. Res. 2010, 26, 117–129. [Google Scholar] [CrossRef]
  35. Cho, V.; Chan, A. A study on the influence of eWOM using content analysis: How do comments on value for money, product sophistication and experiential feeling affect our choices? Enterp. Inf. Syst. 2017, 11, 927–948. [Google Scholar] [CrossRef]
  36. Schreier, M.; Prügl, R. Extending lead-user theory: Antecedents and consequences of consumers’ lead userness. J. Prod. Innov. Manag. 2008, 25, 331–346. [Google Scholar] [CrossRef] [Green Version]
  37. Liang, R.Y.; Guo, W.; Yang, D.Q. Mining product problems from online feedback of Chinese users. Kybernetes 2017, 46, 572–586. [Google Scholar] [CrossRef]
  38. Huang, L.T.; Farn, C.K.; Jeng, H.T. Motivations for using information for decision making in virtual communities: The moderating effects of usage behavior. Pac. Asia. J. Assoc. Inf. 2012, 4, 1–18. [Google Scholar] [CrossRef] [Green Version]
  39. Li, Z.Y. Study on the reviews effectiveness sequencing model of online products. Data Anal. Knowl. Discov. 2013, 2013, 62–68. [Google Scholar] [CrossRef]
  40. NLPIR-ICTCLAS. Available online: http://ictclas.nlpir.org/ (accessed on 23 March 2020).
  41. Liang, R.Y.; Guo, W.; Zhang, L.H. Exploring oppositional loyalty and satisfaction in firm-hosted communities in China. Internet Res. 2020, 30, 487–510. [Google Scholar] [CrossRef]
  42. Meng, M.R.; Ding, S.C. Research on the credibility of online Chinese product reviews. Data Anal. Knowl. Discov. 2013, 29, 60–66. [Google Scholar]
  43. Narang, R.; Sarin, S.; Singh, P.; Goyal, R. Impact of reciprocity in information spreading using epidemic model variants. Information 2018, 9, 136. [Google Scholar] [CrossRef] [Green Version]
  44. Kubler, S.; Robert, J.; Derigent, W.; Voisin, A.; Traon, Y.L. A state-of the-art survey & testbed of fuzzy AHP (FAHP) applications. Expert. Syst. Appl. 2016, 65, 398–422. [Google Scholar] [CrossRef]
  45. Korvin, A.; Kleyle, R. Fuzzy analytical hierarchial processes. J. Intell. Fuzzy. Syst. 1999, 7, 387–400. [Google Scholar]
  46. Deng, J.L. Control problems of grey systems. Syst. Control. Lett. 1982, 1, 288–294. [Google Scholar] [CrossRef]
  47. Paramasivam, B. Investigation on the effects of damping over the temperature distribution on internal turning bar using Infrared fusion thermal imager analysis via SmartView software. Measurement 2020, 162. [Google Scholar] [CrossRef]
  48. Majchrzak, A.; Malhotra, A.; Zaggl, M. How open crowds self organize. Acad. Manag. Discov. 2020, 7, 104–129. [Google Scholar] [CrossRef]
  49. Graziuso, G.; Mancini, S.; Francavilla, A.; Grimaldi, M.; Guarnaccia, C. Geo-Crowdsourced sound level data in support of the community facilities planning. A Methodological Proposal. Sustainability 2021, 13, 5486. [Google Scholar] [CrossRef]
  50. Mora-Araus, M.; Velastegui-Montoya, A.; Jaramillo-Lindao, Y.; Apolo, H. Mapping the sound landscape during social isolation due to COVID-19. In Proceedings of the 2021 IEEE International Geoscience and Remote Sensing Symposium IGARSS, Brussels, Belgium, 11–16 July 2021; pp. 8340–8343. [Google Scholar] [CrossRef]
  51. Porter, A.; Tuertscher, P.; Huysman, M. Saving our oceans: Scaling the impact of robust action through crowdsourcing. J. Manag. Stud. 2019, 57, 246–286. [Google Scholar] [CrossRef] [Green Version]
  52. Choi, S.; Ng, A. Environmental and economic dimensions of sustainability and price effects on consumer responses. J. Bus. Ethics. 2011, 104, 269–282. [Google Scholar] [CrossRef]
  53. Ivanov, D.; Dolgui, A.; Sokolov, B. The impact of digital technology and Industry 4.0 on the ripple effect and supply chain risk analytics. Int. J. Prod. Res. 2018, 57, 1–18. [Google Scholar] [CrossRef]
  54. Liao, X.; Li, Z.; Xi, Y.X. The modeling and analyzing methods of weighted knowledge network for domain knowledge based on keywords clustering. Open Cybern. Syst. J. 2014, 8, 990–997. [Google Scholar] [CrossRef] [Green Version]
Figure 1. Research framework.
Sustainability 14 02094 g001
Figure 2. The user interface of Xiaomi Forum (Section of MI10/10 Pro).
Sustainability 14 02094 g002
Table 1. Introduction of indicators from the standard ranking system.
IndicatorsIntroduction
RankThe value of user rank.
TitleVirtual honor obtained by users when they reach a certain level.
PointA behavioral credential that users obtain by using community, browsing, posting, purchasing goods, etc.
Contribution ValueReflecting the depth of users’ participation in online activities.
Virtual CurrencyThe rewards that users receive through contributing behavior can be used for virtual consumption.
Table 2. The indicators of criterion system for lead user identification.
Standard CategoriesIntroductionCalculation Basis (Indicators)
Features of user’s contribution behaviorThese indicators can be employed to measure user’s interaction level, contribution frequency, product usage, etc., which reflect the individual’s active degree and experience.Contribution value
point
rank
Correlations between user-contributed content and innovationThese indicators can be utilized to reflect the user’s innovation capabilities, expertise, hierarchy, usage experience, etc.Words of product features/attributes
words of product issues/evaluative lexis
emotional words
effective length of comments
timeliness of comments
Table 3. Scale descriptions.
ScalesDefinitionIntroduction
aij = 1ImportantThe indicator i is more important than the indicator j
aij = 0.5Equally importantThe indicator i and indicator j are equally important
aij = 0UnimportantThe indicator j is more important than the indicator i
aij is the judgment value.
Table 4. Judgment matrix.
12345678
1- Words of product features/attributes0.5000.4390.5790.6940.7120.3360.2850.427
2- Words of product issues/evaluative lexis0.5610.5000.8730.5960.6910.3410.4920.554
3- Emotional words0.4210.1270.5000.3170.6060.2930.3620.481
4- Effective length of comments0.3060.4040.6830.5000.6370.3650.4020.346
5- Timeliness of comments0.2880.3090.3940.3630.5000.1380.1440.437
6- Contribution value0.6640.6590.7070.6350.8620.5000.5480.733
7- Rank0.7150.5080.6380.5980.8560.4520.5000.623
8- Point0.5730.4460.5190.6540.5630.2670.3770.500
Table 5. Fuzzy consistent matrix.
12345678
1- Words of product features/attributes0.5020.5410.4480.4810.4140.5850.5590.497
2- Words of product issues/evaluative lexis0.5410.5750.4810.5140.4470.6180.5920.530
3- Emotional words0.4480.4810.3810.4150.3480.5190.4930.431
4- Effective length of comments0.4810.5140.4150.4500.3830.5540.5280.466
5- Timeliness of comments0.4140.4470.3480.3830.3270.4970.4710.409
6- Contribution value0.5850.6180.5190.5540.4970.6600.6340.572
7- Rank0.5590.5920.4930.5280.4710.6340.6180.556
8- Point0.4970.5300.4310.4660.4090.5720.5560.488
Table 6. Results comparison of the two methods.
User IDThe Users’ Correlations Calculated by the Method Proposed in This Work (From High to Low)The User Ranking Analyzed by the Manual Method
1393598120.7923
10696967680.7566
1795264220.7075
955728810.63311
4375005960.622/
1581794520.6098
1030173610.57412
1391724520.5187
239572550.462/
1488698170.4309
/ represents the users who are not in the top 20.
Publisher’s Note: MDPI stays neutral with regard to jurisdictional claims in published maps and institutional affiliations.

