Article

Urban Planning Insights from Tree Inventories and Their Regulating Ecosystem Services Assessment

1
Department of Agricultural, Food and Environmental Sciences, University of Perugia, Via Borgo XX Giugno, 74, 06121 Perugia, Italy
2
PEFC Italia, Via Pietro Cestellini, 17/Int. 6, 06135 Perugia, Italy
3
United States Department of Agriculture, Forest Service, Northern Research Station, 5 Moon Library SUNY-ESF, Syracuse, NY 13210, USA
*
Author to whom correspondence should be addressed.
Sustainability 2022, 14(3), 1684; https://doi.org/10.3390/su14031684
Submission received: 22 December 2021 / Revised: 19 January 2022 / Accepted: 29 January 2022 / Published: 1 February 2022
(This article belongs to the Special Issue Green Infrastructures and Sustainable Development)

Abstract

:
With the uncertainties that our societies are living with (the COVID-19 pandemic and climate change), it becomes essential to provide urban planners and decision-makers with state-of-the-art and user-friendly methodologies to incorporate ecosystem service considerations into their designs for resilient cities. In this regard, urban forests play a crucial role. The quantification of the ecosystem services is geo-specific and needs studies in different urban contexts. At this scope, we evaluated the urban forest of a neighborhood of a densely built-up Italian city (Perugia) with a low level of urban greenery management and with a tree inventory still in progress. Furthermore, we defined a tool helpful in tree-planting decisions and management. This paper involves citizens in field research for trees inventory. Then, it uses i-Tree Eco to evaluate four ecosystem services (carbon storage and sequestration, pollution removal, and runoff avoided) provided by 373 inventoried urban trees belonging to 57 species. Our results show that Italian Municipal tree inventories do not adequately represent their urban forest and that citizens’ participation provides a cost-effective method for integrating field data. Finally, the paper develops an easy tool helping local administrations enhance the ecosystem services provisions in urban green design.

1. Introduction

In 2050, around 68% of the world’s population will live in urban areas, up from the current estimate of 55% [1], and cities need to increase their resilience to respond to numerous uncertainties (increment of inhabitants, the COVID-19 pandemic, climate change, etc.). To achieve this aim, many scholars evaluated that nature inside cities provides multiple ecosystem services. The Millennium Ecosystem Assessment [2] described ecosystem services as “the benefits people obtain from ecosystems” (p.38), and divided them into supporting, provisioning, regulating, and cultural services. In the urban landscape, trees are essential elements covering 26.5% of urban areas globally, and they provide benefits to the citizens belonging to the four categories of MEA [3]. Concerning the regulating services, urban forests sequester carbon, release oxygen [4], regulate local climate [5], particularly heat islands [6,7,8], reduce the speed of stormwater runoff [9], and help control air and water pollution [10].
Nevertheless, urban tree cover has been declining recently, driven by competition for land in densely built-up cities [11]. In this context, public and political advocacy for urban forest conservation and maintenance could be improved by quantifying the ecosystem services provided by urban trees [12]. Many scholars have researched this issue [6,13,14,15], improving the understanding and appreciation of the numerous benefits that urban forests can cater to, but the results are geo-specific and depend on the urban morphology [8]. Therefore, there is a need for more studies in different urban contexts.
Furthermore, local administrators struggle to define practical rules or suggestions starting from the results regarding local vegetation assessment and the quantification of the service it provides [16]. In this regard, some scholars have developed tools dedicated to enhancing particular ecosystem services, such as urban heat mitigation [8,17,18], stormwater management [19], and carbon stock [20]. Nevertheless, there is a lack of accessible tools to combine different ecosystem services and support decisions for urban green design, offering variable results varying the demanded services.

1.1. Dataset Review of the Urban Forest Inventories of Italian Cities

The Italian Law 10/2013, “Rules for the development of urban green spaces”, requires that all Italian municipalities with over 15,000 inhabitants have an inventory of their trees in public green areas [21]. A successive law decree [22] has organized the inventory into three levels. The first level is mandatory for all the municipalities and asks for general information on the urban public green areas (their identification, localization, and dimensional characteristic). Generally, this first level is used by local administrators to define the tenders for maintenance contractors. The second level is mandatory for the cities with more than 15,000 inhabitants and asks for information on every tree inside the areas belonging to the first level (e.g., localization, genus, species, tree’s characteristics, dimensions, and health). The third level is not mandatory and asks for information on other elements of the public green areas, such as details on shrubs, herbaceous covers, furniture, and equipment.
Since 2000, the Italian National Statistical Institute has acquired yearly data about urban greenery in 110 district capitals and metropolitan cities [23]. Since 2013, these data have also monitored the first two levels of the urban forest inventories (Table 1).
The table shows some issues in Italian urban tree inventories. Only a few municipalities use Geographical Information Systems (25%), and many of them currently do not comply with the provisions of the law (only 31% of the cities have completed their georeferenced urban forest inventory, as required by law).
Furthermore, the Italian legislation requires investigation of the consistency of trees only in public urban green areas [23]. At the same time, various studies [24,25] have indicated the breakdown between evaluation and planning of public and private green spaces as one of the main barriers to an effective ecosystem services assessment in urban contexts.
Considering all these limitations, Italian municipalities need rules to improve the efficiency of the field research, software to evaluate the provided ecosystem services, field research to enhance their knowledge about urban greenery in public and private areas, and easy tools to help in urban green areas design.

1.2. i-Tree Eco to Assess Ecosystem Services

Various software and frameworks have been developed (i.e., ARIES [26], Co$ting Nature [27], LUCI [28], InVEST [29], WaterWorld [30], and i-Tree [31]) to assess the ecosystem services provided by vegetation.
This study used i-Tree, a suite of freely available software tools developed by the USDA Forest Service through a collaborative public–private partnership. First released in 2006, i-Tree has grown to include various tools used globally and encompass trees in all contexts (urban and rural) [31]. In particular, we choose the i-Tree Eco tool as it has become an international standard in assessing ecosystem services and economic values derived specifically from urban trees. Numerous studies have been conducted to validate this tool through case study applications [20,32,33] and comparison and synergy with other tools such as allometric equations or direct measurements [34,35,36,37,38]. At first, i-Tree Eco has been extensively applied in the USA [39,40,41]; since 2010, it has been widely used in other countries and various climatic regions [32,35,37,42,43], and, in recent years, its use has also been spreading in southern Europe/Mediterranean contexts [33,44,45].
i-Tree Eco uses a five-step workflow (structure, function, service, benefits, and economic value) following the relationship between biodiversity, ecosystem function, and human well-being, known as “service cascades”, to assess ecosystem services values. The structure contains the basic information on the physical forest resource (i.e., number of trees, species composition, tree sizes, locations, leaf area, etc.). Various tree functions (i.e., gas exchange and tree growth) are estimated from the structure data and local weather data. These functions are then converted to multiple services (carbon storage, carbon sequestration, air pollution removal, and avoided runoff) based on other local data (i.e., pollution concentrations). These services are then turned into benefits (i.e., cleaner air and impacts on human health), and, finally, the benefits are converted to values based on various economic procedures [31]. Detailed methods and equations are given in Nowak [31].
Generally, scholars use i-Tree Eco in urban contexts to define urban green growth models [40], to assess a single ecosystem service as carbon storage [20], or air quality’s improvement [35,37], to evaluate the ecosystem services provided by urban parks [32,42], or to compare urban green designs in ecosystem service provision [33]. However, for politicians and urban planners to consider the value of tree-planting in their daily decisions, there is a lack in the development of tools that are easy to use [8,43].
Based on these considerations and to respond to the needs of the Italian municipalities discussed in the previous section, this paper uses i-Tree Eco to evaluate the ecosystem services provided by the urban forest of a densely populated neighborhood of an Italian city (Perugia). The goals of the research are (i) evaluating the effectiveness of citizens involvement in field research to realize tree inventories, (ii) evaluating the ecosystem services provided by urban trees in Mediterranean urban private and public areas of central Italy that are densely built-up, and (iii) developing an easy tool usable in decision support for urban green system planning and management able to strengthen the regulating ecosystem services.

2. Materials and Methods
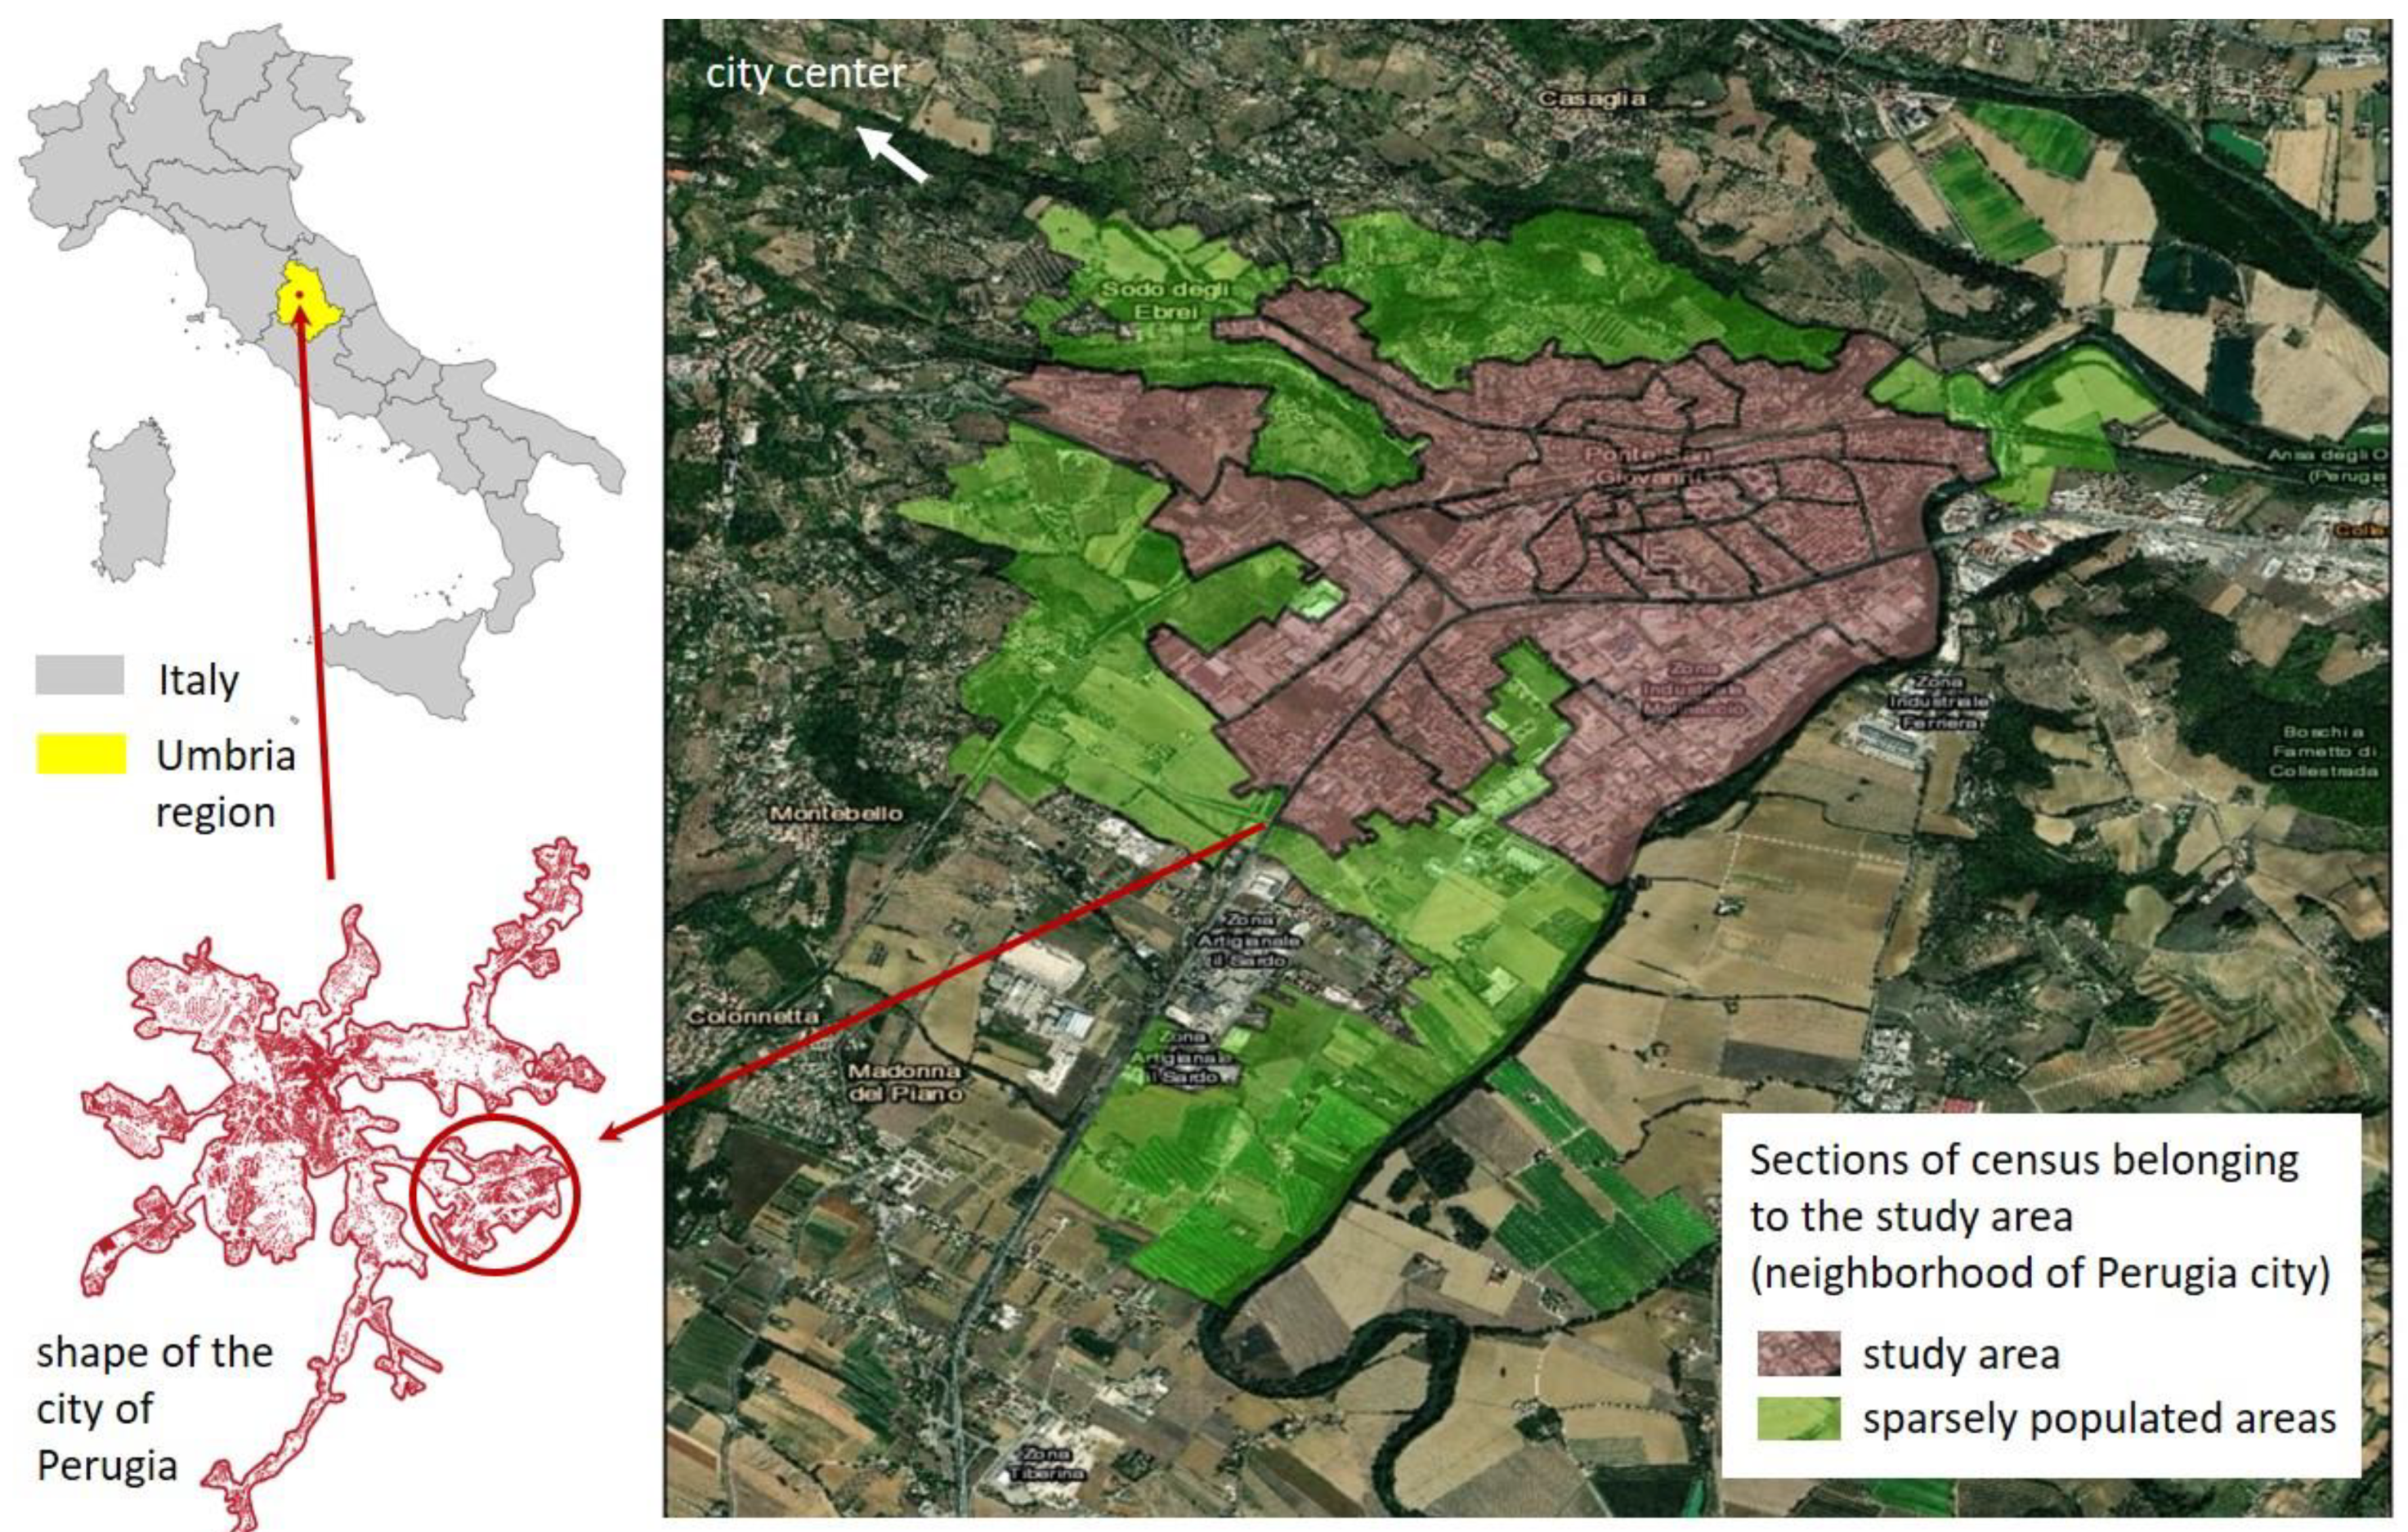
2.1. Study Area

The study area is a densely populated neighborhood of Perugia (a medium-sized municipality in central Italy), covering a surface of 475.5 ha and located at the end of one of the built-up branches of the city (Figure 1).
There are 11,988 inhabitants, with a relatively high population density of 2524 people per km2 [46]. There are many industrial buildings and companies and heavy car traffic. The study area has a limited number of public green areas, and the urban green areas are mainly private or marginal ones. Furthermore, the intense real estate development pressure reduces the availability of open spaces to be used as new green areas. For this reason, it also increases the need to enhance the ecosystem services provided by the currently available ones.
The study area is in a temperate zone with dry and hot summers. January is the coldest month, with an average temperature of 4.2 °C; the hottest month is July, with an average temperature of 23 °C. The annual average temperature is around 13 °C. Annual precipitation is generally between 800 and 900 mm with rare snowfalls.
With high population density, air pollution is a crucial topic. CO, O3, and SO2 concentrations are below the legal limit; NO2 concentrations are higher than those in spring, autumn, and winter (47 µg m−3). PM2.5 concentration is slightly under the limit during spring, summer, and autumn seasons, but winter values are almost double the legal limit (up to 70 μg m−3) [47].

2.2. Steps of the Method

Our method consists of six steps: (1) public dataset collection concerning weather data, pollution concentrations, and urban morphology; (2) participatory training meetings involving citizens; (3) definition of the plots object of field research; (4) data collection of urban greenery by citizens; (5) ecosystem service assessment; and (6) development of a geo-specific tool for supporting (6.1) tree-planting decisions to enhance ecosystem services provision and (6.2) economic evaluations differentiated by species in the definition of taxations linked to trees damaged or cut down (Figure 2).
(1) i-Tree Eco requires, as input, local environmental data (weather file, pollution concentration, and land cover) regarding the study area. Hourly meteorological data were obtained by the Decentralized Meteorological and Hydrological Functional center of the Umbria Region [48]. They refer to the meteorological station nearest to the study area. Local air pollution data were provided by the European Environment Agency [47].
(2) The method uses six training meetings to enhance the empowerment of neighborhood residents involved in field data collection: (i) What can urban trees do for me? Concept of ecosystem services, 2 hours training / (ii) What can you do for our urban trees? Reflections about spatial and management needs of trees for healthy growth in an urban context, 2 hours training. (iii) Observing the characteristic of urban trees and their environment. The method develops three sheets (Supplementary Materials A) dedicated to data collection regarding the whole plot, trees, and shrubs. We explained the rules for their use during this meeting,2 h. (iv) Visual evaluation of urban trees’ health, 2 hours training. (v) Field tests with experts. During this meeting, participants tested their ability in data collection helped by experts, 4 hours training (vi) Discussion about the main problems in surveys filled by citizens, 2 hours training
A forest engineer and an agronomist held the course in the local community headquarter called Pro Ponte association. Fifty people participated in the training course and half of them in the field collection. The activity was also communicated to all citizens through an article published in a local magazine.
(3) The whole surface of the study area is 475.5 ha. To facilitate the data collection for homogeneous urban contexts, i-Tree Eco suggests randomly selecting plots inside the study area to perform field research. We selected 100 randomly located 0.4 ha plots, using a software function developed to this aim (Figure 3).
(4) Plot locations were transferred to the Google Maps mobile application and used by the field data collectors. In August–October 2019, citizens collected coordinates, number of trees, tree cover ground percentage, and land use (Supplementary Materials A, Sheet 1). For every tree belonging to the plot, we trained people to collect a dedicated sheet with these contents (Supplementary Materials A, Sheet 2): tree ID number, planted/self-seeded/unknown, tree species, deciduous or coniferous (in case the species was not identifiable) type, diameter at breast height (DBH, cm), crown dieback percentage, total crown height (m), height to crown base, crown diameter (N-S/E-W), canopy missing percentage, number of crown light exposure sides, closest building direction and distance (meter and sexagesimal degrees), and general tree health condition (1 to 10). A manual hypsometer and/or the mobile app Distance Meter released by My Mobile Tools Dev were used to estimate trees’ height. In some cases, the trees’ height was measured empirically by comparing the detector height with objects of known size on the site (fences, buildings, walls, etc.). To identify the species, a dichotomous botanic key was adopted. During the last training meeting, the main difficulty that emerged from citizens concerned species identification. During the meeting, we decided with citizens to use the smartphone app Pl@ntNet. Pl@ntNet is a mobile app that allows users to identify plants by merely photographing them with the smartphone’s camera and then comparing the photo with a gallery of plants already identified by the community of users. The canopy area of trees was assessed using measurements of crown dimensions and the percentage of crown canopy missing. All field data were collected during the leaf-on season to assess tree canopies accurately. Furthermore, we asked participants to also collect data regarding shrub species, total height (m), the percentage in the volume of the species on the total of shrubs present in the plot, and general health conditions (Supplementary Materials A, Sheet 3).
(5) The characteristic of the urban forest collected during Step 4, and the local environmental data (step 1) were input into i-Tree Eco to assess the ecosystem services provided by the inventoried trees (annual pollution removal by trees: ozone, sulfur dioxide, nitrogen dioxide, carbon monoxide, and particulate matter less than 2.5 microns, carbon storage, annual sequestration, and avoided runoff).
i-Tree Eco uses multiple equations to evaluate every ecosystem service [31,49,50,51]. To estimate avoided runoff, the software uses hourly rain data and the characteristic of trees in several equations that calculate evapotranspiration and water interception by tree leaves [52]. Rain is also crucial in setting the periods of no-leaf suspension in pollution removal estimates [31,36]. In fact, during precipitation events, the accumulated PM2.5 is assumed to be washed off to the ground surface depending upon the magnitude of the precipitation event, modifying deposition velocity in variable quantities [53]. Air temperature data are also essential because temperature affects leaf stomatal opening, which is fundamental in the flux of pollutants, CO2, and other gases between the air and the leaf [34,54]. Wind tends to resuspend the particulate matter from the leaves’ surface, so PM2.5 is again spread in the air [36]. Windspeed influences the portion of particulate matter resuspension, so a resuspension percentage is applied to the pollution removal estimate according to windspeed [53]. Solar radiation, used as photosynthetically active radiation, is specific for study area location and contributes to pollution removal and carbon sequestration by leaves [54]. Then, i-Tree Eco allows for using the results of inventoried trees in random plots to estimate the ecosystem services provided by the urban greenery inside the whole study area.
(6) As a tool to support tree planting decisions, the method develops a list with performance values in ecosystem services provision differentiated by tree species. We selected adult and healthy trees from the inventoried ones and assessed their average performance to implement this list. Then, we developed two easy macros in Excel to support municipalities in urban green system design and management. (i) The first macro is helpful in green area design. The macro requests the required ecosystem service in the studied area as an input file. It then outputs a list of tree species belonging to the class with higher performance in providing the requested ecosystem service. For every ecosystem service, the method divides the dispersion between tree performance values into five classes with homogeneous width (tree species belonging to Class 1 have the higher performance, while tree species belonging to Class 5 have the lowest one).
(ii) The second macro is helpful in the definition of rules of taxation linked to tree damage or cut down. The macro requests as an input file the species of the tree that is damaged and/or that must be removed following private projects. Then, based on the class of structural value in which it falls, it helps define its value. Economic value was determined for the following ecosystem services: carbon storage, carbon sequestration, air pollution removal, and avoided runoff. Because there are no accurate local data, pollution removal values were estimated based on European median externality values [55] and Ben MAP regression equations [51] that incorporate user-defined population estimates in 2010; values are then converted to local currency. Prices were EUR 1100 per metric ton for carbon monoxide, EUR 9253 per metric ton for ozone, EUR 1382 per metric ton for nitrogen dioxide, EUR 503 per metric ton for sulfur dioxide, and EUR 321,227 per metric ton for PM2.5. Estimates for carbon storage and sequestration are based on the carbon value for the United States in 2015 [56] and converted to Euros for EUR 161 per metric ton. The value of avoided runoff was based on the national average value for the United States in 2005 [57,58] converted to Euros, and it was estimated as EUR 1.90 per m3.

3. Results

The tree cover percentage in the neighborhood is around 30%. The total area of the plots is 47,549 m2. We inventoried 373 trees, so the resulting tree density of the site is 78.44 trees per ha.
The studied trees belong to 57 species. The most common species are Olea europaea L. (9.9%), Pinus pinea L. (6.4%), and Laurus nobilis L. (6.2%) (Figure 4).
The majority (around 70%) of the trees are less than 30.5 cm DBH. The most common species have >50% of their trees with DBH less than 30.5, except for Pinus pinea L., Cupressus arizonica E. Greene, Cupressus sempervirens L., and Populus alba L., which have more large trees (Figure 5). During the field research, researchers and citizens also analyzed the shrubs. Supplementary Materials B (Sheet 2) reports the complete list of the 82 species (57 trees and 25 shrubs). The dominant species in terms of leaf area are two shrubs, Hedera helix L. and Rubus ulmifolius Schott., followed by several tree species.

Ecosystem Services Assessment and Development of Species-Specific List to Support Decisions in Tree-Planting

The inventoried 373 trees (Supplementary Materials B, Sheet 1) removed 46.2 kg of air pollution (O3, CO, NO2, PM2.5, and SO2) in 2019, with an associated value of EUR 748. Gross sequestration by studied trees is 2635 kg per year with an associated value of EUR 423, while trees have stored 63,806 kg of carbon (EUR 10,252). Populus alba L. has the best performance in carbon storage and sequestration (approximately 18% of the total carbon stored and 14.7% of all sequestered carbon) of the sampled species. The inventoried trees have reduced runoff by 88 m3 in 2019, with an associated value of EUR 169. In total, the 373 trees allow yearly saving of EUR 1291. Then, we have used i-Tree Eco to estimate the ecosystem services provided by the whole urban forest of the study area (Supplementary Materials B, Sheet 3.) Overall, i-Tree Eco estimated in the study area 40,680 trees (Standard Error 17%, ±6920 trees). The urban forest removed an estimated 6.46 metric tons of air pollution (O3, CO, NO2, PM2.5, and SO2) in 2019, with an associated value of EUR 111,000. Pollution removal is most significant for ozone (Figure 6), with 5 metric tons removed for a value of EUR 46,000.
Trees and shrubs’ removal of PM2.5 pollution is worth EUR 63,300, in the study area, which is 197 metric kilograms. In 2019, trees emitted an estimated 4.6 metric tons of volatile organic compounds (VOCs) (3.251 metric tons of isoprene and 1.322 metric tons of monoterpenes). Fifty percent of the urban forest’s VOC emissions were from Populus alba L. and Quercus pubescens Willd.
The gross sequestration by urban forest was 287.2 metric tons per year with an associated value of EUR 46,100 (Figure 7). Net carbon sequestration in the urban forest is about 243.7 metric tons. Trees are estimated to store 6960 metric tons of carbon (EUR 1.12 million). Populus alba L. stores and sequesters the most carbon (approximately 18% of the total carbon stored and 14.7% of all sequestered carbon) of the sampled species.
Urban forest reduced runoff by 12,300 m3 in 2019, with an associated value of EUR 23,000. In total, the urban forest in the study area has an economic value of 45 million euros.
Starting with differentiated evaluations per inventoried tree (Supplementary Materials B, Sheet 1), we have evaluated ecosystem service provision per tree species in terms of services provided on average by one adult healthy urban tree (Table 2). The table also reports columns referring to the classes of performance. We used the four classes evaluating the ecosystem services to build the first macro, while we used the last class’ column for the second macro. Then, we have provided the following table and the two macros to the Local Administration.

4. Discussion

4.1. Efficiency in Citizens Involvement in Field Research to Build Tree Inventories

Italian municipalities need to improve the efficiency of urban tree inventories. In this regard, this paper used the input data requested by i-Tree Eco to develop surveys that are usable during the field research (Supplementary Materials A). The paper showed that these surveys are fillable even by non-expert users. Indeed, i-Tree Eco requests as input data field research easy to perform. They do not require instrumental evaluations or the collection of contaminable information. Anyway, there is the need to provide basic training to recognize the tree and shrub species and do a visual assessment. The case study showed how citizens, after six training sessions, can collect the data autonomously. The resulting main issue was linked to species recognition, overcome by installing the Pl@ntNet app.
Citizen involvement in urban green system studies is not a novelty. Several studies directly involve citizens to evaluate their perception linked to the ecosystem services provided by trees in an urban environment [15], their recreational value [59], or their willingness to pay for ecosystem services [60].
Our results show as citizens’ participation should also be carefully considered for realizing the urban tree inventories since it provides a cost-effective method for obtaining field data. Furthermore, their involvement has provided the raising of the awareness toward the urban forest and understanding the crucial values of trees in the urban context by the citizens.

4.2. Tree Species Composition in the Urban Forests of Dense Built-Up Mediterranean Cities and Ecosystem Services Assessment

The study area is a neighborhood of Perugia. This municipality has its tree inventory ongoing (in 2022). Respecting the Italian law requirement [21,22], Perugia, like the other Italian municipalities, is building its municipal tree inventory only for public green areas (mostly urban parks) and along the main public roads [23]. The public online municipal dataset, which refers to the current state of the tree inventory, reports 48,261 trees (year 2019) [61]. The most common tree species are Pinus pinea L. (8%), Tilia spp. (7%), Cupressus sempervirens L. (6%), Quercus ilex L. (5%), Populus spp. (3.2%), Robinia pseudoacacia L. (3.2%); Aesculus hippocastanum L. (3%), Olea Europea L. (2.6%), Cupressus arizonica E. Greene (2.5%), and Acer spp. (2.3%). Unfortunately, this dataset does not report data necessary to use i-Tree Eco (Supplementary Materials A). Nevertheless, it is interesting to compare this urban forest composition with our results. A total of 70% of our inventoried trees are in private areas, 25% in private gardens, and only 6% in urban public parks. The dominant species in terms of the number of trees are Olea Europaea L. (9.9%), Pinus pinea L. (6.4%), and Laurus nobilis L. (6.2%) (Figure 4). Our results show that Italian municipal tree inventories do not adequately represent the urban forest in dense built-up Mediterranean cities. Indeed, they report only trees in public green areas. In contrast, in built-up areas, trees are mostly located in private plots and private gardens or have marginal functions linked to vegetation (i.e., trees at the entrance to a public building). It is essential to evaluate urban forests’ composition in public and private spaces to define their role in ecosystem services provision [24,25,62].
At the same time, local administrations struggle in building municipal tree inventories, even limited to public areas. In this regard, they could successfully involve citizens, as discussed in the previous section. In private areas, the simulation tool of i-Tree Eco could be beneficial, reducing the field research to random plots and using their results to simulate the performance of the whole. Our study reports results for 373 inventoried trees (Supplementary Materials B, Sheet 1), and then we simulated the urban forest composition for the whole study area (Supplementary Materials B, Sheet 3; Figure 6 and Figure 7). Our simulation has a standard error of 17% due to the low number of plots used to perform the field research. Nevertheless, we used the simulation’s results only to provide urban planners with approximative quantification using identifiable boundaries (the studied neighborhood). The local Administration could increase the area covered by the field research to decrease the standard error [31].
Looking more in-depth at the tree species composition, our results show the most representative tree species in our case study is Olea Europea L. Indeed, even if Olea Europea L. is a productive tree, in the urban contexts of central and southern Italy, it is a traditional tree also used with an ornamental aim, a common trait of various Mediterranean contexts such as Greece and Spain. As with most tree species primarily used for production purposes, Olea Europea L. has many varieties with different structural characteristics (e.g., the leaves size and diameter) and, consequently, variable performances linked to differentiated regulating services. i –Tree Eco does not consider the variety but only the species. In our case, the varieties are Frantoio, Leccino, Dolce Agogia, San Felice, Pendolino, and Maurino.
This consideration outlines the geo-specificity of these inventories in ecosystem services assessment. Figure 8 shows the distribution between the resulting values among tree species for our study area.
In the case study, the tree species with the higher performance in carbon storage are Populus alba L. (0.8184 metric ton per tree), Quercus pubescens Willd. (0.6740), Platanus x acerifolia Mill. (0.6161), and Cedrus spp. (0.5614). Other studies in Italy [34] confirm these species as a very effective carbon sink. Platanus x acerifolia Mill., Populus alba L., Quercus pubescens Willd., and Celtis australis L. are the best for carbon sequestration. The tree species with an amount of yearly avoided runoff higher than 0.7 m3 per tree are Cedrus spp. (0.9882 m3/year), Celtis australis L. (0.8643), Larix decidua Mill. (0.8007), Pinus halepensis Mill. (0.7789), and Juglans regia L. (0.7278). There is not much literature on the ranking of the best-performing trees for avoided runoff in urban areas, so new studies should be carried out from this perspective. Indeed, many studies report overall evaluations for the urban forest [7,19] and are not differentiated by species. Trees with the best performance in pollution removal are Cedrus spp., Celtis australis L., and Larix decidua Mill, which remove more than 0.3 × 10⁻⁴ metric tons of pollutants from the air yearly per tree. Thanks to their wide leaf area and roughness, they are excellent in pollution removal. The coniferous trees such as Cedrus spp. and Larix decidua Mill. also perform well thanks to the annual persistence of leaves on the plant [63], particularly for PM2.5 [64]. These results depend on the composition of the inventoried species, climate characteristics, and urban morphology.

4.3. Tool Supporting Decisions for Enhancing Ecosystem Services Provided by Urban Greenery

As discussed by Acosta et al. [8], the success of ecosystem service provision depends largely on the decisions made by urban planners and politicians. Thus, user-friendly tools to support their choices are fundamental.
Table 2 shows the evaluations of the regulating ecosystem services provided by an adult tree in good health status in a densely built-up Mediterranean area, differentiated by the 57 species studied. Using this list, we developed a tool composed of two Excel macros.
The first macro (the result of Step 6.1 of the method) requests as the input file the demanded ecosystem service and outputs the more performant tree species. In this way, the tree species choices could be based on the specific ecosystem service that the decision-maker needs to emphasize in each green area. For example, in urban areas subject to frequent flooding, urban designers will look for trees helping in stormwater management; along streets with high levels of traffic, they will look for trees helping pollution removal. Indeed, the concentration of pollutants varies along the roads or inside the parks [36], such as rainwater runoff and the consequent flooding problems [65]. At the same time, the need for carbon storage is not linked to localization specifications. Current mobile sensors could help administrations make timely assessments of the demand for ecosystem services in their contexts. Furthermore, the first macro could be used by a local administrator to encourage choices that enhance environmental benefits for the citizens. Municipalities could georeference the areas with frequent flooding then provide built-up potentialities increase to the residents, also transferable to other areas, if they plant inside their propriety trees belonging to Class 1 or 2 of “runoff avoided.” For Italian municipalities, it is usual to establish rules to transfer development rights inside their municipal plans linked to specific aims [65]. In the case of the Municipality of Perugia, the current implementation rules of its Urban Plan [66] offer an increase in built-up potentialities to citizens who implement a retrofit intervention in their buildings to improve their energy efficiency.
The second macro (the result of Step 6.2) requests, as the input, the tree species file. It provides, as a result, an economic evaluation of the species based on the average characteristics in the study area (state of health and dimension) of trees of the same species and on their performance in providing ecosystem services. This macro is valid in the definition of rules of taxation linked to tree damage or cut down (i.e., a citizen has the permit to cut down a private tree to realize a new building). The economic values refer to the years 2005–2007. Nevertheless, they are helpful to distribute the tree species in five classes of differentiated monetary value. The minimum value is 31 euro for Citrus limon (L.) Osbeck, and the maximum value is 4970 euro for Cedrus spp. The low weight of Citrus limon (L.) Osbeck is because the trees in the study area were not in good health (the climate of the study area does not allow to grow this species permanently outdoor through the year). Indeed, they should be kept in greenhouses during winter.
The two macros offer an easy tool usable by the end-users (e.g., urban planners, decision-makers, etc.) once the tree inventory and the i-Tree Eco evaluation are fully developed. Anyway, it is essential to define some limitations of the developed tool.
First, the study focuses on carbon storage, carbon sequestration, pollution removal, and runoff avoided, not considering other ecosystem services provided by the urban forest, such as cultural services [14,67] humidity control, temperature control [8], and many others. Other scholars developed tools for using ecosystem services assessment in urban planning, such as the one designed by Acosta et al. [8] for urban heat island mitigation by an urban forest, or the one developed by Menconi et al. [67] to enhance the cultural ecosystem services’ provision by urban parks. For local administrators, it would be essential to integrate these tools to achieve an overall awareness of the value of the urban forests.
Second, this could be a helpful tool in tree planting decisions, which goes alongside other data that could be used to filter tree species. These data refer to the characteristics of the tree, such as light requirement, its undesirable qualities (i.e., high mortality rates and allergenicity), resistance to breakage [18], and the characteristics of the urban area object of the design (shape, dimension, and function of the area) [36].
Finally, the tool helps in tree species selection, but the overall design of the green area influences its performance. In this regard, Tahvonen [19] described how to integrate water and vegetation better to enhance stormwater management, scaling up from pilot-scale garden designs to habitats at the block scale.

5. Conclusions

In recent sector legislation, Italian municipalities were identified as the keepers of urban greenery, despite suffering from a lack of funds and staff and often administering historic densely built-up cities where it is harder to plan and execute appropriate interventions. Therefore, local administrators require decision-making tools to evaluate and compare design alternatives and, thus, make more informed choices. The paper develops an easy tool to compare values of urban trees clearly and transparently and therefore allow, more competently, to make the best choices to increase the overall positive impact on the urban forest ecosystem.
We also evaluated the ecosystem services provided by the urban forest of a neighborhood of a densely built-up city of central Italy. Starting from geo-referred local climate data, land use, and field research to evaluate the local urban forest structure, we used i-Tree Eco to perform the evaluation. Our results show that the Italian Municipal tree inventories do not adequately represent the urban forest in dense built-up Mediterranean cities. Indeed, they report only trees in public green areas. In built-up areas, trees are primarily located in private plots, private gardens, or public open spaces with marginal functions linked to vegetation.
Finally, our method involved citizens in field research and shows that tree inventories can benefit from their engagement. The proposed method offers an interesting testimony to this effect and pushes us to design new applications to other areas and other cities to strengthen its validation.

Supplementary Materials

The following are available online at https://www.mdpi.com/article/10.3390/su14031684/s1. A. Data Collection Sheets for Field Research; B. The Dataset Containing the Results of the Field Research and the Ecosystem Services Estimation by i-Tree Eco.

Author Contributions

Conceptualization, L.R., A.B., and D.G.; methodology, L.R., D.J.N., and D.G.; software, L.R., M.E.M., and D.J.N.; validation, L.R. and D.J.N.; formal analysis, L.R. and D.J.N.; investigation, L.R. and A.B.; data curation, L.R., M.E.M., and D.G.; writing—original draft preparation, L.R. and M.E.M.; writing—review and editing, A.B., D.J.N., M.E.M., and D.G.; visualization, L.R., M.E.M., and D.G.; supervision, M.E.M., D.G., and D.J.N.; project administration, D.G. Luca Rossi (L.R.), Maria Elena Menconi (M.E.M.), David Grohmann (D.G.), Antonio Brunori (A.B.), David J. Nowak (D.J.N.). All authors have read and agreed to the published version of the manuscript.

Funding

This research received no external funding.

Institutional Review Board Statement

Not applicable.

Informed Consent Statement

Not applicable.

Conflicts of Interest

The authors declare no conflict of interest.

References

  1. United Nations. Department of Economic and Social Affairs. Population dynamics. Available online: https://population.un.org/wup/ (accessed on 20 September 2021).
  2. Millennium Ecosystem Assessment. Conceptual Framework. Ecosystems and Human Well-Being; Island Press: Washington, DC, USA, 2005; pp. 25–36. ISBN 978-1559633901. [Google Scholar]
  3. Nowak, D.J.; Crane, D.E. The Urban Forest Effects (UFORE) Model: Quantifying urban forest structure and functions. In Integrated Tools for Natural Resources Inventories in the 21st Century. Gen. Tech. Rep. NC-212; Hansen, M., Burk, T., Eds.; Department of Agriculture, Forest Service, North Central Forest Experiment Station: St. Paul, MN, USA, 2000; pp. 714–720. [Google Scholar]
  4. Wang, B.; Liu, Z.; Mei, Y.; Li, W. Assessment of ecosystem service quality and its correlation with landscape patterns in Haidian District, Beijing. Int. J. Environ. Res. Public Health 2019, 16, 1248. [Google Scholar] [CrossRef] [PubMed] [Green Version]
  5. Camps-Calvet, M.; Langemeyer, J.; Calvet-Mir, L.; Gómez-Baggethund, E. Ecosystem services provided by urban gardens in Barcelona, Spain: Insights for policy and planning. Environ. Sci. Policy 2016, 62, 14–23. [Google Scholar] [CrossRef]
  6. Lin, B.B.; Egerer, M.H.; Liere, H.; Jha, S.; Bichier, P.; Philpott, S.M. Local-and landscape-scale land cover affects microclimate and water use in urban gardens. Sci. Total Environ. 2018, 610, 570–575. [Google Scholar] [CrossRef] [PubMed]
  7. Ferrini, F.; Fini, A.; Mori, J.; Gori, A. Role of Vegetation as a Mitigating Factor in the Urban Context. Sustainability 2020, 12, 4247. [Google Scholar] [CrossRef]
  8. Acosta, M.; Vahdatikhaki, F.; Santos, J.; Hammad, A.; Dorée, A.G. How to bring UHI to the urban planning table? A data-driven modeling approach. Sustain. Cities Soc. 2021, 71, 102948. [Google Scholar] [CrossRef]
  9. Elliott, R.M.; Motzny, A.E.; Majd, S.; Chavez, F.J.V.; Laimer, D.; Orlove, B.S.; Culligan, P.J. Identifying linkages between urban green infrastructure and ecosystem services using an expert opinion methodology. Ambio 2020, 49, 569–583. [Google Scholar] [CrossRef] [PubMed]
  10. Schäffler, A.; Swilling, M. Valuing green infrastructure in an urban environment under pressure—The Johannesburg case. Ecol. Econ. 2013, 86, 246–257. [Google Scholar] [CrossRef]
  11. Nowak, D.J.; Greenfield, E.J. Recent changes in global urban tree and impervious cover. Urban For. Urban Green. 2020, 49, 126638. [Google Scholar] [CrossRef]
  12. Cimburova, Z.; Barton, D.N. The potential of geospatial analysis and Bayesian networks to enable i-Tree Eco assessment of existing tree inventories. Urban For. Urban Green. 2020, 55, 126801. [Google Scholar] [CrossRef]
  13. Dobbs, C.; Kendal, D.; Nitschke, C.R. Multiple ecosystem services and disservices of the urban forest establishing their connections with landscape structure and sociodemographics. Ecol. Indic. 2014, 43, 44–55. [Google Scholar] [CrossRef]
  14. Menconi, M.E.; Palazzoni, L.; Grohmann, D. Core themes for an urban green systems thinker: A review of complexity management in provisioning cultural ecosystem services. Urban For. Urban Green. 2021, 65, 127355. [Google Scholar] [CrossRef]
  15. Menconi, M.E.; Heland, L.; Grohmann, D. Learning from the gardeners of the oldest community garden in Seattle: Resilience explained through ecosystem services analysis. Urban For. Urban Green. 2020, 56, 126878. [Google Scholar] [CrossRef]
  16. Campbell, L.K. Getting farming on the agenda: Planning, policymaking, and governance practices of urban agriculture in New York City. Urban For. Urban Green. 2016, 19, 295–305. [Google Scholar] [CrossRef] [Green Version]
  17. Matasov, V.; Marchesini, L.B.; Yaroslavtsev, A.; Sala, G.; Fareeva, O.; Seregin, I.; Castaldi, S.; Vasenev, V.; Valentini, R. IoT monitoring of urban tree ecosystem services: Possibilities and challenges. Forests 2020, 11, 775. [Google Scholar] [CrossRef]
  18. Werbin, Z.R.; Heidari, L.; Buckley, S.; Brochu, P.; Butler, L.J.; Connolly, C.; Houttuijn Bloemendaal, L.; McCabe, T.D.; Miller, T.K.; Hutyra, L.R. A tree-planting decision support tool for urban heat mitigation. PLoS ONE 2020, 15, e0224959. [Google Scholar] [CrossRef]
  19. Tahvonen, O. Scalable green Infrastructure—The case of domestic private gardens in Vuores, Finland. Sustainability 2018, 10, 4571. [Google Scholar] [CrossRef] [Green Version]
  20. Fox, W.; Dwivedi, P.; Lowe, R.C.; Welch, S.; Fuller, M. Estimating Carbon Stock of Live Trees Located on the Main Campus of the University of Georgia. J. For. 2020, 118, 457–465. [Google Scholar] [CrossRef]
  21. Italian Ministry of Ecological Transition. L. 10/2013. Available online: https://www.mite.gov.it/sites/default/files/archivio/normativa/legge_14_01_2013_10.pdf (accessed on 5 September 2021).
  22. Italian Official Gazette. D.M. 63/2020. Available online: https://www.mite.gov.it/sites/default/files/archivio/allegati/GPP/2020/guri_dm_63_del_2020_verde_002.pdf (accessed on 5 September 2021).
  23. ISTAT. Urban Environment. Urban Greenery: Table 11.1 (Availability of Urban Green Area Per Person). Available online: https://www.istat.it/it/archivio/264816 (accessed on 5 September 2021).
  24. Biernacka, M.; Kronenberg, J. Classification of institutional barriers affecting the availability, accessibility and attractiveness of urban green spaces. Urban For. Urban Green. 2018, 36, 22–33. [Google Scholar] [CrossRef]
  25. Cilliers, S.; Cilliers, J.; Lubbe, R.; Siebert, S. Ecosystem services of urban green spaces in African countries-perspectives and challenges. Urban Ecosyst. 2013, 16, 681–702. [Google Scholar] [CrossRef]
  26. Villa, F.; Bagstad, K.J.; Voigt, B.; Johnson, G.W.; Portela, R.; Honzák, M.; Batker, D. A Methodology for Adaptable and Robust Ecosystem Services Assessment. PLoS ONE 2014, 9, e91001. [Google Scholar] [CrossRef]
  27. Prybutok, S.; Newman, G.; Atoba, K.; Sansom, G.; Tao, Z. Combining Co$ting Nature and Suitability Modeling to Identify High Flood Risk Areas in Need of Nature-Based Services. Land 2021, 10, 853. [Google Scholar] [CrossRef] [PubMed]
  28. Jackson, B.; Pagella, T.; Sinclair, F.; Orellana, B.; Henshaw, A.; Reynolds, B.; Mcintyre, N.; Wheater, H.; Eycott, A. Polyscape: A GIS mapping framework providing efficient and spatially explicit landscape-scale valuation of multiple ecosystem services. Landsc. Urban Plan. 2013, 112, 74–88. [Google Scholar] [CrossRef]
  29. Hamel, P.; Guerry, A.D.; Polasky, S.; Han, B.; Douglass, J.A.; Hamann, M.; Janke, B.; Kuiper, J.J.; Levrel, H.; Liu, H.; et al. Mapping the benefits of nature in cities with the InVEST software. Npj Urban Sustain. 2021, 1, 25. [Google Scholar] [CrossRef]
  30. Mulligan, M. Climate change and food-water supply from Africa’s drylands: Local impacts and teleconnections through global commodity flows. Int. J. Water Resour. Dev. 2015, 31, 450–460. [Google Scholar] [CrossRef]
  31. Nowak, D.J. Understanding i-Tree: Summary of programs and methods. In General Technical Reports NRS-200; Department of Agriculture, Forest Service, Northern Research Station: Madison, WI, USA, 2020; 100p. [Google Scholar]
  32. Yarnvudhi, A.; Leksungnoen, N.; Tor-Ngern, P.; Premashthira, A.; Thinkampheang, S.; Hermhuk, S. Evaluation of Regulating and Provisioning Services Provided by a Park Designed to Be Resilient to Climate Change in Bangkok, Thailand. Sustainability 2021, 13, 13624. [Google Scholar] [CrossRef]
  33. Zanzi, A.; Andreotti, F.; Vaglia, V.; Alali, S.; Orlando, F.; Bocchi, S. Forecasting Agroforestry Ecosystem Services Provision in Urban Regeneration Projects: Experiences and Perspectives from Milan. Sustainability 2021, 13, 2434. [Google Scholar] [CrossRef]
  34. Baraldi, R.; Chieco, C.; Neri, L.; Facini, O.; Rapparini, F.; Morrone, L.; Rotondi, A.; Carriero, G. An integrated study on air mitigation potential of urban vegetation: From a multi-trait approach to modeling. Urban For. Urban Green. 2019, 41, 127–138. [Google Scholar] [CrossRef]
  35. Riondato, E.; Pilla, F.; Sarkar Basu, A.; Basu, B. Investigating the effect of trees on urban quality in Dublin by combining air monitoring with i-Tree Eco model. Sustain. Cities Soc. 2020, 61, 102356. [Google Scholar] [CrossRef]
  36. Szkop, Z. Evaluating the sensitivity of the i-Tree Eco pollution model to different pollution data inputs: A case study from Warsaw, Poland. Urban For. Urban Green. 2020, 55, 126859. [Google Scholar] [CrossRef]
  37. Su, T.H.; Lin, C.S.; Lin, J.C.; Liu, C.P. Dry deposition of particulate matter and its associated soluble ions on five broadleaved species in Taichung, central Taiwan. Sci. Total Environ. 2021, 753, 141788. [Google Scholar] [CrossRef]
  38. Pace, R.; Guidolotti, G.; Baldacchini, C.; Pallozzi, E.; Grote, R.; Nowak, D.J.; Calfapietra, C. Comparing i-Tree Eco Estimates of Particulate Matter Deposition with Leaf and Canopy Measurements in an Urban Mediterranean Holm Oak Forest. Environ. Sci. Technol. 2021, 55, 6613–6622. [Google Scholar] [CrossRef] [PubMed]
  39. Nowak, D.J.; Crane, D.E.; Stevens, J.C.; Hoehn, R.E.; Walton, J.T.; Bond, J. A ground-based method of assessing urban forest structure and ecosystem services. Aboriculture Urban For. 2008, 34, 347–358. [Google Scholar] [CrossRef]
  40. Berland, A. Urban tree growth models fo two nearby cities show notable differences. Urban Ecosyst. 2020, 23, 1253–1261. [Google Scholar] [CrossRef]
  41. Lin, J.; Kroll, C.N.; Nowak, D.J. An uncertainty framework for i-Tree eco: A comparative study of 15 cities across the United States. Urban For. Urban Green. 2021, 60, 127062. [Google Scholar] [CrossRef]
  42. Millward, A.A.; Sabir, S. Benefits of a forested urban park: What is the value of Allan Gardens to the city of Toronto, Canada? Landsc. Urban Plan. 2011, 100, 177–188. [Google Scholar] [CrossRef]
  43. Endreny, T.; Santagata, R.; Perna, A.; Stefano, C.D.; Rallo, R.F.; Ulgiati, S. Implementing and managing urban forests: A much needed conservation strategy to increase ecosystem services and urban well-being. Ecol. Model. 2017, 360, 328–335. [Google Scholar] [CrossRef]
  44. Barò, F.; Calderòn-Argelich, A.; Langemeyer, J.; Connolly, J.J.T. Under one canopy? Assessing the distributional environmental justice implications of street tree benefits in Barcelona. Environ. Sci. Policy 2019, 102, 54–56. [Google Scholar] [CrossRef]
  45. Cariñanos, P.; Marinangeli, F. An uptaded proposal of the Potential Allergenicity of 150 ornamental trees and shrubs in Medirettanean Cities. Urban For. Urban Green. 2021, 63, 127218. [Google Scholar] [CrossRef]
  46. Demographic Statistic ISTAT. Available online: http://demo.istat.it/bilmens/index.php?anno=2020&lingua=ita (accessed on 5 September 2021).
  47. European Environment Agency. Climatic Data and Pollution. Available online: https://www.eea.europa.eu/themes/air/explore-air-pollution-data (accessed on 5 September 2021).
  48. Umbria Region, Hydrographic Regional Service. Available online: https://www.regione.umbria.it/ambiente/servizio-idrografico (accessed on 5 September 2021).
  49. Coville, R.; Endreny, T.; Nowak, D.J. Modeling the impact of urban trees on hydrology. In Forest-Water Interactions. Ecological Studies (Analysis and Synthesis); Levia, D., Carlyle-Moses, D., Iida, S., Michalzik, B., Nanko, K., Tischer, A., Eds.; Springer: Cham, Switzerland, 2020; Volume 240, pp. 459–487. [Google Scholar]
  50. Nowak, D.J.; Greenfield, E.J.; Hoehn, R.; LaPoint, E. Carbon storage and sequestration by trees in urban and community areas of the United States. Environ. Pollut. 2013, 178, 229–236. [Google Scholar] [CrossRef] [Green Version]
  51. Nowak, D.J.; Hirabayashi, S.; Bodine, A.; Greenfield, E.J. Tree and forest effects on air quality and human health in the United States. Environ. Pollut. 2014, 193, 119–129. [Google Scholar] [CrossRef] [Green Version]
  52. Hirabayashi, S. i-Tree Eco Precipitation Interception Model Descriptions. 2015. Available online: http://www.itreetools.org/eco/resources/iTree_Eco_Precipitation_Interception_Model_Descriptions.pdf (accessed on 10 December 2021).
  53. Nowak, D.J.; Hirabayashi, S.; Bodine, A.; Hoehn, R. Modeled PM2.5 removal by trees in ten U.S. cities and associated health effects. Environ. Pollut. 2013, 178, 395–402. [Google Scholar] [CrossRef] [PubMed]
  54. Baldocchi, D.D.; Hicks, B.B.; Camera, P. A canopy stomatal resistance model for gaseous deposition to vegetated surfaces. Atmos. Environ. 1987, 21, 91–101. [Google Scholar] [CrossRef]
  55. Van Essen, H.; Schroten, A.; Otten, M.; Sutter, D.; Schreyer, C.; Zandonella, R.; Maibach, M.; Doll, C. External Costs of Transport In Europe; CE Delft: Delft, Netherlands, 2011. [Google Scholar]
  56. U.S. Environmental Protection Agency. The Social Cost of Carbon. 2015. Available online: http://www.epa.gov/climatechange/EPActivities/economics/scc.html (accessed on 10 December 2021).
  57. McPherson, E.G.; Simpson, J.R. Carbon Dioxide Reduction through Urban Forestry: Guidelines for Professional and Volunteer Tree Planters; General Technical Report PSW-171; U.S. Department of Agriculture, Forest Service, Pacific Southwest Research Station: Albany, CA, USA, 1999.
  58. McPherson, E.G.; Simpson, J.R.; Peper, P.J.; Crowell, A.M.N.; Xiao, Q. Northern California Coast Community Tree Guide: Benefits, Costs, and Strategic Planting; General Technical Report PSW-GTR-228; U.S. Department of Agriculture, Forest Service, Pacific Southwest Research Station: Albany, CA, USA, 2010.
  59. Sacchelli, S.; Fabbrizzi, S.; Geri, F.; Ciolli, M. Place-based policy-making and community security: A decision support system for integrated planning of urban ecosystem services and disservices. Green Energy Technol. 2018, 0, 95–104. [Google Scholar] [CrossRef]
  60. He, B.J.; Zhao, D.; Xiong, K.; Qi, J.; Ulpiani, G.; Pignatta, G.; Prasad, D.; Jones, P. A framework for addressing urban heat challenges and associated adaptive behavior by the public and the issue of willingness to pay for heat resilient infrastructure in Chongqing, China. Sustain. Cities Soc. 2021, 75, 103361. [Google Scholar] [CrossRef]
  61. Perugia. Tree Balance 2014–2018. Available online: https://www.lifeclivutspringames.education/wp-content/uploads/2020/04/BilancioArboreoPerugia.pdf (accessed on 5 September 2021).
  62. Shackleton, C.M.; Blair, A.; De Lacy, P.; Kaoma, H.; Mugwagwa, N.; Dalu, M.T.; Walton, W. How important is green infrastructure in small and medium-sized towns? Lessons from South Africa. Landsc. Urban Plan. 2018, 180, 273–281. [Google Scholar] [CrossRef]
  63. Dasch, M.J. Measurement of dry deposition to surface in deciduous and pine canopies. Environ. Pollut. 1987, 44, 261–277. [Google Scholar] [CrossRef]
  64. Wu, J.; Wang, Y.; Qiu, S.; Peng, J. Using the modified i-Tree Eco model to quantify air pollution removal by urban vegetation. Sci. Totale Environ. 2019, 688, 673–683. [Google Scholar] [CrossRef]
  65. Martinico, F.; La Rosa, D.; Privitera, R. Green oriented urban development for urban ecosystem services provision in a medium sized city in southern Italy. IForest 2014, 7, 385–395. [Google Scholar] [CrossRef] [Green Version]
  66. Municipalty of Perugia, Urban Plan. Implementation Rules. 2021. Available online: https://www.comune.perugia.it/resources/prg/TUNA.pdf (accessed on 5 September 2021).
  67. Menconi, M.E.; Sipone, A.; Grohmann, D. Complex Systems Thinking Approach to Urban Greenery to Provide Community-Tailored Solutions and Enhance the Provision of Cultural Ecosystem Services. Sustainability 2021, 13, 11787. [Google Scholar] [CrossRef]
Figure 1. Study area. The neighborhood has a few sections sparsely populated that we did not consider in this study.
Sustainability 14 01684 g001
Figure 2. Methodology flowchart.
Sustainability 14 01684 g002
Figure 3. Waypoints for the 100 random plots generated by i-Tree Eco for collecting field data. The zoom shows an example of seven plots.
Sustainability 14 01684 g003
Figure 4. Inventoried trees. Tree species composition.
Sustainability 14 01684 g004
Figure 5. Top 10 species and their percentage distribution by diameter class (DBH–stem diameter at 1.37 m).
Sustainability 14 01684 g005
Figure 6. Annual pollution removal (bars) and economic value (points) by the urban forest.
Sustainability 14 01684 g006
Figure 7. Estimated annual gross carbon sequestration (bars) and economic value (points) for urban tree species with the most significant sequestration.
Sustainability 14 01684 g007
Figure 8. Box-plots showing the distribution between values of performance in providing ecosystem services of inventoried tree species.
Sustainability 14 01684 g008
Table 1. The monitoring results regarding the urban forest inventories in Italian district capitals and metropolitan cities (31 December 2020).
Percentage of Urban Forest Inventory Implemented First-LevelSecond-Level
%%
for the whole municipal green area4733
partial/in progress4453
total9186
Inventories using georeferenced data%%
for the whole municipal green area3131
partial/in progress3632
total6563
within a geographical information system25
Table 2. Evaluations of the regulating ecosystem services provided by an adult tree in good health status in a densely built-up Mediterranean area, differentiated by the 57 species studied. The species are listed in alphabetic order. They rank from Class 1 (excellent performance in providing the studied ecosystem service) to Class 5 (low performance).
SpeciesCarbon Storage Gross Carbon SequestrationAvoided RunoffPollution RemovalStructural Value
Class(Metric ton)Class(Metric ton/yr)Class(m3/yr)Class(Metric ton/yr)Class(EUR)
Abies alba Mill.51.04 × 10−1 54.60 × 10−351.70 × 10⁻¹ 59.17 × 10⁻⁵ 51006
Acacia Mill.54.0 × 10−452.00 × 10−456.80 × 10⁻³ 547
Acer campestre L.53.67 × 10−252.80 × 10−355.98 × 10−253.33 × 10⁻⁵ 5171
Acer pseudoplatanus L.58.09 × 10−255.60 × 10−351.69 × 10⁻¹ 59.17 × 10⁻⁵ 5854
Acer spp.34.18 × 10−1
Ailanthus altissima Mill.57.20 × 10−351.40 × 10−359.82 × 10−255.24 × 10⁻⁵ 592
Carpinus betulus L.53.84 × 10−256.10 × 10−351.53 × 10⁻¹ 59.17 × 10⁻⁵ 5597
Cedrus spp.25.61 × 10−1 41.20 × 10−219.88 × 10⁻¹ 15.16 × 10−414970
Celtis australis L.42.47 × 10−1 31.61 × 10−218.64 × 10⁻¹ 14.59 × 10−441689
Cercis siliquastrum L.52.46 × 10−252.80 × 10−351.19 × 10⁻¹ 59.17 × 10⁻⁵ 5471
Citrus limon (L.) Osbeck56.00 × 10−453.00 × 10−451.08 × 10⁻² 547
Corylus avellana L.53.06 × 10−252.50 × 10−351.71 × 10⁻¹ 59.17 × 10⁻⁵ 5508
Crataegus monogyna Jacq.51.28 × 10−252.50 × 10−351.44× 10⁻¹ 56.88 × 10⁻⁵ 5213
Cupressus arizonica E. Greene41.95 × 10−1 46.20 × 10−334.32 × 10⁻¹ 32.25 × 10−441755
Cupressus sempervirens L.42.84 × 10−1 49.20 × 10−343.43 × 10⁻¹ 41.78 × 10−432592
Cycas revoluta Thunb.59.40 × 10−351.00 × 10−443.13 × 10⁻¹ 41.84 × 10−45369
Eriobotrya japonica (Thunb.) Lindl. 57.09 × 10−256.00 × 10−351.46 × 10⁻¹ 56.88 × 10⁻⁵ 5736
Ficus carica L.51.06 × 10−1 46.20 × 10−351.96× 10⁻¹ 51.05 × 10−45788
Ilex aquifolium L.54.40 × 10−253.90 × 10−357.86 × 10⁻² 5567
Juglans regia L.42.04 × 10−1 41.19 × 10−227.28 × 10⁻¹ 23.85 × 10−45890
Lagerstroemia indica L.53.97 × 10−254.10 × 10−356.14 × 10−253.44 × 10⁻⁵ 5521
Larix decidua Mill.51.21 × 10−1 55.00 × 10−318.01 × 10⁻¹ 14.59 × 10−441457
Laurus nobilis L.52.25 × 10−252.50 × 10−357.24 × 10−253.59 × 10⁻⁵ 5262
Ligustrum lucidum Aiton56.98 × 10−253.00 × 10−354.85 × 10⁻² 52.29 × 10⁻⁵ 5365
Ligustrum sinense Lour.52.46 × 10−351.83 × 10−451.31 × 10⁻² 559
Ligustrum vulgare L.51.10 × 10−353.00 × 10−451.11 × 10⁻² 531
Magnolia grandiflora L.42.10 × 10−1 49.90 × 10−342.44 × 10⁻¹ 41.22 × 10−441330
Magnolia liliiflora Desr.52.85 × 10−253.00 × 10−356.49 × 10−254.59 × 10⁻⁵ 5440
Malus domestica Borkh.51.28 × 10−253.20 × 10−358.59 × 10⁻² 5171
Morus nigra L.51.42 × 10−1 47.80 × 10−342.06 × 10⁻¹ 59.17 × 10⁻⁵ 5695
Nerium oleander L.54.30 × 10−357.00 × 10−453.24 × 10−251.31 × 10⁻⁵ 587
Olea europaea L.51.26 × 10−1 47.00 × 10−359.27 × 10−254.71 × 10⁻⁵ 5814
Ostrya carpinifolia Scop.51.87 × 10−252.40 × 10−354.99 × 10⁻² 5449
Picea abies (L.) H. Karst.42.03 × 10−1 49.70 × 10−334.84 × 10⁻¹ 32.57 × 10−441534
Pinus halepensis Mill.33.77 × 10−1 49.10 × 10−327.79 × 10⁻¹ 23.67 × 10−423055
Pinus nigra J.F. Arnold58.19 × 10−253.20 × 10−343.49 × 10⁻¹ 41.84 × 10−45981
Pinus pinea L.42.59 × 10−1 47.90 × 10−343.57 × 10⁻¹ 41.87 × 10−432647
Pinus sylvestris L. 42.99 × 10⁻¹ 55.70 × 10−342.12 × 10⁻¹ 41.22 × 10−432680
Platanus x acerifolia (Aiton) Willd.26.16 × 10−1 13.02 × 10−226.48 × 10⁻¹ 23.67 × 10−423377
Populus alba L.18.18 × 10−1 12.76 × 10−226.34 × 10⁻¹ 23.27 × 10−432088
Prunus amygdalus Batsch54.98 × 10−254.60 × 10−342.63 × 10⁻¹ 59.17 × 10⁻⁵ 5533
Prunus armeniaca L.59.69 × 10−246.20 × 10−351.27 × 10⁻¹ 56.88 × 10⁻⁵ 5547
Prunus avium L.51.39 × 10−1 41.03 × 10−251.64 × 10⁻¹ 58.56 × 10⁻⁵ 5787
Prunus cerasifera Ehrh. 51.85 × 10−252.70 × 10−356.19 × 10⁻² 5245
Prunus cerasus L.54.00 × 10−453.00 × 10−456.20 × 10⁻³ 536
Prunus domestica L.51.37 × 10−1 55.30 × 10−355.39 × 10−253.06 × 10⁻⁵ 5511
Prunus persica (L.) Batsch51.00 × 10−251.80 × 10−354.07 × 10−251.83 × 10⁻⁵ 5168
Punica granatum L. 51.06 × 10−251.10 × 10−352.63 × 10−252.29 × 10⁻⁵ 5177
Pyrus communis L.52.83 × 10−255.00 × 10−351.17 × 10⁻¹ 59.17 × 10⁻⁵ 5533
Quercus ilex L.42.98 × 10−1 41.15 × 10−242.32 × 10⁻¹ 41.18 × 10−441763
Quercus pubescens Willd.16.74 × 10−1 22.16 × 10−235.42 × 10⁻¹ 32.85 × 10−441886
Quercus robur L.54.41 × 10−254.10 × 10−357.62 × 10⁻² 5605
Rhamnus alaternus L.52.40 × 10−351.30 × 10−354.20 × 10⁻³ 564
Robinia pseudoacacia L.56.40 × 10−254.30 × 10−342.02 × 10⁻¹ 51.08 × 10−45303
Thuja L. 53.57 × 10−251.40 × 10−351.69 × 10⁻¹ 58.51 × 10⁻⁵ 5757
Tilia cordata Mill.54.69 × 10−255.70 × 10−342.64 × 10⁻¹ 59.17 × 10⁻⁵ 41098
Washingtonia robusta H.Wendl.53.40 × 10−351.00 × 10−453.73 × 10−253.06 × 10⁻⁵ 5844
Publisher’s Note: MDPI stays neutral with regard to jurisdictional claims in published maps and institutional affiliations.

