


Effects of Road Components and Roadside Vegetation on Temperature Reduction in Seoul Considering Air, Wet-Bulb Globe, and Surface Temperatures

Department of Highway and Transportation Research, Korea Institute of Civil Engineering and Building Technology, 283, Goyangdae-Ro, Ilsanseo-Gu, Kyounggi-Do, Goyang-si 10223, Republic of Korea
Sustainability 2022, 14(24), 16663; https://doi.org/10.3390/su142416663
Submission received: 2 November 2022
/
Revised: 5 December 2022
/
Accepted: 5 December 2022
/
Published: 13 December 2022
(This article belongs to the Topic Sustainable Transportation)
Abstract
:Urbanization has resulted in high temperatures in cities, which are exacerbated by an increase in urban impervious surfaces (road space). This study investigated the effect of urban road characteristics on roadside temperature. Different temperature indices were measured at four sites in Seoul with different road designs by using weather measuring devices and infrared thermal cameras. The differences between air and roadside air temperatures decreased from site 1 (no vegetation) to site 4 (roadside trees and vegetated medians). The analysis results showed that roadside wet-bulb globe and surface thermal temperatures sensitively changed according to road characteristics, unlike air temperature. The lowest temperatures were consistently observed at site 4. This cooling tendency was the strongest in the afternoon, which indicates the effectiveness of vegetation for preventing the commonly observed temperature rise in the afternoon. That is, roadside trees and vegetation in the median strip can prevent temperature rise and contribute to urban temperature reduction. Therefore, more roadside trees and median planting, as well as taller trees and denser vegetation along roads, can be used to provide a greater reduction of roadside temperatures and to improve urban climates.
1. Introduction
Urbanization has caused the urban heat island (UHI) effect, which refers to the phenomenon that cities are typically warmer than the surrounding rural areas [1]. One of the main causes of UHI effect is the increase of impervious surfaces in cities, which prevent natural evaporation and increase the air temperature by reflecting radiant heat to the air [2,3,4,5]. Roads represent a major impervious surface in urban areas. In Seoul, Republic of Korea, more than 73% of the surface area is impervious, of which 70% is paved urban road [6]. As roads exhibit higher surface temperatures than other urban surfaces, there has been a recent shift in urban street design from fast and efficient roads to more environmental and sustainable roads [7]. These sustainable roads are characterized by green spaces which may include roadside trees and shrubs, and other vegetation along the median strip, all of which promote natural evaporation and provide shade from the sun [8,9,10,11].
However, most existing studies focus on the effects of land use and roadside vegetation on air temperature, and relatively little research has been conducted on urban street temperature change. Yoon [12] reported that roadside air temperatures are higher near paved surfaces and barren land than near roadsides with vegetation, and wind velocity can delay temperature reduction. Tsiros [13] analyzed the air temperature of a vegetation canopy in Athens and revealed that streets with dense tree shade combined with minimal traffic loads resulted in the greatest cooling effect. Other studies have revealed the influence of the land cover ratio [14], land use [15], and roadside planting [16,17,18,19,20,21,22] on urban surface temperatures.
Lee et al. [15] examined street-scale thermal environments of three major commercial streets in Seoul, Republic of Korea using thermal image cameras and reported that the highest surface temperatures are found near restaurant buildings with dark-colored building facades or metal covering. Artificial turf or wooden decks of streets also show significantly high temperature during the daytime. Yamazaki et al. [17] analyzed the surface temperatures of road pavements and vegetation in Tokyo using thermal images and reported that surface temperatures of asphalt pavement were significantly higher than those of other types of pavement, and those of roadside trees and road median vegetation were lower than pavement and buildings. Yoon [19] reported that street trees were the most effective measure for reducing the surface temperature from the field study on urban surface temperature in downtown Seoul, and suggested that the thermal characteristics of various urban street elements should be considered to mitigate the UHI effect. Ahn et al. [20] investigated the relationship of surface temperatures of buildings and ambient air temperature with thermal imaging cameras in Seoul and found the building surface temperature was significantly higher than air temperature during a hot summer day. Cho and Lim [21] analyzed surface temperatures in afternoons during summer and found that larger areas covered by roadside trees and vegetated medians led to greater temperature reduction. Furthermore, Cho [22] analyzed the surface temperature of the roads by road components using a thermal imaging camera and estimated temperature effect models. The roadway is more sensitive than the sidewalk to temperature changes and roadside vegetation, ambient green space, and pavement permeability contribute to temperature reduction.
Although these previous studies reveal that urban roadside vegetation and the use of roadside land as green spaces can mitigate the increase in road surface temperature [10,11,12,13,14,15,16,17,18,19], most results are based on either air temperature or surface temperature alone. Air temperature tends to be affected by micrometeorological factors such as shade, wind, humidity, radiation, and wind velocity [2]. Therefore, it is important to investigate multiple temperature indices to explain urban temperature changes. Ahn et al. [23] measured Wet Bulb Globe Temperature (WBGT) and reported that shade from city streets significantly lowered WBGT. They recommended changing the guidelines for city street trees from a 6–8 m gap to continuous shading intervals. Feitosa et al. [24] assessed the effects of urbanization on heat stress in Rio de Janeiro, Brazil using WBGT Index. The results showed that more vegetated areas such as pocket parks, green roofs and green walls are necessary during urban planning to mitigate heat stress
Therefore, it is important to investigate multiple temperature indices to explain urban temperature changes. This study investigates the effects of green road design (i.e., amount and type of road vegetation) on urban temperature reduction in Seoul using roadside air temperature, surface thermal temperature and WBGT. These multiple temperature indices allow us to characterize urban temperature changes and show their benefits and drawbacks for temperature analysis.
2. Materials and Methods
2.1. Site Selection
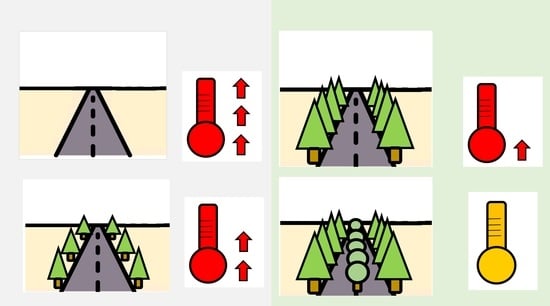
Four typically busy urban street sites in Jongro, the old downtown area of Seoul, Republic of Korea, were chosen for this study, and the corresponding effects of road cross-sections and vegetation locations (Figure 1) on urban temperature were compared. The street sites were all 50 m long with four lanes and each lane was 3.5 m wide. Sites 1, 2, 3, and 4, respectively, presented no roadside vegetation, small roadside trees, tall and dense roadside trees and shrubs, and roadside trees and tall trees on the median strip (Figure 2). At all sites, the surfaces were typical black asphalt-pavements and light gray concrete interlocking paved sidewalks. All sites have higher than two story buildings along the roads. During the study period, the four sites presented similar traffic volumes, road widths, and road profile compositions, as well as similar wind and solar radiation patterns. The main differences between the sites were the roadside vegetation and cross-sections.
2.2. Temperature Measurement
To investigate the effects of the four road cross-sections on urban micrometeorological changes, this study first determined the differences between air and roadside air temperatures and whether these differences were affected by roadside and vegetation characteristics. The roadside air temperature, , was defined as the air temperature measured 1.5 m above the road, unaffected by surface and ground temperatures. The is a major indicator of the effect of roads on micrometeorological changes.
Hourly average air temperature data were obtained from the Korea Meteorological Administration (KMA) database [20], including air temperature , ground temperature , wind speed , relative humidity (), amount of clouds, and amount of sunshine. The KMA measuring stations in this study are station A for site 1, 2, 3 and station B for site 4 (Figure 1b). , , and data were measured on-site using Testo 454 portable weather measuring devices. Because air temperature is influenced by ambient meteorological factors, such as humidity and solar radiation [12,16], this study introduced the Wet Bulb Globe Temperature (WBGT), , as a more realistic measure of temperature change. incorporates the effects of air and mean radiant temperatures, and represents the integrated effects of radiation and wind. was measured at all four sites using a black globe thermometer, which consisted of a 150-mm black globe with a thermometer located at the center of a matte black copper bulb. The measurements were saved in a weather measuring device. The surface temperature [2,16], , was measured using an Infra Thermal Imager TH7800.
Data collection was performed on three days without clouds, heavy rain, or fog. Data for , were collected from 07:00–21:00, and those for during three periods: morning (07:00–08:00), afternoon (13:00–14:00), and evening (19:00–20:00).
3. Results and Discussion
3.1. Air Temperature and Roadside Air Temperature
The air temperature obtained from the KMA and the roadside air temperature measured by the devices at all sites were compared to determine the differences and effects of road characteristics. The mean and standard deviation of , and were 25.9 (2.77), 28.3 (4.01), and 31.98 (7.96) °C, respectively. The values exhibited very similar patterns at all four sites (Figure 3a), whereas patterns differed between them (Figure 3b). was the highest at site 1 and the lowest at site 4, where it suddenly decreased after 17:00. decreased from site 1 to 4, implying that an increase in the number of roadside trees and vegetation reduced the roadside temperature. The differences between the sites were most significant from 13:00 to 18:00, most particularly at 15:00. These results suggest that is more appropriate than for the analysis of temperature changes on urban roads.
To further understand the effects of road cross-sections on roadside air temperature, the and values of each site were compared (Figure 4). The revealed large variations between the sites, whereas exhibited relatively small variations between them. Site 1 exhibited the greatest difference (4.44 °C) between and , followed by sites 2, 3, and 4. The variation of presented the same trend. is a measurement of the temperature around the road, and differences between and indicate that the temperature around the road changes according to the road characteristics. The results indicate that street trees and median strips located around the road can lower the local temperature, and the variance implies that there is a tendency for the roadside temperature to stabilize upon reduction of the temperature difference. Table 1 shows the results of the F- and t-tests, confirming that all sites presented similar variance, and the mean values of and were significantly different at sites 1 and 2, but remained the same at sites 3 and 4. These mean that roadside air temperatures at sites 1 and 2 increased significantly compared to those at sites 3 and 4. This demonstrates that roadside temperature is affected by roads and their characteristics.
Figure 4 shows that at site 1, rapidly increased to 40 °C in the afternoon before decreasing after sunset. The difference between and values was the highest at 15:00. At site 2, increased to 36 °C at 12:00, when the difference between and was the greatest. At site 3, the difference between and was small but slightly larger at 12:00–16:00. At site 4, was lower than that at other sites and remained below 30 °C. Notably, was lower than after 18:00. Therefore, distinct differences existed between and depending on the type of road vegetation.
To investigate the temperature change between the sites, the values of sites 1 to 3 were compared with those of site 4 (Figure 5). Table 2 shows that the mean at site 4 was lower (25.9 °C) than that at all other sites, and the mean values decreased from site 1 to 4. A notable difference was observed between the of sites 1 and 2 throughout the day, while the of sites 3 and 4 were very similar, as demonstrated by t-test values. The temperature of roads with less vegetation was significantly higher than that of roads with more vegetation. This implies that in the road sections with both a vegetated median and street trees, it was possible to prevent the roadside temperature from rising above the air temperature. As shown in Table 2, the results from the F-test reject the null hypothesis (the variance being the same) between sites 1 and 4, and also between sites 2 and 4. However, the P-value for sites 3 and 4 fails to reject the N0. The results of t-test show the similar patterns between sites. These indicate that the values at sites 1 and 2 are significantly higher than site 4, while that at 3 is the same at site 4. It indicates that roadside trees and a vegetated median led to significantly lower roadside temperatures at site 4.
3.2. Air Temperature and Wet-Bulb Globe Temperature
The WBGT, here denoted as , is a composite temperature used to estimate the effects of temperature, humidity, and solar radiation on humans through radiant heat; therefore, it is an effective measure of the cooling impact of roadside vegetation and road cross-sections. tends to be sensitive to meteorological conditions such as wind, humidity, and green spaces, as well as increased air temperature caused by surface temperature increases from solar radiation heat. This section compares and for each site (Figure 6). The results show that both temperatures increased after sunrise and decreased after sunset, and was typically higher than before 18:00, then decreased to approximately the same value. The patterns of differ from those of at all sites.
Table 3 shows that the mean between the sites did not differ, and the same was true for . The differences between and were clear at all sites. The mean value of (32.0 °C) was higher than that of (25.0 °C), and the results of the t-test showed that the mean values of and were significantly different at all sites. In summary, the differences in and suggest that was more sensitive to road characteristics than and that the road cross-section and road vegetation type affected the urban WBGT. In general, the accumulated solar radiant energy increased the air temperature and WBGT, with being higher than , particularly at 13:00–15:00. The results of the F- and t-tests showed that all sites had equal variance, and the mean and were significantly different at all sites (Table 3). These results imply that the WBGT at all the sites was significantly increased compared to air temperature and was affected by road types and roadside vegetation characteristics.
To compare the differences between the of the sites, the values for sites 1, 2, and 3 were compared with those of site 4 (Figure 7). at site 4 was typically lower than that at all other sites, except between approximately 16:00 and 18:00. In summary, the of roads is always higher and more sensitive than the . The greatest difference was observed between sites 2 and 4. A notable difference was observed between sites 3 and 4 at 12:00–16:00. Table 4 summarizes the t-test and F-test results. Differences in the means and variances were not significant between sites 1, 2, and 3, and site 4, thereby demonstrating the lack of globe temperature difference between the sites. However, this does not mean that was not significantly affected by the characteristics of roads and surrounding vegetation, as the result could be potentially attributed to various micrometeorological variables affecting , such as humidity, wind direction, and wind speed, that were not considered during the measurements. The results of this study show that is distinctly different from . Therefore, changes in other factors between the sites should be analyzed in future studies.
3.3. Surface Temperature
Thus far, the analysis has focused on the air temperature patterns for each site. In this section, the surface temperature is compared and analyzed. The main feature of thermal temperature measurements is that it can be used for a separate analysis of roadways and sidewalks. The surface thermal temperature was measured every second and the 10 s timed arithmetic means were calculated using function keys over the three measurement periods. These mean values in time were then saved and used for the time/multi-point calculation for the analysis. Here, surface temperature, was measured for paved roads at all sites and averaged for the morning, afternoon, and evening periods. Figure 8 shows photographs and thermal images of all sites for all time periods.
Table 5 and Figure 9 summarize in the morning, afternoon, and evening at each site, divided into roadway and sidewalks. The mean temperatures of the road and sidewalks were 33.2 and 33.5 °C, respectively. Their two-tailed t-test values were 0.00 with heterogeneous variance, which implies that their mean values were the same. The average on the roadway was 35.4, 35.4, 31.8, and 30 °C at sites 1, 2, 3, and 4, respectively. The on the sidewalk was 37.4, 32.3, 34.2, and 30.1 °C, respectively.
The different patterns at the sites from morning to evening are related to the site characteristics. That is, less roadside vegetation corresponds to a greater increase of during the day. The mean in the morning, afternoon, and evening was 26.0, 42.9, and 31.2 °C, respectively. The results of two-tailed t-tests with heterogeneous variance show that the two tailed t-test rejected the null hypothesis (the mean being the same) with a negligible probability of error. This means that the afternoon was the highest at all sites, and it was significantly different for mornings, afternoons, and evenings. Comparing the mean values of roadways and sidewalks by time, no clear pattern of differences was observed, and the values appeared to be identical. However, in the afternoon, the roadway presented a high of over 40 °C at sites 1 to 3, and a significantly lower value at site 4 (35.5 °C). Site 4 showed the smallest differences in roadway values throughout the day: 9 °C increase from morning to afternoon, and 7.4 °C decrease from afternoon to evening. For the sidewalk, the temperature of site 2 was low (38.5 °C), which indicates that the tall street trees cooled down the sidewalk. These findings imply that more roadside trees and median vegetation lead to a lower temperature increase after sunrise due to solar thermal energy. The temperatures in the mornings and evenings were slightly higher for the roadway than for the sidewalk, whereas the afternoon temperatures were significantly higher for the roadway (43.1 °C) than for the sidewalk (34.8 °C). This difference might have significantly contributed to the decrease in sidewalk temperature by the shadows of street trees, which was also observed during the field data collection.
4. Conclusions
This study investigated the effect of green road characteristics on roadside temperature. Four sites were chosen in downtown Seoul, and each of them exhibited different types of roadside and median strip vegetation. Various temperature indices were then measured using automated weather measuring devices and infrared thermal cameras.
The results showed clear temperature differences between the air temperature, , collected from meteorological stations, and the roadside air temperature. The values showed similar patterns for all four sites, whereas decreased from site 1 to site 4, implying that an increase in the number of roadside trees and median vegetation reduced the roadside temperature.
The analysis results of this study showed that , , and sensitively changed according to the road characteristics, and the lowest temperatures were obtained at site 4. Therefore, more roadside trees, taller trees, and median vegetation resulted in a greater decrease in roadside temperature during the day, as they prevented the temperature from increasing in the afternoon and contributed to an overall temperature reduction. This may be a result of the shade provided by the trees, which reduced the amount of direct solar radiant heat, thereby reducing the roadside air temperature through evaporation and increasing the relative humidity. These results suggest that the introduction of more vegetation to the sidewalk and median strips of urban streets can potentially reduce the temperature and improve the urban heat environment through cooling effects.
In this study, four temperature indices were used to analyze the effects of road components and roadside vegetation on temperature reduction., , and showed that the road trees and median vegetation tended to lower the roadside temperature, and and were more sensitive to the temperature reduction than . The results indicate that the roadside temperature is more suitable than the ambient air temperature for the temperature reduction analysis. The air temperature data is easy and cheap to get from the meteorological stations but difficult to get the actual roadside temperature because the stations are located away from the road. During the data collection, I found that ambient meteorological factors such as humidity and wind affected the . The results indicated that could measure the temperature change considering all these effects. The results also showed the temperatures of pavements were reduced with those road characteristics and roadside vegetation. The temperatures of road pavements are sensitive to solar radiation, pavement materials, and vehicles. allows measurements of temperatures for the pavement and separate analysis of roadways and sidewalks. However, the measurement device is expensive and delicate to handle, and it takes a great amount of time to analyze the data. It also requires trained researchers for data collection and handling the data. Regardless of these drawbacks, analysis of the surface thermal temperature gives a better understanding of actual temperature changes. This study initially considered the effects of traffic volume on air and roadside temperatures. However, the chosen sites were close to each other due to the limited availability of KMA database locations [25] and the need for easily controlled external variables. Therefore, the sites exhibited the same traffic volume, which was therefore not considered in the analysis. However, future studies should consider this factor.
In this study, various micrometeorological variables affecting , such as humidity, wind direction, and wind speed, were not considered. The inclusion of such variables in future studies will allow a more accurate analysis of temperature differences due to road components. The data collection and thermal data analysis indicate that not only cars in traffic but even cars idling at traffic signals have high surface temperatures and can potentially contribute to the temperature rise. For instance, the surface temperature of a car hood can be more than 50 °C. However, despite the sites of this study being located in downtown Seoul, which is characterized by high traffic volumes and is congested during the evenings, only the surface temperature of the road pavement was studied. That is, the effects of cars at traffic signals on surface temperature were excluded from this study. Therefore, further research should investigate the effects of traffic volume and congestion at traffic signals on urban micrometeorology and climate.
From the design of the experiments, I considered the effects of roadside buildings. All sites have higher than two story buildings on both sides along roads. However, during the morning and afternoon data collection, I found the shadow of buildings tends to lower all the temperatures, and their tendency was stronger on the surface temperature reduction than other temperatures. Unfortunately, the effects of shadows on temperature were not analyzed in this study due to the lack of relevant data and proper experimental design. The shadow effect of buildings on roadside temperature reduction will be analyzed in future studies with sophisticated experimental design and enough data.
Funding
This research received no external funding.
Acknowledgments
The data was obtained from the Development of Green Street System Technologies in Urban Area (III) project, which was funded by the Korea Institute of Civil Engineering and Building Technology.
Conflicts of Interest
The author declares no conflict of interest.
References
- Grimmond, S. Urbanization and global environmental change: Local effects of urban warming. Geogr. J. 2007, 173, 83–88. [Google Scholar] [CrossRef]
- Rosenfeld, A.H.; Akbari, H.; Romm, J.; Pomerantz, M. Cool communities: Strategies for heat island mitigation and smog reduction. Energy Build. 1998, 28, 51–62. [Google Scholar]
- Taha, H. Urban climates and heat islands: Albedo, evapotranspiration, and anthropogenic heat. Energ. Build. 1997, 25, 99–103. [Google Scholar] [CrossRef] [Green Version]
- Oke, T.R. The energetic basis of the urban heat island. Quart. J. R. Meteorol. Soc. 1982, 108, 1–24. [Google Scholar] [CrossRef]
- Carlson, T.N.; Boland, F.E. Analysis of urban–rural canopy using a surface heat flux temperature model. J. Appl. Meteorol. 1978, 17, 998–1013. [Google Scholar] [CrossRef]
- Seoul Open Data Plaza. Available online: http://data.seoul.go.kr (accessed on 16 January 2021).
- Foster, J.; Lowe, A.; Winkelman, S. The Value of Green Infrastructure for Urban Climate Adaptation; Center for Clean Air Policy: Washington, DC, USA, 2011. [Google Scholar]
- Edmondson, J.L.; Stott, I.; Davies, Z.G.; Gaston, K.J.; Leake, J.R. Soil surface temperatures reveal moderation of the urban heat island effect by trees and shrubs. Sci. Rep. 2016, 6, 33708. [Google Scholar] [CrossRef] [PubMed] [Green Version]
- Snyder, R.L.; Moratiel, R.; Zhenwei, S.; Swelam, A.; Jomaa, I.; Shapland, T. Evapotranspiration response to climate change. Acta Hortic. 2011, 922, 91–98. [Google Scholar] [CrossRef]
- Coutts, A.M.; White, E.C.; Tapper, N.J.; Beringer, J.; Livesley, S.J. Temperature and human thermal comfort effects of street trees across three contrasting street canyon environments. Theor. Appl. Climatol. 2016, 124, 55–68. [Google Scholar] [CrossRef]
- Oliveria, S.; Andrade, H.; Vaz, T. The cooling effect of green spaces as a contribution to the mitigation of urban heat: A case study in Lisbon. Build. Environ. 2011, 46, 2186–2194. [Google Scholar] [CrossRef]
- Yoon, Y.H. The study of cooling effect on heat island by Parks-Relationship between wind velocity. J. Korea Plan. Assoc. 2001, 36, 187–196. [Google Scholar]
- Tsiros, I.X. Assessment and energy implications of street air temperature cooling by shade trees in Athens (Greece) under extremely hot weather conditions. Renew. Energy 2010, 35, 1866–1869. [Google Scholar] [CrossRef]
- Kim, S.B.; Kim, H.D. Influences of urban trees on the control of the temperature. J. Korean Inst. Landsc. Archit. 2002, 30, 25–34. [Google Scholar]
- Lee, S.; Moon, H.; Choi, Y.; Yoon, D.K. Analyzing thermal characteristics of urban streets using a thermal imaging camera: A case study on commercial streets in Seoul, Korea. Sustainability 2018, 10, 519. [Google Scholar] [CrossRef]
- Yoon, Y.H.; Bae, B.H. A study on the relation between scale of green spaces and decreasing air temperature. Korean J. Environ. Biol. 2002, 20, 2–19. [Google Scholar]
- Yamazaki, F.; Murakoshi, A.; Sekiya, N. Observation of urban heat island using airborne thermal sensors. In Proceedings of the Joint Urban Remote Sensing Event, Shanghai, China, 20–22 May 2009. [Google Scholar]
- Hwang, J.; Park, J.; Chen, Y.Y. An assessment of urban heat island using thermal infrared image in Jeonju city. J. Recreat. Landsc. 2014, 8, 25–33. [Google Scholar]
- Yoon, J. Field measurement recorded in the urban thermal environment of a medium-size city in autumn and winter. J. Archit. Inst. Korea Plan. Des. 2009, 25, 453–460. [Google Scholar]
- Ahn, M.; Kim, D.; Lee, S.; Lee, Y.; Kim, H.; Jung, K. Monitoring the urban heat island phenomenon using infrared thermal imager in Seoul. In Proceedings of the 50th Meeting of Korean Society for Atmospheric Environment, Gwangju, Republic of Korea, 29 October 2010. [Google Scholar]
- Cho, H.; Lim, J. The effect of urban road vegetation on a decrease of road surface temperature. J. Korean Inst. Landsc. Archit. 2011, 39, 107–116. [Google Scholar] [CrossRef] [Green Version]
- Cho, H. Effects of Roads Characteristics and Green Space on Urban Temperature. Int. J. Highw. Eng. 2020, 22, 45–51. [Google Scholar] [CrossRef]
- Ahn, T.; Lee, J.; Kim, B.; Yoon, H.; Son, S.; Choi, Y.; Lee, N.; Lee, J.; Kim, H. An Analysis of Thermal Comforts for Pedestrians by WBGT Measurement on the Urban Street Greens. Korean Inst. Landsc. Archit. 2013, 41, 22–30. [Google Scholar] [CrossRef] [Green Version]
- Feitosa, R.C.; Wilkinson, S.J.; Oliveira, B.; Hacon, S. Wind and greenery effects in attenuating heat stress: A case study. J. Clean. Prod. 2021, 291, 125919. [Google Scholar] [CrossRef]
- Korea Meteorological Administration Database. Available online: http://minwon.kma.go.kr (accessed on 14 September 2020).
Figure 1.
(a) Data collection location in Seoul, and (b) four street sites and KMC stations in Jongro.
Figure 1.
(a) Data collection location in Seoul, and (b) four street sites and KMC stations in Jongro.

Figure 2.
Photographs of the four data collection sites: (a) 1, without roadside vegetation; (b) 2, with small roadside trees; (c) 3, with tall and dense roadside trees and shrubs; and (d) 4, with roadside trees and tall trees on the median strip. (e–h) show their corresponding road design characteristics, where the red circles represent the sensor locations.

Figure 3.
(a) Air temperature and (b) roadside air temperature at the four study sites.

Figure 4.
Air and roadside air temperatures for sites (a) 1, (b) 2, (c) 3, and (d) 4.

Figure 5.
Comparison of roadside air temperature for sites (a) 1 and 4, (b) 2 and 4, and (c) 3 and 4.
Figure 5.
Comparison of roadside air temperature for sites (a) 1 and 4, (b) 2 and 4, and (c) 3 and 4.

Figure 6.
Comparison of air and globe temperatures for sites (a) 1, (b) 2, (c) 3, and (d) 4.

Figure 7.
Comparison of globe temperature between sites (a) 1 and 4, (b) 2 and 4, and (c) 3 and 4.

Figure 8.
Photographs and thermal camera images of each site at different periods.

Figure 9.
Comparison of surface temperature by time: (a) roadway and (b) sidewalk.


Table 1.
T(a)-T(ra) F- and t-tests with equal variances for sites.
| Mean Temperature | Variance | F-Test | t-Test | ||||||
|---|---|---|---|---|---|---|---|---|---|
| T(a) | T(ra) | T(ra)-T(a) | T(a) | T(ra) | F Ratio | p (F ≤ f) | t-Ratio | p (T ≤ t) | |
| Site 1 | 26.51 | 30.95 | 4.44 | 10.60 | 24.43 | 0.43 | 0.07 | −2.90 | 0.007 |
| Site 2 | 25.64 | 28.95 | 3.31 | 5.45 | 11.16 | 0.49 | 0.096 | −3.15 | 0.004 |
| Site 3 | 26.19 | 27.42 | 1.23 | 10.00 | 9.72 | 1.03 | 0.479 | −1.07 | 0.295 |
| Site 4 | 25.32 | 25.89 | 0.57 | 5.39 | 7.38 | 0.73 | 0.283 | −0.62 | 0.542 |
Table 2.
Comparison of T(ra) between two sites, and results of F- and t-tests.
| Mean Temperature | Variance | F-Test | t-Test | |||||
|---|---|---|---|---|---|---|---|---|
| T(r)_i | T(r)_4 | T(r)_i | T(r)_4 | F Ratio | p (F ≤ f) One-Tailed | t-Ratio | p (T ≤ t) Two-Tailed | |
| Site 1 & 4 | 30.95 | 25.89 | 24.43 | 7.38 | 3.309 | 0.016 | 3.472 | 0.002 |
| Site 2 & 4 | 28.95 | 25.89 | 11.16 | 7.38 | 1.512 | 0.225 | 2.756 | 0.010 |
| Site 3 & 4 | 27.42 | 25.89 | 9.72 | 7.38 | 1.317 | 0.307 | 1.430 | 0.164 |
Table 3.
F- and t-tests with equal variances.
| Mean Temperature | Variance | F-Test | t-Test | |||||
|---|---|---|---|---|---|---|---|---|
| T(a) | T(g) | T(a) | T(g) | F Ratio | p (F ≤ f) | t-Ratio | p (T ≤ t) | |
| Site 1 | 26.51 | 32.83 | 10.60 | 43.88 | 0.242 | 0.006 | −3.316 | 0.002 |
| Site 2 | 25.64 | 33.88 | 5.45 | 59.51 | 0.092 | 0.000 | −3.960 | 0.001 |
| Site 3 | 26.19 | 31.32 | 10.00 | 52.87 | 0.184 | 0.002 | −2.504 | 0.022 |
| Site 4 | 25.32 | 29.89 | 5.39 | 45.53 | 0.118 | 0.000 | −2.482 | 0.024 |
Table 4.
Comparison of T(g) between two sites, and results of F- and t-tests.
| Mean Temperature | Variance | F-Test | t-Test | |||||
|---|---|---|---|---|---|---|---|---|
| T(gi) | T(g4) | T(gi) | T(g4) | F Ratio | p (F ≤ f) One Tailed | t-Ratio | p (T ≤ t) | |
| Site 1 & 4 | 32.83 | 29.89 | 43.88 | 45.53 | 0.964 | 0.473 | 1.201 | 0.240 |
| Site 2 & 4 | 33.88 | 29.89 | 59.51 | 45.53 | 1.307 | 0.312 | 1.507 | 0.143 |
| Site 3 & 4 | 31.32 | 29.89 | 52.87 | 45.53 | 1.161 | 0.392 | 0.557 | 0.582 |
Table 5.
Comparison of surface temperature, , by site and time period.
| Types | Sites | Morning | Afternoon | Evening | Mean |
|---|---|---|---|---|---|
| Roadway | site_1 | 28.3 | 45.8 | 32.0 | 35.4 |
| site_2 | 24.5 | 47.8 | 34.0 | 35.4 | |
| site_3 | 23.6 | 43.3 | 28.4 | 31.8 | |
| site_4 | 26.5 | 35.5 | 28.1 | 30.0 | |
| Mean | 25.7 | 43.1 | 30.6 | 33.2 | |
| Sidewalk | site_1 | 26.5 | 50.0 | 35.7 | 37.4 |
| site_2 | 24.4 | 38.5 | 34.1 | 32.3 | |
| site_3 | 26.2 | 47.3 | 29.2 | 34.2 | |
| site_4 | 27.8 | 34.8 | 27.8 | 30.1 | |
| Mean | 26.2 | 42.7 | 31.7 | 33.5 | |
| Total | Mean | 26.0 | 42.9 | 31.2 | 33.2 |
Publisher’s Note: MDPI stays neutral with regard to jurisdictional claims in published maps and institutional affiliations. |
© 2022 by the author. Licensee MDPI, Basel, Switzerland. This article is an open access article distributed under the terms and conditions of the Creative Commons Attribution (CC BY) license (https://creativecommons.org/licenses/by/4.0/).
Share and Cite
MDPI and ACS Style
Cho, H. Effects of Road Components and Roadside Vegetation on Temperature Reduction in Seoul Considering Air, Wet-Bulb Globe, and Surface Temperatures. Sustainability 2022, 14, 16663. https://doi.org/10.3390/su142416663
AMA Style
Cho H. Effects of Road Components and Roadside Vegetation on Temperature Reduction in Seoul Considering Air, Wet-Bulb Globe, and Surface Temperatures. Sustainability. 2022; 14(24):16663. https://doi.org/10.3390/su142416663
Chicago/Turabian StyleCho, Hyejin. 2022. "Effects of Road Components and Roadside Vegetation on Temperature Reduction in Seoul Considering Air, Wet-Bulb Globe, and Surface Temperatures" Sustainability 14, no. 24: 16663. https://doi.org/10.3390/su142416663
Note that from the first issue of 2016, this journal uses article numbers instead of page numbers. See further details here.