Article

Process Parameter Optimization of Additively Manufactured Parts Using Intelligent Manufacturing

1
Department of Mechatronics Engineering, College of Electrical and Mechanical Engineering, National University of Sciences and Technology, Islamabad 44000, Pakistan
2
Laboratoire Conception Fabrication Commande, Arts et Métiers ParisTech, Campus de Metz, 57070 Metz, France
3
Department of Mechanical Engineering, Jeju National University, Jeju-si 63243, Republic of Korea
4
School of Civil and Environmental Engineering, University of New South Wales, Sydney, NSW 2052, Australia
5
Department of Computer and Software Engineering, College of Electrical and Mechanical Engineering, National University of Sciences and Technology, Islamabad 44000, Pakistan
*
Authors to whom correspondence should be addressed.
Sustainability 2022, 14(22), 15475; https://doi.org/10.3390/su142215475
Submission received: 12 October 2022 / Revised: 12 November 2022 / Accepted: 18 November 2022 / Published: 21 November 2022

Abstract

:
Additive manufacturing is the technique of combining materials layer by layer and process parameter optimization is a method used popularly for achieving the desired quality of a part. In this paper, four input parameters (layer height, infill density, infill pattern, and number of perimeter walls) along with their settings were chosen to maximize the tensile strength for a given part. Taguchi DOE was used to generate an L27 orthogonal array which helped to fabricate 27 parts on the Ender 3 V2 fused deposition modeling (FDM) printer. The ultimate testing machine was used to test all 27 samples to generate the respective tensile strength values. Next, the Microsoft Azure ML database was used to predict the values of the tensile strength for various input parameters by using the data obtained from Taguchi DOE as the input. Linear regression was applied to the dataset and a web service was deployed through which an API key was generated to find the optimal values for both the input and output parameters. The optimum value of tensile strength was 22.69 MPa at a layer height of 0.28 mm, infill density of 100%, infill pattern of honeycomb, and the number of perimeter walls as 4. The paper ends with the conclusions drawn and future research directions.

1. Introduction

Additive manufacturing (AM) is a fast-evolving technology that has primarily been used in the past to build prototype models in various industries. Today, however, AM is used for more than just prototypes. It offers enormous promise for instruments for direct or indirect production, manufacturing, and medicinal applications [1]. AM uses 3D printing to create substantial, intricate, and integrated parts. The ISO/ASTM 52900:2015 standard defines AM as “the technique of combining materials to build things from 3D model data, generally layer upon layer, as opposed to subtractive manufacturing and formative manufacturing approaches” [2]. AM is a part of various applications, with fused deposition modeling (FDM) and stereolithography (SLA) technologies being the trendy subjects. Composites manufactured using FDM and modified FDM often have higher tensile strength and modulus than those made with selective laser sintering (SLS), direct ink writing (DIW), and SLA [3,4]. Since finding the optimal set of process parameters to build a part with AM is important, Manav et al. [5] gave a thorough breakdown of the printer settings that directly impacted the tensile strength, stress, and Young’s modulus of FDM-produced items. The paper looked at the most crucial printing specifications: layer thickness, build orientation, infill density, infill pattern, printing speed, and screen angle. Ghabezi et al. [6] used a Noztek Touch Dual proportional-integral-derivative (PID) filament maker to make reinforced polypropylene (PP) with salt fiber weight fractions of 0%, 2%, 5%, and 8%, respectively. The researchers optimized extrusion parameters such as motor speed, heater temperature, fan condition, and extrusion voltage to produce filaments with desired surface quality. Srinivasan et al. [7] studied printed components utilizing acrylonitrile butadiene styrene (ABS). The mechanical characteristics of printed items, such as tensile strength and hardness, were measured and layer thickness and infill density were found to be the critical elements. Furthermore, Sumaltha et al. [8] explained how the Taguchi method described the relationship between different parameters and factors. Using signal-to-noise (S/N) ratios, the authors recommended significant limits for results and settings. The actual meaning of process limits was analyzed using analysis of variance (ANOVA).
Moreover, since the level of intelligence has risen in critical areas such as research and development (R&D) design, production equipment, process control, logistics, distribution, and energy management, the use of real-time data analytics, artificial intelligence (AI), and machine learning (ML) has augmented the production processes to become smarter and contribute towards smart factories. A thorough survey of related subjects, including cloud manufacturing, smart manufacturing, and Internet of Things (IoT) enabled manufacturing, was presented by Ray et al. [9]. Ugur et al. [10] focused on three essential facets of AM: process development, materials research development, and advancements in design considerations. Similarly, Wong et al. [11] researched plastic packaging manufacturing through IoT-based production performance monitoring. The wireless fidelity (Wi-Fi) module and Arduino board were used to transmit data to the ThingSpeakTM cloud.
In addition to finding the optimal process parameters and inclusion of AI and ML, big data is invited wherever large amounts of data are experienced. Big data refers to data collections that are too massive or complicated for typical data-processing application software to handle. Although data with many fields have more statistical power, the data with more may have a higher false discovery rate as well. Majeed et al. [12] described a framework using different sensors to observe other parameters and optimize for better results. The researchers used RFID tags to identify objects and monitor the temperature of processing beds with temperature sensors. Voltage and current sensors also monitored the electrical energy consumption of additive makers. Moreover, Soren et al. [13] explored how ML might improve dependability by forecasting system reactions and adjusting input parameters. ML can form new predictions for a system’s response without re-training by using new data from the projected plan. Lingbin et al. [14] examined the most recent ML applications in AM by comparing the effectiveness of several ML algorithms and then assessing them. Regression optimization was also used as a method for improving the process control set points for specific processes at the system or plant level by fusing AI and optimization approaches in a single framework. Further, different types of regression, including Cox or proportional hazards regression, logistic, multiple linear regression, and polynomial and simple linear regression, were also studied by Gogtay et al. [15]. Jo et al. [16] also discussed a framework that includes a sensor module, communication rules, and a base station. Last but not least, Milad et al. [17] proposed an Azure framework for customizable asphalt support questions and agreements. Using four variables; severity, thickness, road tolerance, and average daily traffic, as data sources, the authors were able to predict the expected value of a cure.
Consequently, considering the over-arching aim of the research, it is evident that the IoT is essential to research various approaches, especially ML and AI. This also requires careful examination of the Azure ML database to discover how different prediction algorithms can yield varied outcomes. Since linear regression is a powerful technique for determining how one output parameter is affected by various input values, the setting up of a web service that can return an application programming interface (API) key, which can be further utilized in Python to power the IoT, is essential. Similarly, in this paper, process parameter optimization is undertaken for FDM using the Microsoft Azure ML database. Various strategies were used to transfer data from the FDM printer to the cloud wherein the data was handled to resolve the complex problem fast and efficiently. The remainder of the paper is divided as follows. Section 2 presents the methodology adopted and the experimental procedure. Section 3 presents the Microsoft Azure database along with process parameter optimization strategies. Finally, Section 4 presents the conclusions drawn.

2. Methodology and Experimental Procedure

The work presented in this paper aims to optimize the process parameters of the FDM printer to enhance the tensile strength of the workpiece. The methodology adopted is presented in Figure 1. It starts with the part design from which functional specifications are extracted and the control (input) parameters are identified for the FDM process. The background behind the process parameter selection and the adoption of Taguchi design of experiments (DOE) is explained in the sections to follow. The experiments were then conducted to make the parts, and a universal testing machine was used to measure the output parameter, i.e., tensile strength. After the data was collected, it was sent to the Azure ML database, where a linear regression model was applied since the output was single only, i.e., to measure tensile strength. Then the hyperparameters were tuned to produce satisfactory results. A web service was also deployed that can give a prediction tool and guess the strength of various input values. Anyone can use the API key in other programming languages to predict the values. In this paper, Python was used to predict the value of tensile strength. Overall, the methodology is ‘generic’ in nature and can be applied to predict process parameters for various AM technologies.

2.1. FDM Process Parameters’ Selection

The FDM printer used in this study was ENDER 3 V2 (Version 2, Creality, Shenzhen, China). Since different settings of process parameters affected the tensile strength in various ways, the literature [3,7,18] and the operator’s experience were consulted to select the four control (process) parameters for this paper, i.e., layer height, infill pattern, infill density, and number of perimeter walls. The process parameters are listed in Table 1.

2.2. Materials and Geometry of the Part

In this paper, a geometric T-shaped drilling grid was used whose dimensions were (50 × 20 × 5) mm. The design of the part was obtained from Zaman et al. [18] as shown in Figure 2. Two gripper sections of dimensions (15 × 15 × 6.5) mm were introduced to the original design to grip the part in the universal testing machine.
The experiments were carried out on ENDER 3 V2 FDM printer which has an accuracy of up to 100 microns and a resolution of up to 0.1 mm. The material utilized was polylactic acid (PLA) and the settings were altered using the Creality Prussa program (Version 2, Prusa Research, Prague, Czech Republic).

2.3. Selection of Orthogonal Array (OA) and Experiments

A significant stage in the foundation of the exploratory arrangement is choosing the settings for the controllable parameters. The settings chosen are listed in Table 2.
Based on the control factors and the settings (levels) chosen, a suitable Taguchi’s OA was created (see Table 3). The design of an OA depends upon the number of elements, the magnitude of each factor, and the interconnections between them. The control variables are believed to be independent, and it is assumed that there is no interaction between them. Moreover, experiments were conducted using the L27 OA, and 27 parts were manufactured. One of the manufactured parts is shown in Figure 3a.
A universal testing machine (UTM) (AGX-Plus, Shimadzu, Kyoto, Japan) was used to measure the ultimate tensile strength of all the 27 manufactured parts (see Figure 4) and the values of tensile strength were documented in Table 3 (see last column). The UTM gripped each part between two grippers, and a load cell was used to calibrate the weight. Figure 3b shows a manufactured sample after the measurement of tensile strength by the UTM machine.

3. Database on Microsoft Azure

The dataset was created and uploaded to the Microsoft Azure database which utilizes a ML portal (see Figure 5). Those columns were selected that were of greater importance.

3.1. Edit Metadata and Filter Based Feature Selection

The ‘Edit Metadata’ component was used to modify the metadata associated with the columns in a dataset. The value and data type of the dataset change after using the ‘Edit Metadata’ component. Examples of typical metadata modifications include using text, Boolean, or numeric columns as category values. Since the infill pattern in this instance was a string value, categorical values were created using this capability as shown in Table 4. Moreover, ‘Filter Based Feature Selection’ helped to find irrelevant qualities using the chosen metric. Then unnecessary columns were removed from the model using a filter. Here, the component determines a score for each feature column based on the single statistical measure that the user selects to best fit the data.
Table 4. Filter Based Features.
Layer Height (mm)Infill Density (%)Infill PatternNumber of
Perimeter Walls
Tensile Strength (MPa)
0.1405330.5394660.0128170.6616831
Figure 5. Microsoft Azure ML Database.
Sustainability 14 15475 g005

3.2. Data Segmentation and Algorithm for Regression

In this stage of the Azure ML database, the data was split according to the requirements. The model was trained using 80% of the data and then tested using the remaining 20%. The regression algorithm was used since it predicted the output values from the input values. An online gradient descent algorithm, i.e., linear regression was used because of having a single output (see Table 5). Bias was kept accurate so that the regression was not forced to pass over the graph’s origin. Both the model coefficient and prediction were not to be biased. The ‘L2′ regularization weight modified the loss function by adding a penalty term that prohibited the coefficients from changing excessively to reduce the possibility of overfitting. Since regularization tries to minimize the estimator’s variance by simplifying it and increasing the bias such that the projected error decreases, it was kept at 0 to 0.23 by the hit and trial method. Finding the local minimum of a differentiable function was performed using a first-order iterative optimization technique.
Different learning rate values were also employed. The ‘learning rate’ is used to adjust the amplitude of parameter updates during gradient descent. The value selected for this parameter can impact the algorithm’s learning rate and whether or not the cost function is minimized. Since 0.275 to 0.5 is where the learning rate should be at its best, the quantity of iterations demonstrates how frequently the algorithm’s parameters were modified. Every epoch for each sample in the training dataset has allowed the internal model parameters to change. In this instance, a range of 1 to 100 was chosen. An era is made up of one or more batches. Normalization aimed to scale down features to a similar scale. This enhanced the Model’s functionality and training stability. Averaging is generally employed to lessen the impact of noise and the Model was trained according to the conditions given in Table 5. Feature weights were also given to this Model so that it was modeled according to the linear regression.

3.3. Tune Model Hyperparameters

Hyperparameter tuning is about determining a set of optimum hyperparameter values for a learning algorithm and then applying the tuned algorithm to any data collection. Utilizing such hyperparameters improves the Model’s performance by lowering a specified loss function and producing better results with fewer errors. The tune model hyperparameters in this phase used the regression model and split data, which further determined the ideal learning rate, number of iterations, and error values saved in the sweep results (see Table 6).

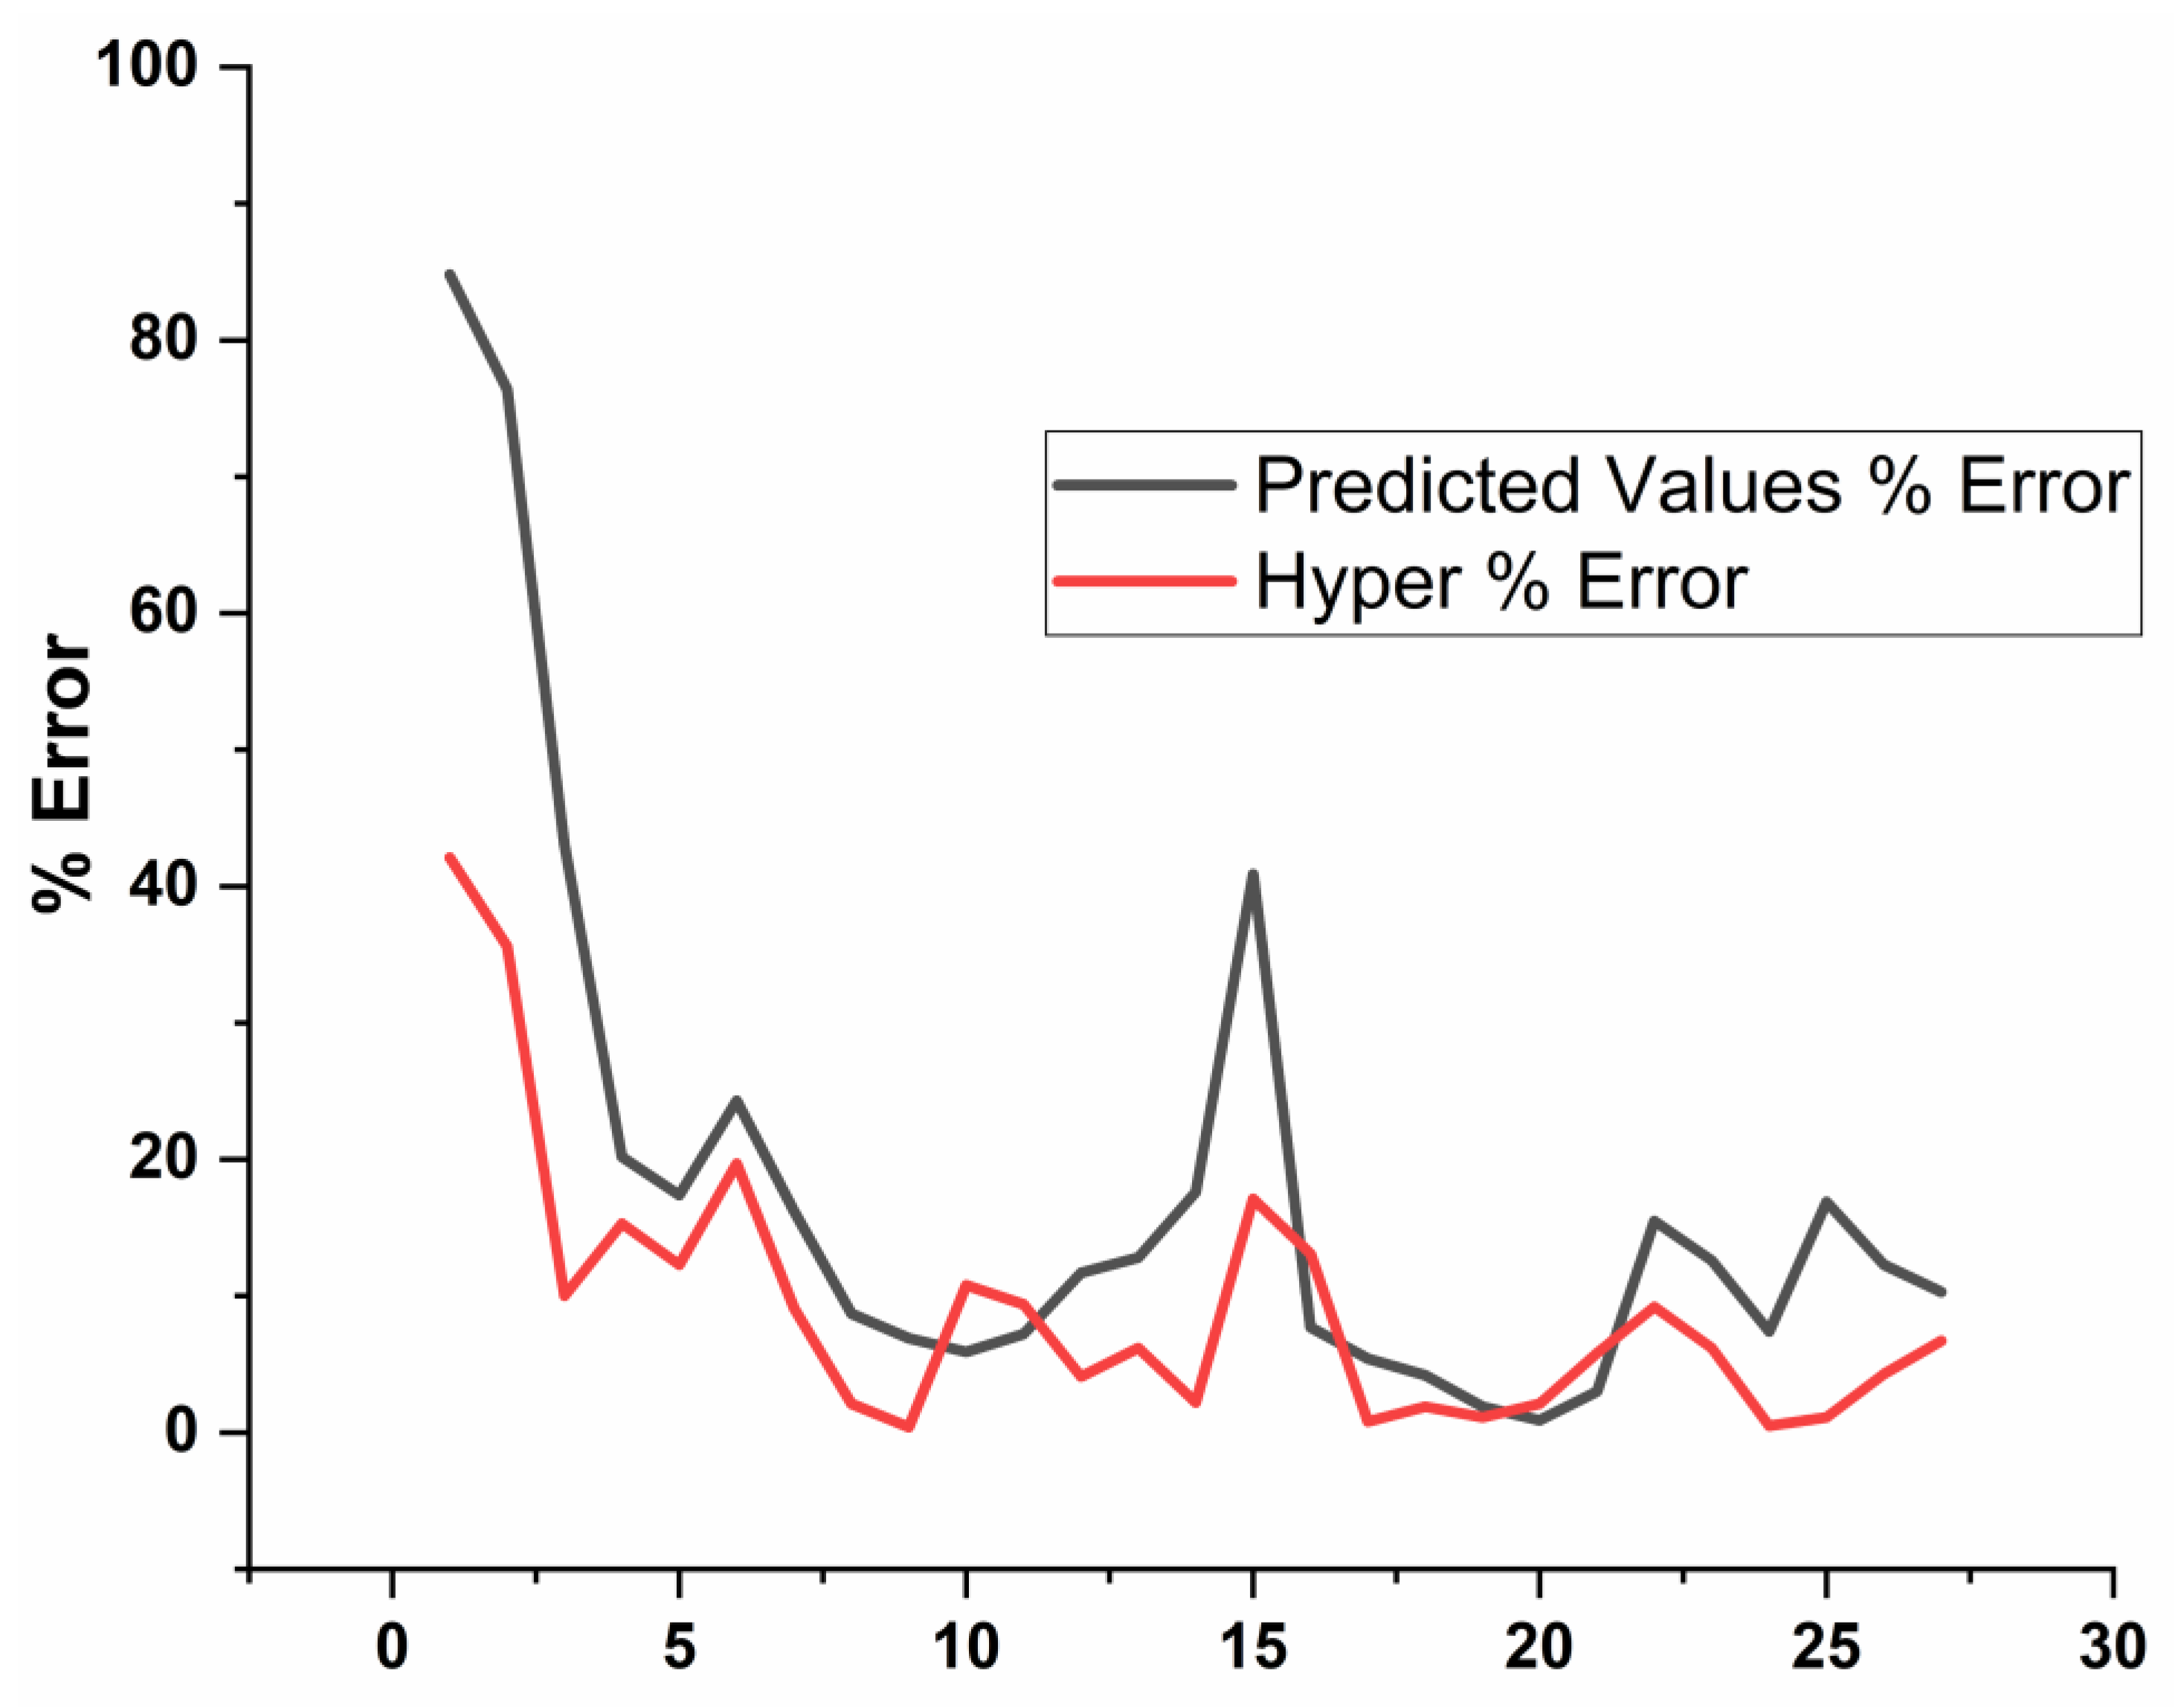
3.4. Score and Evaluate Model

The Model gave predicted values according to the linear regression after a comparison was performed between the values of the models involving tune model hyperparameters and those that did not include hyperparameters. The feature weights with and without tune model hyperparameters are listed in Table 7.
The different error results and coefficient of determination were also found and compared by hyperparameter tuning and a normal trained model, as shown in Table 8.
The coefficient of determination is increased from 0.56224 to 0.808615, thereby showing positive progress.

3.5. Web Service

After performing regression in the Microsoft Azure ML database, the setting up of the web service option was selected as shown in Figure 6.
In the option of ‘select columns in dataset’, output columns were deselected as the objective was to predict the tensile strength. Then ‘scored labels’ were selected which assist in predicting the tensile strength at any value.

3.6. Relationship of Input Parameters with Tensile Strength

Figure 7, Figure 8, Figure 9 and Figure 10 show the relationship between infill density, infill pattern, layer height, and the number of perimeter walls with tensile strength, respectively. It was ensured that a confidence interval of 5% and 95% was to be maintained for each performance measure. Infill density and layer height have a direct relationship with tensile strength as shown in Figure 7 and Figure 9. Tensile strength also increases rapidly with an increase in perimeter wall count (see Figure 10). Moreover, layer height has comparatively less effect on tensile strength and a honeycomb pattern will give the maximum tensile strength, followed by the triangle pattern, and finally a grid pattern.
In addition, as observed from Figure 11, the hyper-values graph was closer to the experimental values as compared to the predicted values, indicating that hyperparameter tuning was an efficient method to optimize the process parameters.
Moreover, Figure 12 shows that there were more errors in predicted values as compared to the hyper-values. The average error in hyper values was 9.22%, while it rose to 18.22% in predicted values. This further concluded that process parameter optimization was best when tuning the hyperparameter model was used.

3.7. Optimal Conditions

To assess the final optimal conditions, a web service was first deployed for the optimal values and then an API key for Python code was generated. This required a network connection to create an online interface and then different values were tested. The maximum tensile strength value of 18.65 MPa was generated using the following parameters: layer height of 0.28 mm, infill density of 100%, infill pattern of honeycomb, and the number of perimeter walls as four (4). However, these settings did not include tune model hyperparameters. So, the method was less effective for the reasons mentioned above. With the aid of tuned model hyperparameters, the highest value of 22.69 MPa was produced for the tensile strength using the same settings as above, i.e., layer height of 0.28 mm, infill density of 100%, infill pattern of honeycomb, and the number of perimeter walls as four (4). This approach was more effective due to a superior coefficient of determination as well.

4. Conclusions

In this paper, process parameters were studied for the FDM ENDER 3 V2 printer that can maximize the tensile strength of a drilling grid [18,19]. The input parameters (layer height, infill density, infill pattern, and number of perimeter walls) along with their settings were chosen with the help of the literature and the expertise of the machine operator. Three levels were chosen for the four controllable factors and Taguchi DOE was used to generate L27 OA. Based on the OA, 27 parts were printed on the Ender 3 V2 FDM printer. The UTM was then used to measure the tensile strength of all the 27 parts produced by the FDM printer. Next, the Microsoft Azure ML database was used to predict the values of the tensile strength for various input parameters. Linear regression was applied to the dataset, and the Model was trained using online gradient descent. Model Hyper parameter was tuned and compared to both settings as well. Moreover, a web service was deployed, and an API key was generated, which helped with the Python code to find the optimal values for both the input and output parameters. The optimum value of tensile strength was 22.69 MPa at a layer height of 0.28 mm, infill density of 100%, infill pattern of honeycomb, and the number of perimeter walls as 4. This result was better than the tensile strength value of 18.65 MPa which was obtained without tuning the hyperparameters. Conclusively, the main achievement of this research included using the Microsoft Azure ML database to help in generalizing and predicting output parameter values for any set of input values, while Taguchi DOE was only utilized for the experimental part. Moreover, hyper tuning of parameters further optimized the output by reducing the coefficient of determination and reducing the error.
As part of future work, Microsoft Azure ML can be used on other 3D printers such as using SLA to predict single or multiple output parameters. Different combinations of ML techniques can be employed within the Azure ML database to improve the results as well.

Author Contributions

Conceptualization, R.U.R. and U.K.u.Z.; methodology, R.U.R., U.K.u.Z. and H.J.; software, R.U.R., U.K.u.Z. and U.Q.; validation, S.A., S.K. and A.H.; formal analysis, U.K.u.Z. and S.A.; investigation, R.U.R.; writing—original draft preparation, R.U.R. and U.K.u.Z.; writing—review and editing, U.K.u.Z., S.K., S.A. and A.S.; supervision, U.K.u.Z. and H.J.; project administration, U.K.u.Z.; funding acquisition, S.A. and D.-W.J. All authors have read and agreed to the published version of the manuscript.

Funding

This research was funded by the Brain Pool program of the Ministry of Science and by ICT through the National Research Foundation of Korea (2021H1D3A2A01100014).

Institutional Review Board Statement

Not applicable.

Informed Consent Statement

Not applicable.

Data Availability Statement

Not applicable.

Conflicts of Interest

The authors affirm that they do not have any competing interests.

References

  1. Ystems, S. A Dditive M Anufacturing for I Ntegrated S Pacecraft P Ropulsion. J. Manuf. Technol. Res. 2016, 5, 75–96. [Google Scholar]
  2. ISO/ASTM52900-15; Standard Terminology for Additive Manufacturing—General Principles—Terminology (ASTM52900). International Organization: Geneva, Switzerland, 2015; pp. 1–9.
  3. Li, J.H.; Huang, X.D.; Durandet, Y.; Ruan, D. A review of the mechanical properties of additively manufactured fiber reinforced composites. IOP Conf. Ser. Mater. Sci. Eng. 2021, 1067, 012105. [Google Scholar] [CrossRef]
  4. Adefuye, O.A.; Raji, N.A.; Adedeji, K.A.; Fadipe, O.L.; Olowu, B. Additive Manufacturing and Sand-Casting Foundries Practices in Nigeria. Eng. Technol. Res. J. 2019, 4, 55–63. [Google Scholar] [CrossRef]
  5. Doshi, M.; Mahale, A.; Singh, S.K.; Deshmukh, S. Printing Parameters and Materials Affecting Mechanical Properties of FDM-3D Printed Parts: Perspective and Prospects. Mater. Today Proc. 2021, 50, 2269–2275. [Google Scholar] [CrossRef]
  6. Ghabezi, P.; Flanagan, T.; Harrison, N. Short Basalt Fibre Reinforced Recycled Polypropylene Filaments for 3D Printing. Mater. Lett. 2022, 326, 132942. [Google Scholar] [CrossRef]
  7. Srinivasan, R.; Pridhar, T.; Ramprasath, L.S.; Sree Charan, N.; Ruban, W. Prediction of Tensile Strength in FDM Printed ABS Parts Using Response Surface Methodology (RSM). Mater. Today Proc. 2020, 27, 1827–1832. [Google Scholar] [CrossRef]
  8. Sumalatha, M.; Malleswara Rao, J.N.; Supraja Reddy, B. Optimization Of Process Parameters In 3d Printing-Fused Deposition Modeling Using Taguchi Method. IOP Conf. Ser. Mater. Sci. Eng. 2021, 1112, 012009. [Google Scholar] [CrossRef]
  9. Zhong, R.Y.; Xu, X.; Klotz, E.; Newman, S.T. Intelligent Manufacturing in the Context of Industry 4.0: A Review. Engineering 2017, 3, 616–630. [Google Scholar] [CrossRef]
  10. Dilberoglu, U.M.; Gharehpapagh, B.; Yaman, U.; Dolen, M. The Role of Additive Manufacturing in the Era of Industry 4.0. Procedia Manuf. 2017, 11, 545–554. [Google Scholar] [CrossRef]
  11. Yun Yee, W.; Chang Choon, C.; Chee Siong, T.; Ambar, R.; Helmy Abd Wahab, M. IoT-Based Production Output Monitoring System for Plastic Packaging Manufacturing Process. IOP Conf. Ser. Mater. Sci. Eng. 2020, 864, 012087. [Google Scholar] [CrossRef]
  12. Majeed, A.; Zhang, Y.; Ren, S.; Lv, J.; Peng, T.; Waqar, S.; Yin, E. A Big Data-Driven Framework for Sustainable and Smart Additive Manufacturing. Robot. Comput. Integr. Manuf. 2021, 67, 102026. [Google Scholar] [CrossRef]
  13. Wenzel, S.; Slomski-Vetter, E.; Melz, T. Optimizing System Reliability in Additive Manufacturing Using Physics-Informed Machine Learning. Machines 2022, 10, 525. [Google Scholar] [CrossRef]
  14. Meng, L.; McWilliams, B.; Jarosinski, W.; Park, H.Y.; Jung, Y.G.; Lee, J.; Zhang, J. Machine Learning in Additive Manufacturing: A Review. Jom 2020, 72, 2363–2377. [Google Scholar] [CrossRef]
  15. Gogtay, N.J.; Deshpande, S.P.; Thatte, U.M. Principles of Regression Analysis. J. Assoc. Physicians India 2017, 65, 48–52. [Google Scholar] [CrossRef]
  16. Jo, B.W.; Khan, R.M.A. An Internet of Things System for Underground Mine Air Quality Pollutant Prediction Based on Azure Machine Learning. Sensors 2018, 18, 930. [Google Scholar] [CrossRef] [Green Version]
  17. Milad, A.; Yusoff, N.I.M.; Majeed, S.A.; Ibrahim, A.N.H.; Hassan, M.A.; Ali, A.S.B. Using an Azure Machine Learning Approach for Flexible Pavement Maintenance. In Proceedings of the 2020 16th IEEE International Colloquium on Signal Processing & Its Application (CSPA 2020), Langkawi, Malaysia, 28–29 February 2020; pp. 146–150. [Google Scholar] [CrossRef]
  18. Zaman, U.K.; Rivette, M.; Siadat, A.; Mousavi, S.M. Integrated Product-Process Design: Material and Manufacturing Process Selection for Additive Manufacturing Using Multi-Criteria Decision Making. Robot. Comput. Integr. Manuf. 2018, 51, 169–180. [Google Scholar] [CrossRef]
  19. Which Layer Height is Best for 3D Printing? Available online: https://3dprinterly.com/which-layer-height-is-best-for-3d-printing/#:~:text=The%20best%20layer%20height%20for%20an%20Ender%203%20is%20between,height%20that%20balances%20out%20well (accessed on 11 February 2022).
Figure 1. Proposed Methodology.
Sustainability 14 15475 g001
Figure 2. Drilling Grid (modified from Zaman et al. 2018).
Sustainability 14 15475 g002
Figure 3. One of the 27 manufactured parts (a) before test by UTM, and (b) after test by UTM.
Sustainability 14 15475 g003
Figure 4. Shimadzu Testing Machine.
Sustainability 14 15475 g004
Figure 6. Microsoft Azure Web Service.
Sustainability 14 15475 g006
Figure 7. Infill Density vs. Tensile Strength.
Sustainability 14 15475 g007
Figure 8. Infill Pattern vs. Tensile Strength.
Sustainability 14 15475 g008
Figure 9. Layer Height vs. Tensile Strength.
Sustainability 14 15475 g009
Figure 10. Number of Perimeter Walls vs. Tensile Strength.
Sustainability 14 15475 g010
Figure 11. Comparison of Different Tensile Strengths.
Sustainability 14 15475 g011
Figure 12. Comparison of % errors (Hyper & Predicted).
Sustainability 14 15475 g012
Table 1. FDM ENDER 3 V2 process parameters.
Ser No.Control ParameterUnit
1Layer heightmm
2Infill density%
3Infill patternGrid/honeycomb/triangle
4Number of perimeter walls-
Table 2. Levels of process parameters for DOE.
FDM Process
Parameters
UnitLevel 1Level 2Level 3
Layer heightmm0.160.200.28
Infill density%103070
Infill pattern-GridHoneycombTriangle
No. of perimeter walls-010204
Table 3. L27 Orthogonal Array and Output.
SerLayer Height (mm)Infill Density (%)Infill PatternNumber of Perimeter WallsTensile Strength (MPa)
10.1610Grid15.65
20.1610Grid15.92
30.1610Grid17.3
40.1630Honeycomb214.09
50.1630Honeycomb213.61
60.1630Honeycomb214.85
70.1670Triangle416.98
80.1670Triangle418.15
90.1670Triangle418.45
100.210Honeycomb413.06
110.210Honeycomb413.23
120.210Honeycomb413.91
130.230Triangle110.97
140.230Triangle110.52
150.230Triangle18.78
160.270Grid217.48
170.270Grid215.31
180.270Grid215.48
190.2810Triangle211.61
200.2810Triangle211.73
210.2810Triangle212.19
220.2830Grid418.29
230.2830Grid417.69
240.2830Grid416.69
250.2870Honeycomb113.09
260.2870Honeycomb112.41
270.2870Honeycomb112.13
Table 5. Online Gradient Linear Regressor.
SettingValue
Normalize FeaturesTrue
AveragedTrue
Learning Rate0.27507
Num Iterations1
Decrease Learning RateTrue
L2 Regularizer Weight0
Allow Unknown LevelsFalse
Random Number Seed0
Table 6. Sweep Results for Tune Model Hyperparameters (Optimal Values).
Learning RateNumber of IterationsL2 Regularizer WeightMean Absolute ErrorRoot Mean
Absolute Error
Relative Absolute ErrorRelative Squared ErrorCoefficient of Determination
0.4250573401.4518011.7163790.489020.1913850.808615
Table 7. Feature weights with and without Tune Model Hyperparameters.
FeatureWeight before Tune Model
Hyperparameters
Weight after Tune Model
Hyperparameters
Layer Height (mm)−0.6214891.45757
Bias6.435714.79949
Perimeter Walls5.509917.3376
Infill Pattern_Honeycomb_10.5455291.85053
Infill Pattern_Grid_02.629251.39499
Infill Pattern_Triangle_23.260931.55398
Infill Density (%)4.52054.83268
Table 8. Evaluate Data Statistics with and without Tune Model Hyperparameters.
MetricsValue before Tune Model
Hyperparameters
Value after Tune Model
Hyperparameters
Mean Absolute Error2.2330841.451801
Root Mean Absolute Error2.5958851.716379
Relative Absolute Error0.7521840.48902
Relative Squared Error0.4377760.191385
Coefficient of Determination0.5622240.808615
Publisher’s Note: MDPI stays neutral with regard to jurisdictional claims in published maps and institutional affiliations.

