
Integrating Occupational Health and Safety Risk and Production Economics for Sustainable SME Growth

1
Department of Mechanical Engineering, Zhejiang University of Technology, Hangzhou 310023, China
2
Department of Mechanical Engineering, University of Canterbury, Kirkwood Ave., Christchurch 8140, New Zealand
*
Author to whom correspondence should be addressed.
Sustainability 2022, 14(21), 14565; https://doi.org/10.3390/su142114565
Submission received: 7 October 2022
/
Revised: 31 October 2022
/
Accepted: 3 November 2022
/
Published: 5 November 2022
(This article belongs to the Special Issue Safety Role and Contribution to Industrial Sustainability)
Abstract
:Small and medium enterprises (SMEs) in the manufacturing industry normally arise as a result of product innovations. Transiting and growing into large organizations is a critical process for the sustainable growth of SMEs, and this requires developing appropriate production systems. Such development focuses on production economics and the optimization of facility layout, production capacity, and machine utilization. These optimizations are usually achieved using discrete event simulation (DES). However, the DES primarily focuses on production optimization and is not formulated to give concurrent attention to occupational health and safety risks, where the workers’ occupational health and safety are also important to production systems; hence, sustainability issues arise. Until now, the production economics and workers’ health and safety are usually treated separately, and the health and safety aspects are often managed after the system has been developed. This brings increasing hazards in the production environment since adding new facilities to the system may introduce new hazards and cause further safety issues. The present paper proposes a methodology to solve the above concerns. Its key features are the use of a quality-of-life metric for determining the occupational health and safety risks of a particular work activity and the embedding thereof as a routine in DES for manufacturing plant simulation. One of the contributions of the proposed integration method is that it helps to enhance the development of production systems that support financial due diligence, as well as occupational health and safety (OHS) due diligence. This is particularly important to SMEs in the manufacturing industries, where growth comes with particular sustainability challenges related to the need to develop more systematic operational and safety management systems.
1. Introduction
Small and medium enterprises (SMEs) offer substantial contributions to national economic and employment growth. Compared to large enterprises, SMEs have many advantages; for example, they offer relatively independent and agile operational systems and can provide quick responses to changeable market requirements. With time and the establishment of their product in the market, SMEs may grow to become larger organizations, with a greater financial turnover, and then they can employ more staff and enlarge their production systems. Therein lie many challenges for organizational growth, and one of them is how to manage occupational health and safety (OHS) and production system growth in a sustainable way [1,2]. The issue is that safety management systems tend to arise organically in response to the current state of manufacturing; hence, scaling these up is not straightforward. In contrast, the growth phase for the manufacturing system typically prioritizes improvements in productivity and capacity, which can inadvertently dominate over other considerations. Both the production economics (e.g., costs and investment) and safety systems (e.g., the risk management system) need to be considered together [3]. Production economics, here, refers to the microeconomics field that examines producer decisions. In manufacturing industries, production economics are associated with, for example, costs, investment, and labor. The conventional method for production system growth development is to use discrete event simulation (DES), which shows how the functional state of the plant evolves over a working period. Many types of DES software, such as Siemens Plant Simulation [4], Rockwell Arena [5,6], and Simul8 [6], use models to represent the production processes. Typical priorities given for these methods are to improve machine utilization and reduce waiting time [5]. The programs are capable of stochastic computation using Monte Carlo methods, which can be used to handle process variability. However, the plant optimization methods only report the metrics of production economics (e.g., machine/operator utilization, production capacity, work in the process, and waiting time). There is no explicit mechanism to examine reducing OHS during the optimization process.
Methodologies do exist to manage OHS risks; for example, fault tree analysis, failure mode effects analysis, and bowtie analysis [7]. However, they tend to be used separately and after the production system has been developed. Elements of industrial ergonomics have been included in DES [8,9], primarily in terms of physical anthropometry or biomechanics [10]. Other types of OHS hazards, for example, the long-term health risks of dust inhalation and other chronic conditions, are not evident in the plant simulation literature. The long-term health risks are especially important to manage, due to the covert progression thereof and the increased regulatory attention to chronic harm, but the literature is silent on how these may be considered together with production economics.
The scaling up of production processes varies in complexity. In simple cases, it may be sufficient to merely replicate the existing production processes, e.g., to add another shift to gain temporal capacity, or to install more of the same types of machines to gain parallel capacity. In these simple cases, the nature of work undertaken by the operators is essentially unchanged, and the health and safety implications can be quite innocuous. In more complex cases, scaling up requires the substitution of technological processes. A typical example is the introduction of automated systems alongside human operators. Another example would be the replacement of a slow 3D printing process with an injection molding machine. In these substitution cases, there is a change in the nature of work undertaken by human operators; hence, new OHS hazards emerge. The plant/logistics simulation approach is almost wholly unable to represent this safety dimension and instead transfers it to a subsequent analysis that is outside of the simulation. This is not ideal, because it means that health and safety are excluded from the optimization algorithms. This is in stark contrast to modern legislative frameworks, where OHS has to be given equal consideration with functional and economic factors early in the decision process.
The current issue is a lack of methodologies to achieve the simultaneous integration of OHS risks and production economics. Developing such a methodology has the potential to help SMEs mature their OHS management systems as they grow. A further potential advantage is in helping them to show due diligence toward their duties under OHS legislation, where the expectation is typically for hazards to be reduced as far as reasonably practicable, irrespective of organizational size [11].
Generating decisions that concentrate on a single aspect is unwise and is not sustainable for system growth. The current manufacturing system development is more focused on the gaining of production economics and often disregards the worker’s health and safety. Some of the current methods for managing OHS and production economics are disjointed treatments. In addition, OHS risk assessment is often obtained after the production system has been developed, which is a bad idea for safety management, as production development, e.g., adding new facilities, may introduce new hazards to the system. To solve this issue, it is necessary to consider OHS and production-system development at the same time. The primary objective of the paper is to develop a solid method to assist SMEs in the sustainable growth of their production systems. This is achieved by integrating OHS risk assessment into plant simulation. The specific area under examination is the manufacturing industry and employs a bakery as a case study. The solution uses risk assessment, which is a practice familiar to larger industries, to represent the OHS risk. In this case, the risk is measured using the diminished quality of life risk assessment (DQL) [12], which was developed from the World Health Organization Disability Assessment Schedule (WHODAS) [13]. DQL has the ability to represent both a short-term safety risk and a long-term health risk [14,15,16]. We achieved the integration by programming the DQL assessment, using decision models and station models, in Arena DES software. Section 3 describes the methodology in detail, with Section 4 giving a case study of a bakery, while Section 5 and Section 6 address the discussion and conclusions, respectively.
2. Literature Review
2.1. Plant Simulation
Plant simulation is a computer application for modeling plant activities, including the logistics of operations and material flow. It also offers analysis and visualization of the production systems [17]. Plant simulation is often applied to assist production economics analysis and is widely used for optimization: it can be used to improve machine utilization, increase production efficiency, decrease queuing time, and maximize service capability [18,19]. Representative applications are, for example, production planning [5,20], data-based decision-making [21], facility layout arrangement [22], and uncertainty analysis [23]. Existing simulation methodologies have been widely applied, such as discrete-event simulations (DES) [24,25,26] and Monte Carlo simulations [27,28,29,30], although explicit mathematical models are sometimes used either alone or as routines within those other systems [31]. The plant simulation activity is closely associated with productivity and, hence, has implications for production economics. The existing literature shows that this connection is effective, for example, in shortening the production cycle [32]; production line balancing [33]; logistics flow performance [34]; production scheduling [35,36]; the theory of constraints modeling (different improvement scenarios are used to solve the bottleneck [37]); the analysis of customer-perceived value networks using DES [38]; supply chain logistics (multi-product and multi-echelon, using DES [39], different optimization algorithms [40], and software comparison [41]). There are numerous other examples of the application of DES to all manner of production layout, freight, logistics, and queueing problems. Invariably, the studies focus on productivity as the key output metric [42]. In doing so they ignore the question of human safety, the exceptions being the studies by certain authors [43,44]. This is an odd situation because productivity cannot be separated from the human dimension of work, except for fully automated systems. Therefore, the exclusive focus on modeling the productivity of technical systems is unsustainable without the consideration of health and safety. When it comes to the specific case of long-term health risks, as opposed to accidents that cause immediate injury, the literature is devoid of examples that integrate plant simulation and health.
2.2. Occupational Health and Safety Risk Assessment
OHS has gained importance in most countries [45], and the literature on OHS risk assessment focuses more on the short-term safety aspect of OHS, i.e., on accident scenarios. The long-term chronic health risk part is not included explicitly in most extant methodologies. The formalized risk management method, ISO 31000 [46], also tends to focus on safety rather than health. This is understandable as the abstract concept of health is difficult to anticipate and model, due to: (a) the long delay before consequences arise; (b) the complex ways in which different types of chronic harm accumulate; (c) the difficulty of attributing an adverse health outcome to a specific industrial episode of work; (d) the highly variable dose-response relationships for different types of exposure. The existing OHS risk management research has mostly focused on decreasing the likelihood of the incident arising [47,48], which is effective when associated with short-term safety incidents but has limitations in managing long-term health issues [5,12]. Many chronic health issues [49,50] arise from cumulative exposure, which is difficult to detect [51]. Hence, many safety risk assessment methods suffer from poor efficacy in managing long-term health risks [52]. Common cumulative biological consequences include respiratory issues [53], musculoskeletal injury [54], hearing loss [55,56], and skin damage [57]. Preventions include using efficient PPE [49,58] and employing ergonomic workstations [59].
Regarding the industry under examination, a bakery consists of different operations, such as cooking, forming, and packing. Food production has previously been analyzed and simulated from a production perspective [60]. Food production contains multiple OHS hazards for which separate analyses are available, but none of these have been integrated with the plant simulation approach. Typical hazards include repetitive movement [61], dust [62,63], sensitization [64], and chemicals [65].
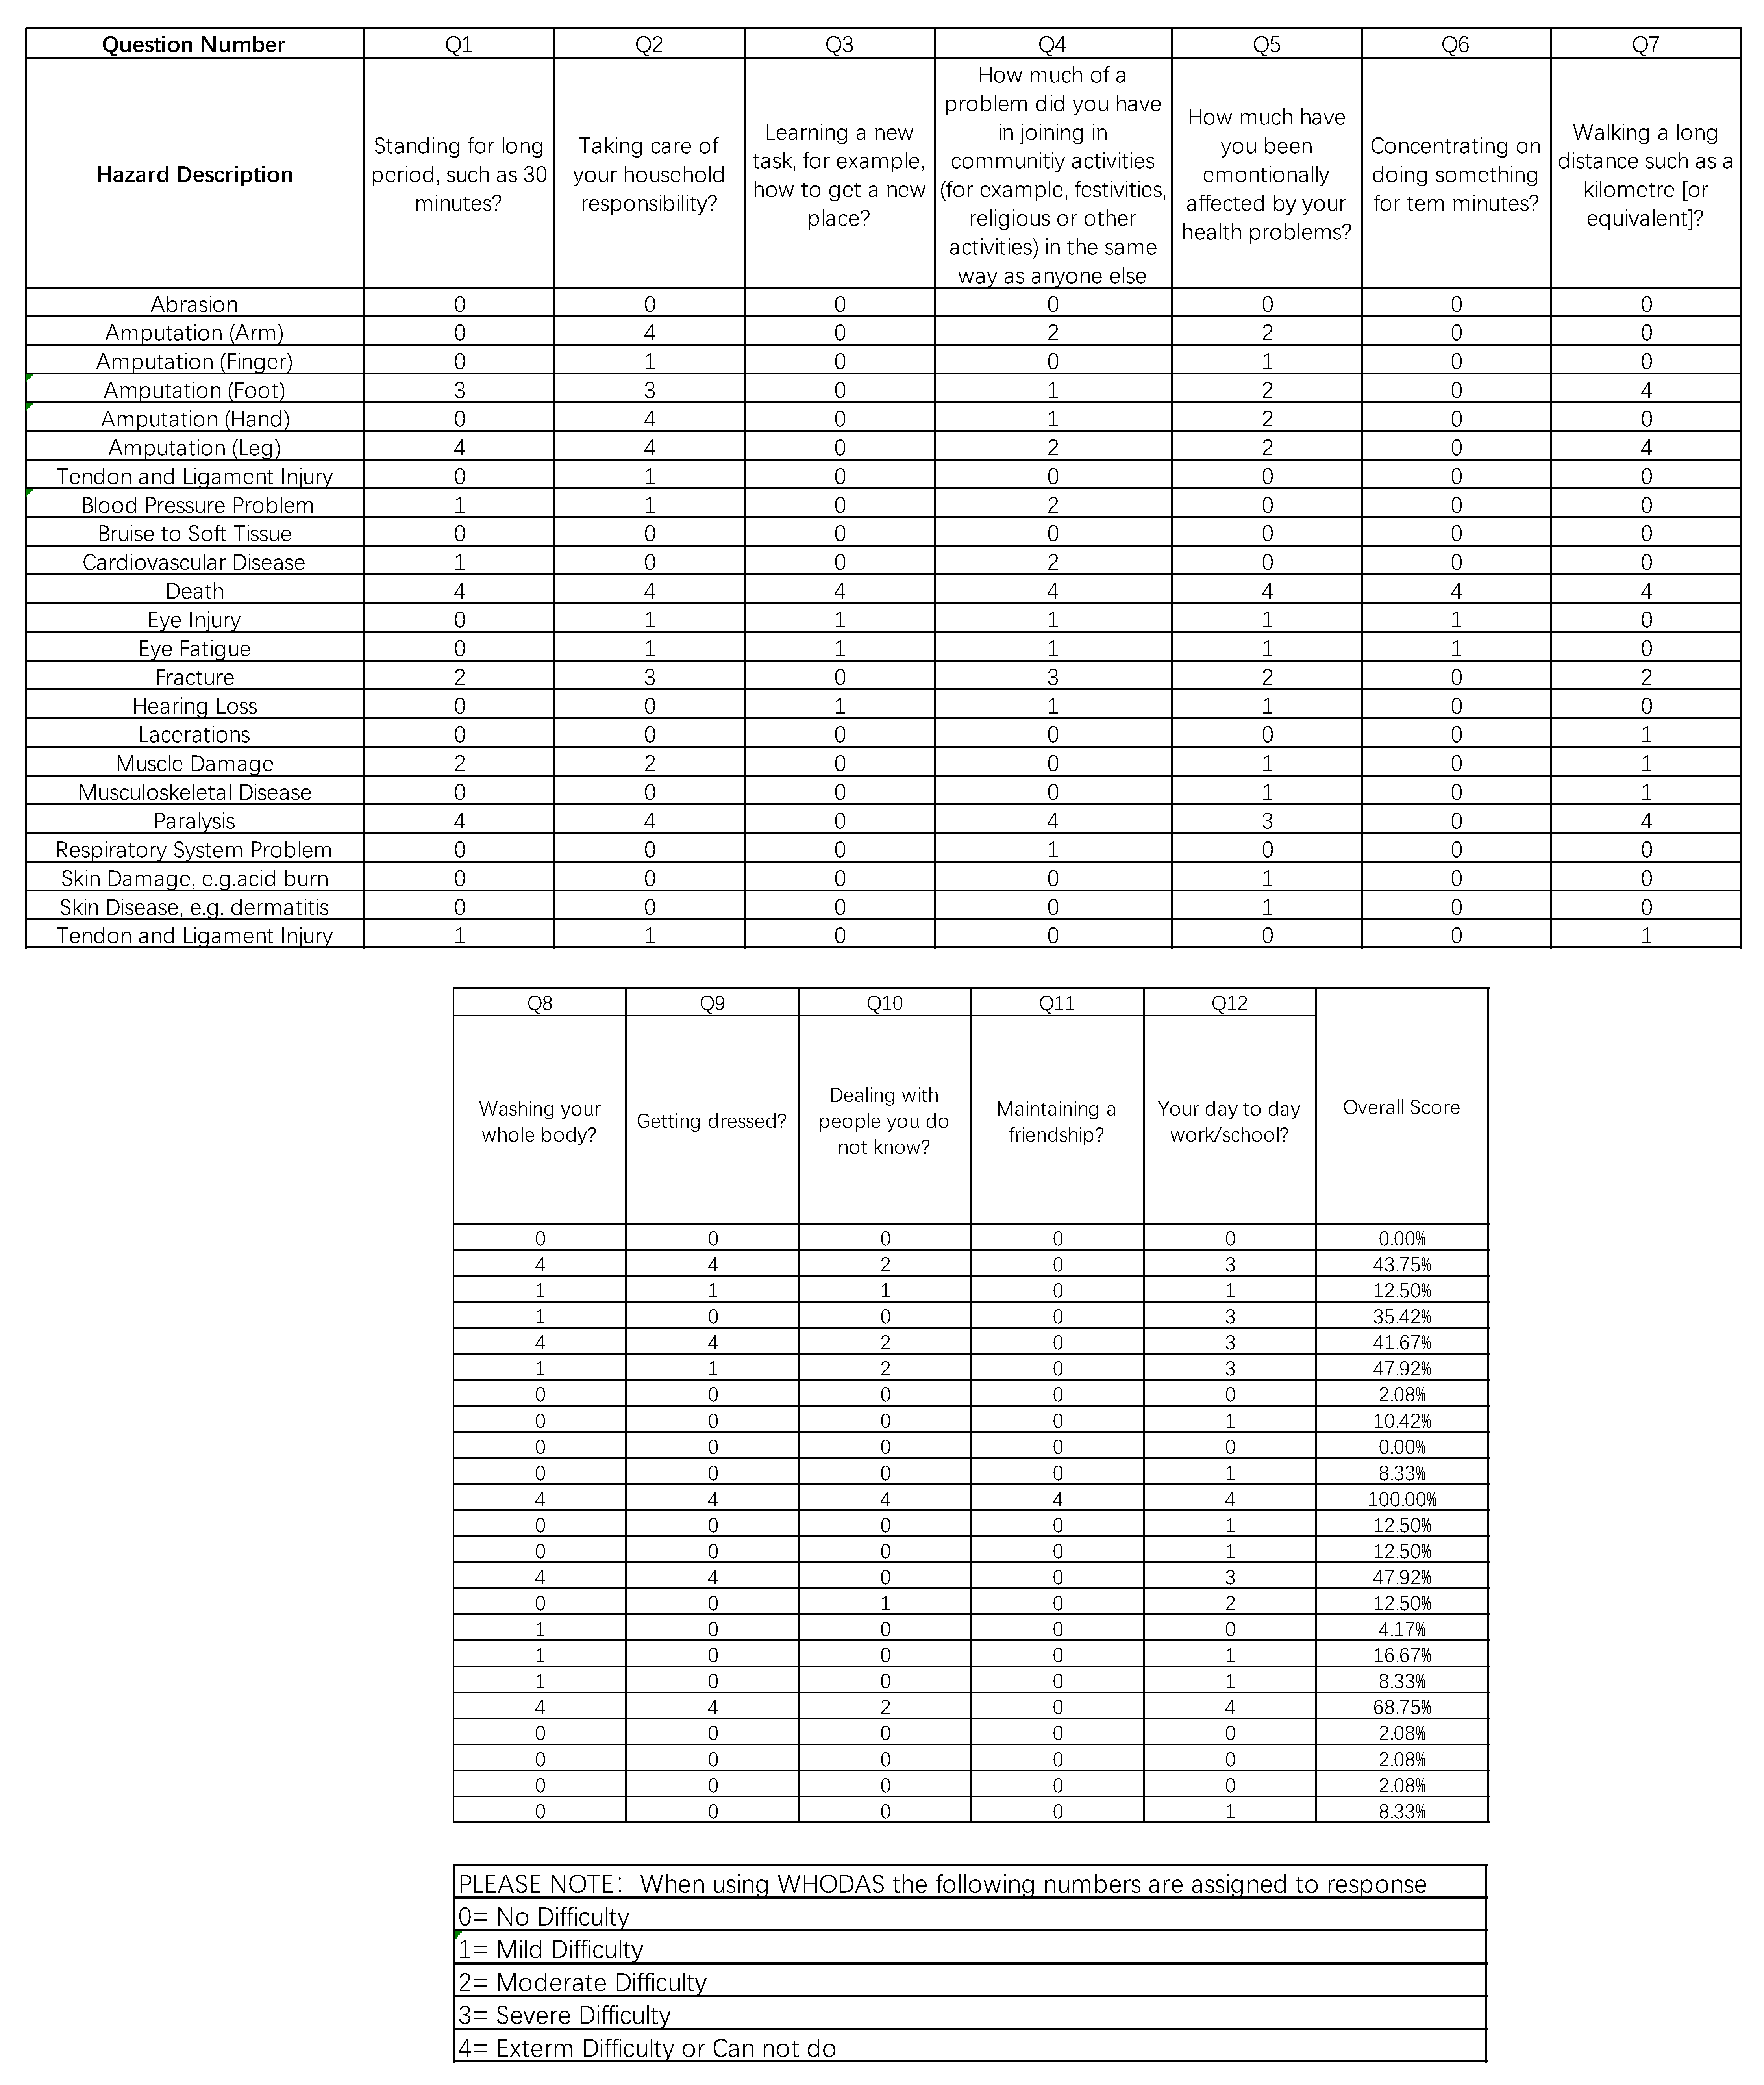
Some methods assume that chronic exposure reduces the lifespan, for which the unit is disability-adjusted life years (DALY). However, a different perspective taken by the authors of [12] is that chronic exposure reduces the quality of life. This measure better accommodates the non-fatal nature of many occupational exposures. For example, deafness, which is a common industrial health issue, does not reduce the lifespan and, hence, is not easily represented in DALY units. However, it does reduce the ability to converse with family and friends and, hence, reduces the quality of life. The concept of ‘quality of life’ is a term used in healthcare; in recent years, dedicated measuring instruments (scales based on questionnaires) have been developed for specific medical conditions. In particular, there is a validated instrument for measuring the quality of life, in the form of the Disability Assessment Schedule from the World Health Organization (WHODAS) [13]. WHODAS is a quantitative QOL measurement. The primary aim of WHODAS is to quantify how disability affects the subject’s lived experience (as opposed to reducing their lifespan, as in the DALY approach). The measurement evaluates the QOL through six domains, including cognition, mobility, self-care, getting along (interacting with others), life activities, and participation. Each domain question uses a 0–4 Likert scale, where 0 represents ‘no difficulty in performing such an activity’, and 4 represents ‘cannot perform such an activity’. The maximum score of WHODAS is 100, which represents extremely poor health [13].
A recent development has been to apply the WHODAS to a diminished quality of life (DQL) metric for industrial occupational safety [12]. From a risk perspective, the WHODAS measure represents the severity of a particular consequence of harm, and a higher WHODAS value represents a greater severity of harm. Hence, DQL provides a quantitative approach by which to identify the level of likelihood and severity of consequences [16]. Furthermore, it accommodates both acute accidents (safety) and long-term chronic harm (health).
2.3. Gaps in the Integration of Plant Simulation and OHS Risk Assessment
Although there is a wide range of literature on both OHS risk assessment and system development, there are very few existing studies associated with the integration of the two aspects. The closest study is that of Kazerouni et al., who proposed a method of integrating safety assessment with facility layout planning. The authors considered transportation costs, as well as safety risks, in the early layout design [66,67]. However, their studies focused more on short-term injuries, e.g., machinery impact, and many long-term health risks, e.g., the inhalation of dust and musculoskeletal injuries, were weakly addressed. In addition, although the studies integrated risk assessment in plant layout design, the risk algorithm it used is not suitable for long-term health risk assessment. Farid developed a tool to examine musculoskeletal injury risk and worker productivity [44]. The study examined the relationship between human factors and production efficiency. However, their application to other types of OHS risk was undeveloped. Some other studies have used simulation-based risk assessment; however, these works focus more on production safety rather than occupational health and safety. For example, Kanj developed a multi-agent model to assess operational safety and production performance [68]. Afonso recently proposed a simulation-based model for COVID-19 temporary hospitals; they used DES to balance the doctors’ team size and flow and layout safety [69]. However, the safety issues they discussed are associated with avoiding multiple movements and returns, not with a person’s OHS risks. Additionally, these existing contributions tend to be either conceptual or theoretical in nature, and the deeper problem remains of finding a mechanism to integrate risk assessments into the plant simulation process.
Apart from the need to find mechanisms to include both health and safety in the plant simulation process, there is also a need to consider the growth of the organization. In particular, SMEs often have the problem of needing to develop organizational systems to match their growth phase. Compared to large organizations, manufacturing SMEs may have plant that is multi-use and is reconfigured for a variety of production orders. This is notably the case for SME bakeries and industrial food processors, where the production plant is used for a variety of products, and significant changeover activity may be involved [70]. In order to meet this situation, the manufacturing systems typically need to be agile. This tends to involve the deployment of either lean methods [17] or theory of constraints methods [71,72,73]. The theory of constraints is a management view that illustrates the finding that the attention of the management should concentrate on the few constraints that prevent the goal’s being achieved, the constraints are also known as a bottleneck [74]. Other well-known theories include manufacturing resource planning and just-in-time [75]. A further challenge for SMEs is the need to consider the relationship between productivity growth and capital investment. Increasing productivity by employing extra production resources (e.g., human labor and the machine) requires capital investment, and there is the expectation of a return on this investment. How a business model evolves during SME growth is known to be highly complex [76], but it is only rarely studied [77,78,79] and even then, it has not been studied in the context of plant simulations.
For the sustainable growth of organizations, there is a need to manage the OHS risks alongside production operations; the growth needs to be economically viable. Given the naturally close association between plant simulation and production economics, there is a risk that the OHS hazards of growth are only given secondary consideration when they really need to be considered holistically, alongside their functional and economic aspects.
3. Research Method
3.1. Research Objective
The primary aim of this work was to develop a methodology to provide an integration of plant simulation, occupational health and safety, and the capital implications of growth strategies. The context of the analysis is SMEs, while the particular case study concerns a food production facility (a bakery).
3.2. Research Approach
The overall research framework for SMEs to generate sustainable growth decisions that harmoniously consider OHS risks and production economics is summarized in Figure 1. The first step was to investigate the production operations, which were then simulated using the Arena software (version 16.0). To model the production process, on-site observations were conducted to determine the context and collect operational data on plant layout, production workflow, labor workforce, and the distribution of processing time. Ethics approval was obtained from the University of Canterbury (HEC 2019/28/LR-PS) for the data collection and interviews.
The next stage was to measure the OHS risk, including an estimation of the frequency of incidents arising, the likelihood of harm occurring, and the corresponding severity of biological consequences. The frequency and likelihood in this context were determined based on discussions with the OHS representative and general manager. The severity of consequences was determined using the WHODAS instrument [12] by the domain experts (see Appendix A for details). The DQL computation was:
where:
represents hazards associated with the examining scenario;
represents the frequency of ;
represents the likelihood of the consequence caused by ;
represents the severity of the consequence caused by .
In this study, and were determined by the OHS representatives, using the Word estimation of probability [16], and , via the WHODAS instrument.
The next stage was to develop the ‘DQL routine’ in the Arena simulation. The DQL routine is a simulation program model developed by the author team for assessing the OHS risk using DQL risk measurement theory. The routine takes three input parameters: frequency of the incident arising, the likelihood of the harm occurring, and the severity of the consequence. The routine was implemented using an assign module, a decision module, and a station module. The architecture for this process is shown in Figure 2.
The next stage was to analyze the risk of OHS and production economics based on the status quo. Boxplots were used to analyze DQL results for different scenarios. Thereafter, several progressive productivity improvement plans were devised in consultation with the staff of the plant, and a simulation scenario was created for the various plant configurations. The results then report the OHS risk, production capacity, capital investment, cost savings analysis, and labor resources. The growth plan then emerges from the consideration of these scenarios.
4. Results of a Bakery Case Study
4.1. Background of the Case Study
The SME bakery identified the food production process that they wished to be examined. This was the production of meat pies and, in particular, the potato topping operations. These operations produced meat pies with the pastry on top being replaced with a mashed potato layer. The issue was that the potato had to be manually squeezed onto each pie; this was effortful for operators and may cause long-term health issues, e.g., musculoskeletal disorders. Alternatively, the increasing demand of the market requires that the bakery produces more meat pies. Hence, this demonstrates a need to increase the productivity of the system. There are several typical ways to enhance productivity, for example: (1) adding more work shifts, although this may cause higher musculoskeletal disorder risk; (2) adding new production facilities, although this may introduce an unknown OHS risk to the system. To solve these issues, the proposed integration method is used to generate a growth decision that combines the considerations of OHS risks and production economics.
4.2. The Status Quo Simulation
The simulation of the production system using Arena is shown in Figure 3. To make the meat pies, the workers cook the meat base in the early morning and then chill it in the freezer for one day. They also make the bottom pastry layer in advance. The daily production team uses these two pre-made components and adds the topping pastry/potato layer. After the pie is created, the finished pies are loaded into trays and moved to an oven for cooking. Cooked pies are moved to the freezer room to chill. After one day, these pies are packed and then dispatched to the customers. The simulation of the status quo is named Scenario No. 1. Stochastic estimates of the times were collected, and 200 replications were run in the simulation, yielding the average times of the different processes, as shown in Figure 4.
4.3. The DQL Assessment in the Simulation
The OHS risks of the system were examined by the domain experts, including the primary authors, the OHS representatives, and the general manager from the bakery company. The risk parameters, e.g., likelihood, frequency, and consequence, are shown in the OHS risk register (see Table 1). The hazards that have been identified are based on multiple sources, including the Health and Safety Executive in the UK, the Occupational Safety and Health Administration in the USA, and the World Health Organization. These data were then used in the DQL routine to determine the arithmetic mean risk of each biological outcome, with the results shown in Figure 5. In the potato-topping process, the mashed potato had to be manually squeezed onto each pie; the mashed potatoes were contained in a bag and carried by workers on their shoulders. The activity was repetitive and would usually last a long period; hence, there was a risk of musculoskeletal complications. Therefore, an initial improvement plan was generated by the engineers and managers, which was to deploy an automatic machine for the topping process. However, it was unclear whether the extra machine would introduce additional OHS risks [80], and how it would affect the operation of other tasks. To solve this concern, simulation Scenario No. 2 (with a simulation using an automatic potato-topping machine instead of manual topping) was created and analyzed, with the results shown in Figure 5. The DQL risk thresholds were adopted from [12], as shown in Table 2. In the DQL risk assessment, low risk and moderate risk are acceptable levels of risk, which means that the system is safe for workers. For a low risk, there is no further OHS treatment required for the system. For a moderate risk, it is necessary to apply some treatments over a reasonable time. High risks and extreme high risks are unacceptable levels of risk, which means that the system is unsafe for workers. For high risks, it is required that the management implement appropriate solutions as quickly as possible. For extremely high risks, the whole production system must be halted until sufficient preventive measures and recoveries have been applied to the system.
The hearing loss risk due to the new machine was found to be the only increase in Scenario No.2, while other OHS risks were lower than the status quo. The hearing loss risk is at a low level and should be preventable with proper PPE. The musculoskeletal injury risk was determined as ‘moderate’ in the status quo, and as ‘low’ in Scenario No.2, due to the removal of the repetitive manual pie-topping process.
Although the average DQL metrics are instructive, it is useful to analyze their variability. Boxplots for the musculoskeletal injury risk between the status quo (Scenario No. 1) and Scenario No. 2 are shown in Figure 6. The separation (lack of overlap) of the plots shows that the effect is an appreciable one, not merely a small difference in the means, i.e., that the automated pie-topping machine is likely to be a worthwhile OHS improvement.
4.4. Productivity Analysis between Status Quo and Scenario No. 2
The next challenge is to compare the productivity performance between the status quo and Scenario No. 2. The time spent on each process in Scenario No. 2 is summarized in Figure 7.
The results show an appreciable decrease in average waiting time in the potato-topping process for Scenario 2. The difference arises because the machine does not need a regular break and, with regular maintenance, the machine is unlikely to break down during production. The waiting time for oven-cooking was found to increase in Scenario No. 2. This is because the increased productivity of pie topping results in more uncooked pies being presented for the cooking process. Such a delay may be acceptable at the current level of market demand but could be a bottleneck when SME growth occurs.
According to the simulation result, we summarized that as production increases, the frequency and likelihood of hazard exposure increases, and the OHS risk increases. There are several suggestions; the first is to better organize the working shifts between workers, as this would decrease the frequency of hazard exposure per worker. The second solution is to improve the productivity of the overall production system, to shorten the total time of production. This would require upgrading the operational facilities and may also add to the cost.
4.5. Scenarios for System Growth
In general, it may be anticipated that the growth of a manufacturing SME requires an increase in organizational productivity, which may be met by a combination of staff working faster, longer hours of operation (longer shifts or more shifts), and investment in more or better plant. All else being equal, as production increases, the frequency and likelihood of hazard exposure increases, and the OHS risk increases.
For this section, a number of growth strategies were developed for the bakery. The approach was to seek improvements in terms of a plant upgrade type that could reduce the average waiting time. In our bakery case study, the cooking and forming of the pies are the two processes that have a greater average waiting time than others.
The primary production rate of the status quo (Scenario No. 1) was 12,000 pies per day; growth was considered as multiples of 12,000. The growth options were the number of pie-forming machines and the number of ovens; various combinations of these variables were trialed (see Table 3). These were represented in the plant simulation model; the results are shown in Figure 8.
The waiting time at cooking worsened in Scenarios No. 6, No. 7, No. 8, and No. 9 (plant configuration C). These scenarios were not considered further.
The relationship between the total working time and production target (demand loading) is shown in Figure 9. The total available work time per day was assumed to be 24 h (3 shifts). The total time was linear as a function of the production rate. Hence, the production capacity can be computed, as shown in Table 4.
The gross profit (excluding overheads) can be computed by (3) and (4), below:
where represents profit, represents total revenue, represents the cost of salary payment for workers, and represents the cost of investment of adding an extra machine (with the simplifying assumption that it is depreciated in one year):
where represents the salary rate per hour, and represents the total annual production time.
The profit model used here is a somewhat simplistic model of production economics and is used for illustrative purposes. Simplifying assumptions include: (1) organizational overheads are excluded; (2) labor is a casual resource that can be expanded and shrunk without hiring or redundancy costs. In practice, employment relations would affect this variable. (3) There is no limitation on the space available for plant expansion, nor any capital or service costs regarding space utilization. In practice, space constraints are often material considerations in activity-based costing. (4) Waiting time, whether queue congestion or non-value-added processes such as cooling, has no financial cost other than that of labor. In practice, these do have costs, even if only for building services. (5) The time value of money and the depreciation of assets are ignored. New machines are assumed to be depreciated in one year, and the depreciation of all existing assets is ignored. (6) The profit margin per product sold (a pie) is assumed to be constant. In practice, it would depend on many other parameters: changes to input material costs, variable labor costs (some tasks might require either more or less skilled labor, hence requiring salary changes), overhead costs, depreciation, economies of scale in purchase and production, and marketing costs for finding new outlets for the increased production, among others.
Some of these parameters might be changed by the selected growth strategy, especially the building services costs, changes in labor skills, and economies of scale in purchase and production. These second-order interactions are ignored.
The model uses the following assumptions, which are merely representative to illustrate the method; the assumptions of costs and profits are from the general manager of the bakery:
- Storage space is sufficient and is always available;
- An extra pie-forming machine would cost NZD 10,000, including installation;
- An extra oven employed in the system would cost NZD 10,000, including installation;
- The operation cost of other machines is not considered, because they are the same in different scenarios;
- The profit margin per pie is NZD 0.10;
- 5 skilled workers are always available for pie production;
- A worker is paid NZD 20 per hour;
- The factory operates 300 days a year.
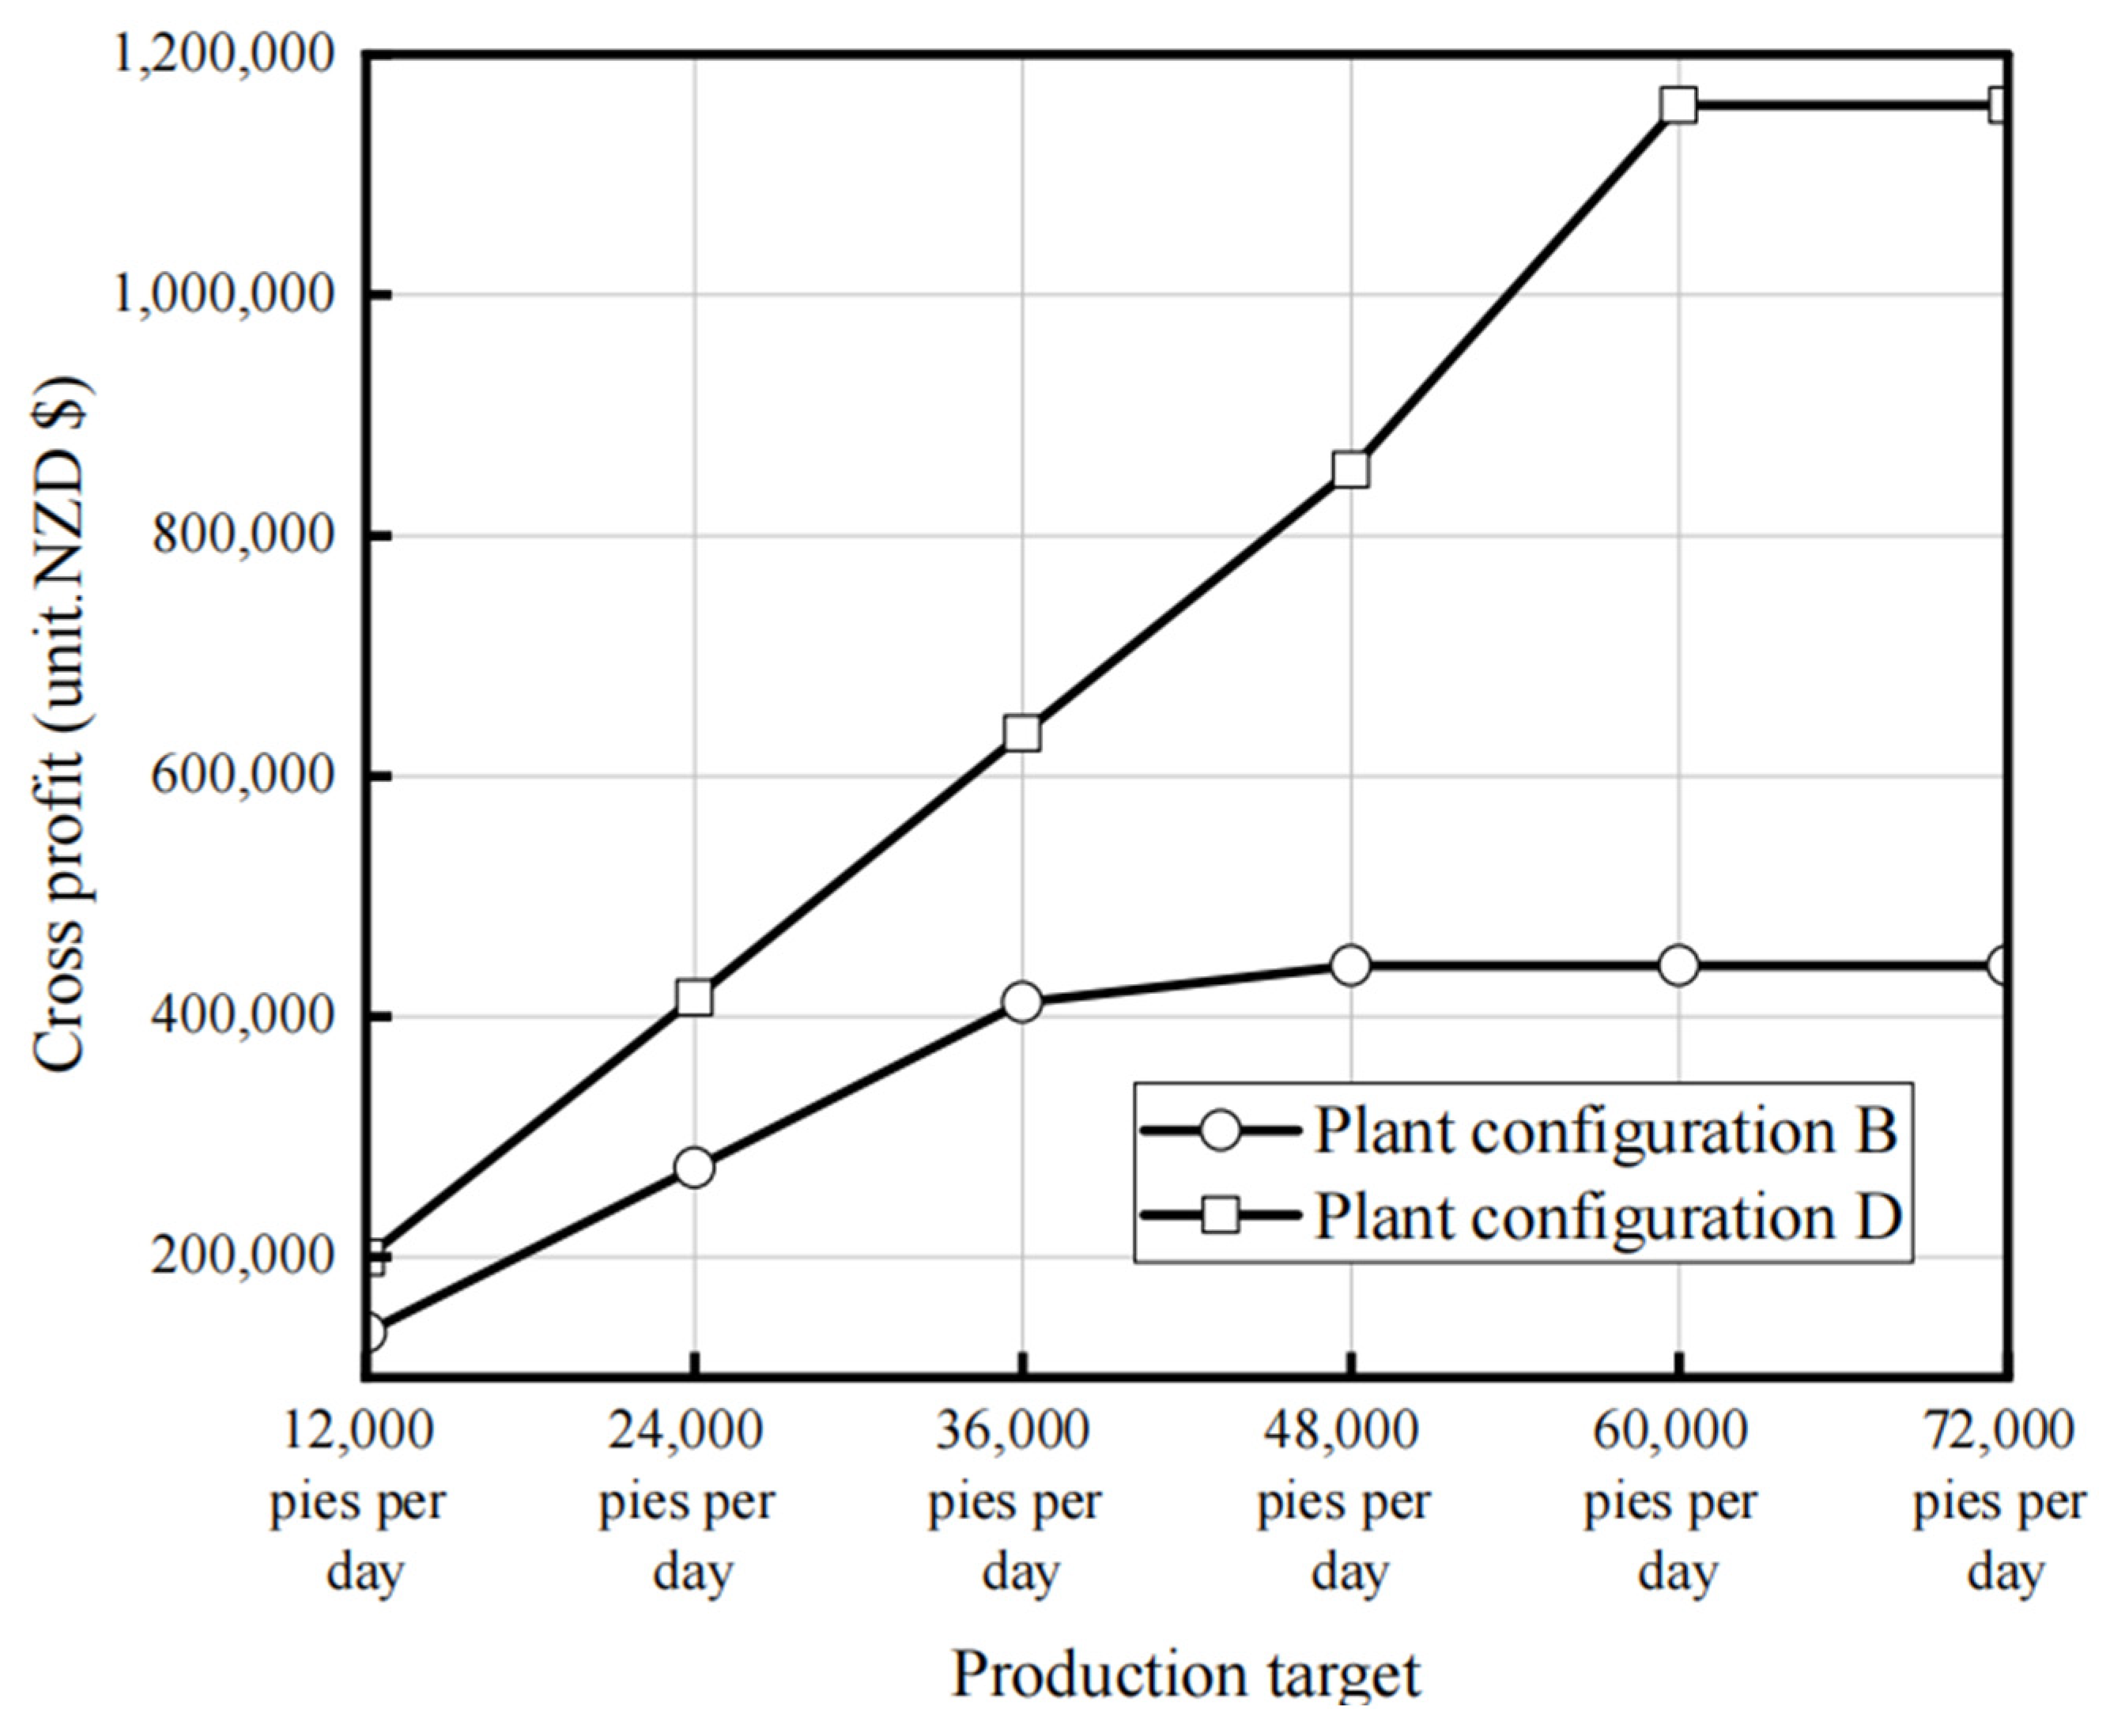
The improvement in production economics between the arrangements is shown in Figure 10.
As shown in Figure 10, the profit of plant configuration B has a linear increase, until the demand is around 36,000 pies per day, and then becomes flat. This is because Scenario No. 2 limited the ability to deal with large orders. Plant configuration B has the advantage in a situation where the production demand is uncertain, as it provides a way to increase productivity using labor and with no requirement for extra plant investment.
In plant configuration D, the profit also follows a linear increase at first, but the amount of profit is higher than for plant configuration B, for every production target. The difference between plant configuration B and plant configuration D is minor when the demand is small. The trend becomes flat when the demand is around 60,000 pies per day, with Scenario No. 10 being the limiting factor. The advantage of plant configuration D is that it offers a way to increase productivity and profitability, but it does require the certainty of growth in demand.
4.6. DQL of Growth Scenarios
In our growth scenarios, the DQL result does not change with the different numbers of machines as long as they are the same type of machines because this does not introduce new risks to operators. The algorithm of DQL represents the likelihood, frequency, and consequences so adding more of the same machines will typically not change these parameters, although it might increase the exposure to some hazards, such as noise. Nonetheless, in general, the DQL simulation could be run again, if different machines and hazards were introduced.
5. Discussion
5.1. Contribution of the Work
The contribution shown here is a methodology whereby OHS risks, including chronic harm, may be integrated along with plant simulation. The integration is via a DQL routine that is programmed alongside the plant simulation, using Arena software. This has the benefit that the plant may be optimized for both productivity and safety at the same time. In contrast, the existing methods for plant simulation and risk assessment tend to be separate activities.
Moreover, the method also accommodates occupational exposure and chronic harm outcomes, which is an area wherein conventional industrial risk assessments have difficulties. The risk outcome using DQL is quantitative and, hence, can be numerically compared between the different plant configurations, which may be helpful when evaluating the different improvement options.
Furthermore, the method is applicable as a way to determine the efficacy and safety of growth strategies. This is particularly relevant to SMEs, which tend to have limited cash flow. Increased production may be achieved by a combination of staff and plant changes, and the current method identifies the productivity of these various combinations. It is clear that some combinations are better when demand is difficult to predict, whereas others are better when a high certainty of demand exists.
5.2. Comparison with Other Traditional Methods
The importance of safety in production systems has a long history and is sometimes known as ‘inherent safety’ (Kletz) [81]. The concept of ‘inherent safety’ achieves its goals in four steps, including: (1) minimizing by reducing the number of risky materials used in the production; (2) substitution by replacing items with less risky material; (3) moderating by minimizing the harmful consequences; (4) simplifying by designing simple systems rather than complex systems. The literature is silent on the integration of OHS risk with plant simulation. Some recent studies [10,82] used virtual reality and ergonomic manikins to examine human ergonomics alongside production economics. However, such an anthropometric approach is unsuited to capture the broader spectrum of OHS risks, e.g., chemical exposure, dust inhalation, noise, etc. Other studies are developing safety simulations, e.g., the authors of [83] are majorly focused on accident prevention rather than on production economics.
Compared with the previous studies, the current work has several contributions. (1) The computation of long-term health risks is a difficult problem that is addressed, and a solution is offered. This is achieved by the integration of DQL with DES. Previous works, e.g., [66,67], used a conventional risk assessment method that is not suitable for assessing long-term health risks, due to the inefficiency of the measuring scale when it comes to examining long-term biological consequences. In addition, the DQL method is suitable for both short-term safety risks and long-term health risks and, thus, provides a much-needed method for computing the overall OHS risk. (2) A mechanism is provided to integrate OHS risk assessment and plant simulation. This is an area of the literature that is sparse. The current paper achieves this assessment via a risk computation routine programmed into the DES software (Arena). With this routine, the simulation could not only deliver the production-related parameters but also the safety risk outcomes. This provides decision-makers with a method by which to consider the OHS risk and production economics at the same time. This is important from the legislative perspective, where OHS is expected to be given equal consideration alongside the economic and functional perspectives. It also introduces a sustainability element (the human aspects of well-being) into the economic world of plant simulation. The existing works in the literature typically treat production modeling and safety assessment as separate activities and, often, safety is considered after the production system has been developed.
5.3. Limitations and Opportunies
Although quantitative OHS risk outcomes are presented here, a subjective judgment of the frequency of incidents and the likelihood of harm is still needed. This is a common issue in risk management and is not unique to the present method.
One limitation of the study is that the nature of the case study (plant upgrade) proved to be simple in that a sector of human labor was replaced in its entirety by an automated system. As there was no need for human operators to work actively alongside the automated system, there were no new major hazards being introduced. Consequently, the analysis showed that all the configurations showed improved OHS outcomes as well as improved productivity metrics, and this made the decision-making process simple. In more complex cases, it can be expected that the safety and productivity measures might conflict, i.e., non-dominated tradeoffs may arise. This is not a deficiency of the methodology because all we are proposing herein is a simulation system designed to inform decision-making, not an optimization algorithm or automated decision-making framework. The question of how to optimize conflicting measures is a difficult problem. Multi-objective optimization is a well-known problem in the literature, and numerous algorithmic approaches are available that represent cost or utility with various mathematical functions, accommodate a mix of continuous and discrete variables, and involve elements of human choice (e.g., a pairwise comparison [84]) There is also a lens that takes the perspective of psychological prioritization [85]. Hence, there exist many methods that might be used to add an optimization functionality to the simulation presented here, should that be necessary. The present paper merely proves the principle that safety considerations, including the difficult-to-model chronic harm, can be integrated into plant/logistics simulations.
There are several avenues for future research arising from this work. This method has the potential to be widened in its application, for example, in food safety risks. The DQL register might be extended to include food safety hazards. Another idea for potential future research is to include the barrier/bowtie methodologies. The DQL algorithm already includes several stages in which the risk is compounded, and this could conceptually be expanded to incorporate additional stages. These other stages might correspond to barriers within the bowtie method. Methods have recently been devised for the more systematic development of bowties (which are otherwise ad hoc in their structure) using the 6M framework [86]; potentially, these might be included in the production simulation.
6. Conclusions
The conventional modeling of production economic growth and OHS risk are independent activities. Plant simulation methods are mostly focused on optimizing production and are not formulated to give equal attention to occupational health and safety risks. The present paper proposes a methodology for achieving this integration. Key features are the use of a ‘quality of life’ metric for determining the chronic harm risks of a particular work activity, and their embedment thereof as a routine in plant simulation software. Additionally, this work helps to enhance the development of management systems that support financial due diligence, as well as safety due diligence. This is particularly relevant to SMEs, where growth comes with particular sustainability challenges that are related to the need to develop more systematic operational and safety management systems.
Author Contributions
Conceptualization, Z.J. and D.P.; methodology, Z.J.; software, Z.J. and Z.L.; investigation, Z.J.; data analysis, Z.S., Z.J. and Z.L.; writing—original draft preparation, Z.J.; writing—review and editing, Z.J., Z.S., Z.L. and D.P.; supervision, D.P. and J.P.; All authors have read and agreed to the published version of the manuscript.
Funding
This research received no external funding.
Institutional Review Board Statement
Ethics approval of this research was obtained from the University of Canterbury (HEC 2019/28/LR-PS) for the data collection and interviews.
Informed Consent Statement
Ethics approval was obtained from the University of Canterbury (HEC 2019/28/LR-PS) for the data collection and interviews.
Data Availability Statement
Data will be made on request.
Acknowledgments
The authors thank the industry partner for providing context and operational data.
Conflicts of Interest
The authors declare no conflict of interest.
Appendix A
Figure A1.
The WHODAS examination of the potential biological outcomes in the pie making process—status quo. WHODAS-12 item examines six dimensions of health outcomes, including cognition, mobility, self-care, getting along, life activities, and participation.
Figure A1.
The WHODAS examination of the potential biological outcomes in the pie making process—status quo. WHODAS-12 item examines six dimensions of health outcomes, including cognition, mobility, self-care, getting along, life activities, and participation.
References
- Li, R.Y.M.; Tang, B.; Chau, K.W. Sustainable Construction Safety Knowledge Sharing: A Partial Least Square-Structural Equation Modeling and A Feedforward Neural Network Approach. Sustainability 2019, 11, 5831. [Google Scholar] [CrossRef] [Green Version]
- Kavouras, S.; Vardopoulos, I.; Mitoula, R.; Zorpas, A.A.; Kaldis, P. Occupational Health and Safety Scope Significance in Achieving Sustainability. Sustainability 2022, 14, 2424. [Google Scholar] [CrossRef]
- Yang, K.; Kim, K.; Go, S. Towards Effective Safety Cost Budgeting for Apartment Construction: A Case Study of Occupational Safety and Health Expenses in South Korea. Sustainability 2021, 13, 1335. [Google Scholar] [CrossRef]
- Kikolski, M. Identification of production bottlenecks with the use of Plant Simulation software. Eng. Manag. Prod. Serv. 2016, 8, 103–112. [Google Scholar] [CrossRef] [Green Version]
- Ji, Z.; Pons, D.J.; Pearse, J. Plant system simulation for engineering training workshops. Comput. Appl. Eng. Educ. 2019, 28, 17–30. [Google Scholar] [CrossRef]
- Nemtinov, V.; Nemtinova, Y.; Borisenko, A.; Mokrozub, V. Information support of decision making in urban passenger transport management. Probl. Transp. 2018, 12, 83–90. [Google Scholar]
- Ji, Z.; Yang, S.-H.; Cao, Y.; Wang, Y.; Zhou, C.; Yue, L.; Zhang, Y. Harmonizing safety and security risk analysis and prevention in cyber-physical systems. Process Saf. Environ. Prot. 2021, 148, 1279–1291. [Google Scholar] [CrossRef]
- Greasley, A.; Owen, C. Modelling people’s behaviour using discrete-event simulation: A review. Int. J. Oper. Prod. Manag. 2018, 38, 1228–1244. [Google Scholar] [CrossRef] [Green Version]
- Brito, M.; Ramos, A.; Carneiro, P.; Gonçalves, M. Integration of lean manufacturing and ergonomics in a metallurgical industry. Int. J. Occup. Environ. Saf. 2018, 2, 21–31. [Google Scholar] [CrossRef] [Green Version]
- Peruzzini, M.; Grandi, F.; Cavallaro, S.; Pellicciari, M. Using virtual manufacturing to design human-centric factories: An industrial case. Int. J. Adv. Manuf. Technol. 2021, 115, 873–887. [Google Scholar] [CrossRef]
- Robertson, R.; Beaven, A.; Coolbear, T.; Hill, J.; Kirk, T.; McCullough, G.; Piper, M.; Venter, P. Multi-faceted and holistic risk management for business-critical food-safety events causing major disruption to both small and large businesses—An illustrative model. Food Control 2022, 134, 108714. [Google Scholar] [CrossRef]
- Ji, Z.; Pons, D.; Pearse, J. Measuring Industrial Health Using a Diminished Quality of Life Instrument. Safety 2018, 4, 55. [Google Scholar] [CrossRef] [Green Version]
- Üstün, B.; Kostanjsek, N.; Chatterji, S.; Rehm, J. Measuring Health and Disability: Manual for WHO Disability Assessment Schedule WHODAS 2.0; World Health Organization: Geneva, Switzerland, 2010. [Google Scholar]
- Ji, Z.; Pons, D.J.; Pearse, J. Integrating occupational health and safety into plant simulation. Saf. Sci. 2020, 130, 104898. [Google Scholar] [CrossRef]
- Ji, Z.; Pons, D.; Pearse, J. A Methodology for Harmonizing Safety and Health Scales in Occupational Risk Assessment. Int. J. Enviorn. Res. Public Health 2021, 18, 4849. [Google Scholar] [CrossRef] [PubMed]
- Ji, Z.; Su, H.; Wang, Y.; Cao, Y.; Yang, S. Assessing the Risk of Hazards with Multidimensional Consequences for Industrial Processes. Processes 2022, 10, 1145. [Google Scholar] [CrossRef]
- Murugesan, V.S.; Jauhar, S.K.; Sequeira, A.H. Applying simulation in lean service to enhance the operational system in Indian postal service industry. Ann. Oper. Res. 2022, 315, 993–1017. [Google Scholar] [CrossRef]
- Yang, B.; Yan, X.; Guo, D. Level of Service Analysis Based on Maximum Number of Passengers in Waiting Room of Railway Passenger Station Using Arena Simulation. Discret. Dyn. Nat. Soc. 2015, 2015, 452035. [Google Scholar] [CrossRef] [Green Version]
- Lyu, Z.; Pons, D.; Zhang, Y.; Ji, Z. Freight Operations Modelling for Urban Delivery and Pickup with Flexible Routing: Cluster Transport Modelling Incorporating Discrete-Event Simulation and GIS. Infrastructures 2021, 6, 180. [Google Scholar] [CrossRef]
- Alvanchi, A.; Azimi, R.; Lee, S.; Abourizk, S.M.; Zubick, P. Off-site construction planning using discrete event simulation. J. Archit. Eng. 2012, 18, 114–122. [Google Scholar] [CrossRef]
- Knight, V.A.; Williams, J.E.; Reynolds, I. Modelling patient choice in healthcare systems: Development and application of a discrete event simulation with agent-based decision making. J. Simul. 2012, 6, 92–102. [Google Scholar] [CrossRef]
- Azadeh, A.; Nazari, T.; Charkhand, H. Optimisation of facility layout design problem with safety and environmental factors by stochastic DEA and simulation approach. Int. J. Prod. Res. 2015, 53, 3370–3389. [Google Scholar] [CrossRef]
- Vidalakis, C.; Tookey, J.E.; Sommerville, J. Demand uncertainty in construction supply chains: A discrete event simulation study. J. Oper. Res. Soc. 2013, 64, 1194–1204. [Google Scholar] [CrossRef]
- Negahban, A.; Smith, J.S. Simulation for manufacturing system design and operation: Literature review and analysis. J. Manuf. Syst. 2014, 33, 241–261. [Google Scholar] [CrossRef]
- Ferro, R.; Ordonez, R.E.C.; Anholon, R. Analysis of the integration between operations management manufacturing tools with discrete event simulation. Prod. Eng. 2017, 11, 467–476. [Google Scholar] [CrossRef]
- Sridhar, P.; Vishnu, C.R.; Sridharan, R. Simulation of inventory management systems in retail stores: A case study. Mater. Today Proc. 2021, 47, 5130–5134. [Google Scholar] [CrossRef]
- Metropolis, N.; Ulam, S. The Monte Carlo method. J. Am. Stat. Assoc. 1949, 44, 335–341. [Google Scholar] [CrossRef]
- Li, M.; Yang, F.; Uzsoy, R.; Xu, J. A metamodel-based Monte Carlo simulation approach for responsive production planning of manufacturing systems. J. Manuf. Syst. 2016, 38, 114–133. [Google Scholar] [CrossRef] [Green Version]
- Su, H.; Zhou, C.; Cao, Y.; Yang, S.-H.; Ji, Z. An intelligent approach of controlled variable selection for constrained process self-optimizing control. Syst. Sci. Control Eng. 2022, 10, 65–72. [Google Scholar] [CrossRef]
- Wang, Y.; Ji, Z.; Yang, S.; Cao, Y. Dynamic Risk Analysis for Process Safety. In Computer Aided Chemical Engineering; Yamashita, Y., Kano, M., Eds.; Elsevier: Amsterdam, The Netherlands, 2022; Volume 49, pp. 1351–1356. [Google Scholar]
- Lyu, Z.; Pons, D.; Zhang, Y.; Ji, Z. Minimum Viable Model (MVM) Methodology for Integration of Agile Methods into Operational Simulation of Logistics. Logistics 2022, 6, 37. [Google Scholar] [CrossRef]
- Malega, P.; Gazda, V.; Rudy, V. Optimization of production system in plant simulation. Simulation 2022, 98, 295–306. [Google Scholar] [CrossRef]
- Cortés, P.; Onieva, L.; Guadix, J. Optimising and simulating the assembly line balancing problem in a motorcycle manufacturing company: A case study. Int. J. Prod. Res. 2010, 48, 3637–3656. [Google Scholar] [CrossRef]
- Fabri, M.; Ramalhinho, H.; Oliver, M.; Muñoz, J.C. Internal logistics flow simulation: A case study in automotive industry. J. Simul. 2022, 16, 204–216. [Google Scholar] [CrossRef]
- Renna, P. Multi-agent based scheduling in manufacturing cells in a dynamic environment. Int. J. Prod. Res. 2011, 49, 1285–1301. [Google Scholar] [CrossRef]
- Zhao, T.; Liu, L.; Liu, S.; Xie, Y.; Qiu, X.; Chen, Y. Research on Production Simulation and scheduling of printing Shop for Intelligent Factory. In Proceedings of the 2022 IEEE 10th Joint International Information Technology and Artificial Intelligence Conference (ITAIC), Chongqing, China, 17–19 June 2022. [Google Scholar]
- Jurczyk, M. Tactical manufacturing capacity planning based on discrete event simulation and throughput accounting: A case study of medium sized production enterprise. Adv. Prod. Eng. Manag. 2021, 16, 335–347. [Google Scholar]
- Daaboul, J.; Castagna, P.; Da Cunha, C.; Bernard, A. Value network modelling and simulation for strategic analysis: A discrete event simulation approach. Int. J. Prod. Res. 2014, 52, 5002–5020. [Google Scholar] [CrossRef]
- Mishra, M.; Chan, F.T.S. Impact evaluation of supply chain initiatives: A system simulation methodology. Int. J. Prod. Res. 2012, 50, 1554–1567. [Google Scholar] [CrossRef]
- Raška, P.; Ulrych, Z. Comparison of optimisation methods tested on testing functions and discrete event simulation models. Int. J. Simul. Process Model. 2015, 10, 279–293. [Google Scholar] [CrossRef]
- Lang, S.; Reggelin, T.; Müller, M.; Nahhas, A. Open-source discrete-event simulation software for applications in production and logistics: An alternative to commercial tools? Procedia Comput. Sci. 2021, 180, 978–987. [Google Scholar] [CrossRef]
- Hecker, F.; Hussein, W.; Becker, T. Analysis and optimization of a bakery production line using ARENA. Int. J. Simul. Model. 2010, 9, 208–216. [Google Scholar] [CrossRef]
- Mourtzis, D.; Doukas, M.; Bernidaki, D. Simulation in Manufacturing: Review and Challenges. Procedia CIRP 2014, 25, 213–229. [Google Scholar] [CrossRef] [Green Version]
- Farid, M.; Neumann, W.P. Modelling the effects of employee injury risks on injury, productivity and production quality using system dynamics. Int. J. Prod. Res. 2019, 58, 6115–6129. [Google Scholar] [CrossRef]
- Song, L.; Li, R.Y.M.; Yao, Q. An informal institution comparative study of occupational safety knowledge sharing via French and English Tweets: Languaculture, weak-strong ties and AI sentiment perspectives. Saf. Sci. 2022, 147, 105602. [Google Scholar] [CrossRef]
- International Organization for Standardization. ISO 31000 Risk Management—Principles and Guidelines; International Organization for Standardization: Geneva, Switzerland, 2009. [Google Scholar]
- Standards Australia International. Limited Standards New Zealand. In Occupational Health and Safety Management Systems: Specification with Guidance for Use; Standards Australia International: Wellington, New Zealand; Sydney, Australia, 2001. [Google Scholar]
- New Zealand Legislation. Health and Safety at Work Act 2015; Ministry of Business, Innovation and Employment: Wellington, New Zealand, 2015.
- Oghuvwu, S.O.; Egbagbe, E.E.; Aigbirior, J.O.; Oniovokukor, B.E.; Erhabor, G.E. Respiratory Health Status of Workers in a Bottling Factory in Benin City, Nigeria. Int. J. Environ. Res. Public Health 2018, 15, 1919. [Google Scholar] [CrossRef] [PubMed] [Green Version]
- Kim, Y.-M.; Cho, S.-I. Work-life imbalance and musculoskeletal disorders among South Korean workers. Int. J. Environ. Res. Public Health 2017, 14, 1331. [Google Scholar] [CrossRef] [PubMed] [Green Version]
- Masi, D.; Cagno, E. Barriers to OHS interventions in Small and Medium-sized Enterprises. Saf. Sci. 2015, 71, 226–241. [Google Scholar] [CrossRef]
- Legg, S.J.; Olsen, K.B.; Laird, I.S.; Hasle, P. Managing safety in small and medium enterprises. Saf. Sci. 2015, 71, 189–196. [Google Scholar] [CrossRef] [Green Version]
- Cummings, K.J.; Boylstein, R.J.; Stanton, M.L.; Piacitelli, C.A.; Edwards, N.T.; LeBouf, R.F.; Kreiss, K. Respiratory symptoms and lung function abnormalities related to work at a flavouring manufacturing facility. Occup. Environ. Med. 2014, 71, 549–554. [Google Scholar] [CrossRef] [Green Version]
- Carrillo-Castrillo, J.A.; Perez-Mira, V.; Pardo-Ferreira, M.D.; Rubio-Romero, J.C. Analysis of Required Investigations of Work-Related Musculoskeletal Disorders in Spain. Int. J. Environ. Res. Public Health 2019, 16, 1682. [Google Scholar] [CrossRef] [Green Version]
- Mohammadi, G. Occupational Noise Pollution and Hearing protection in selected industries. Iran. J. Health Saf. Environ. 2014, 1, 30–35. [Google Scholar]
- Ralli, M.; Balla, M.P.; Greco, A.; Altissimi, G.; Ricci, P.; Turchetta, R.; de Virgilio, A.; De Vincentiis, M.; Ricci, S.; Cianfrone, G. Work-related noise exposure in a cohort of patients with chronic tinnitus: Analysis of demographic and audiological characteristics. Int. J. Environ. Res. Public Health 2017, 14, 1035. [Google Scholar] [CrossRef] [Green Version]
- Stokes, A.D.; Sweeting, D.K. Electric arcing burn hazards. IEEE Trans. Ind. Appl. 2006, 42, 134–141. [Google Scholar] [CrossRef]
- Kozlowski, E.; Mlynski, R. Selection of Earmuffs and Other Personal Protective Equipment Used in Combination. Int. J. Enviorn. Res. Public Health 2019, 16, 1477. [Google Scholar] [CrossRef] [PubMed] [Green Version]
- Spellman, F.R.; Bieber, R.M. Physical Hazard Control: Preventing Injuries in the Workplace; Government Institutes: Lanham, MD, USA, 2011.
- Hussein, W.B.; Hecker, F.; Mitzscherling, M.; Becker, T. Computer modelling and simulation of bakeries’ production planning. Int. J. Food Eng. 2009, 5. [Google Scholar] [CrossRef]
- Thain, P.K.; Hughes, G.T.G.; Mitchell, A.C.S. The Effect of Repetitive Ankle Perturbations on Muscle Reaction Time and Muscle Activity. J. Electromyogr. Kinesiol. 2016, 30, 184–190. [Google Scholar] [CrossRef] [PubMed]
- Baatjies, R.; Meijster, T.; Heederik, D.; Sander, I.; Jeebhay, M.F. Effectiveness of interventions to reduce flour dust exposures in supermarket bakeries in South Africa. Occup. Environ. Med. 2014, 71, 811–818. [Google Scholar] [CrossRef]
- Alexopoulos, E.C.; Kavadi, Z.; Bakoyannis, G.; Papantonopoulos, S. Subjective risk assessment and perception in the Greek and English bakery industries. J. Environ. Public Health 2009, 2009, 891754–891758. [Google Scholar] [CrossRef] [Green Version]
- Page, E.H.; Dowell, C.H.; Mueller, C.A.; Biagini, R.E.; Heederik, D. Exposure to flour dust and sensitization among bakery employees. Am. J. Ind. Med. 2010, 53, 1225–1232. [Google Scholar] [CrossRef]
- Nielsen, G.D.; Larsen, S.T.; Hansen, J.S.; Poulsen, L.K. Experiences from occupational exposure limits set on aerosols containing allergenic proteins. Ann. Occup. Hyg. 2012, 56, 888–900. [Google Scholar]
- Moatari-Kazerouni, A.; Chinniah, Y.; Agard, B. Integrating occupational health and safety in facility layout planning, part I: Methodology. Int. J. Prod. Res. 2015, 53, 3243–3259. [Google Scholar] [CrossRef]
- Moatari-Kazerouni, A.; Chinniah, Y.; Agard, B. Integration of occupational health and safety in the facility layout planning, part II: Design of the kitchen of a hospital. Int. J. Prod. Res. 2015, 53, 3228–3242. [Google Scholar] [CrossRef]
- Kanj, H.; Aly, W.H.F.; Kanj, S. A Novel Dynamic Approach for Risk Analysis and Simulation Using Multi-Agents Model. Appl. Sci. 2022, 12, 5062. [Google Scholar] [CrossRef]
- Campos, A.T.; dos Santos, C.H.; Gabriel, G.T.; Montevechi, J.A.B. Safety assessment for temporary hospitals during the COVID-19 pandemic: A simulation approach. Saf. Sci. 2022, 147, 105642. [Google Scholar] [CrossRef] [PubMed]
- Van Gestel, P. Optimising Production Control for Reduction of Allergen Contamination. Master’s Thesis, University of Canterbury, Christchurch, New Zealand, 2014. [Google Scholar]
- Pearce, A.; Pons, D. Implementing Lean Practices: Managing the transformation risks. J. Ind. Eng. 2013, 790291, 1–19. [Google Scholar] [CrossRef] [Green Version]
- Pearce, A.; Pons, D. Advancing lean management: The missing quantitative approach. Oper. Res. Perspect. 2019, 6, 100114. [Google Scholar] [CrossRef]
- Kruse, T.; Veltri, A.; Branscum, A. Integrating safety, health and environmental management systems: A conceptual framework for achieving lean enterprise outcomes. J. Saf. Res. 2019, 71, 259–271. [Google Scholar] [CrossRef] [PubMed]
- Spector, Y. Theory of constraint methodology where the constraint is the business model. Int. J. Prod. Res. 2011, 49, 3387–3394. [Google Scholar] [CrossRef]
- Gupta, M.; Snyder, D. Comparing TOC with MRP and JIT: A literature review. Int. J. Prod. Res. 2009, 47, 3705–3739. [Google Scholar] [CrossRef]
- Macpherson, A.; Holt, R. Knowledge, learning and small firm growth: A systematic review of the evidence. Res. Policy 2007, 36, 172–192. [Google Scholar] [CrossRef]
- Snyman, H.A.; Kennon, D.; Schutte, C.S.L.; von Leipzig, K. A strategic framework to utilise venture capital funding to develop manufacturing SMEs in South Africa. S. Afr. J. Ind. Eng. 2014, 25, 161–181. [Google Scholar] [CrossRef] [Green Version]
- Barad, M.; Gien, D. Linking improvement models to manufacturing strategies—A methodology for SMEs and other enterprises. Int. J. Prod. Res. 2001, 39, 2675–2695. [Google Scholar] [CrossRef]
- Schwab, L.; Gold, S.; Reiner, G. Exploring financial sustainability of SMEs during periods of production growth: A simulation study. Int. J. Prod. Econ. 2019, 212, 8–18. [Google Scholar] [CrossRef]
- Haight, J.M. Adaptive automation and its health and safety challenges. J. Saf. Res. 2020, 74, 149–152. [Google Scholar] [CrossRef] [PubMed]
- Kletz, T. The history of process safety. J. Loss Prev. Process Ind. 2012, 25, 763–765. [Google Scholar] [CrossRef]
- Zhang, Y.; Wu, X.; Gao, J.; Chen, J.; Xv, X. Simulation and Ergonomic Evaluation of Welders’ Standing Posture Using Jack Software. Int. J. Environ. Res. Public Health 2019, 16, 4354. [Google Scholar] [CrossRef]
- Caputo, F.; Greco, A.; Fera, M.; Macchiaroli, R. Workplace design ergonomic validation based on multiple human factors assessment methods and simulation. Prod. Manuf. Res. 2019, 7, 195–222. [Google Scholar] [CrossRef]
- Kullman, N.D. Measuring Conflict among Objective Functions in Multi-Objective Optimization. Master’s Thesis, University of Washington, Washington, DC, USA, 2016. Available online: http://hdl.handle.net/1773/38212 (accessed on 20 September 2022).
- Freund, A.M.; Tomasik, M.J. Managing conflicting goals through prioritization? The role of age and relative goal importance. PLoS ONE 2021, 16, e0247047. [Google Scholar] [CrossRef]
- Aust, J.; Pons, D. A Systematic Methodology for Developing Bowtie in Risk Assessment: Application to Borescope Inspection. Aerospace 2020, 7, 86. [Google Scholar] [CrossRef]
Figure 1.
The research framework for integrating OHS into plant simulation.
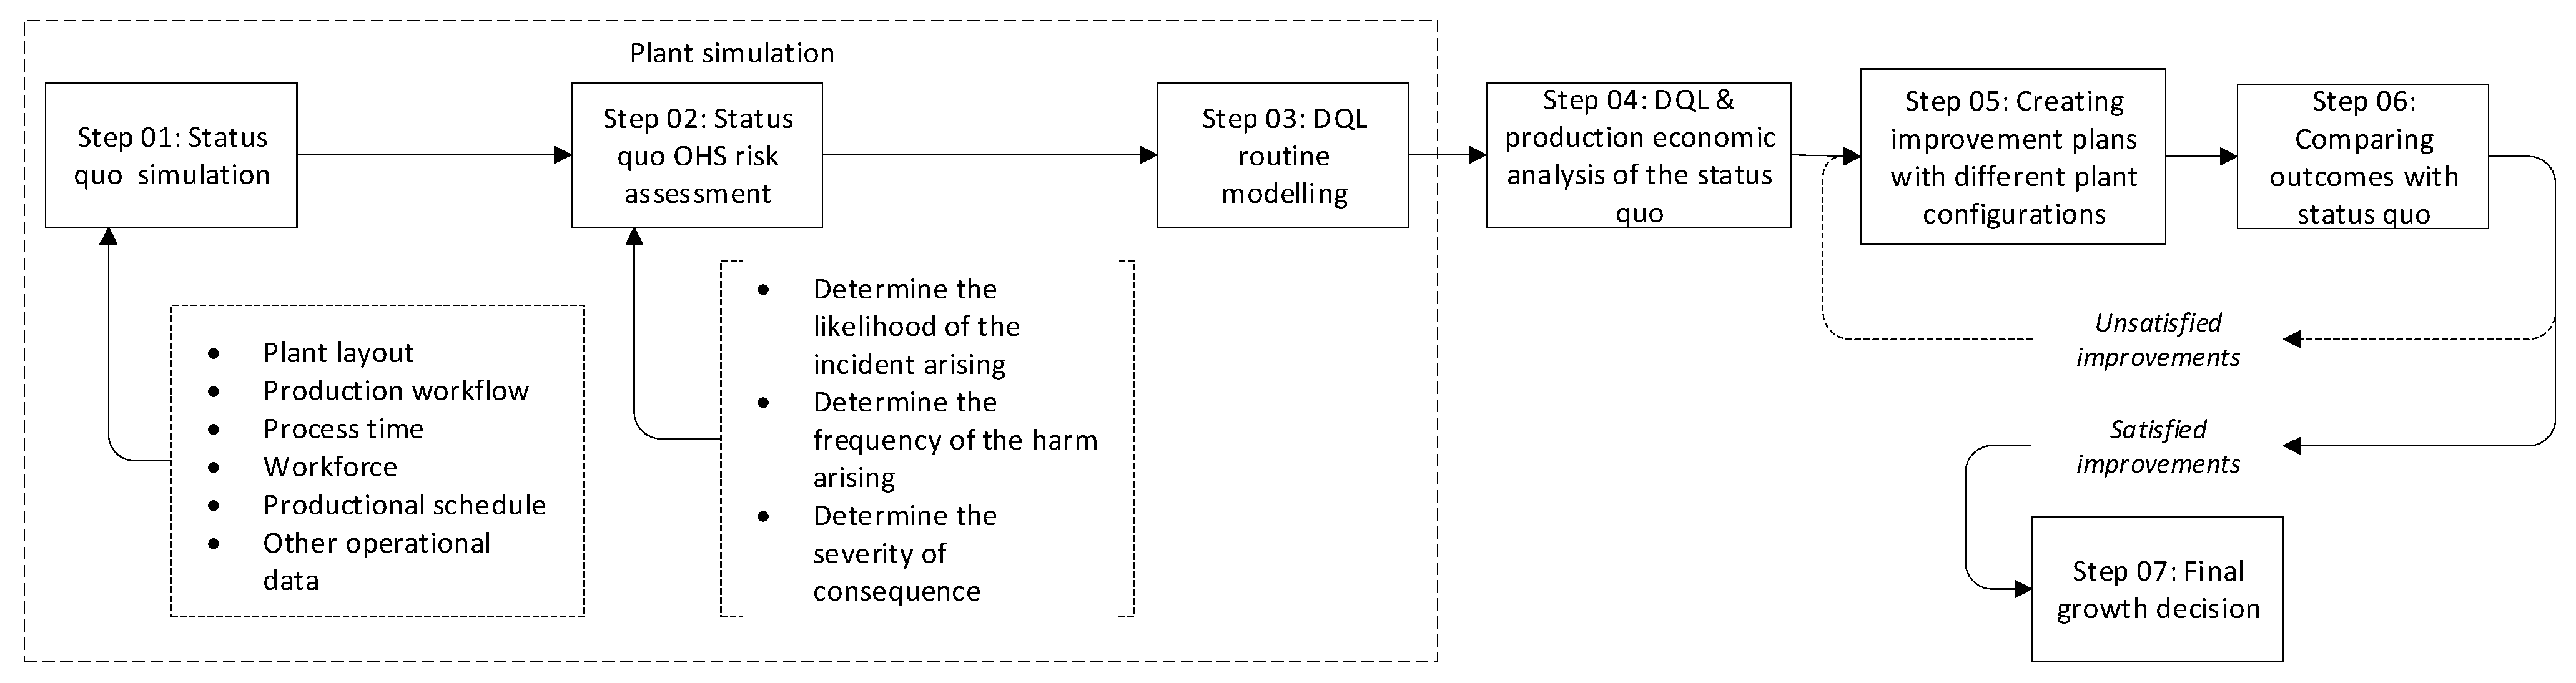
Figure 2.
DQL computation using the Arena simulation.
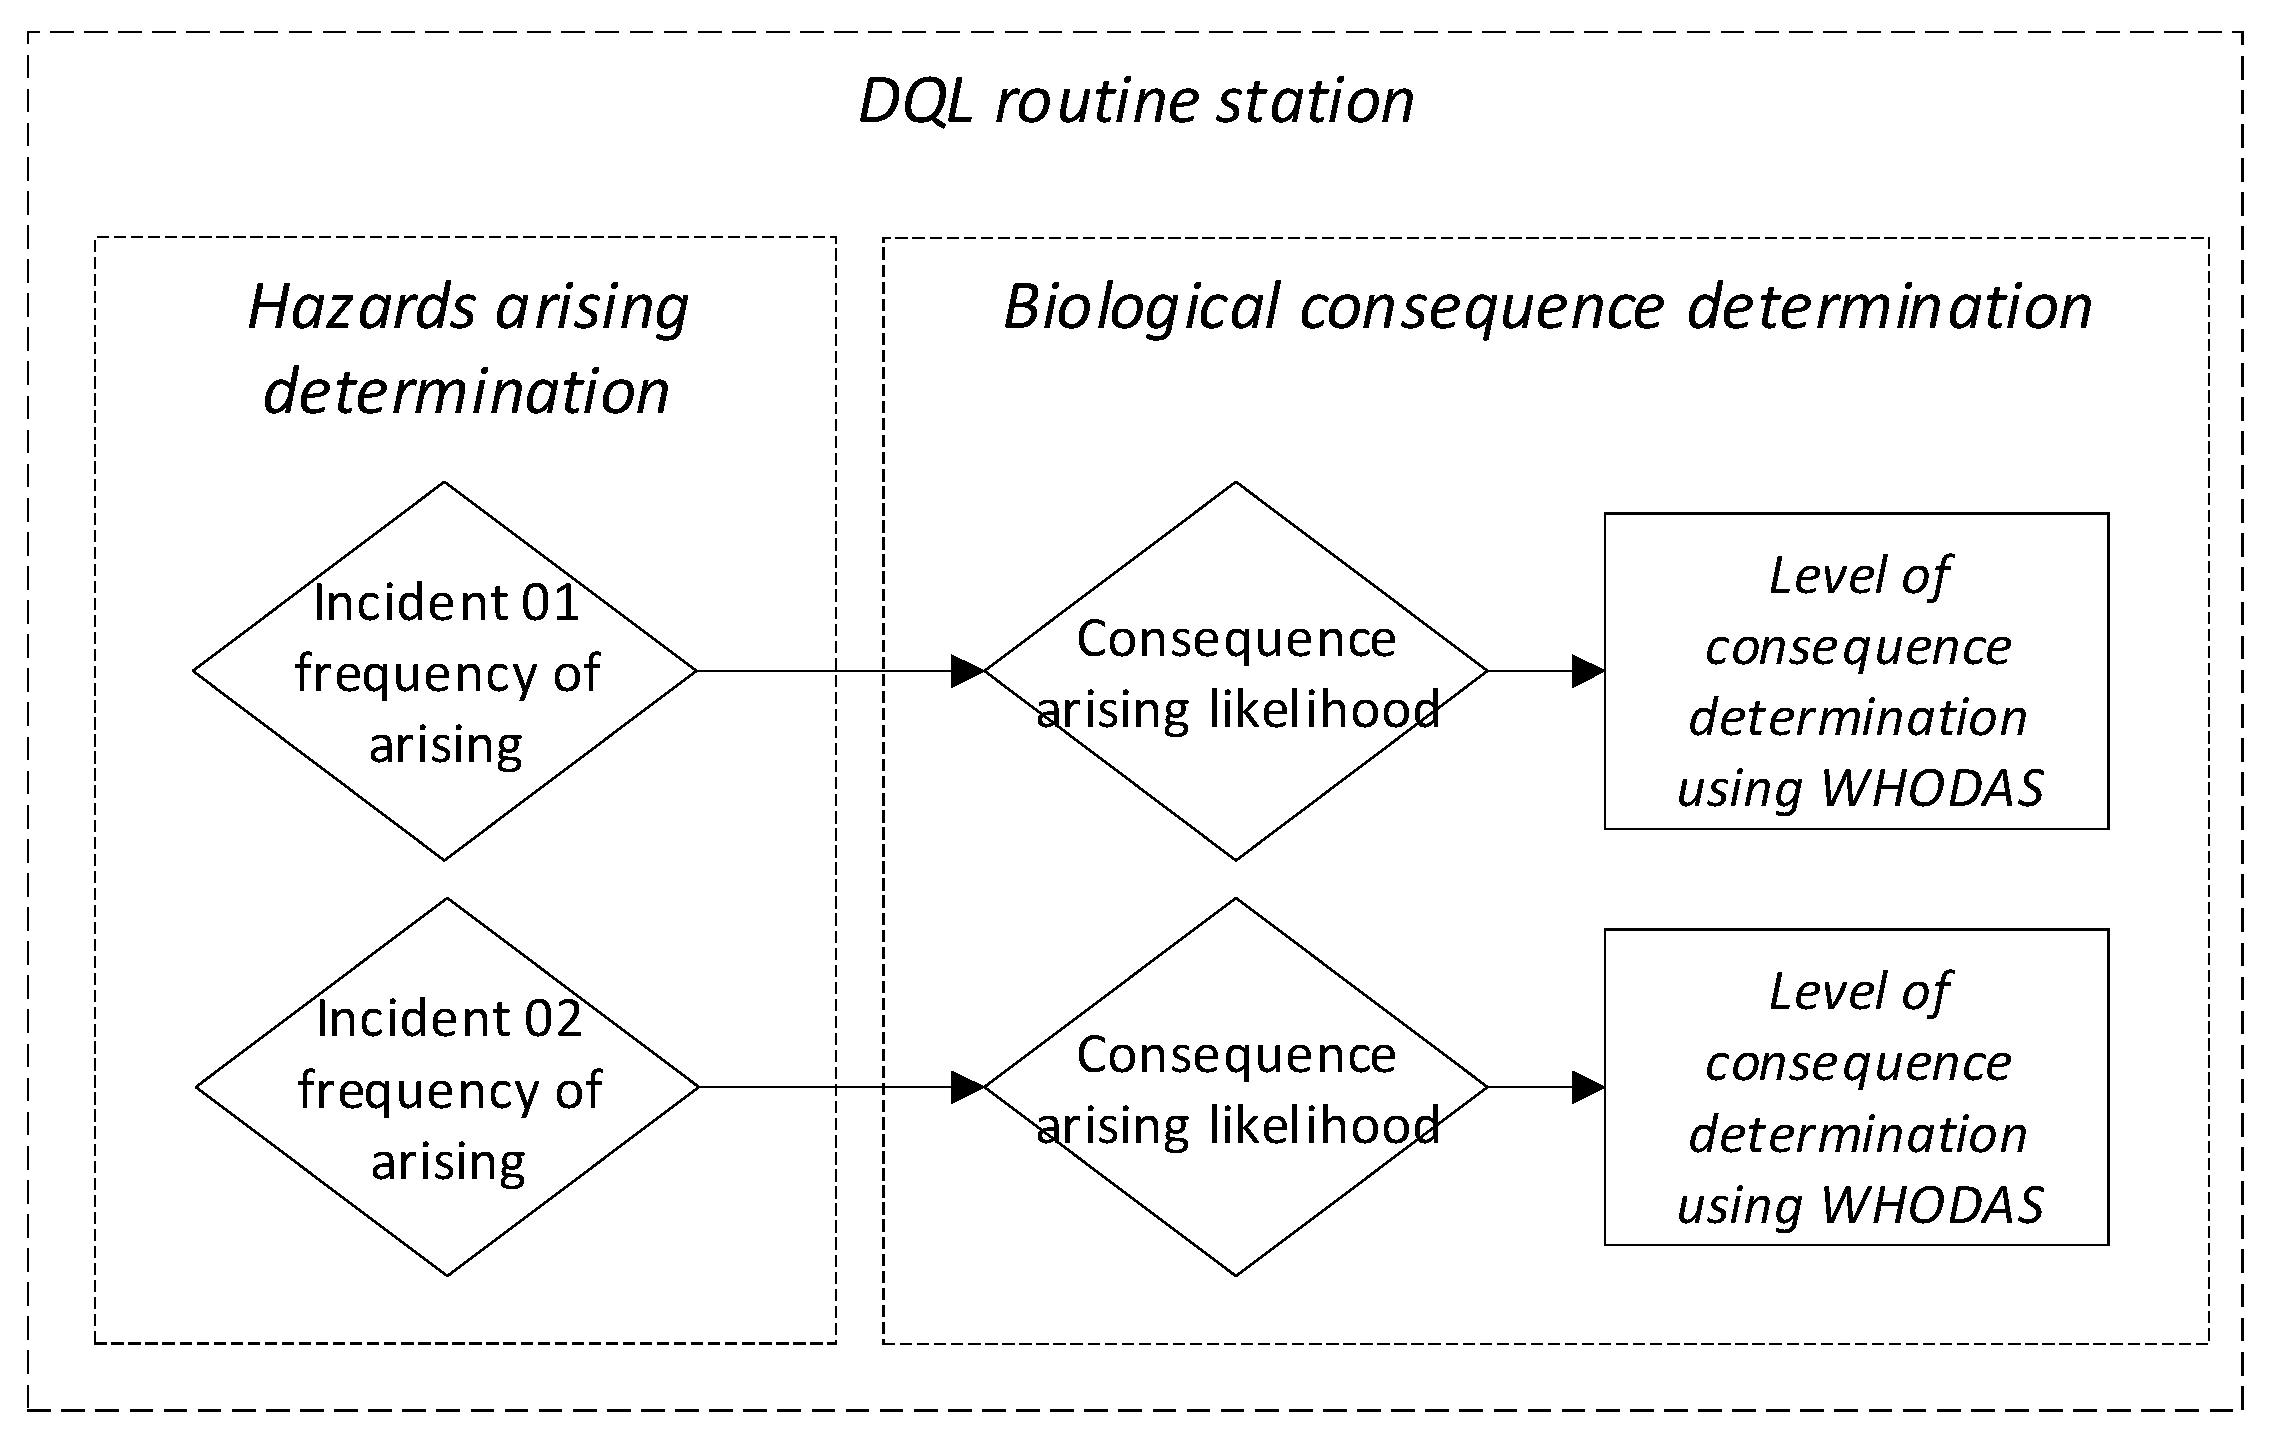
Figure 3.
The bakery production workflow.
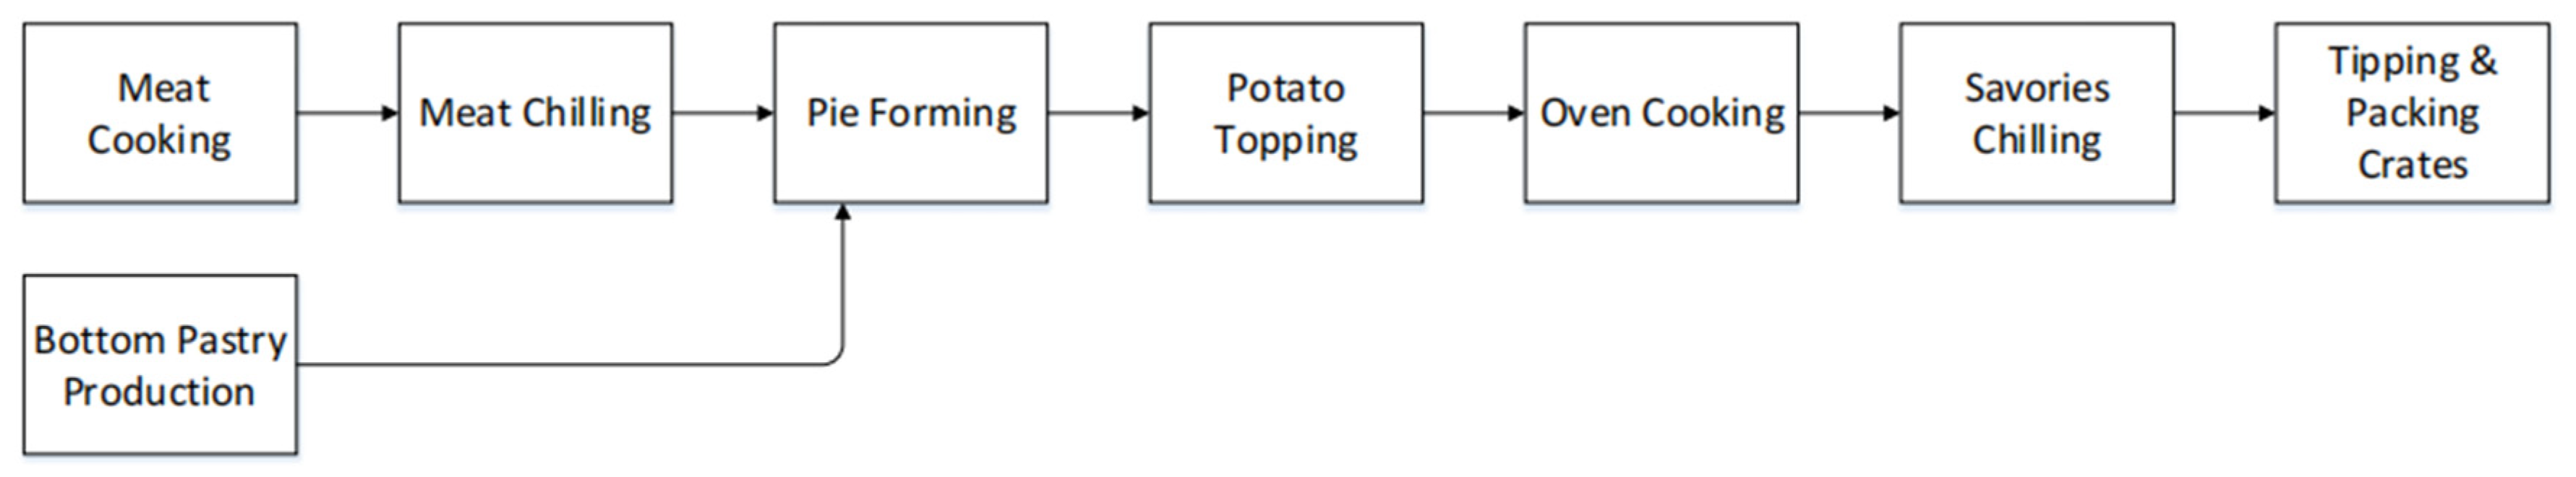
Figure 4.
Average time costs for different production processes.
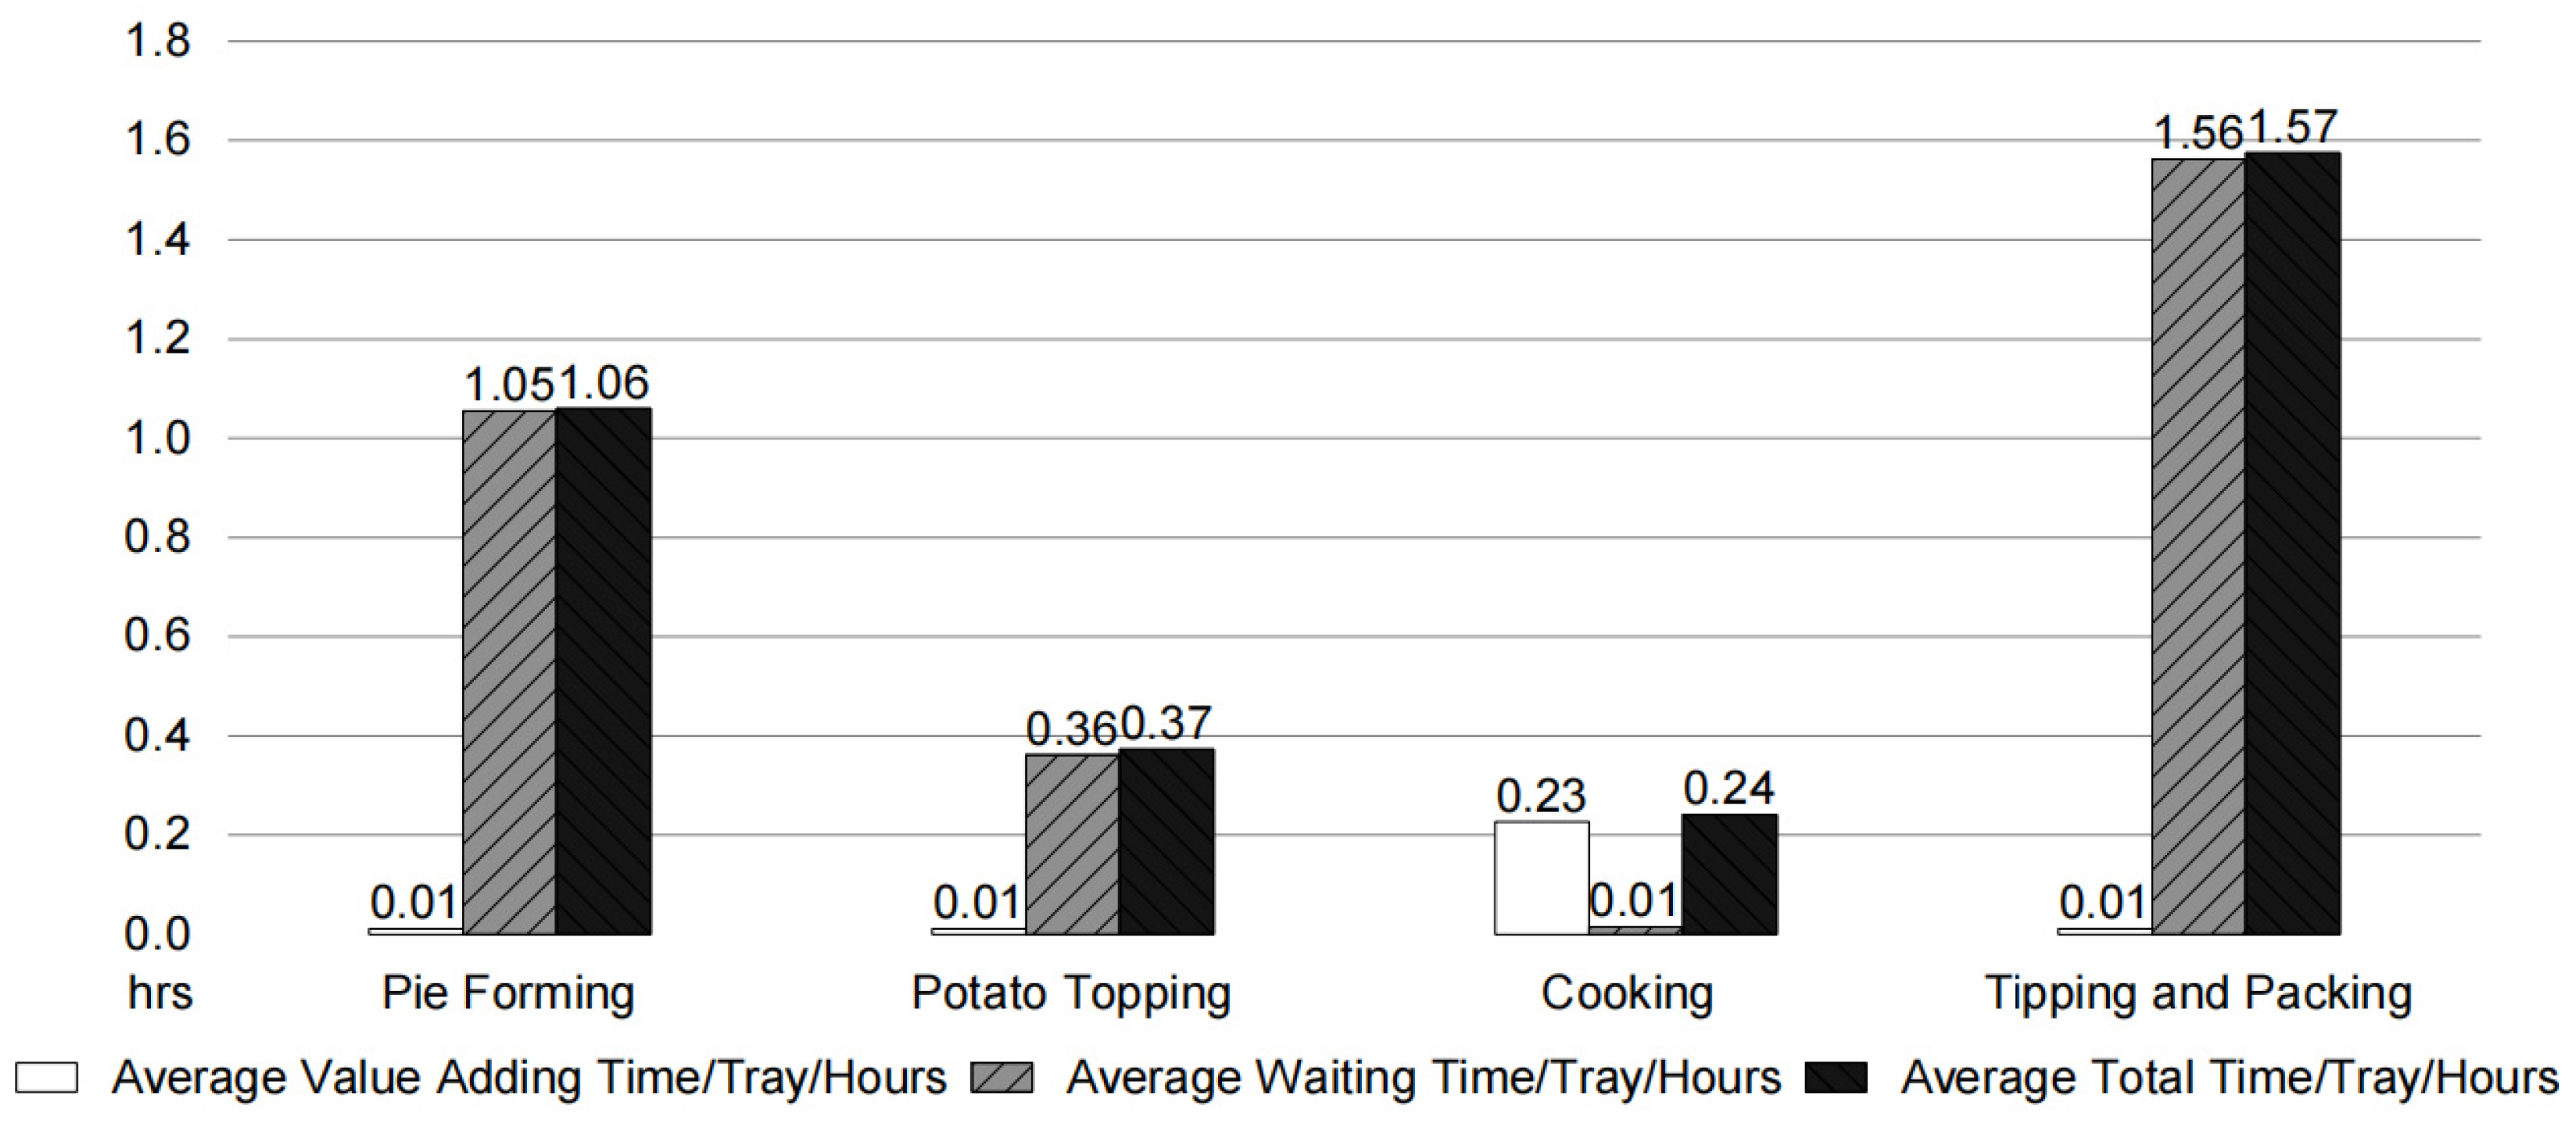
Figure 5.
Diminished quality of life results compared between Scenario No. 1 and Scenario No. 2.
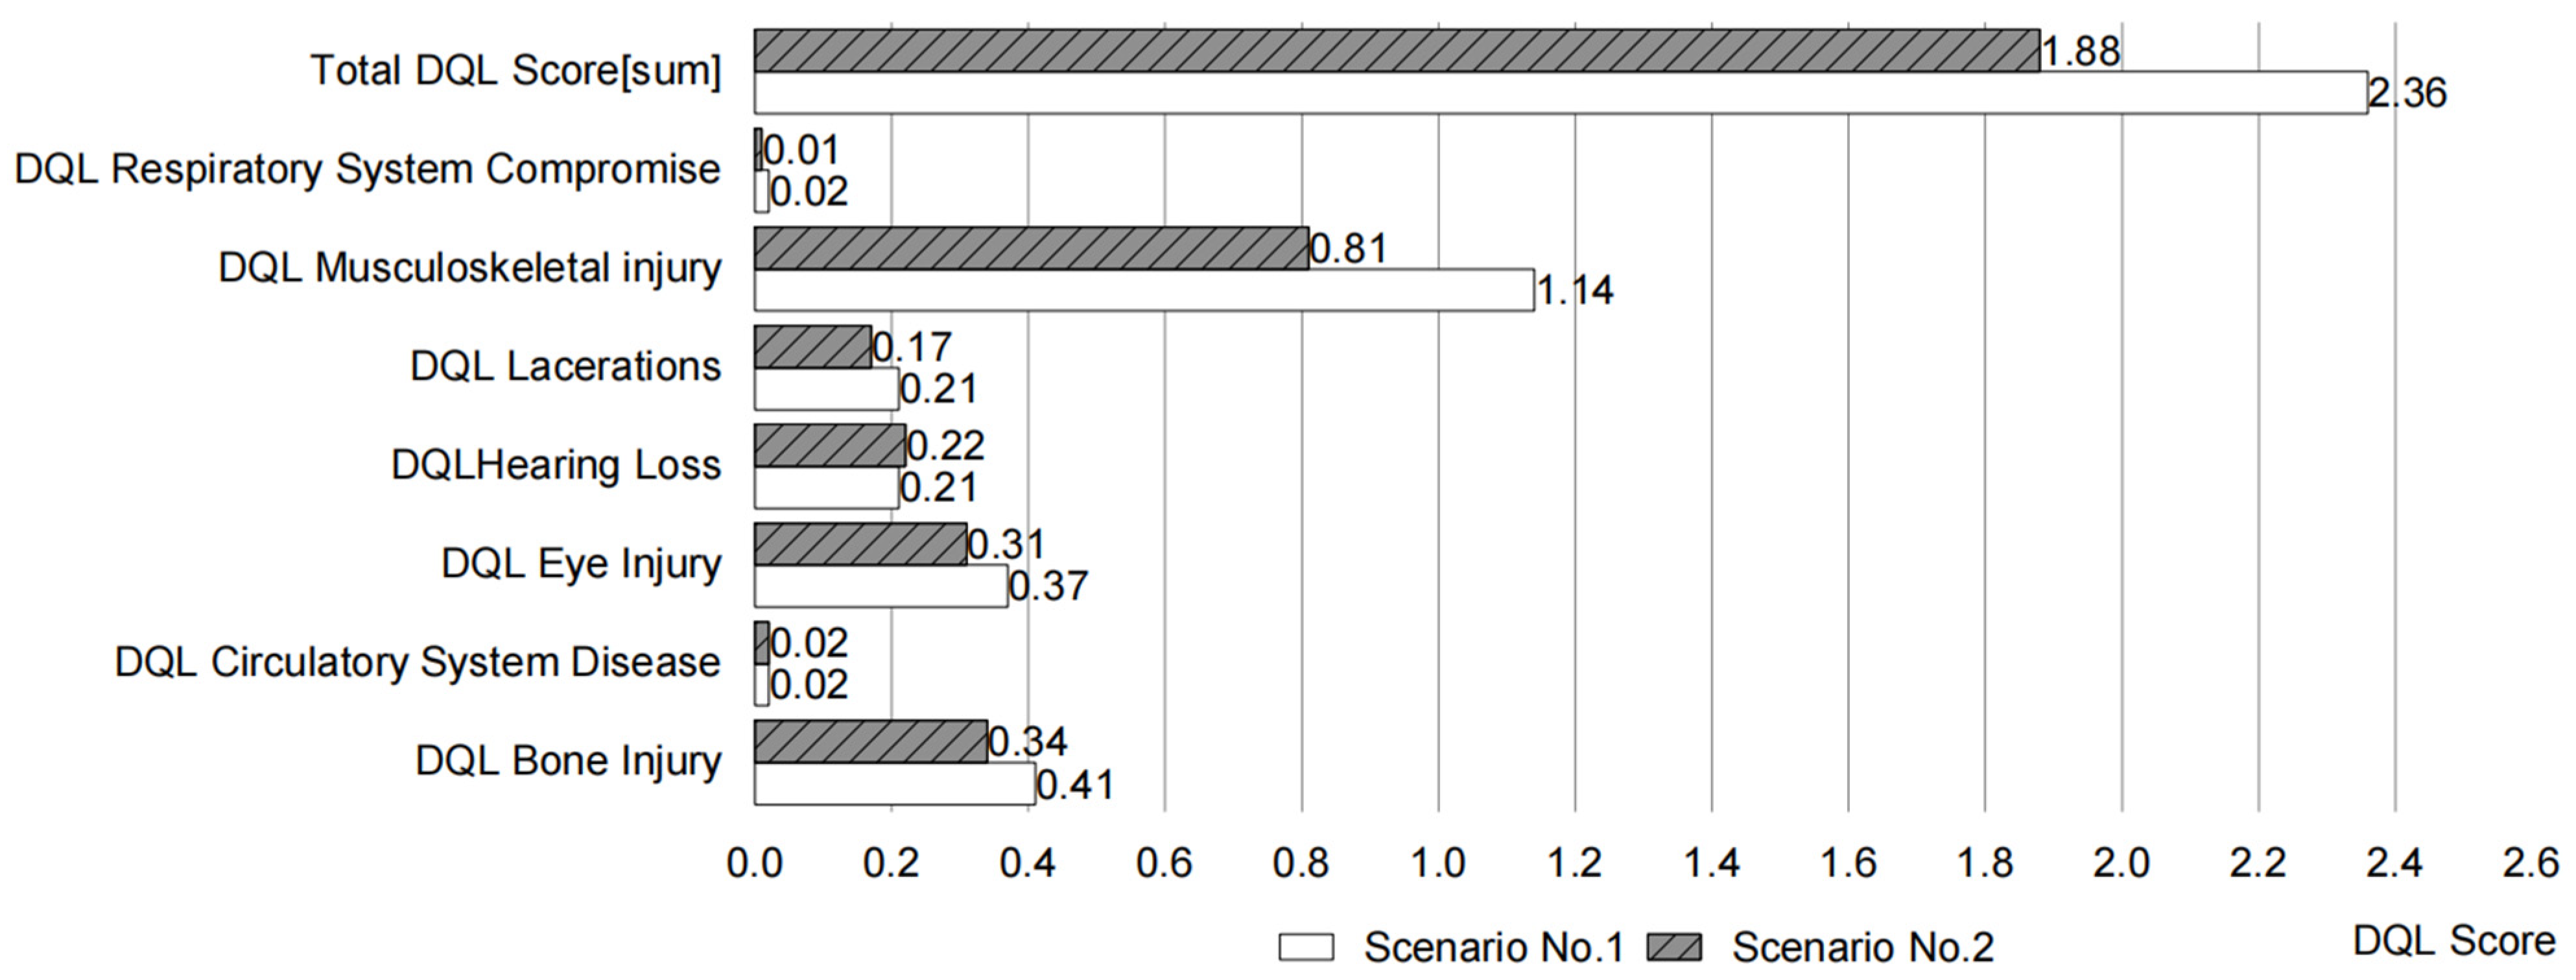
Figure 6.
Musculoskeletal injury DQL for the two scenarios.
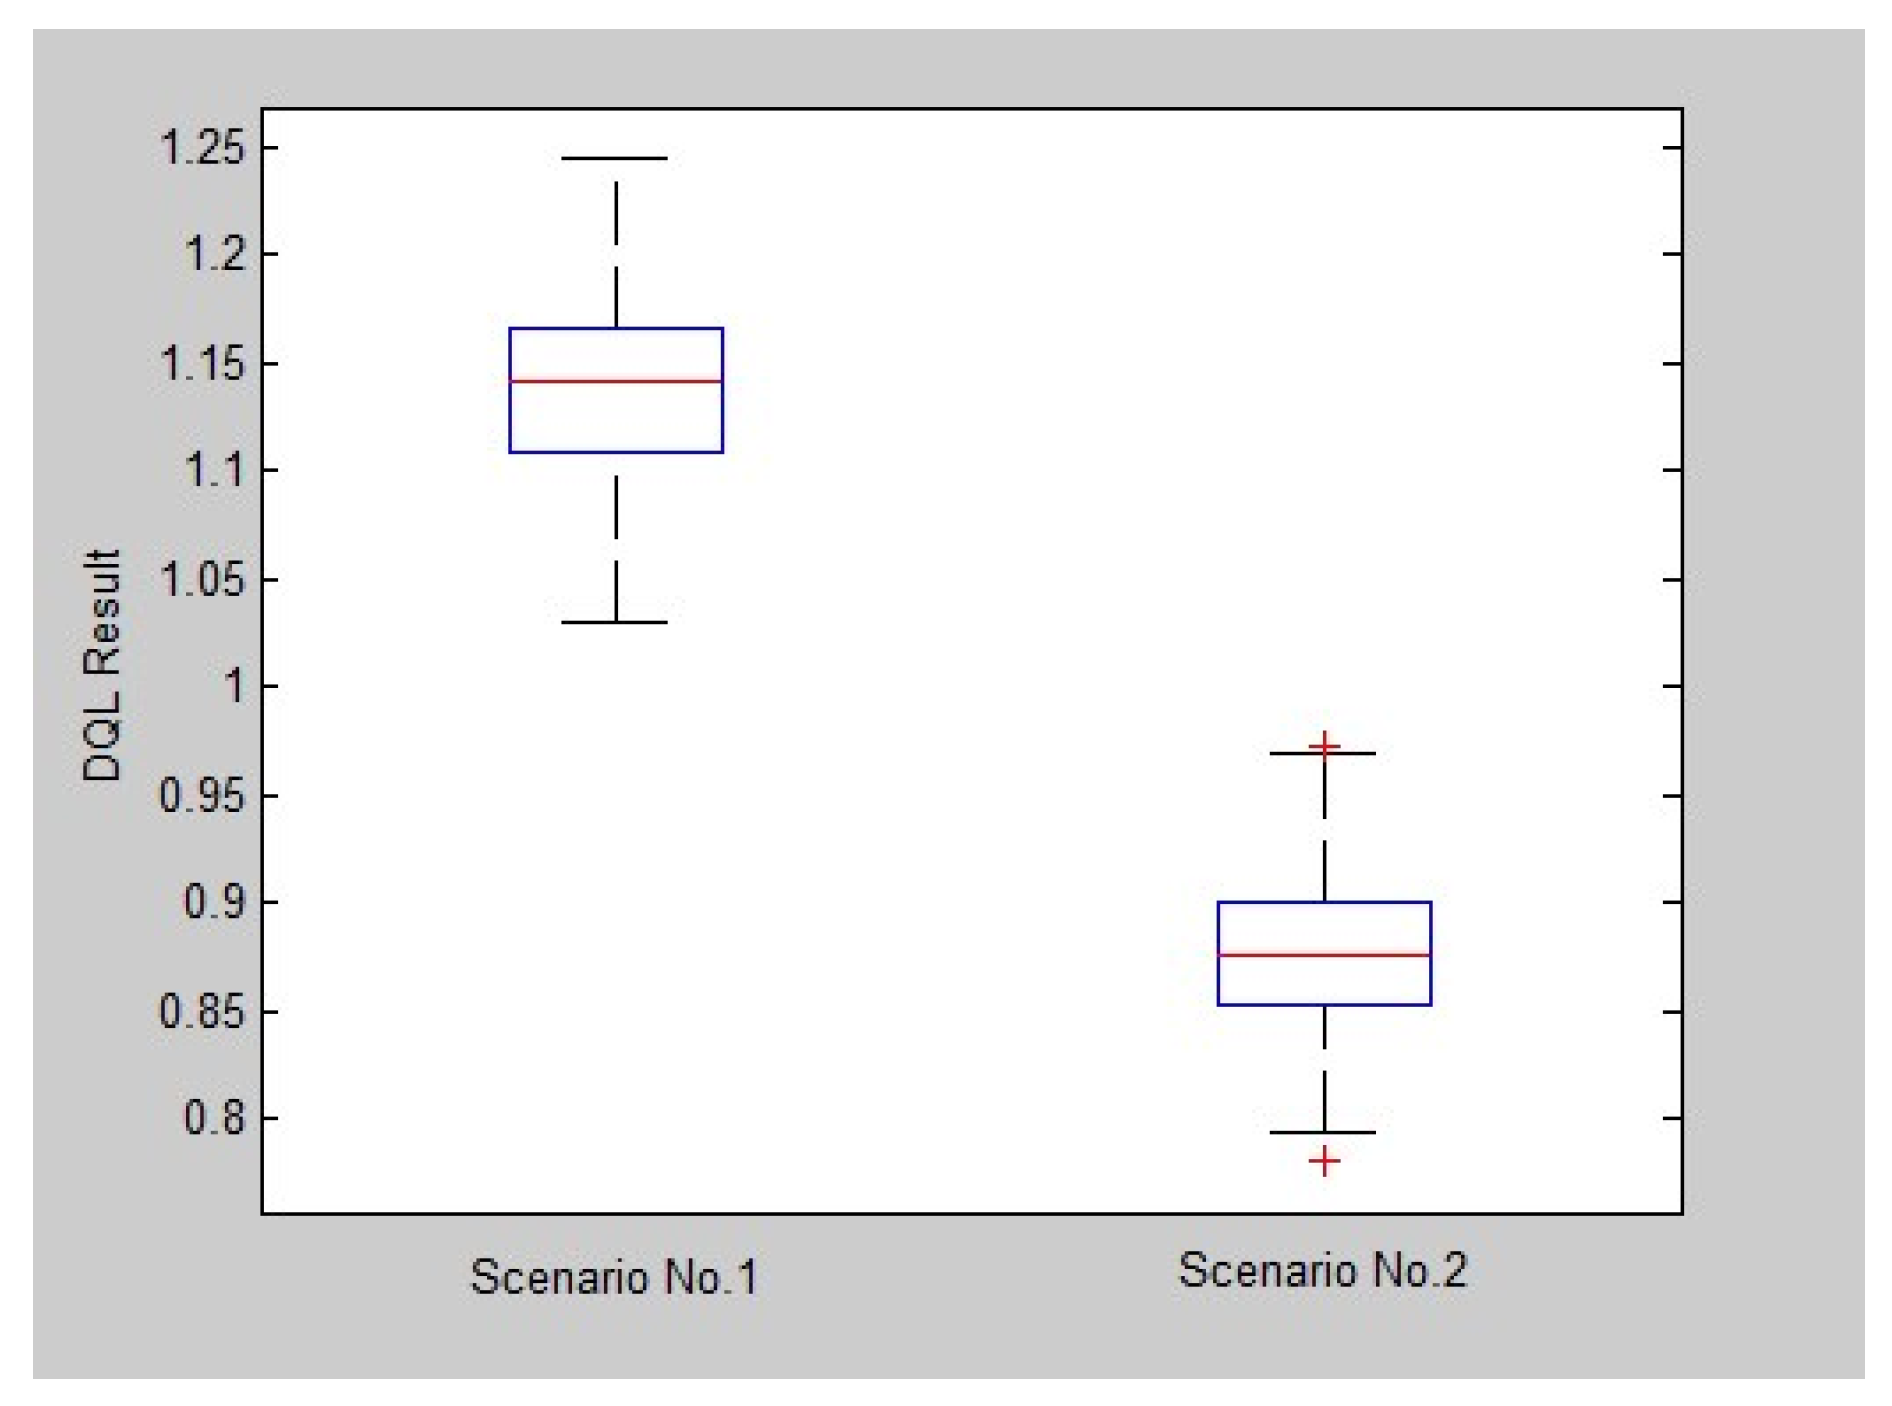
Figure 7.
Time distribution between Scenario No. 1 (status quo) and Scenario No. 2.
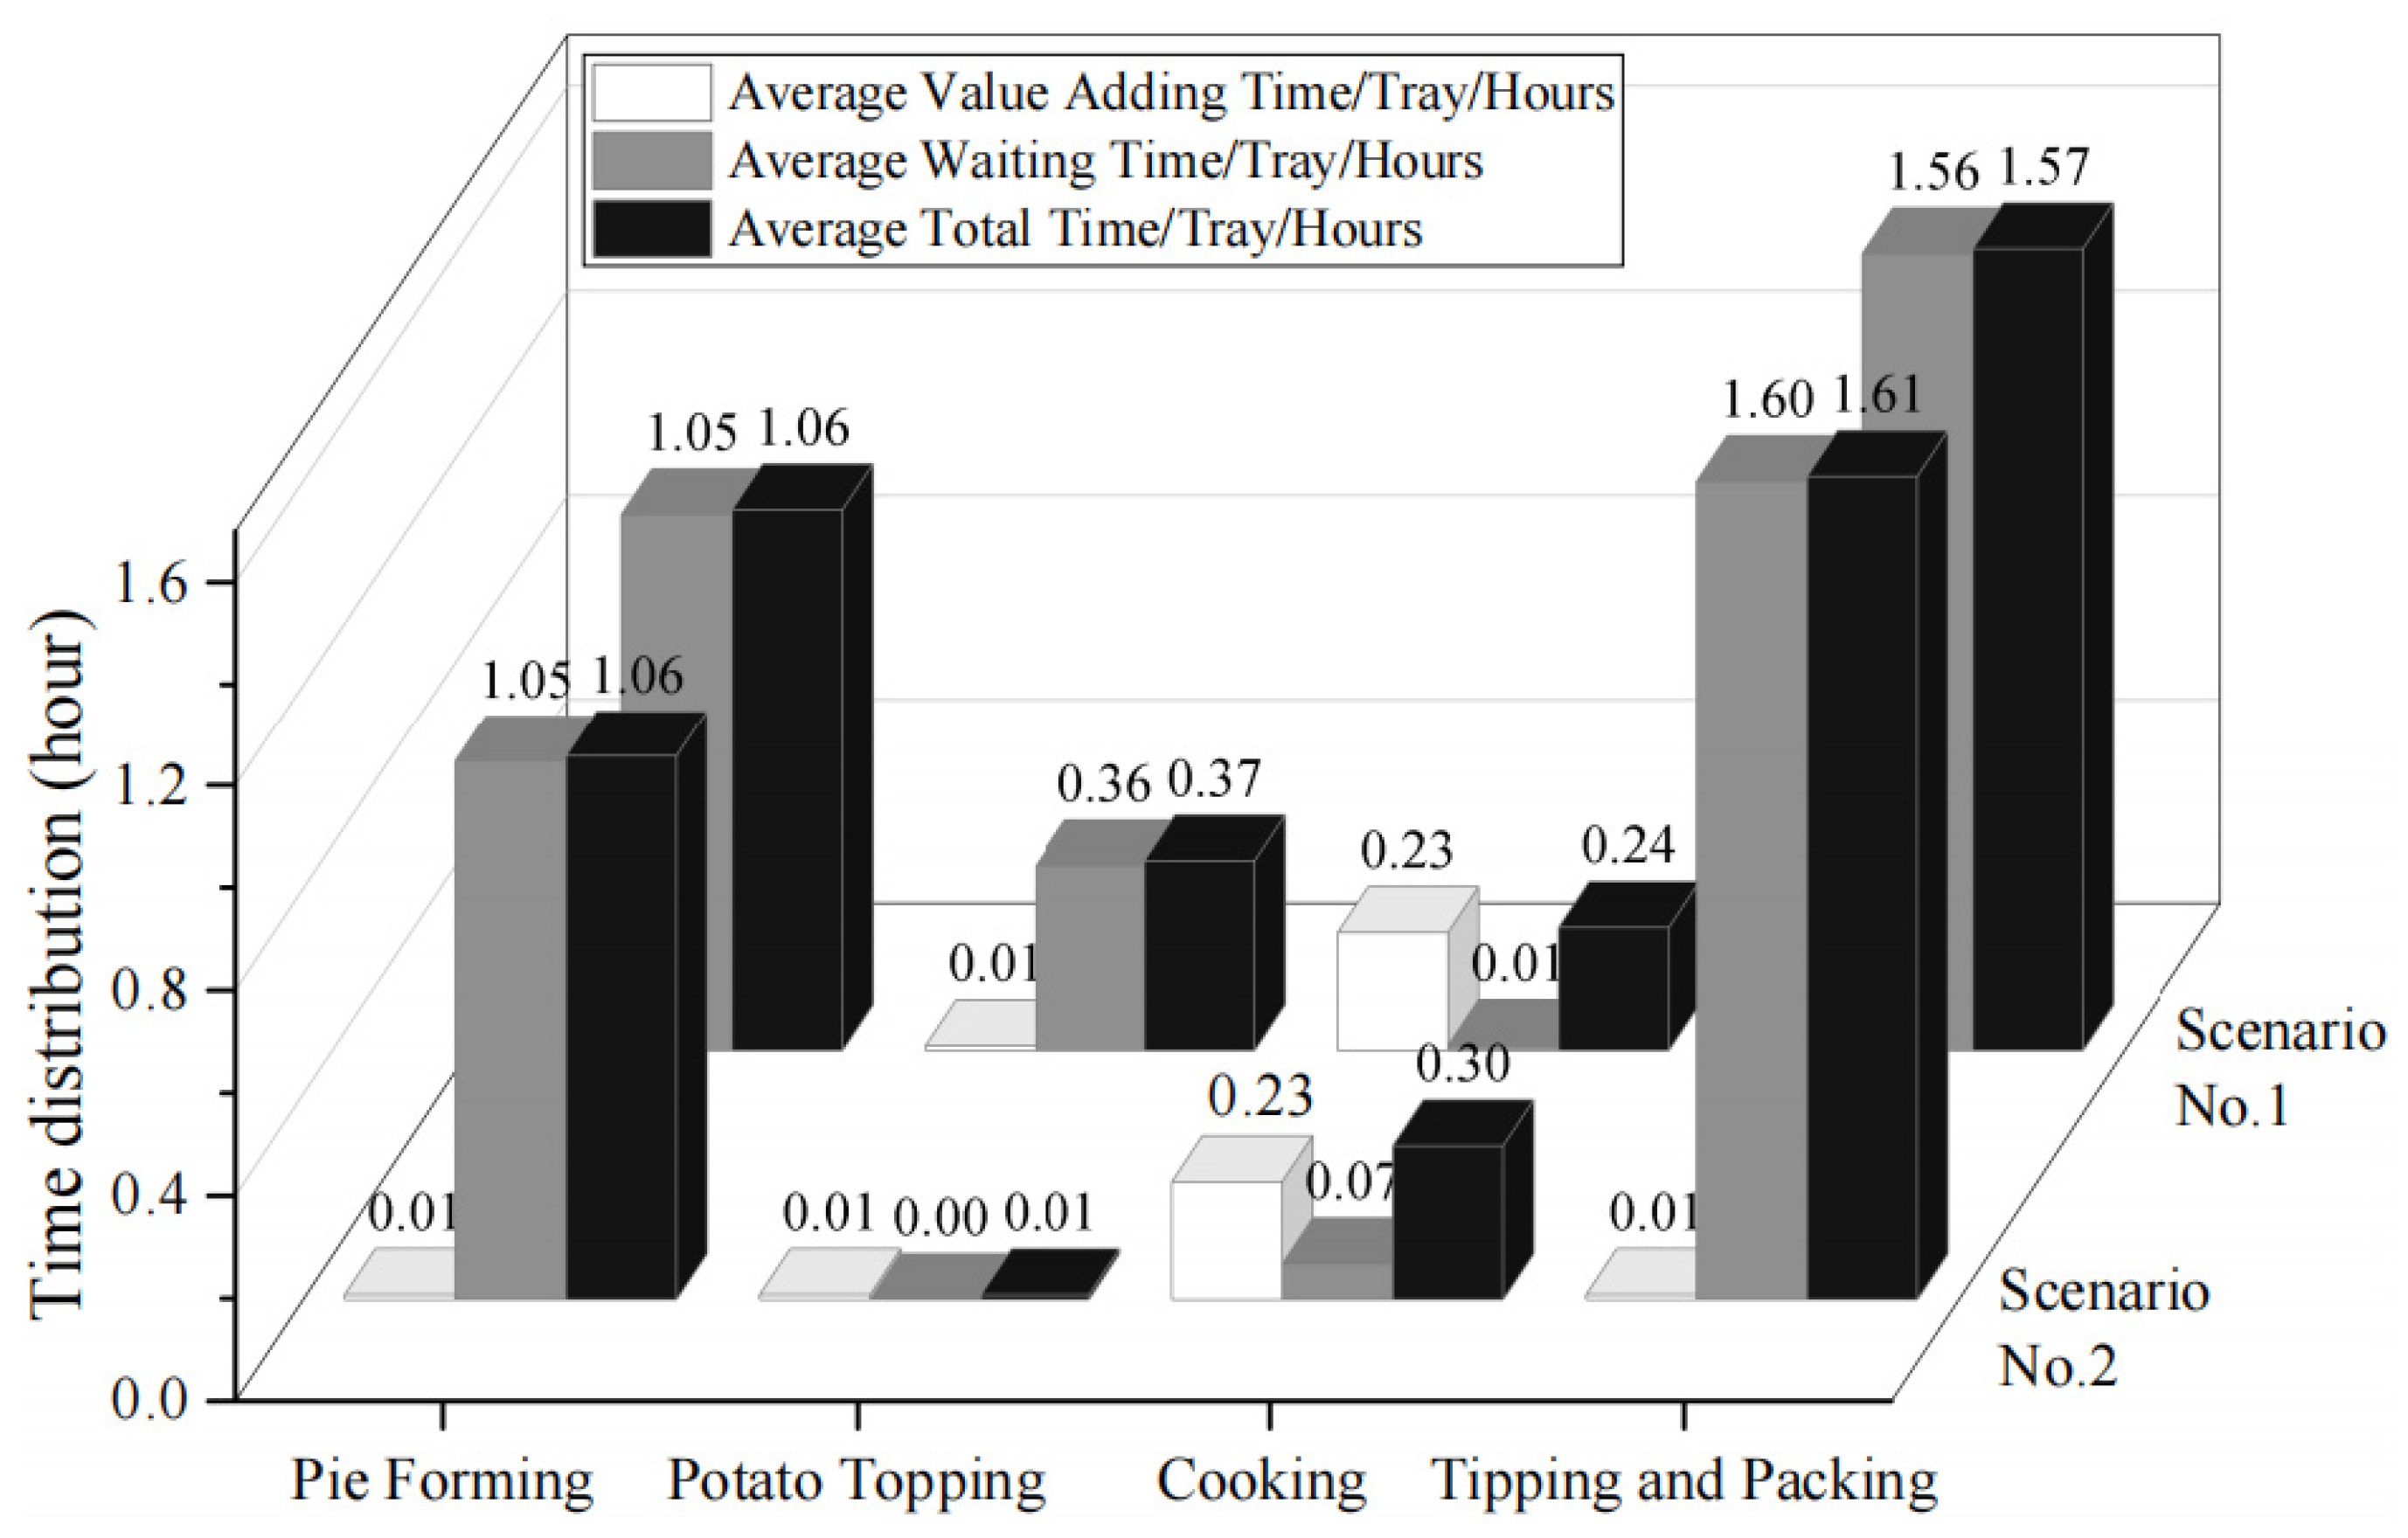
Figure 8.
Average waiting time of the different processes in different scenarios.
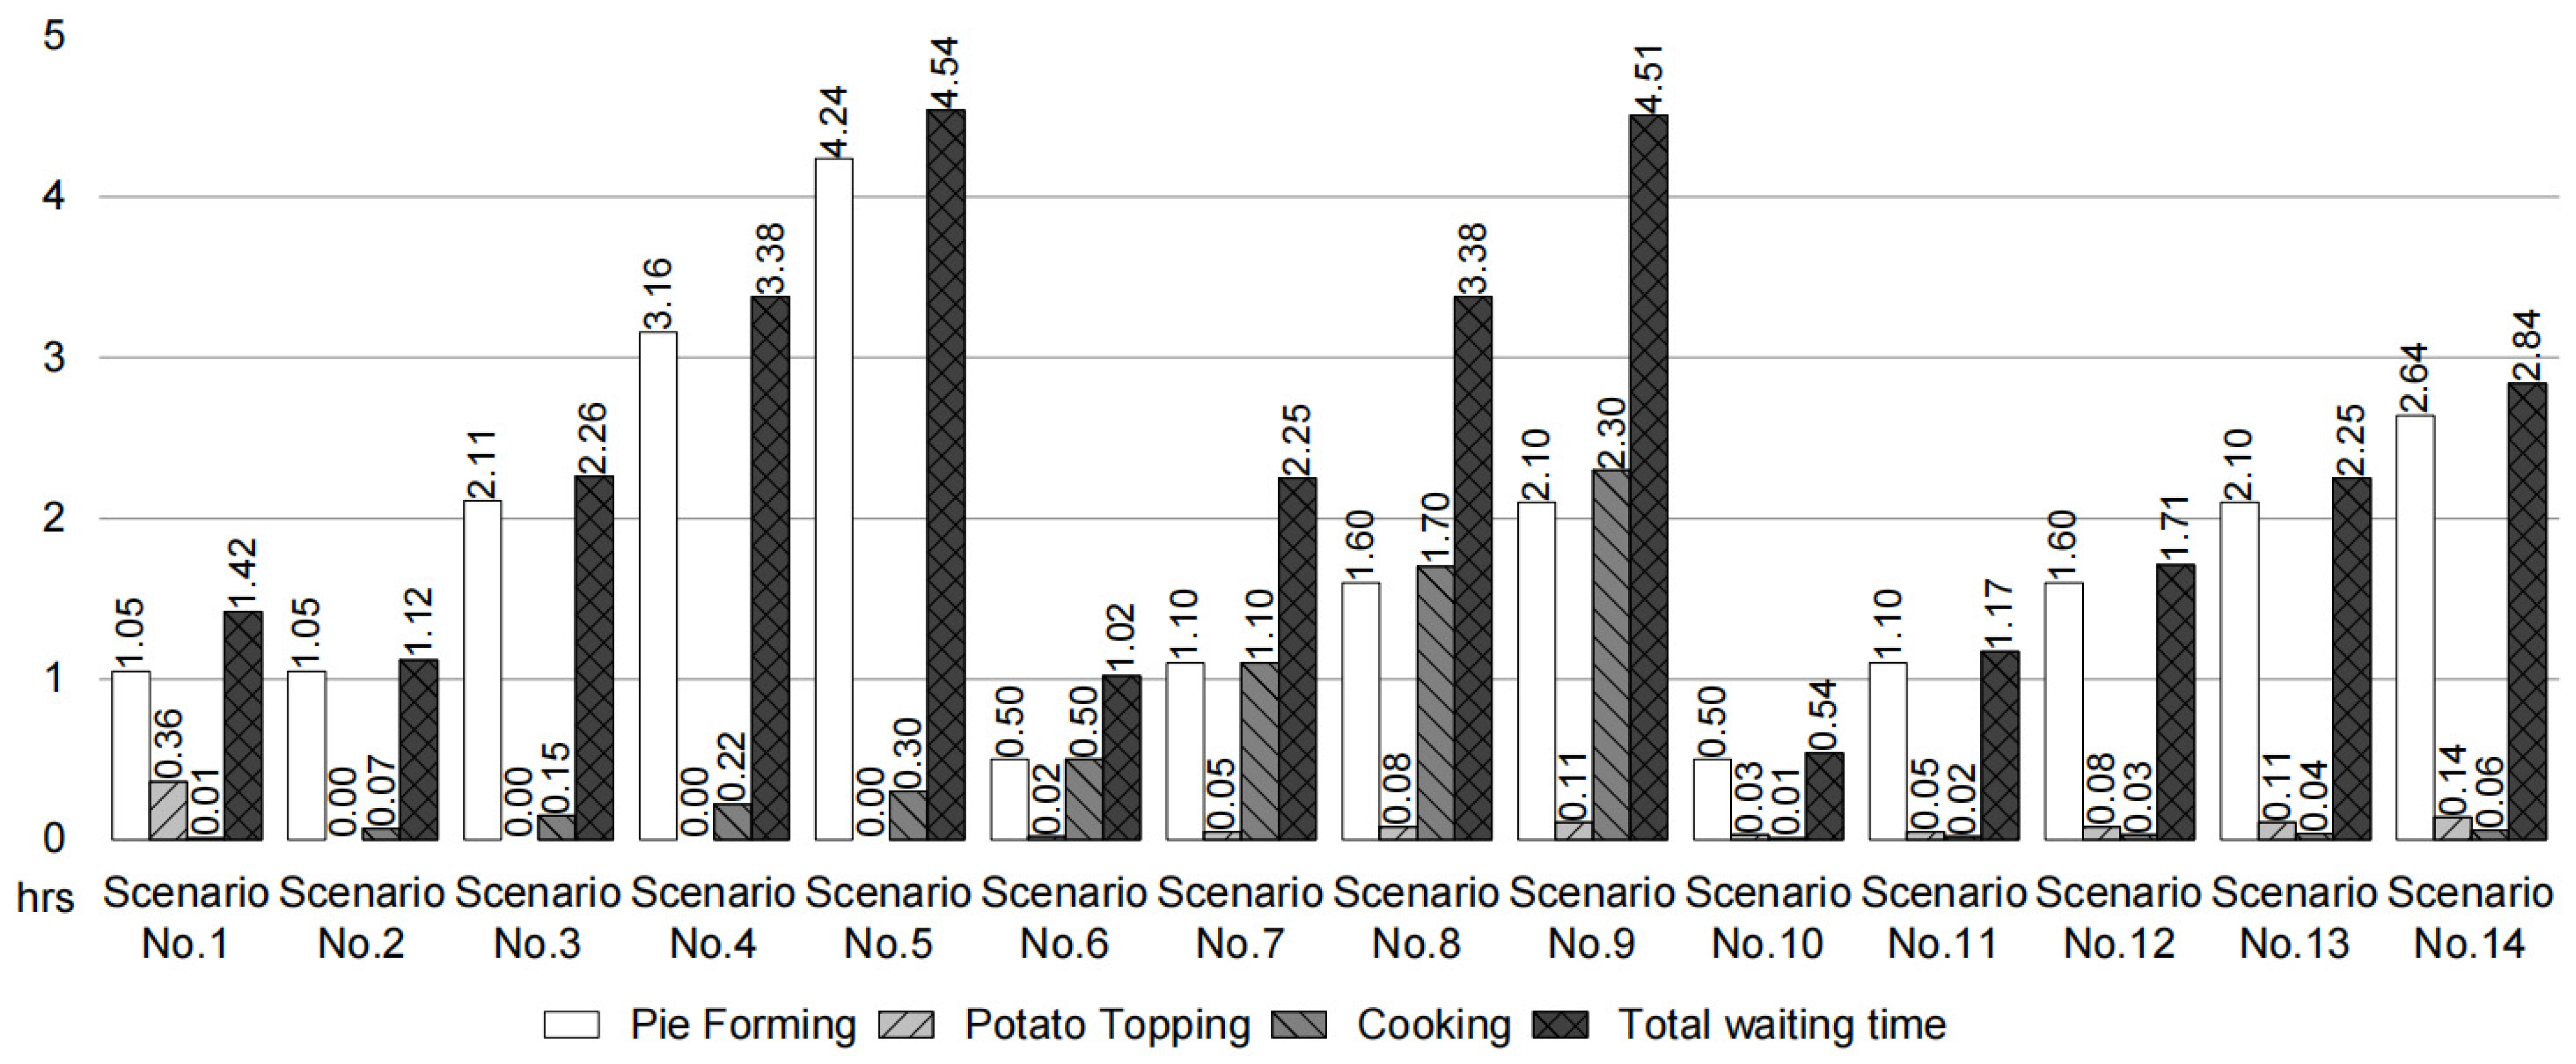
Figure 9.
Production target and total time (simulation result).
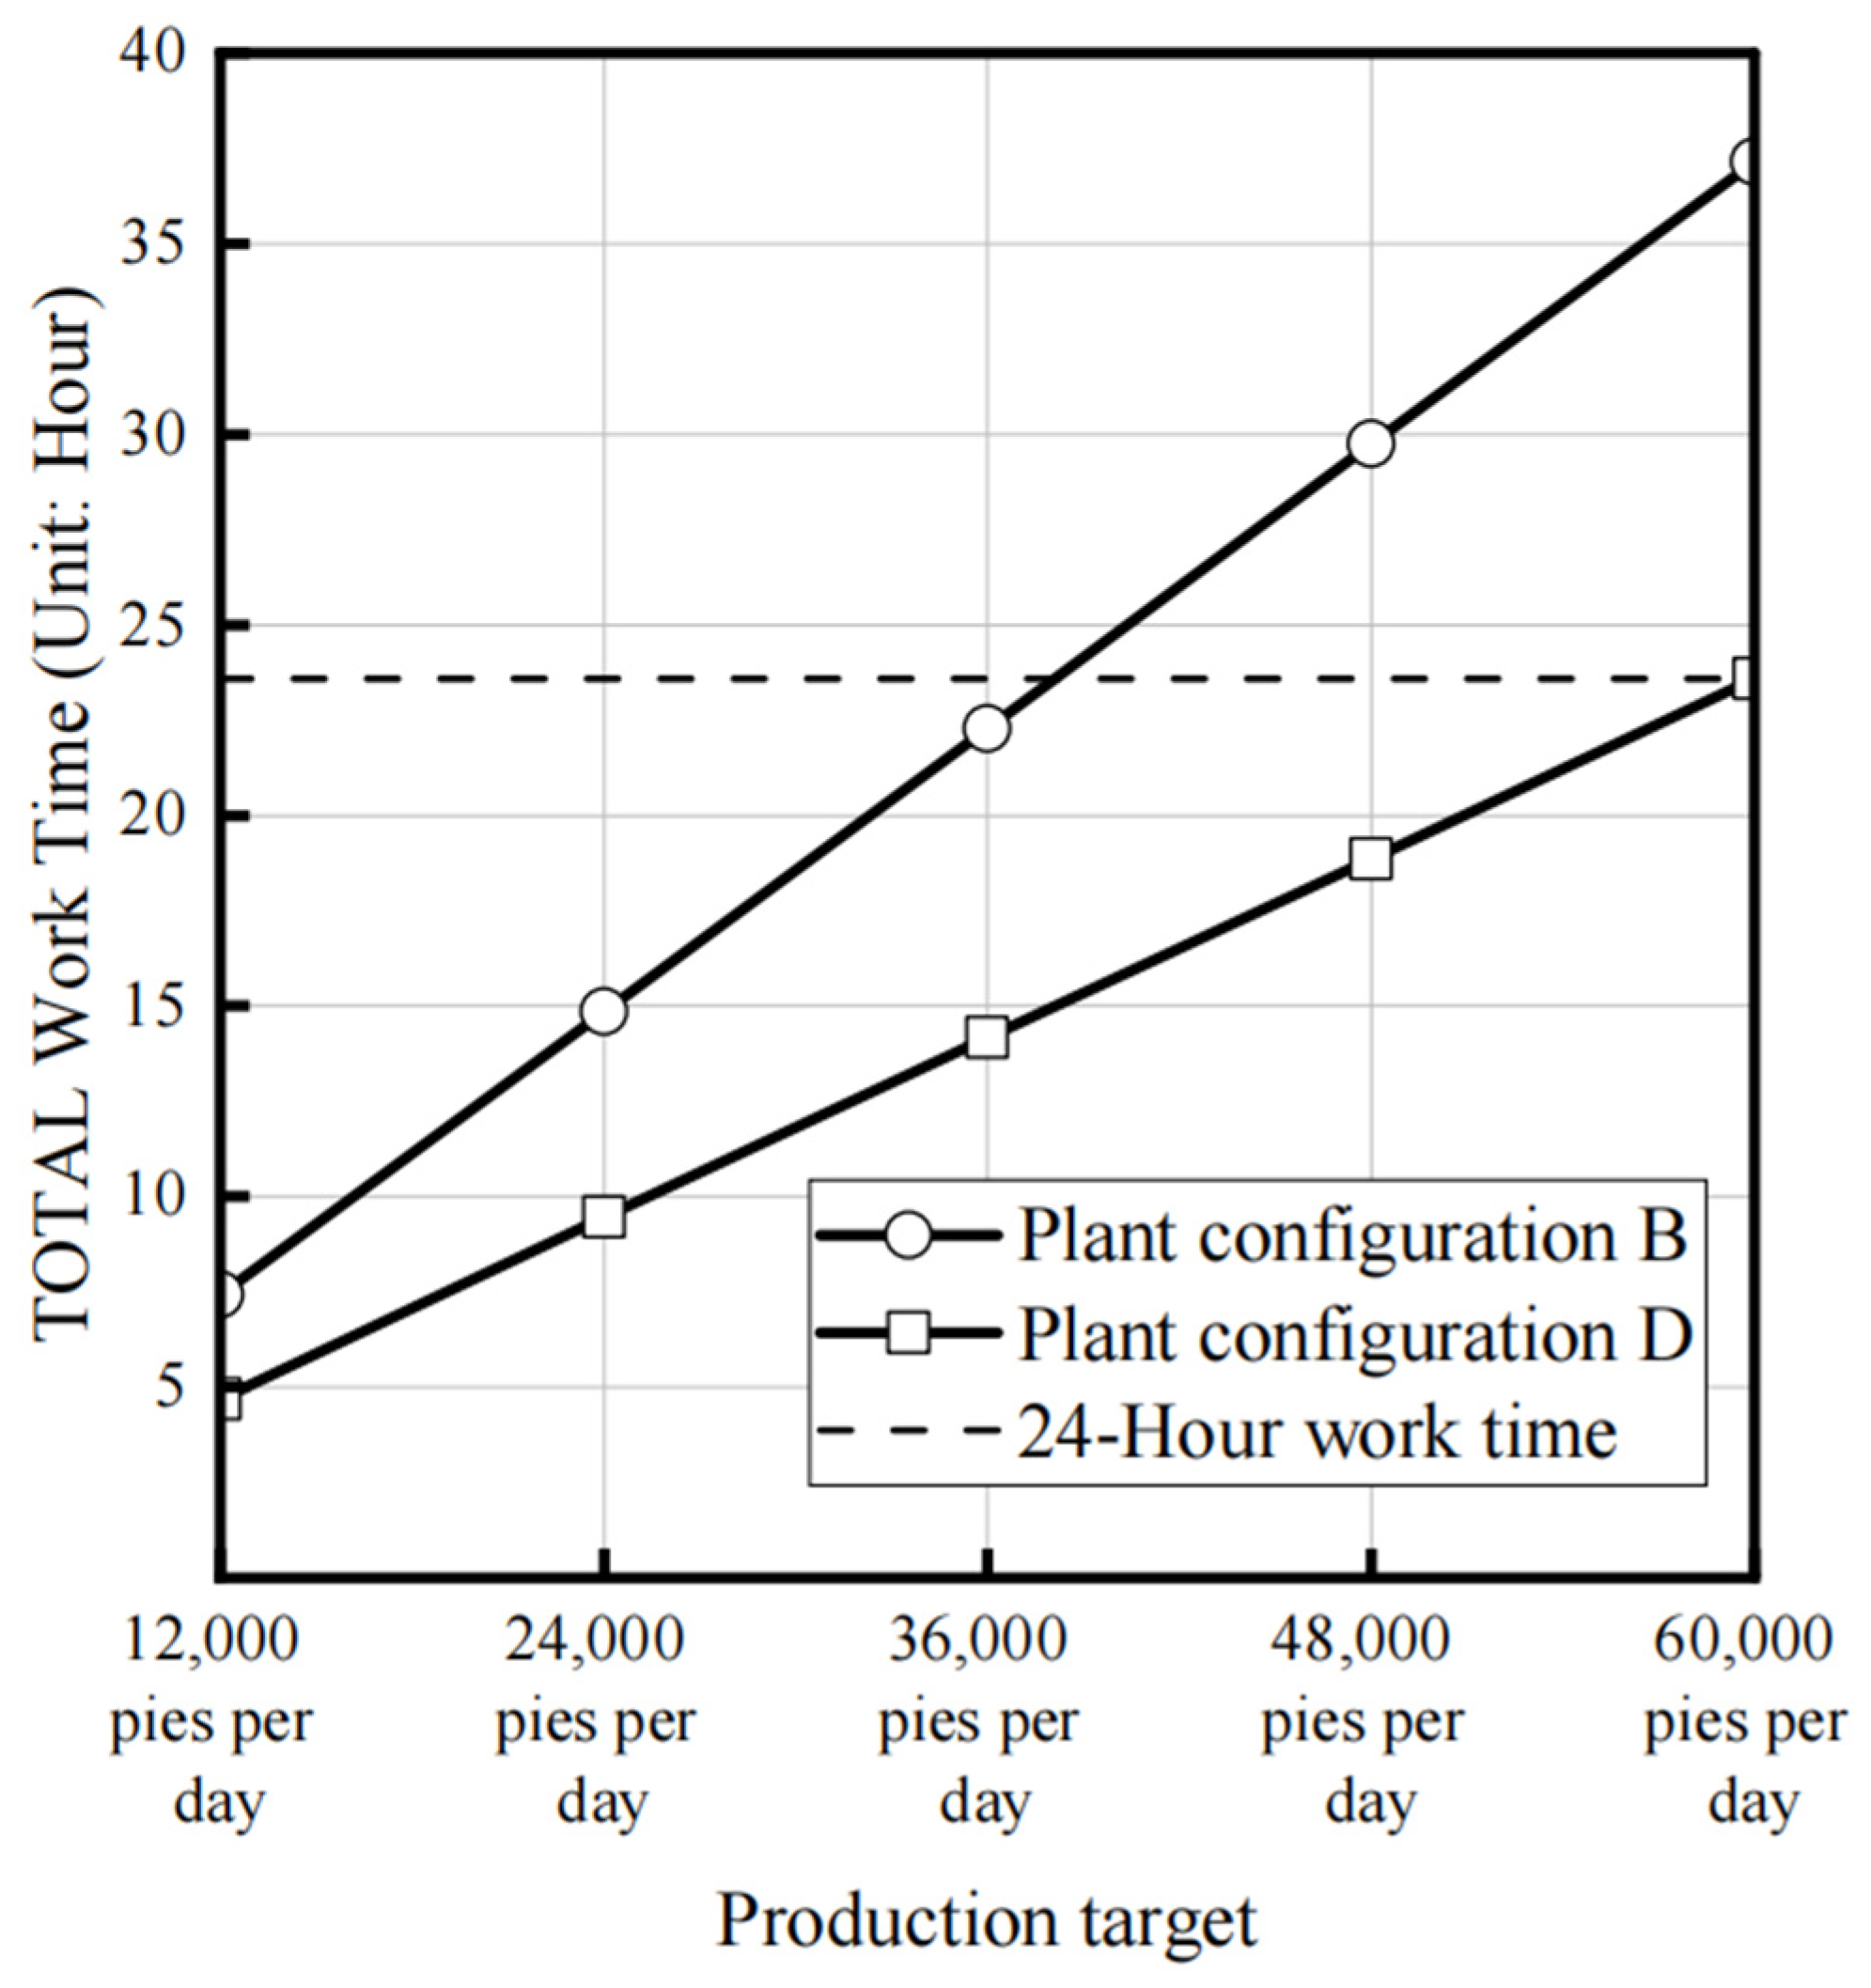
Figure 10.
Gross profit for plant configuration B and plant configuration D (simulation result).

Table 1.
Extract of the diminished quality of life risk register of the status quo.
| Diminished Quality of Life Risk-Measuring Instrument | ||||||
|---|---|---|---|---|---|---|
| Hazard in the Workplace | Description of the Current State | Existing Safety Barriers | Frequency of the Incident Arising | Description of the Potential Consequence | Likelihood of the Consequence Arising | Severity of Consequence (Examined by WHODAS) |
| Dust inhalation | Exposure via pastry-making | Face mask available | 30% | Lung infection | 30% | 2.08 |
| Hit by moving objects | Trolleys and forklifts | Feet protection (wearing steel toe cap shoes) | 7% | Traumatic musculoskeletal injury | 50% | 8.33 |
| Trips and falls | Slippery floor | Regular floor clean | 60% | Traumatic musculoskeletal injury | 50% | 8.33 |
| Lacerations | 50% | 4.17 | ||||
| Bone injury | 50% | 8.33 | ||||
| Manual heavy loads and repetitive activities | Pie forming and carrying heavy potato topping bags | NA | 90% | Chronic or overuse of muscles and soft tissue injury | 60% | 8.33 |
| Uncomfortable working position | Bent neck when operating machine | NA | 60% | Chronic or overuse of muscles and soft tissue injury | 50% | 8.33 |
Table 2.
Diminished quality of life thresholds [12].
Table 2.
Diminished quality of life thresholds [12].
| Range of DQL | Level of Risk |
|---|---|
| 0–1 | Low |
| 1–3 | Moderate |
| 3–8 | High |
| Over 8 | Extreme high |
Table 3.
Scenario inputs.
| Plant Configuration | Scenarios | Demand Loading (Pies per Day) | Number of Ovens | Number of Forming Machine | Descriptions |
|---|---|---|---|---|---|
| A | No. 1 | 12,000 | 1 | 1 | Status quo, manual potato topping |
| B | No. 2 | 12,000 | 1 | 1 | Automatic potato topping |
| No. 3 | 24,000 | 1 | 1 | Automatic potato topping | |
| No. 4 | 36,000 | 1 | 1 | Automatic potato topping | |
| No. 5 | 48,000 | 1 | 1 | Automatic potato topping | |
| C | No. 6 | 12,000 | 1 | 2 | Automatic potato topping |
| No. 7 | 24,000 | 1 | 2 | Automatic potato topping | |
| No. 8 | 36,000 | 1 | 2 | Automatic potato topping | |
| No. 9 | 48,000 | 1 | 2 | Automatic potato topping | |
| D | No. 10 | 12,000 | 2 | 2 | Automatic potato topping |
| No. 11 | 24,000 | 2 | 2 | Automatic potato topping | |
| No. 12 | 36,000 | 2 | 2 | Automatic potato topping | |
| No. 13 | 48,000 | 2 | 2 | Automatic potato topping | |
| No. 14 | 60,000 | 2 | 2 | Automatic potato topping |
Table 4.
Production capacity and requirements.
| Plant Configuration | Machine Arrangement | Production Capacity | Capital Implications for Volume Growth | Labor Implications for Volume Growth |
|---|---|---|---|---|
| B | One pie-forming machine and one oven | 38,741 pies per day | None | Extra workers required, to be recruited for different work shifts. |
| D | Two pie-forming machines and two ovens | 60,225 pies per day | Requirement to purchase one oven and one pie-forming machine. | Extra workers required, to be recruited for different work shifts. |
Publisher’s Note: MDPI stays neutral with regard to jurisdictional claims in published maps and institutional affiliations. |
© 2022 by the authors. Licensee MDPI, Basel, Switzerland. This article is an open access article distributed under the terms and conditions of the Creative Commons Attribution (CC BY) license (https://creativecommons.org/licenses/by/4.0/).
Share and Cite
MDPI and ACS Style
Ji, Z.; Pons, D.; Su, Z.; Lyu, Z.; Pearse, J. Integrating Occupational Health and Safety Risk and Production Economics for Sustainable SME Growth. Sustainability 2022, 14, 14565. https://doi.org/10.3390/su142114565
AMA Style
Ji Z, Pons D, Su Z, Lyu Z, Pearse J. Integrating Occupational Health and Safety Risk and Production Economics for Sustainable SME Growth. Sustainability. 2022; 14(21):14565. https://doi.org/10.3390/su142114565
Chicago/Turabian StyleJi, Zuzhen, Dirk Pons, Zhouyang Su, Zichong Lyu, and John Pearse. 2022. "Integrating Occupational Health and Safety Risk and Production Economics for Sustainable SME Growth" Sustainability 14, no. 21: 14565. https://doi.org/10.3390/su142114565
Note that from the first issue of 2016, this journal uses article numbers instead of page numbers. See further details here.