
Spatial-Temporal Variation of Snow Black Carbon Concentration in Snow Cover in Northeast China from 2001 to 2016 Based on Remote Sensing


Abstract
:1. Introduction
2. Materials and Methods
2.1. Study Area
2.2. Data Sets
2.2.1. Remote Sensing Data
2.2.2. Field Data
2.3. Methods
2.3.1. Snow Recognition Method
2.3.2. ART Model
- Reflection function of the semi-infinite snow layer R0
- 2.
- Parameter f(μ, μ0, ϕ)
- 3.
- Absorption coefficient of ice crystal and BC
- 4.
- Relative azimuth angle ϕ
3. Results
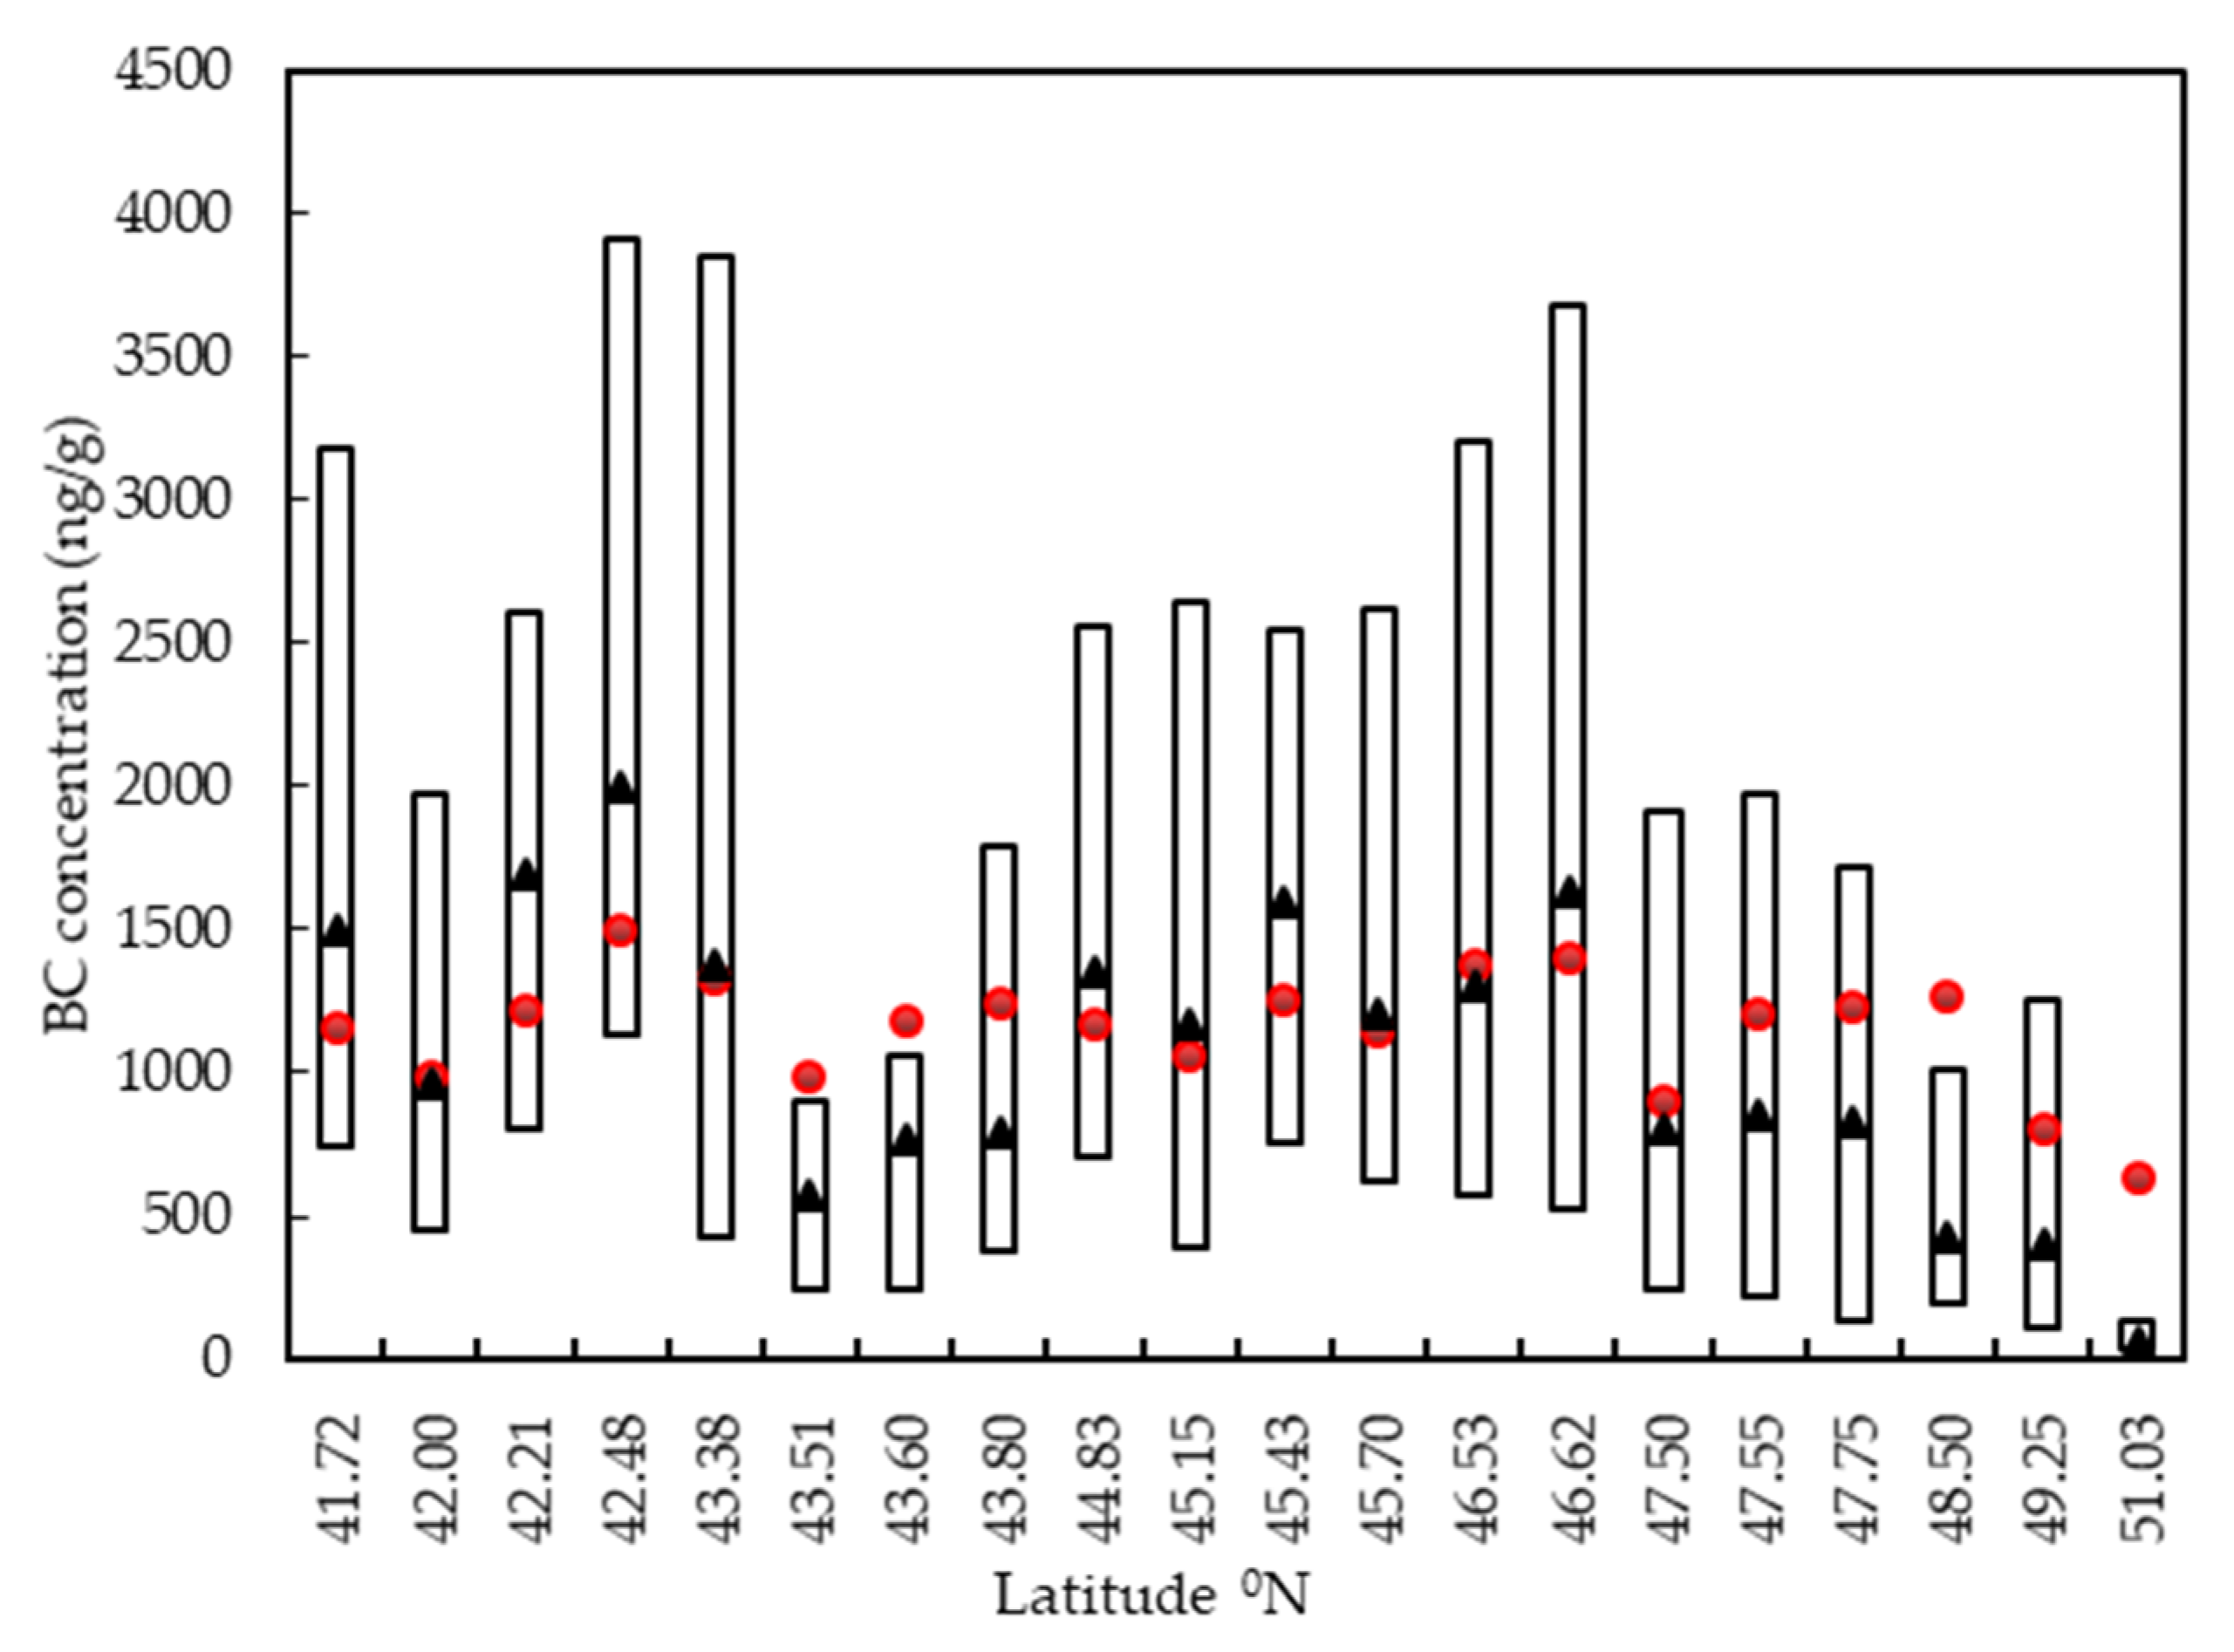
3.1. Model Verification
3.2. Annual BC Concentration
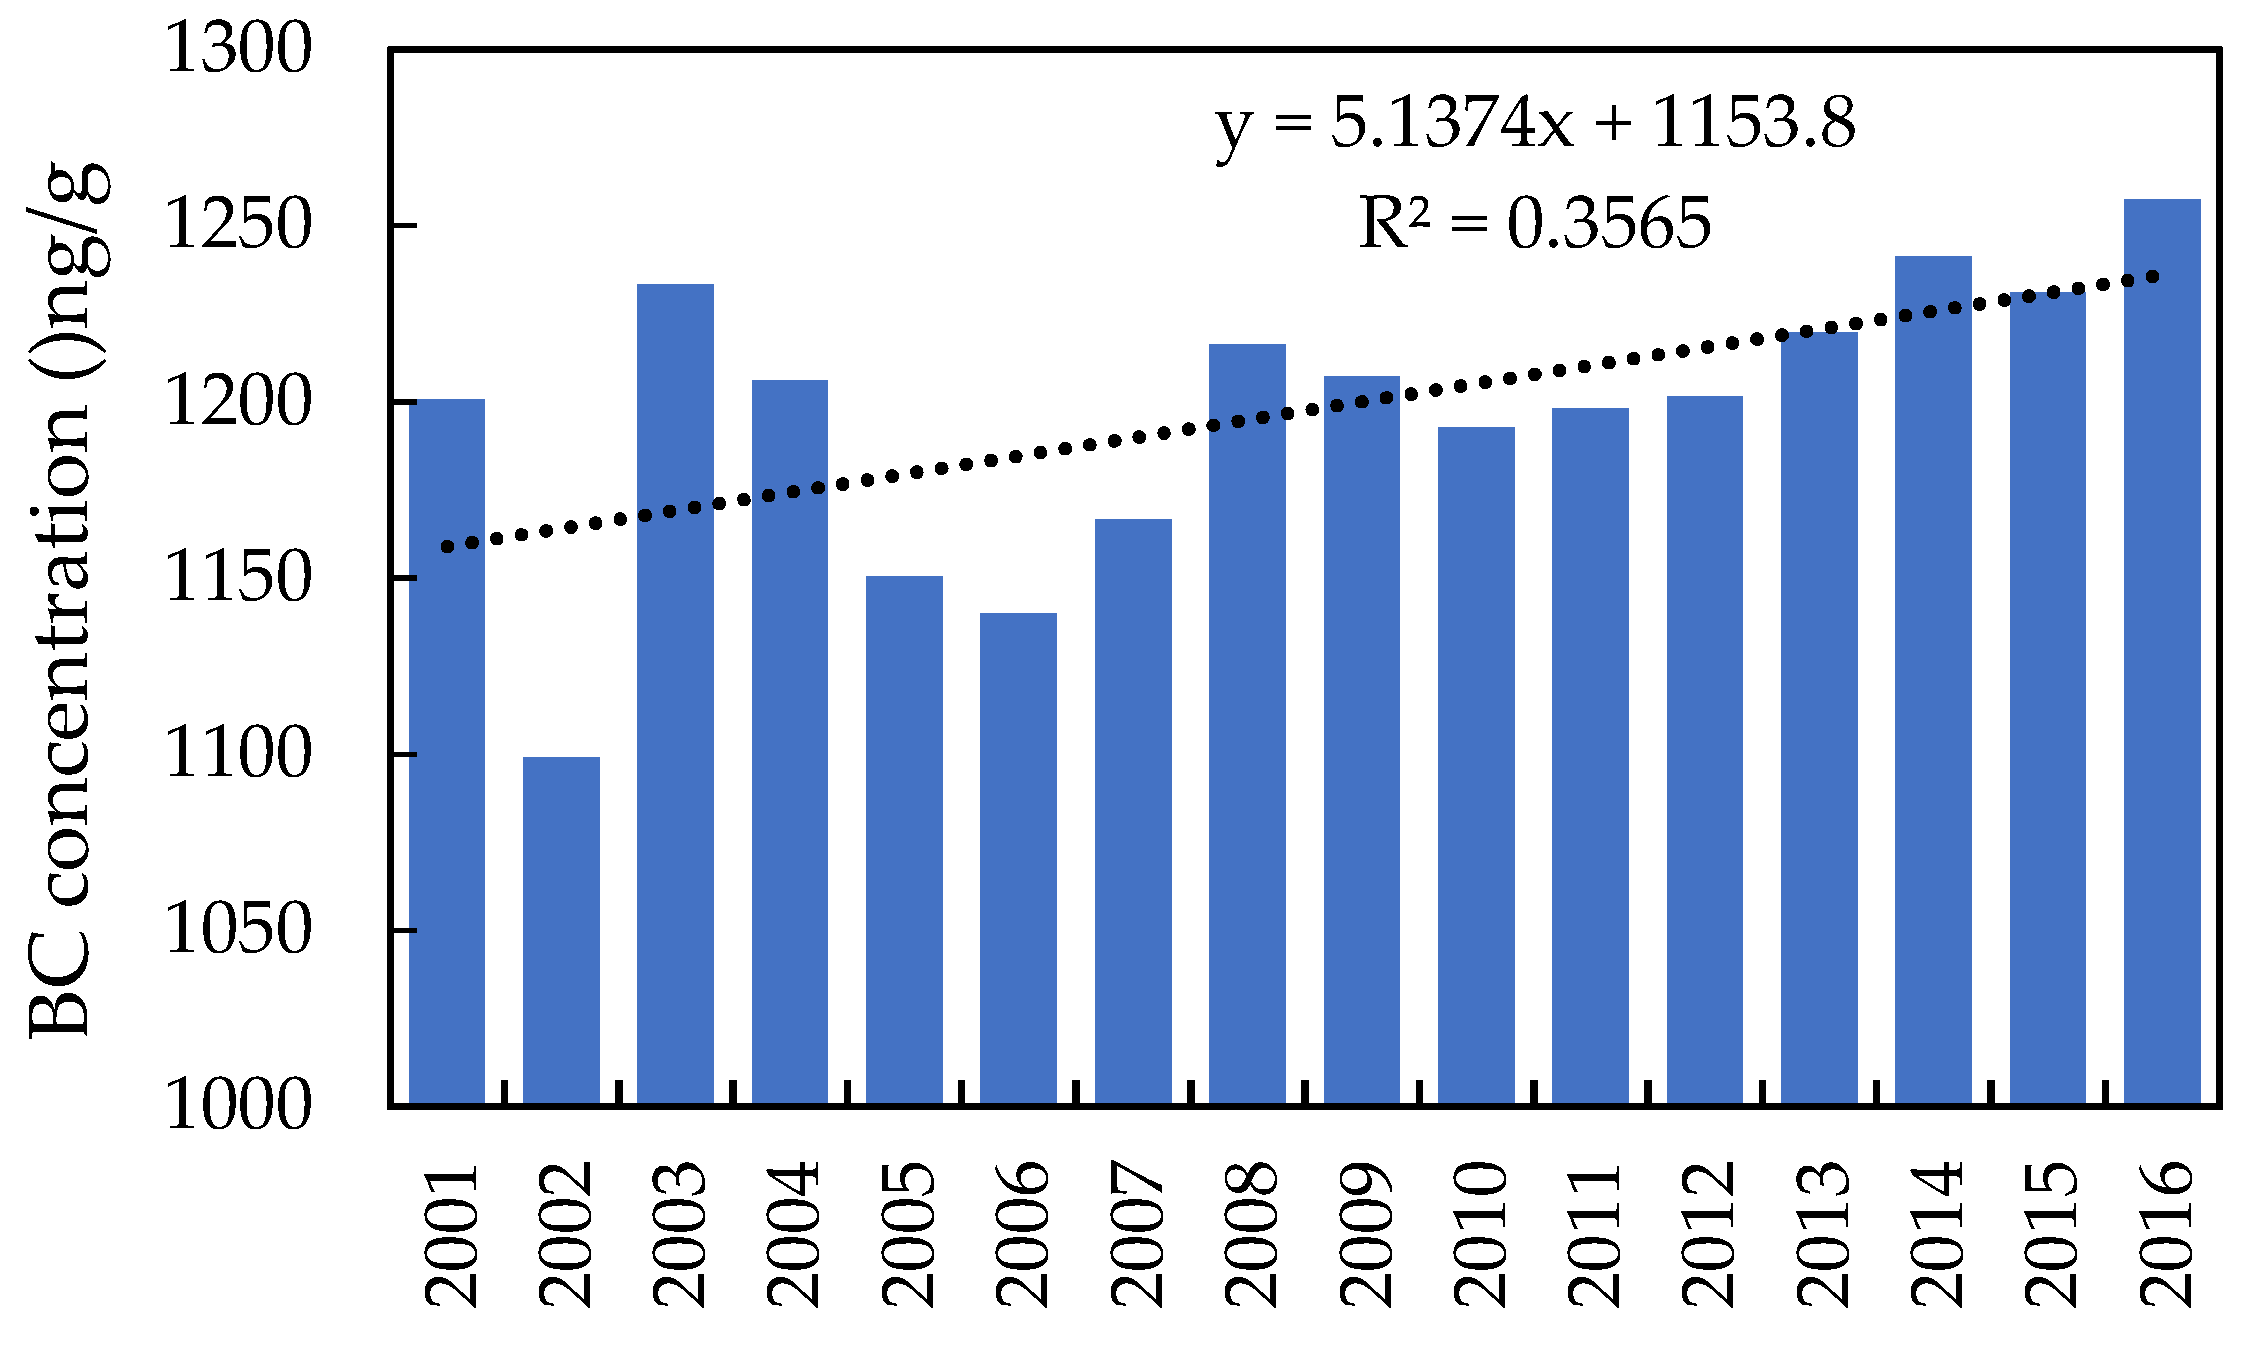
3.2.1. Temporal Variation
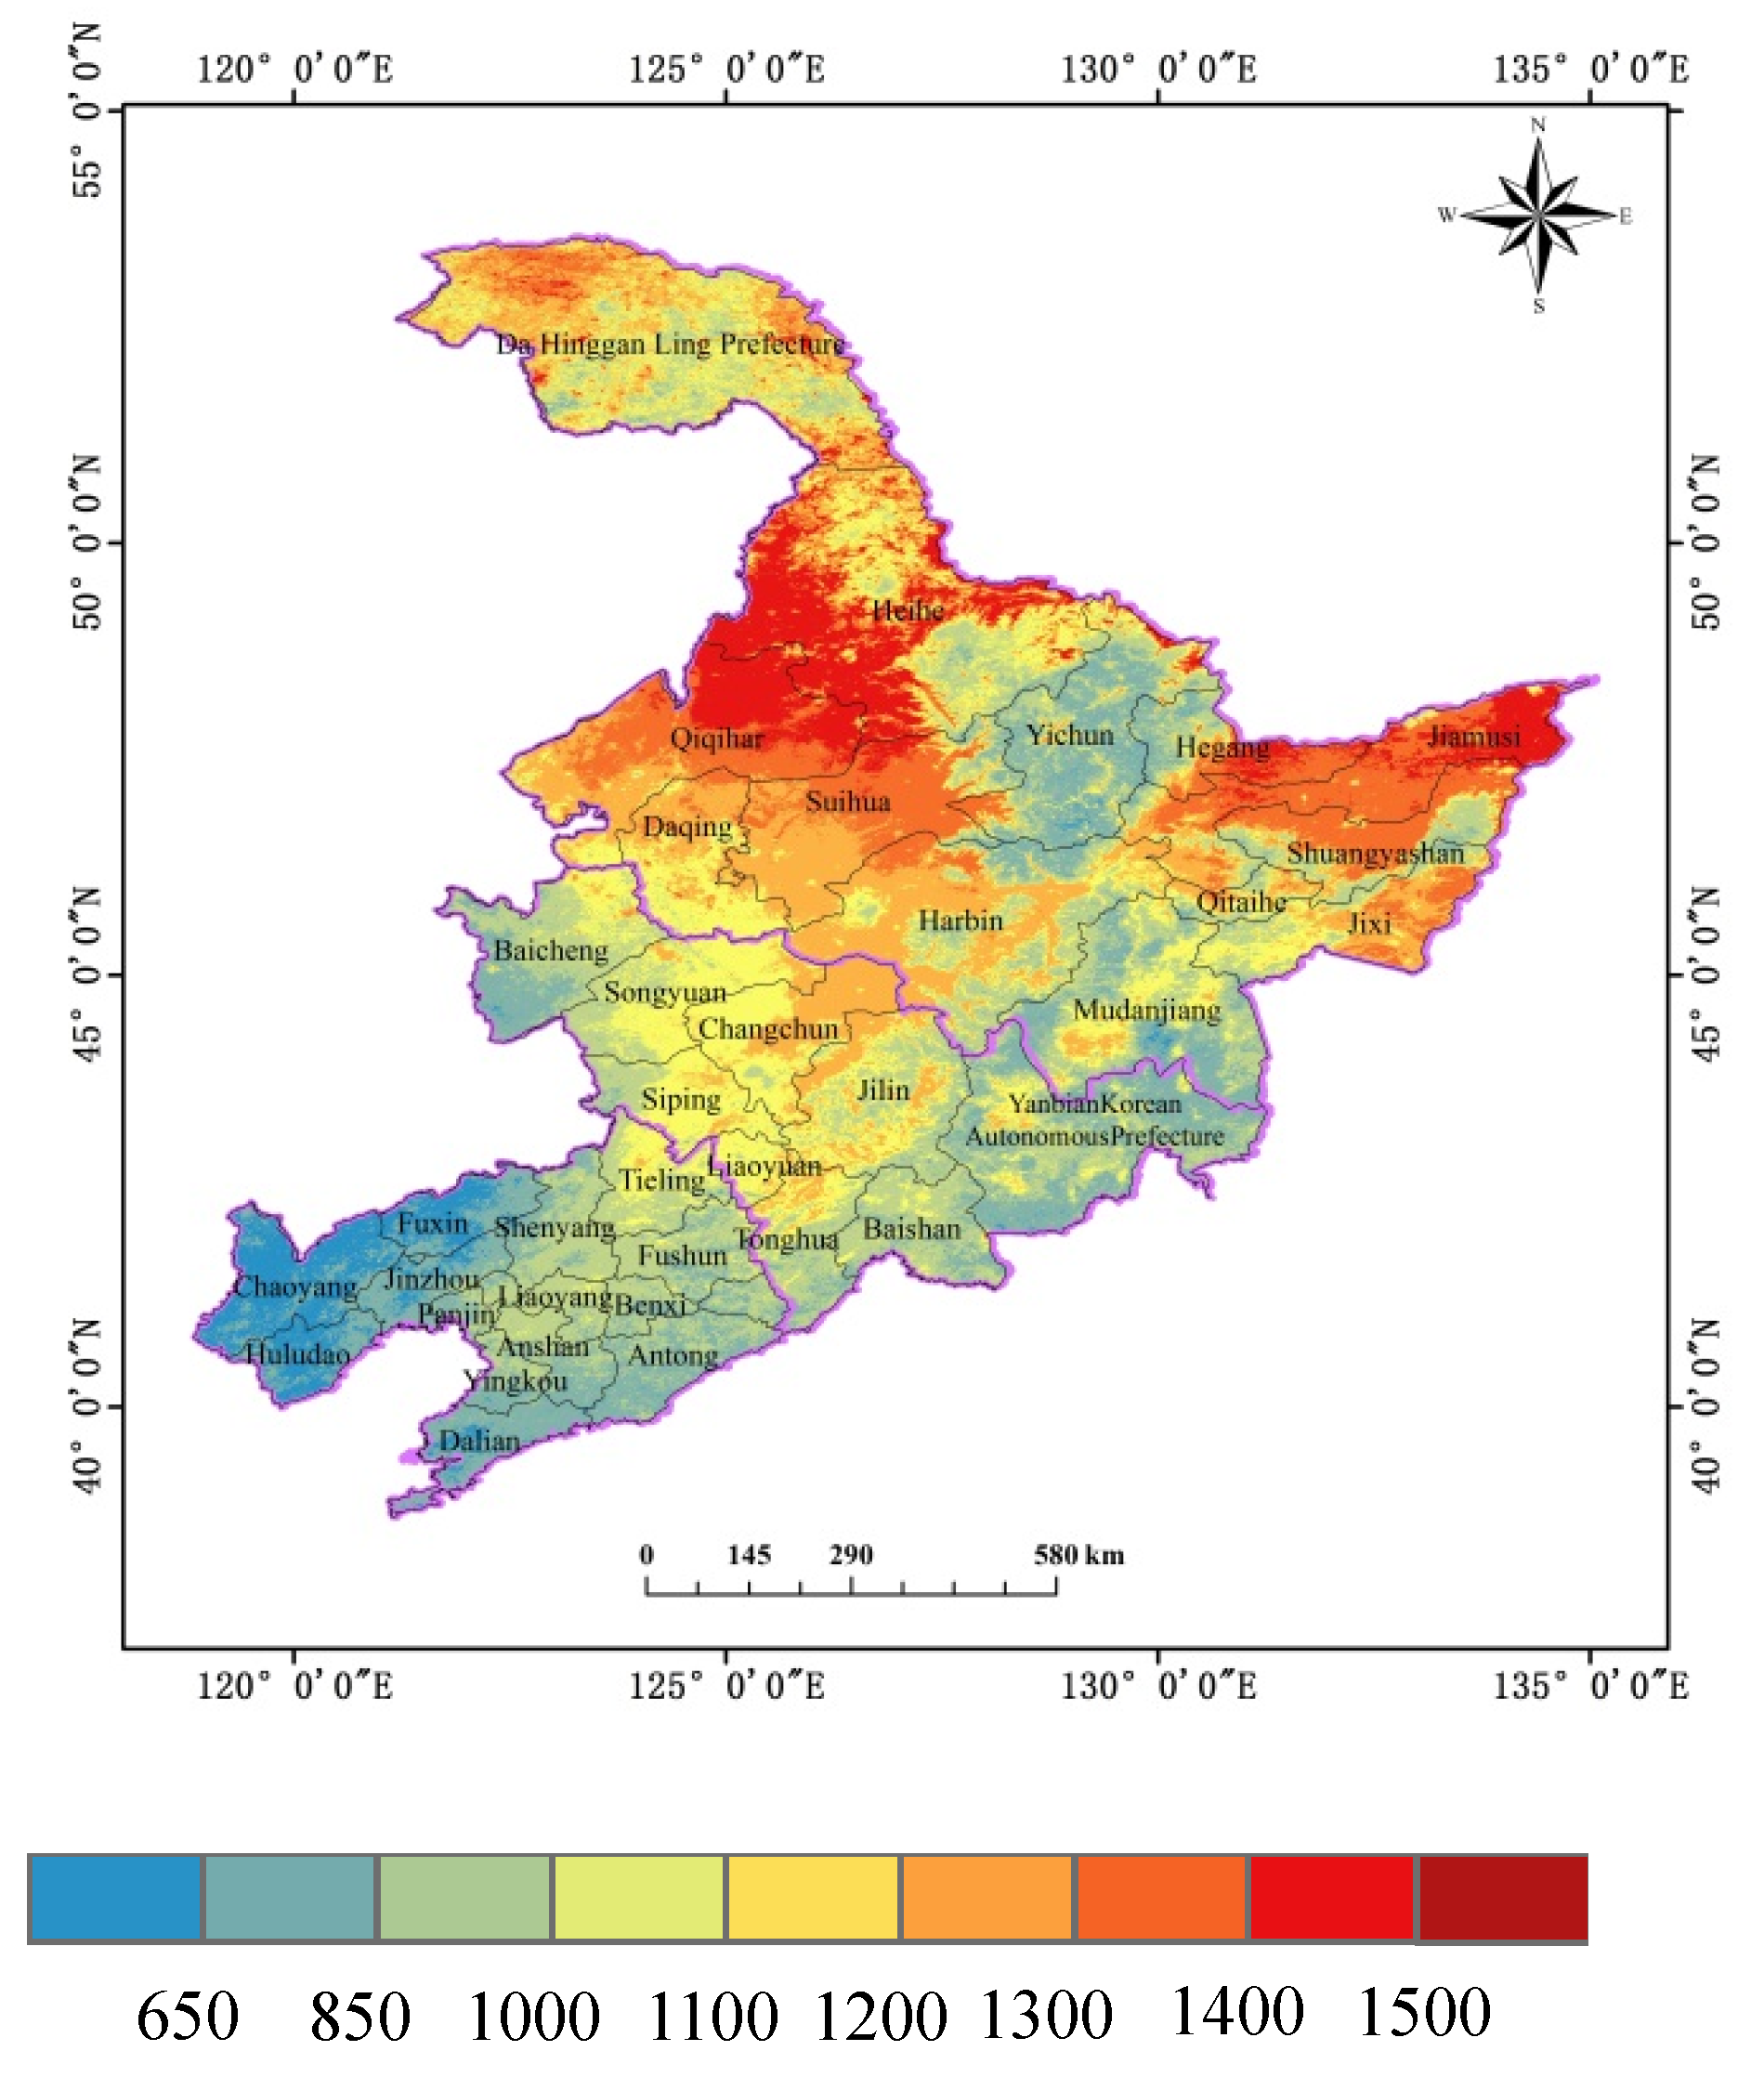
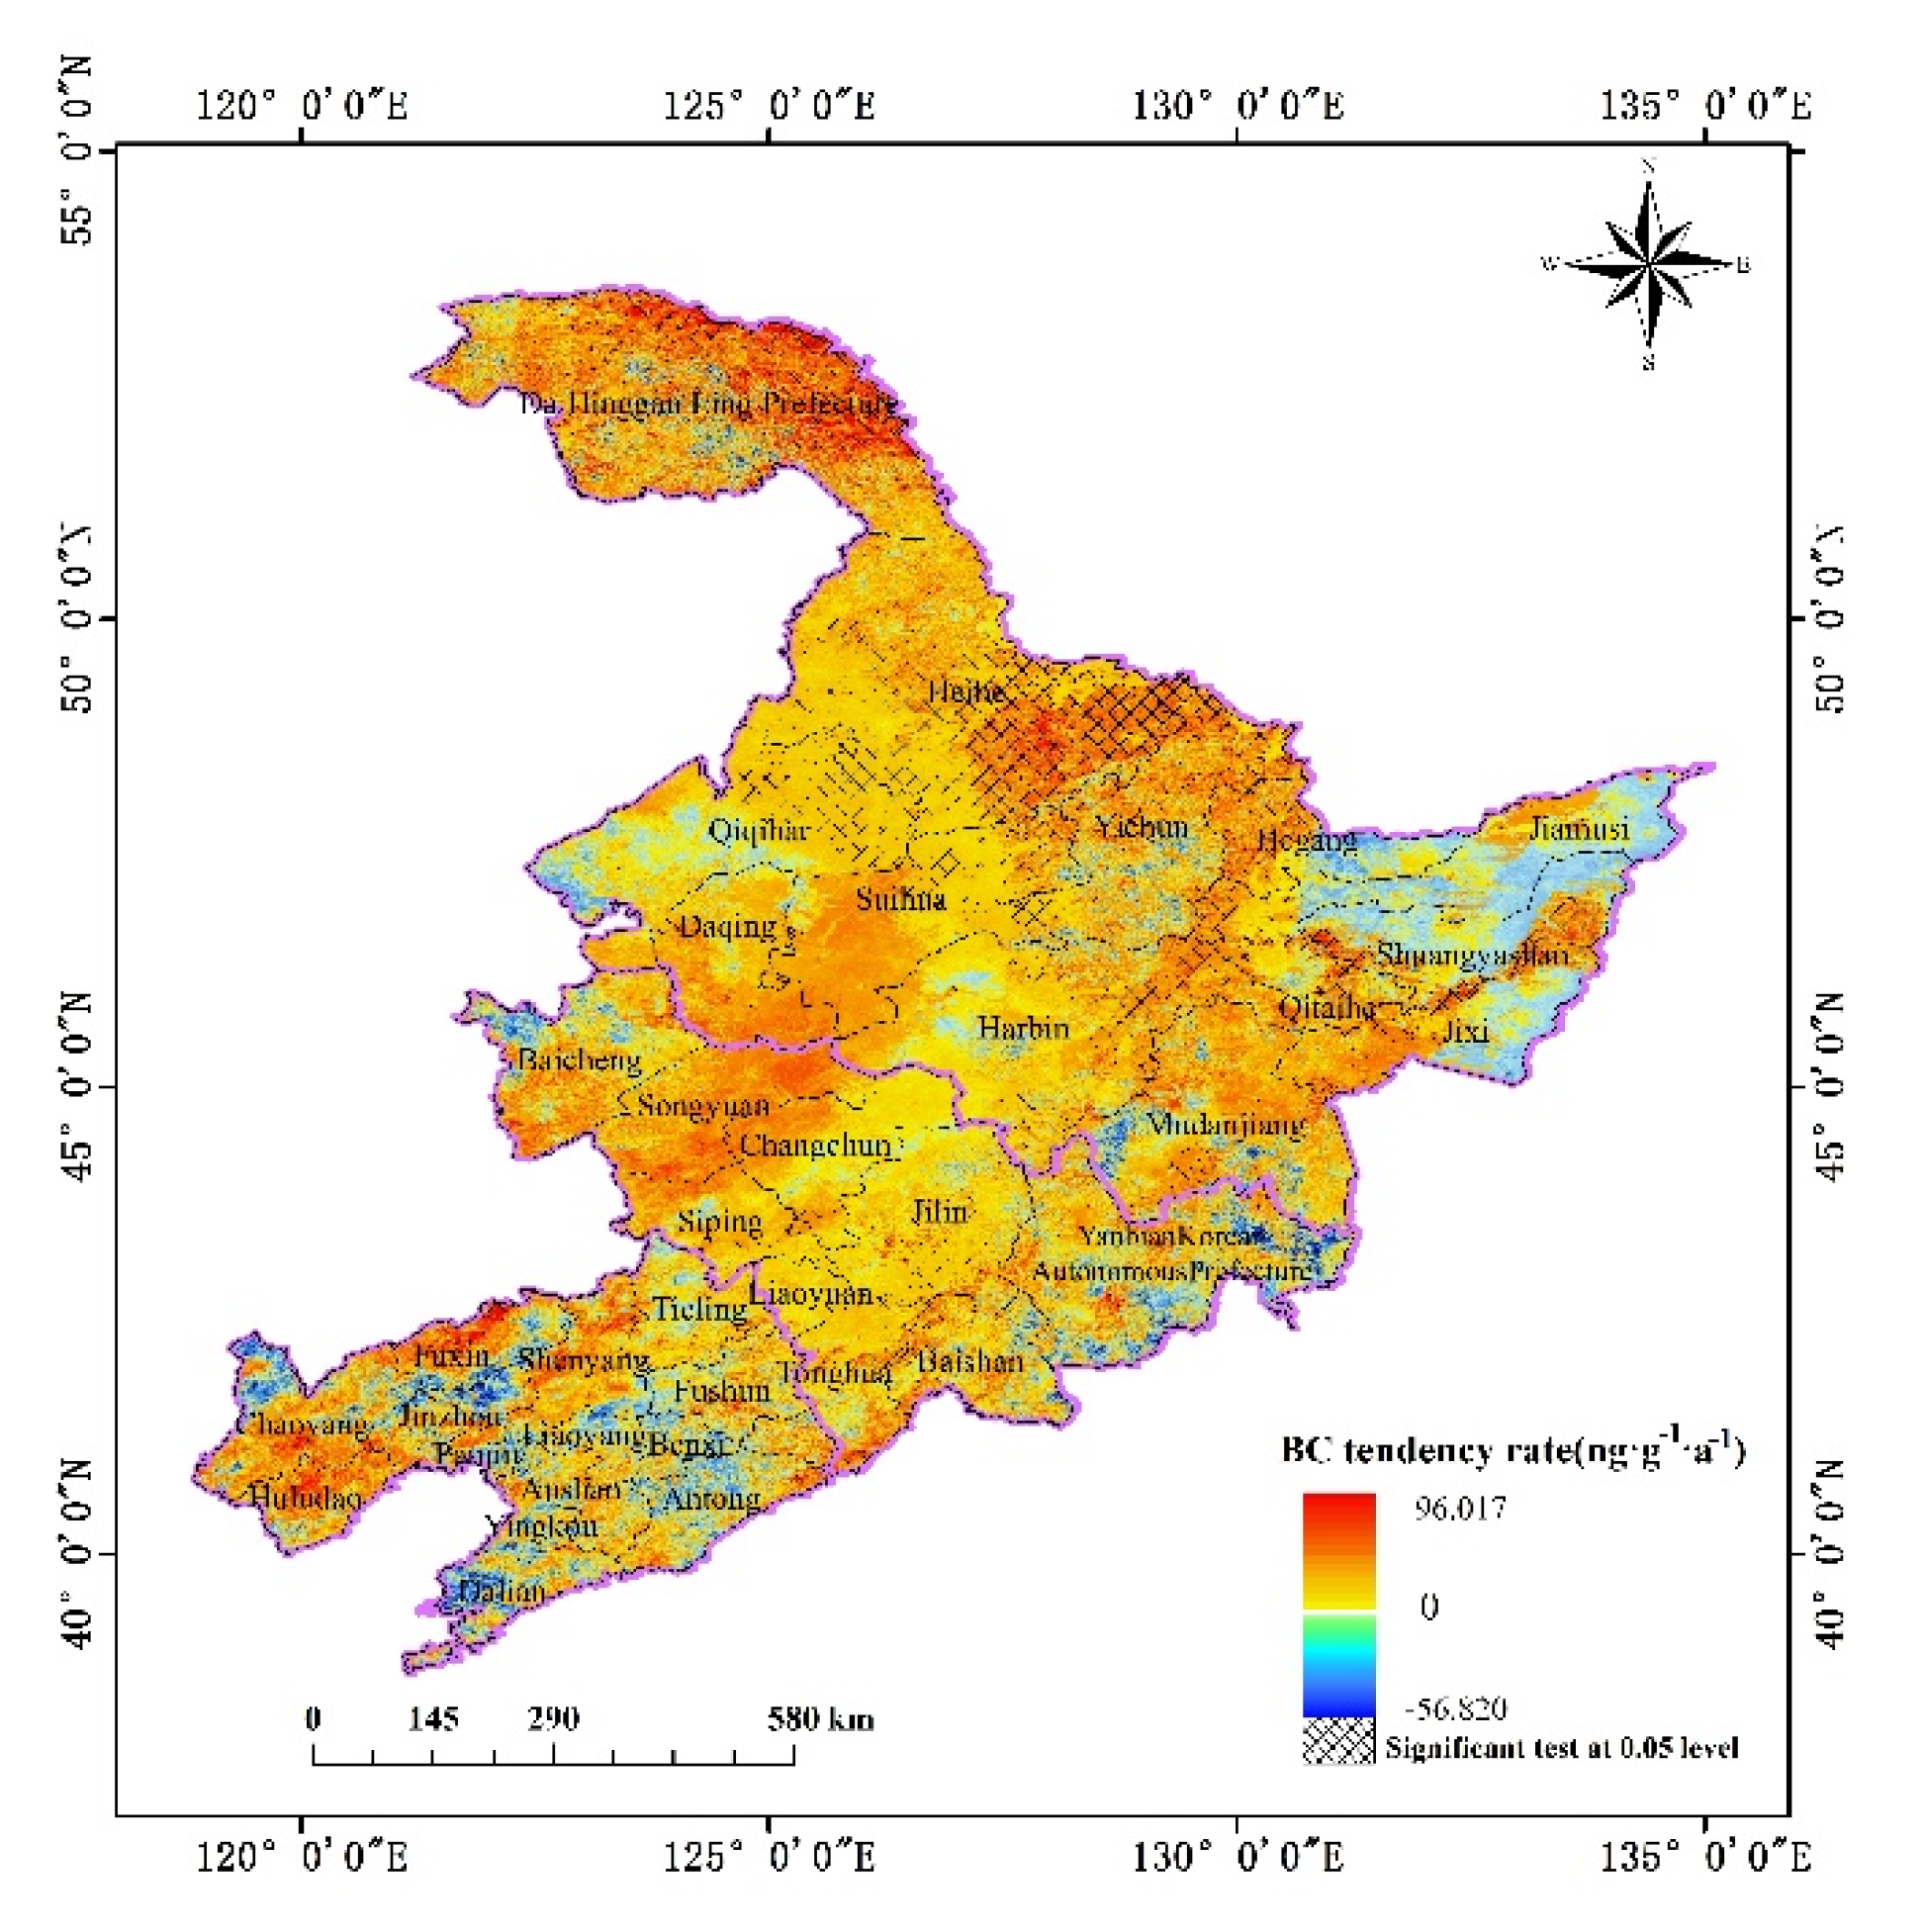
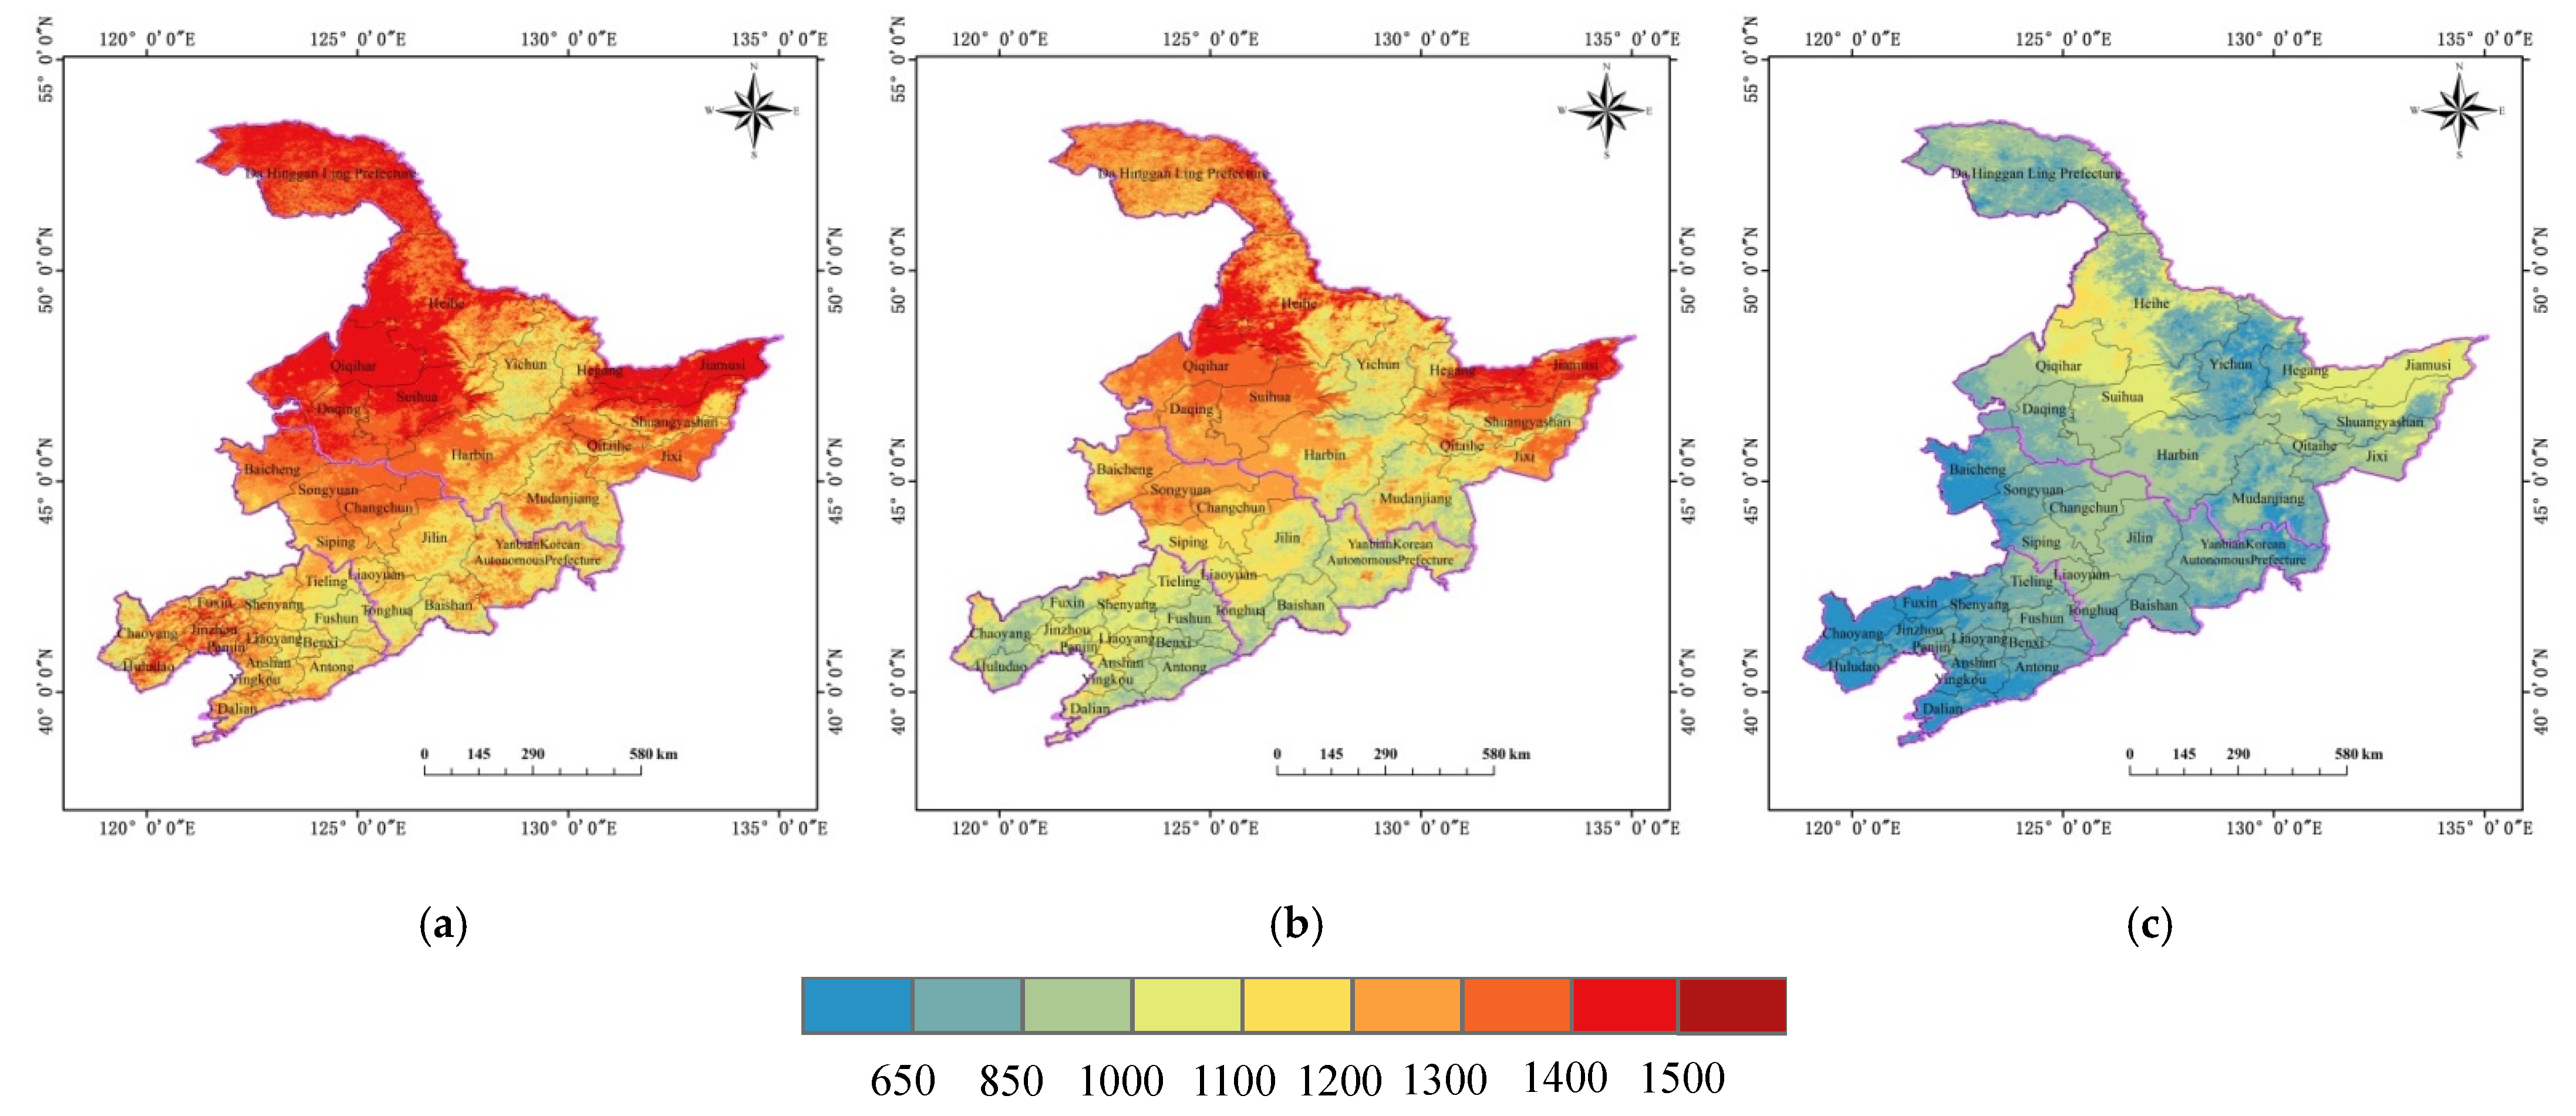
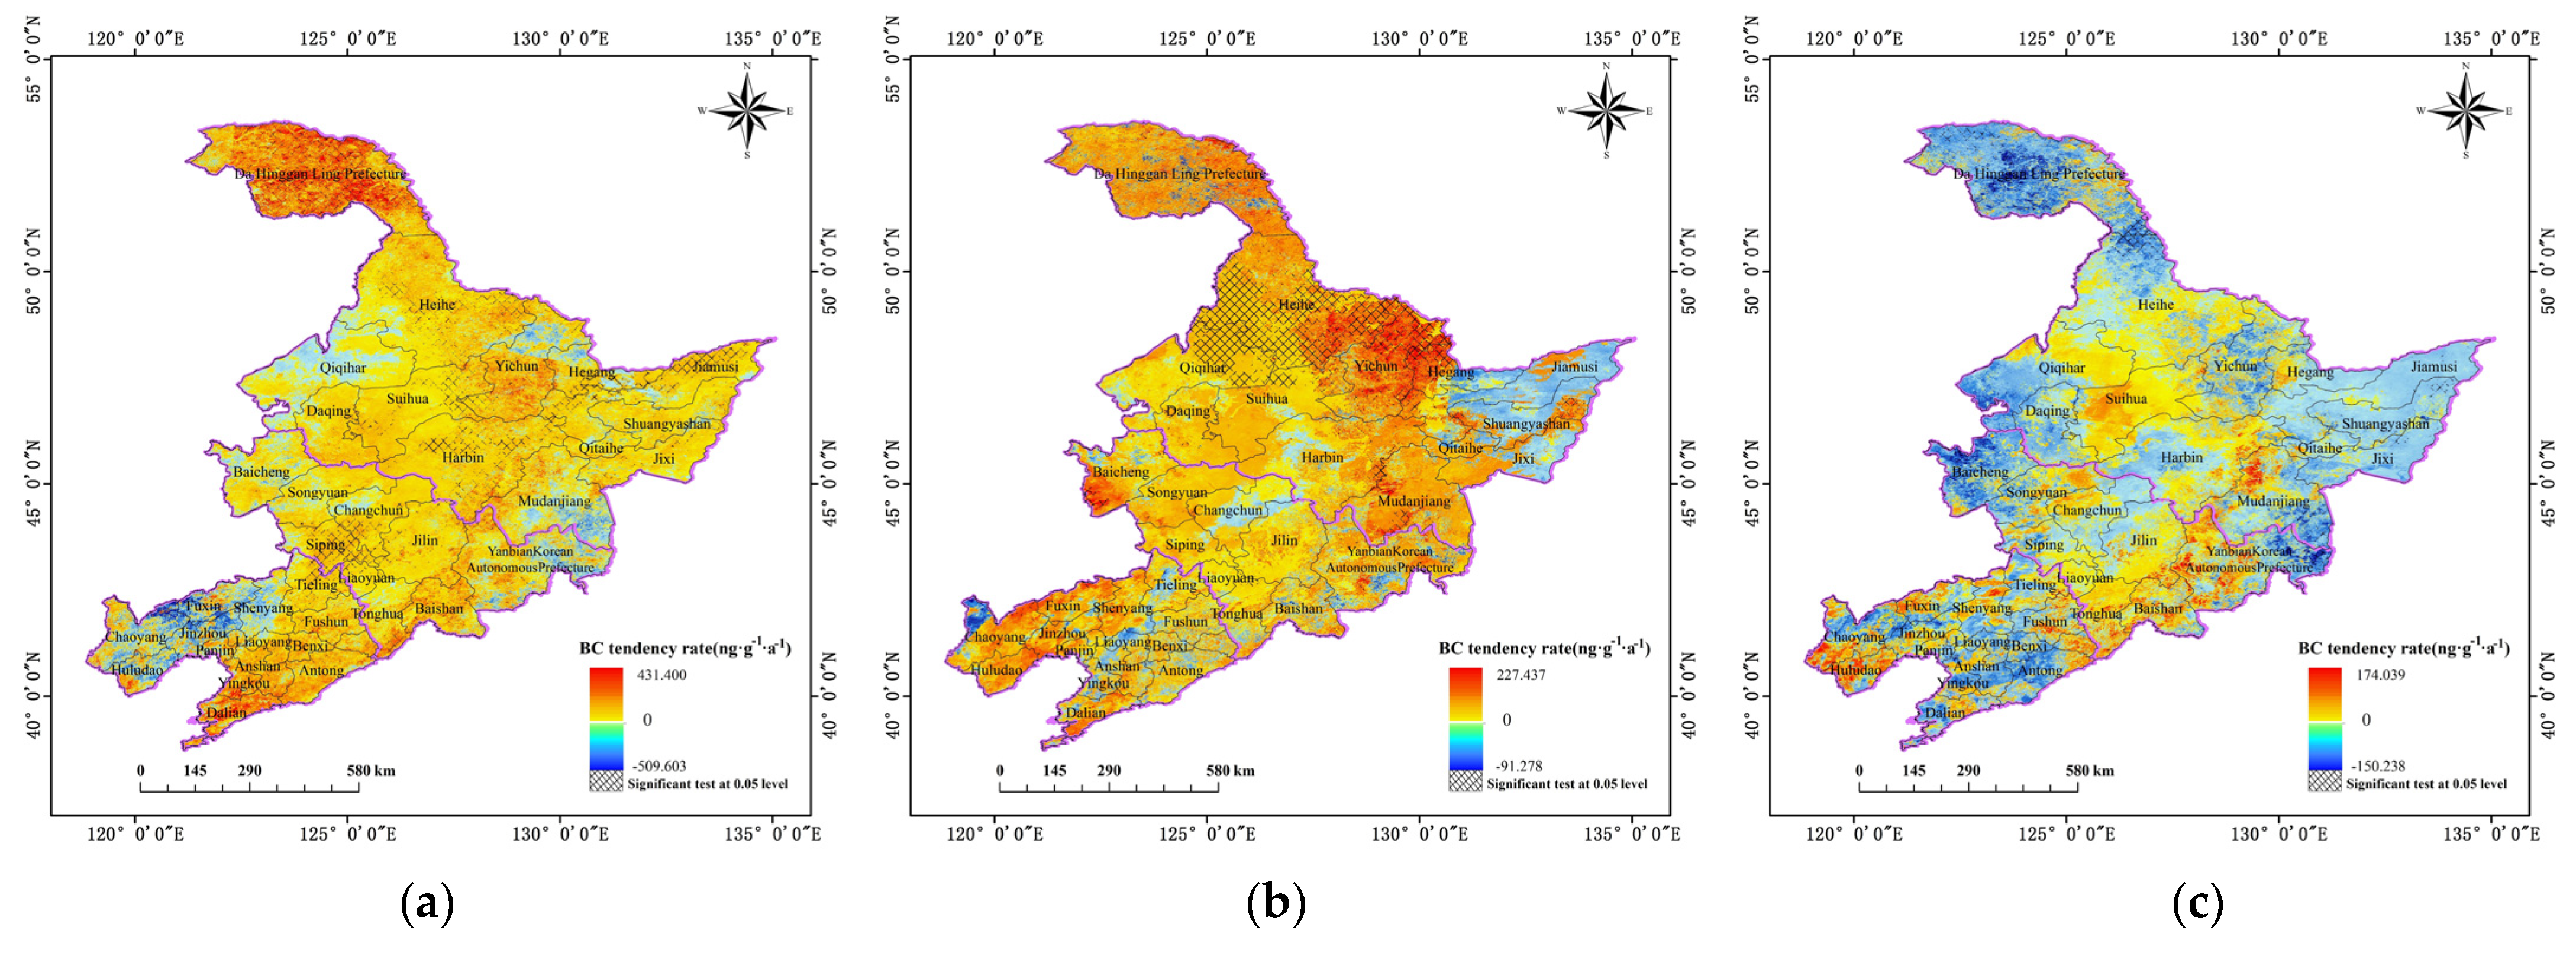
3.2.2. Spatial Distribution and Variation
3.3. Monthly Snow BC Concentration
3.3.1. Temporal Variation
3.3.2. Spatial Distribution and Variation
3.4. Influencing Factors
3.4.1. Terrain
3.4.2. Energy Consumption
3.4.3. Atmospheric Stability
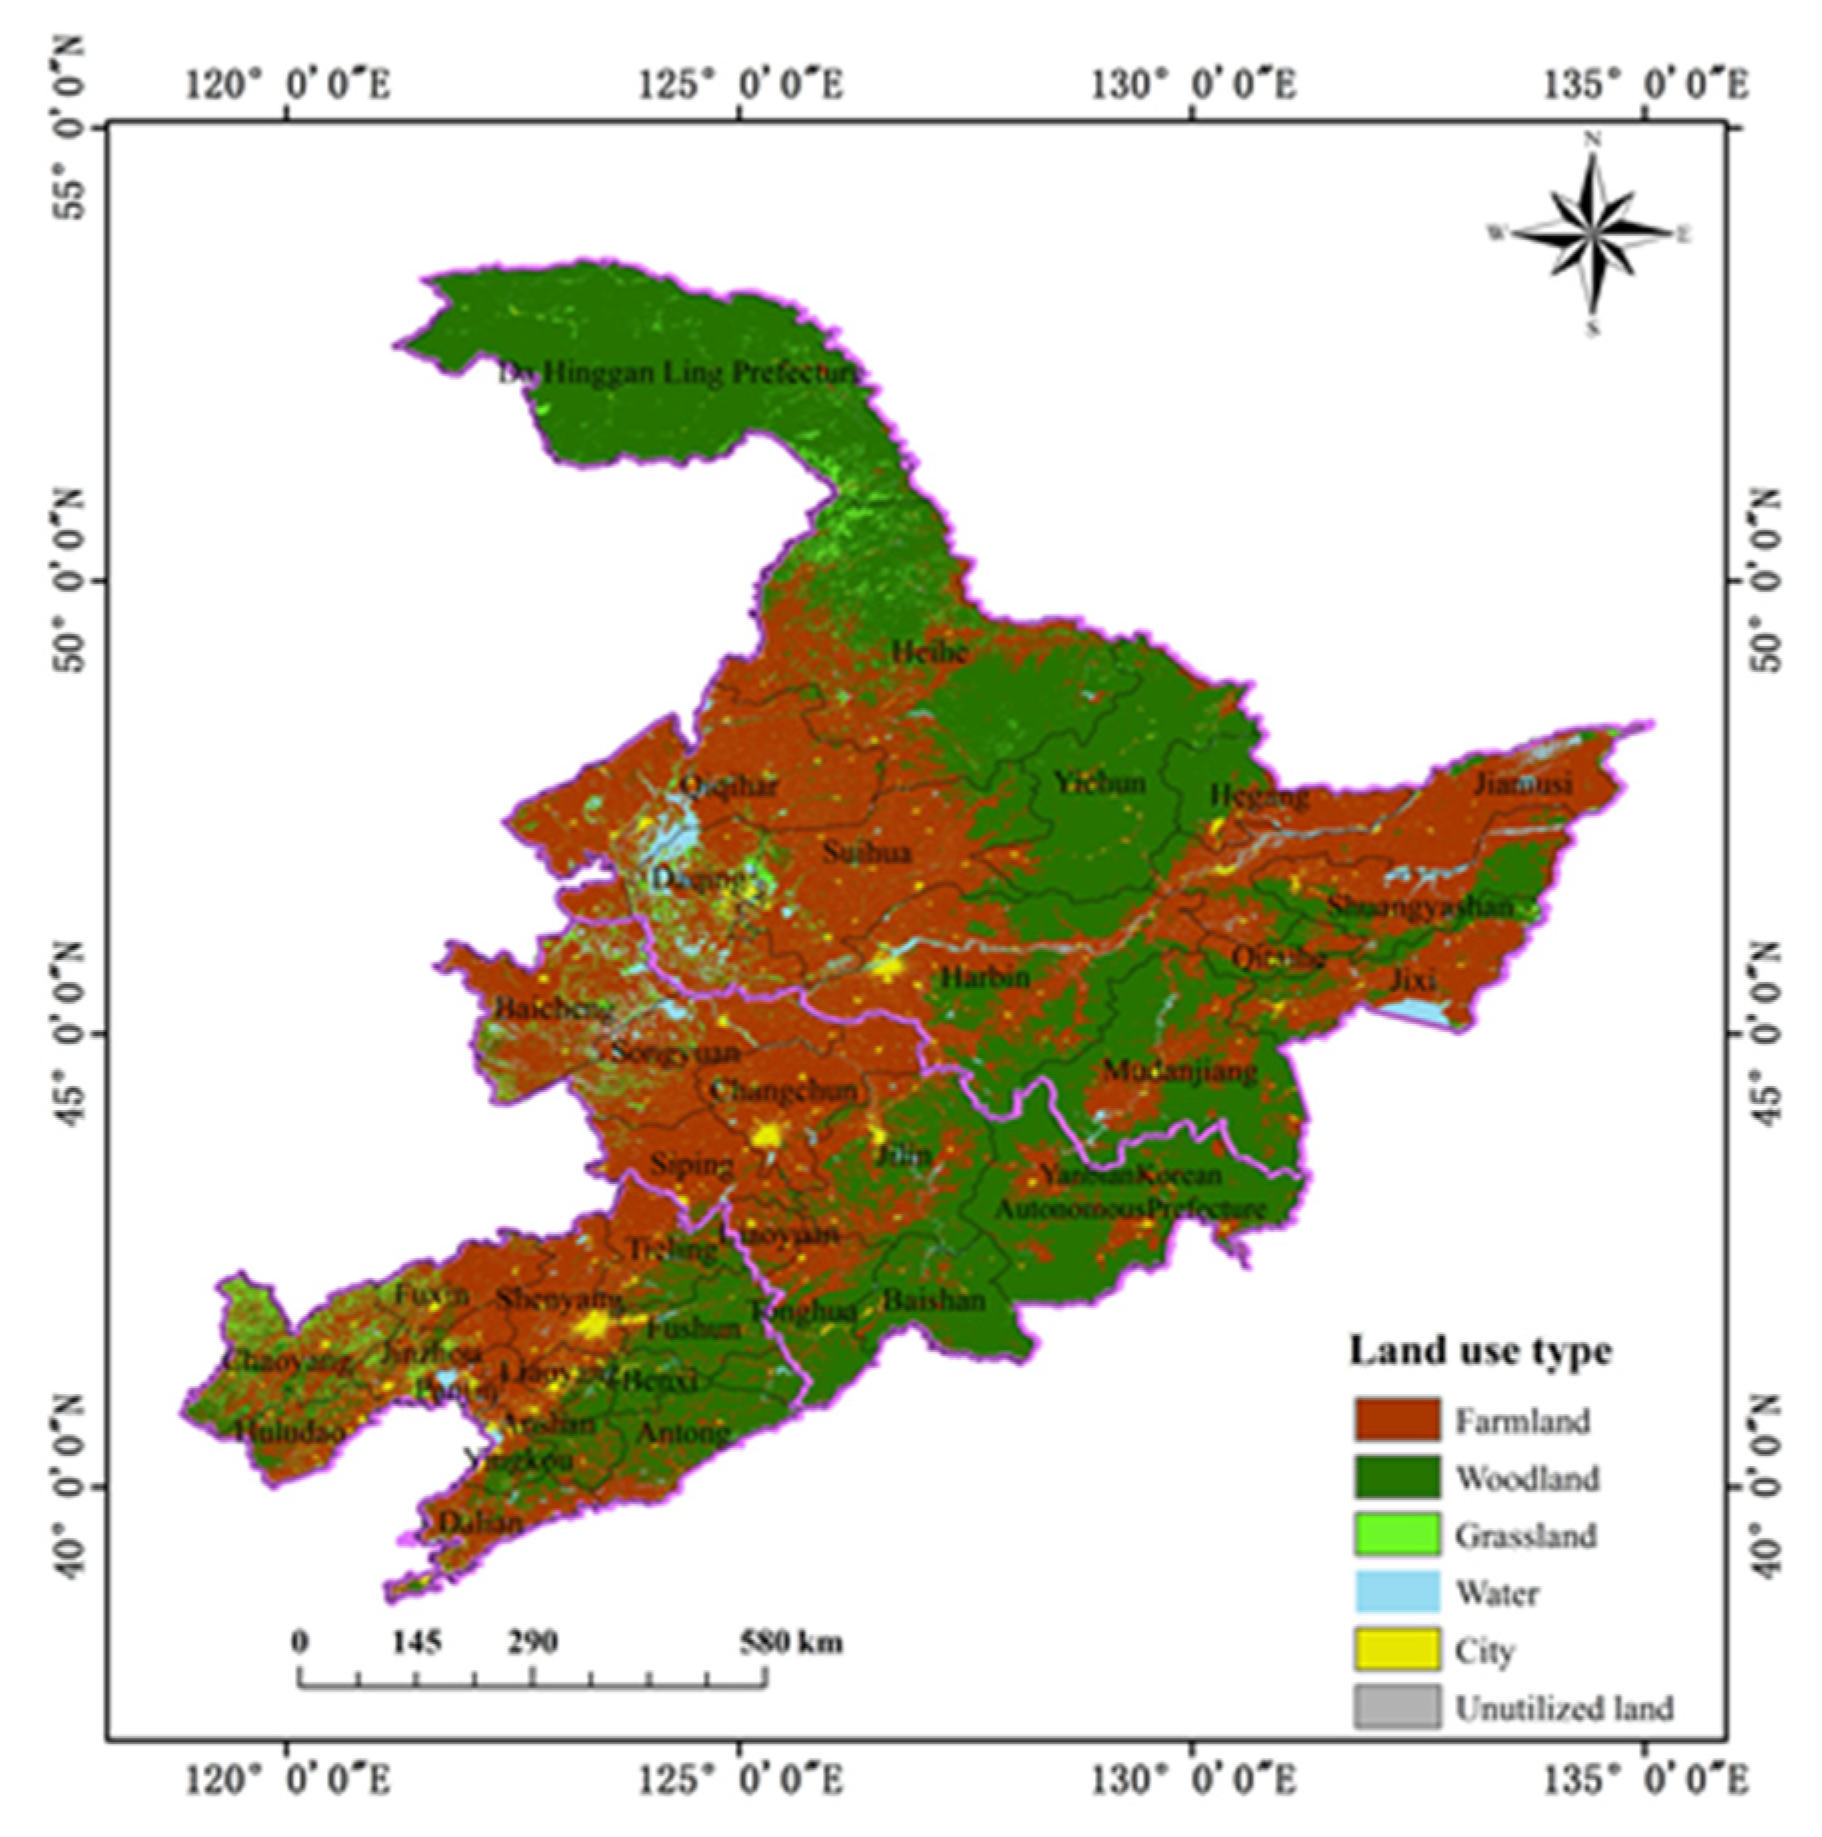
3.4.4. Land Use Type
4. Discussion
5. Conclusions
Author Contributions
Funding
Institutional Review Board Statement
Informed Consent Statement
Data Availability Statement
Acknowledgments
Conflicts of Interest
References
- Wang, X.; Zhang, Q.; Guo, N.; Cai, D.H. Method for Discrimination Snow in Qilian Mountain Region Based on MODIS Data. Arid Meteorol. 2007, 25, 29–34. (In Chinese) [Google Scholar]
- Lei, X.C.; Song, K.S.; Du, J.; Wu, Y.Q.; Wang, Y.D.; Tang, X.G.; Zeng, L.H. Analysis on the spectral reflectance response to snow contaminants in Northeast China. J. Grad. Sch. Acad. Sin. 2011, 28, 611–616. (In Chinese) [Google Scholar]
- Warren, S.G.; Wiscombe, W.J. A Model for the Spectral Albedo of Snow. II: Snow Containing Atmospheric Aerosols. J. Atmos. Sci. 1980, 37, 2734–2745. [Google Scholar] [CrossRef]
- Painter, T.H.; Barrett, A.P.; Landry, C.C.; Neff, J.C.; Cassidy, M.P.; Lawrence, C.R.; McBride, K.E.; Farmer, G.L. Impact of disturbed desert soils on duration of mountain snow cover. Geophys. Res. Lett. 2007, 34, 237–254. [Google Scholar] [CrossRef] [Green Version]
- Ming, J.; Xiao, C.D.; Qin, D.H.; Helene, C. Climate Forcing of Black Carbon in Snow and Ice. Adv. Clim. Chang. Res. 2006, 2, 238–241. [Google Scholar]
- Flanner, M.G.; Zender, C.S.; Hess, P.G.; Mahowald, N.M.; Painter, T.H.; Ramanathan, V.; Rasch, P.J. Springtime warming and reduced snow cover from carbonaceous. Atmos. Chem. Phys. 2009, 9, 2481–2497. [Google Scholar] [CrossRef] [Green Version]
- Flanner, M.G.; Zender, C.S.; Randerson, J.T.; Rasch, P.J. Present-day climate forcing and response from black carbon in snow. J. Geophys. Res. 2007, 112, D11202. [Google Scholar] [CrossRef] [Green Version]
- Jacobson, M.Z. Climate response of fossil fuel and biofuel soot, accounting for soot’s feedback to snow and sea ice albedo and emissivity. J. Geophys. Res. Atmos. 2004, 109, D21201. [Google Scholar] [CrossRef] [Green Version]
- Allen, S.K.; Plattner, G.-K.; Nauels, A.; Xia, Y.; Stocker, T.F. Climate Change 2013: The Physical Science Basis. An overview of the Working Group 1 contribution to the Fifth Assessment Report of the Intergovernmental Panel on Climate Change (IPCC). In Proceedings of the EGU General Assembly Conference Abstracts, Vienna, Austria, 27 April–1 May 2014. [Google Scholar]
- Bongaarts, J. Intergovernmental Panel on Climate Change Special Report on Global Warming of 1.5 °C Switzerland: IPCC, 2018. Popul. Dev. Rev. 2019, 45, 251–252. [Google Scholar] [CrossRef] [Green Version]
- Kim, S.J.; Choi, H.; Kim, B.; Park, S.; Shim, T.; Kim, J. Analysis of recent climate change over the Arctic using ERA-Interim reanalysis data. Chin. J. Polar Res. 2013, 24, 326–338. [Google Scholar]
- Screen, J.A.; Deser, C.; Simmonds, I. Local and remote controls on observed Arctic warming. Geophys. Res. Lett. 2012, 39, 10709. [Google Scholar] [CrossRef] [Green Version]
- Xu, W.; Li, Q.; Jones, P.; Wang, X.L.; Trewin, B.; Su, Y.; Chen, Z.; Zhai, P.; Wang, J.; Vincent, L. A new integrated and homogenized global monthly land surface air temperature dataset for the period since 1900. Clim. Dyn. 2017, 50, 2513–2536. [Google Scholar] [CrossRef]
- Concepts, R. Fourth Assessment Report: Climate Change, 2007 (AR4). PLoS ONE 2014, 6, e16126. [Google Scholar]
- Hua, W.; Chen, H.; Xing, L. Review of Land Use and Land Cover Change in China and Associated Climatic Effects. Adv. Earth Sci. 2014, 29, 1025–1036. [Google Scholar]
- Sung, J.H.; Eum, H.-I.; Park, J.; Cho, J. Assessment of Climate Change Impacts on Extreme Precipitation Events: Applications of CMIP5 Climate Projections Statistically Downscaled over South Korea. Adv. Meteorol. 2018, 2018, 1–12. [Google Scholar] [CrossRef] [Green Version]
- Forestieri, A.; Arnone, E.; Blenkinsop, S.; Candela, A.; Fowler, H.; Noto, L.V. The impact of climate change on extreme precipitation in Sicily, Italy. Hydrol. Process. 2018, 32, 332–348. [Google Scholar] [CrossRef] [Green Version]
- He, C.; Liou, K.N.; Takano, Y.; Ling, P.Y.; Qi, Y.; Chen, F. Impact of Grain Shape and Multiple Black Carbon Internal Mixing on Snow Albedo: Parameterization and Radiative Effect Analysis. J. Geophys. Res. Atmos. 2018, 123, 1253–1268. [Google Scholar] [CrossRef]
- Skiles, S.M.; Flanner, M.; Cook, J.M.; Dumont, M.; Painter, T.H. Radiative forcing by light-absorbing particles in snow. Nat. Clim. Chang. 2018, 8, 964–971. [Google Scholar] [CrossRef]
- Dou, T.F.; Xiao, C.D. An overview of black carbon deposition and its radiative forcing over the Arctic. Adv. Clim. Chang. Res. 2016, 7, 115–122. [Google Scholar] [CrossRef]
- Schmale, J.; Flanner, M.; Kang, S.; Sprenger, M.; Zhang, Q.; Guo, J.; Li, Y.; Schwikowski, S.; Farinotti, D. Modulation of snow reflectance and snowmelt from Central Asian glaciers by anthropogenic black carbon. Sci. Rep. 2017, 7, 40501. [Google Scholar] [CrossRef]
- Liu, C.M.; Dang, S.Z.; Wang, Z.G.; Wang, S.G. Research Progress of Black Carbon in Snow and Ice. South-North Water Transf. Water Sci. Technol. 2012, 10, 44–51. [Google Scholar]
- Liu, X.Q.; Wang, N.L.; Yao, T.D.; Xu, B.Q.; Zhao, H.B.; He, J.Q.; Guo, X.J. Carbonaceous aerosols in snow and ice in the Tibetan plateau. Earth Sci. Front. 2006, 13, 335–341. [Google Scholar]
- Clarke, A.D.; Noone, K.J. Soot in the Arctic snowpack: A cause for perturbations in radiative transfer. Atmos. Environ. 1985, 19, 2045–2053. [Google Scholar] [CrossRef]
- Doherty, S.J.; Warren, S.G.; Grenfell, T.C.; Clarke, A.D.; Brandt, R.E. Light-absorbing impurities in Arctic snow. Atmos. Chem. Phys. 2010, 10, 11647–11680. [Google Scholar] [CrossRef] [Green Version]
- Warren, S.G.; Clarke, A.D. Soot in the Atmosphere and Snow Surface of Antarctica. J. Geophys. Res. Atmos. 1990, 95, 1811–1816. [Google Scholar] [CrossRef]
- Aoki, T.; Kuchiki, K.; Niwano, M.; Kodama, Y.; Hosaka, M.; Tanaka, T. Physically based snow albedo model for calculating broadband albedos and the solar heating profile in snowpack for general circulation models. J. Geophys. Res. Atmos. 2011, 116, D11114. [Google Scholar] [CrossRef]
- Chylek, P.; Johnson, B.; Damiano, P.A.; Taylor, K.C.; Clement, P. Biomass burning record and black carbon in the GISP2 Ice Core. Geophys. Res. Lett. 1995, 22, 89–92. [Google Scholar] [CrossRef]
- Chylek, P.; Srivastava, V.; Cahenzli, L.; Pinnick, R.G.; Dod, R.L.; Novakov, T.; Cook, T.L.; Hinds, B.D. Aerosol and graphitic carbon content of snow. J. Geophys. Res. Atmos. 1987, 92, 9801. [Google Scholar] [CrossRef]
- Dasch, J.M.; Cadle, S.H. Atmospheric Carbon Particles in the Detroit Urban Area: Wintertime Sources and Sinks. Aerosol Sci. Technol. 1989, 10, 236–248. [Google Scholar] [CrossRef]
- Fily, M.; Bourdelles, B.; Dedieu, J.P.; Sergent, C. Comparison of in situ and Landsat Thematic Mapper derived snow grain characteristics in the alps. Remote Sens. Environ. 1997, 59, 452–460. [Google Scholar] [CrossRef]
- Kang, S.C.; Zhang, Y.L.; Qian, Y.; Wang, H.L. A review of black carbon in snow and ice and its impact on the cryosphere. Earth-Sci. Rev. 2020, 210, 103346. [Google Scholar] [CrossRef]
- Doherty, S.J.; Dang, C.; Hegg, D.A.; Zhang, R.D.; Warren, S.G. Black carbon and other light-absorbing particles in snow of central North America. J. Geophys. Res.-Atmos. 2014, 119, 12807–12831. [Google Scholar] [CrossRef]
- Forsström, S.; Ström, J.; Pedersen, C.A.; Isaksson, E.; Gerland, S. Elemental carbon distribution in Svalbard snow. J. Geophys. Res. 2009, 114, D19112. [Google Scholar] [CrossRef]
- Tang, X.G.; Liu, D.W.; Zhang, B.; Du, J.; Lei, X.C.; Zeng, L.H.; Wang, Y.D.; Song, K.S. Research on Hyperspectral Remote Sensing in Monitoring Snow Contamination Concentration. Spectrosc. Spectr. Anal. 2011, 31, 1318–1321. [Google Scholar]
- Flanner, M.G.; Liu, X.; Zhou, C.; Penner, J.E.; Jiao, C. Enhanced solar energy absorption by internally-mixed black carbon in snow grains. Atmos. Chem. Phys. 2012, 12, 4699–4721. [Google Scholar] [CrossRef] [Green Version]
- Namazi, M.; Salzen, K.V.; Cole, J.N.S. Simulation of black carbon in snow and its climate impact in the Canadian Global Climate Model. Atmos. Chem. Phys. 2015, 15, 18839–18882. [Google Scholar] [CrossRef] [Green Version]
- Huang, J.; Fu, Q.; Zhang, W.; Wang, X.; Zhang, R.; Ye, H.; Warren, S.G. Dust and Black Carbon in Seasonal Snow Across Northern China. Bull. Am. Meteorol. Soc. 2011, 92, 175–181. [Google Scholar] [CrossRef] [Green Version]
- Negi, H.S.; Kokhanovsky, A. Retrieval of snow albedo and grain size using reflectance measurements in Himalayan basin. J. Cryosphere 2011, 5, 203–217. [Google Scholar] [CrossRef] [Green Version]
- Negi, H.S.; Kokhanovsky, A. Retrieval of snow grain size and albedo of western Himalayan snow cover using satellite data. J. Cryosphere 2011, 5, 831–847. [Google Scholar] [CrossRef] [Green Version]
- Wei, Y.R. Remote Sensing Inversion and Spatiotemporal Variation of Black Carbon and Snow Grain Size in Typical Snow Regions of China Based on MODIS Data. Master Thesis, Lanzhou Jiaotong University, Lanzhou, China, June 2020. [Google Scholar]
- Pan, H.Z.; Wang, J.; Li, H.Y. Retrieval Snow Albebo Using MODIS based on the ART Model. J. Remote Sens. Technol. Appl. 2015, 30, 1059–1065. [Google Scholar] [CrossRef]
- Shi, Y.F. Glaciers and the Environment in China: Present, Past and Future, 1st ed.; Science Press: Beijing, China, 2000. [Google Scholar]
- Chen, G.Y.; Li, D.L. Temporal-Spatial characteristics of Cumulative Snow Depth in Northeast China and Its vicinity. Meteorol. Mon. 2011, 37, 513–521. [Google Scholar]
- Che, T.; Li, X. Spatial distribution and temporal variation of snow water resources in china during 1993–2002. J. Glaciol. Geocryol. 2005, 27, 64–67. [Google Scholar]
- Ogren, J.A.; Charlson, R.J.; Groblicki, P.J. Determination of elemental carbon in rainwater. Anal. Chem. 1983, 55, 1569–1572. [Google Scholar] [CrossRef]
- Grenfell, T.C.; Doherty, S.J.; Clarke, A.D.; Warren, S.G. Light absorption from particulate impurities in snow and ice determined by spectrophotometric analysis of filters. Appl. Opt. 2011, 50, 2037–2048. [Google Scholar] [CrossRef]
- Xin, W.; Doherty, S.J.; Huang, J. Black carbon and other light-absorbing impurities in snow across Northern China. J. Geophys. Res. Atmos. 2013, 118, 1471–1492. [Google Scholar]
- Hall, D.K.; Salomonson, V.V.; Riggs, G.A. Development of Methods for Mapping Global Snow Cover Using Moderate Resolution Imaging Spectroradiometer Data. Remote Sens. Environ. 1995, 54, 127–140. [Google Scholar] [CrossRef]
- Hall, D.K.; Riggs, G.A.; Salomonson, V.V.; DiGirolamo, N.E.; Bayr, K.J. MODIS snow-cover products. Remote Sens. Environ. 2002, 83, 181–194. [Google Scholar] [CrossRef] [Green Version]
- Li, Y.; Feng, X.Z.; Xiao, P.F.; Ye, N. Estimating per-pixel snow cover fraction from MODIS in typical area of Bayanbulak. J. Nanjing Univ. 2015, 51, 1022–1029. [Google Scholar]
- Shao, D.H.; Li, H.Y.; Wang, J.; Hao, X.H.; Wang, R.K.; Ma, Y. Retrieval of Snow Albedo based on Multi-source Remote Sensing Data. Remote Sens. Technol. Applic. 2017, 32, 71–77. [Google Scholar]
- Hao, X.H.; Wang, J.; Li, H.Y. Evaluation of the NDSI Threshold Value in Mapping Snow Cover of MODIS—A Case Study of Snow in the Middle Qilian Mountains. J. Glac. Geocryol. 2008, 30, 132–138. [Google Scholar]
- Kokhanovsky, A.A.; Aoki, T.; Hachikubo, A.; Hori, M.; Zege, E.P. Reflective properties of natural snow: Approximate asymptotic theory versus in situ measurements. IEEE Trans. Geosci. Remote Sens. 2005, 43, 1529–1535. [Google Scholar] [CrossRef]
- Kokhanovsky, A.A.; Zege, E.P. Scattering optics of snow. Appl. Opt. 2004, 43, 1589–1602. [Google Scholar] [CrossRef] [PubMed]
- Kokhanovsky, A.; Rozanov, V.V.; Aoki, T.; Odermatt, D.; Brockmann, C.; Krüger, O.; Bouvet, M.; Drusch, M.; Hori, M. Sizing snow grains using backscattered solar light. Int. J. Remote Sens. 2011, 32, 6975–7008. [Google Scholar] [CrossRef]
- Kokhanovsky, A.; Schreier, M. The determination of snow specific surface area, albedo and effective grain size using AATSR space-borne measurement. Int, J Remote. Sens. 2009, 30, 919–933. [Google Scholar] [CrossRef]
- Zhao, C.; Hu, Z.; Qian, Y.; Ruby Leung, L.; Huang, J.; Huang, M.; Jin, J.; Flanner, M.G.; Zhang, R.; Wang, H.; et al. Simulating black carbon and dust and their radiative forcing in seasonal snow: A case study over North China with field campaign measurements. Atmos. Chem. Phys. 2014, 14, 11475–11491. [Google Scholar] [CrossRef] [Green Version]
- Lv, X.; Xu, J.H.; Deng, K. Analysis of Temporal-Spatio Distribution of Annual Aerosol Optical Depth of Anhui Province. Environ. Sci. Technol. 2017, 40, 209–216. [Google Scholar]
- Zhang, J.; Yuan, X.D.; Lin, H. The Extraction of Urban Built-up Areas by Integrating Night-time Light and POI Data—A Case Study of Kunming, China. IEEE Access 2021, 9, 22417–22429. [Google Scholar]
- Li, J.F.; Pan, J.H. Spatial expansion of cities at county-level or above in Gansu Province from 1992 to 2012 based on DMSP nighttime light images. J. Glaciol. Geocryol. 2016, 38, 829–835. [Google Scholar]
- Bi, X.Y.; Liu, F.; Chen, H.; Wu, D.; Deng, X.J.; Huang, J. Vertical Distribution Features of Atmospheric Stability over Beijing Area. J. Trop. Meteorol. 2003, 19, 173–179. [Google Scholar]
- Grenfell, T.C.; Light, B.; Sturm, M. Spatial distribution and radiative effects of soot in the snow and sea ice during the SHEBA experiment. J. Geophys. Res. Ocean. 2002, 107, SHE 7-1–SHE 7-7. [Google Scholar] [CrossRef] [Green Version]
- Grenfell, T.C.; Warren, S.G.; Radionov, V.F.; Makarov, V.N.; Zimov, S.A. Expeditions to the Russian Arctic to Survey Black Carbon in Snow. Eos. Trans. Am. Geophys. Union 2013, 90, 386–387. [Google Scholar] [CrossRef] [Green Version]
- McConnell, J.R.; Edwards, R.; Kok, G.L.; Flanner, M.G.; Zender, C.S.; Saltzman, E.S.; Banta, J.R.; Pasteris, D.R.; Carter, M.M.; Kahl, J.D.W. 20th-Century Industrial Black Carbon Emissions Altered Arctic Climate Forcing. Science 2007, 317, 1381–1384. [Google Scholar] [CrossRef] [PubMed] [Green Version]
- Kaspari, S.; McKenzie Skiles, S.; Delaney, I.; Dixon, D.; Painter, T.H. Accelerated glacier melt on Snow Dome, Mount Olympus, Washington, USA, due to deposition of black carbon and mineral dust from wildfire. J. Geophys. Res. Atmos. 2015, 120, 2793–2807. [Google Scholar] [CrossRef] [Green Version]
- Ming, J.; Xiao, C.D.; Du, Z.C.; Flanner, M. Black Carbon in Snow/Ice of West China and Its Radiative Forcing. Adv. Clim. Chang. Res. 2009, 5, 328–335. [Google Scholar]
- Wang, M.; Xu, B.Q.; Wu, G.J.; Yang, W. Carbonaceous Aerosols Recorded in Ice Core in Southeastern Tibetan Plateau. Adv. Clim. Chang. Res. 2010, 6, 175–180. [Google Scholar]
- Xin, W.; Wei, P.; Yong, R.; Zhang, X.; Zhang, X.; Shi, J.; Jin, H.; Dai, M.; Chen, Q. Observations and model simulations of snow albedo reduction in seasonal snow due to insoluble light-Absorbing particles during 2014 Chinese survey. Atmos. Chem. Phys. 2017, 17, 2279–2296. [Google Scholar]


| Parameter | Physical Meaning | Unit/Value |
|---|---|---|
| R1 | Surface reflectance of band 3 in MODIS dataset | |
| R2 | Surface reflectance of band 2 in MODIS dataset | |
| R0 | Reflection function of the semi-infinite snow layer | |
| f(μ, μ0, ϕ) | Determined by escape function and semi-infinite space sno layer reflectivity function | |
| g | Asymmetry parameter | 0.76 |
| B | Constant | 0.84 |
| αs,i | Absorption coefficient of BC | |
| c | Relative BC concentration | ng/g |
| αef | Snow grain size | mm |
| αi,2 | Absorption coefficient of ice | |
| β | Probability of photon absorption | 0.47 |
| K | Constant | 2.63 |
| Solar zenith angle | degree | |
| Viewing zenith angle | degree | |
| Relative azimuth angle | degree |
| Parameter | Mean | Value | Parameter | Mean | Value |
|---|---|---|---|---|---|
| A | constant | 1.247 | μ | The cosine of viewing zenith angle | [-] |
| B | constant | 1.186 | μ0 | The cosine of solar zenith angle | [-] |
| C | constant | 5.157 | P(θ) | The phase function | [-] |
| BC Concentration (ng/g) | Reduced Albedo (%) | |
|---|---|---|
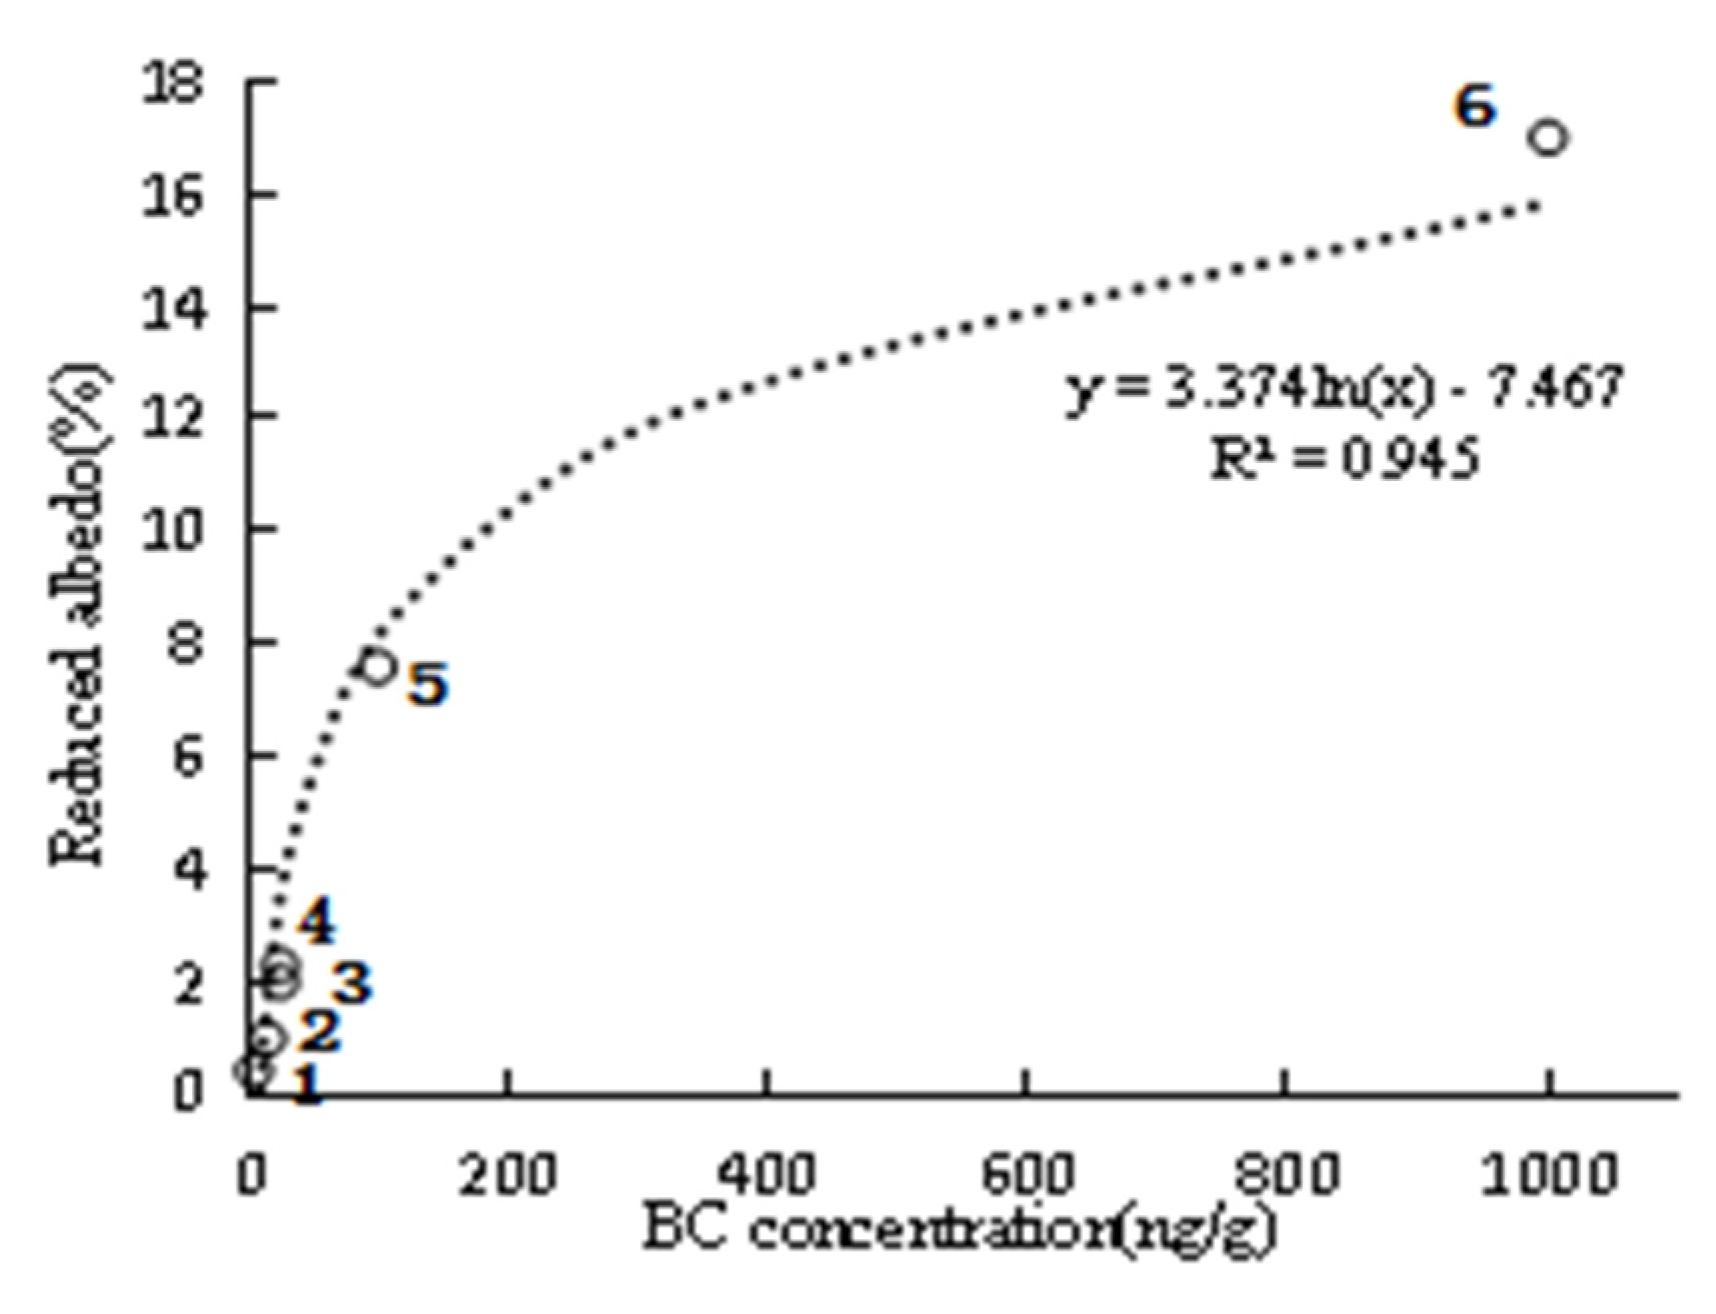
| Annual-mean value | 1197.468 | 16.448 |
| Heilongjiang Province | 1103.617 | 16.172 |
| Jilin Province | 962.440 | 15.711 |
| Liaoning Province | 788.96 | 15.040 |
| Harbin City | 1051.787 | 16.010 |
| Changchun City | 1093.404 | 16.141 |
| Shenyang City | 864.628 | 15.349 |
Publisher’s Note: MDPI stays neutral with regard to jurisdictional claims in published maps and institutional affiliations. |
© 2022 by the authors. Licensee MDPI, Basel, Switzerland. This article is an open access article distributed under the terms and conditions of the Creative Commons Attribution (CC BY) license (https://creativecommons.org/licenses/by/4.0/).
Share and Cite
Zheng, Y.; Zhang, L.; Li, W.; Zhang, F.; Zhong, X. Spatial-Temporal Variation of Snow Black Carbon Concentration in Snow Cover in Northeast China from 2001 to 2016 Based on Remote Sensing. Sustainability 2022, 14, 959. https://doi.org/10.3390/su14020959
Zheng Y, Zhang L, Li W, Zhang F, Zhong X. Spatial-Temporal Variation of Snow Black Carbon Concentration in Snow Cover in Northeast China from 2001 to 2016 Based on Remote Sensing. Sustainability. 2022; 14(2):959. https://doi.org/10.3390/su14020959
Chicago/Turabian StyleZheng, Yanjiao, Lijuan Zhang, Wenliang Li, Fan Zhang, and Xinyue Zhong. 2022. "Spatial-Temporal Variation of Snow Black Carbon Concentration in Snow Cover in Northeast China from 2001 to 2016 Based on Remote Sensing" Sustainability 14, no. 2: 959. https://doi.org/10.3390/su14020959