
Changes in Physicochemical Properties of Typical Subtropical Soils under Different Treated Domestic Wastewater Irrigation Modes

College of Water Resources and Civil Engineering, Hunan Agricultural University, Changsha 410128, China
*
Author to whom correspondence should be addressed.
Sustainability 2022, 14(16), 10197; https://doi.org/10.3390/su141610197
Submission received: 12 July 2022
/
Revised: 9 August 2022
/
Accepted: 11 August 2022
/
Published: 17 August 2022
(This article belongs to the Special Issue Application of Environmental Material in Wastewater Treatment and Pollution Remediation)
Abstract
:Irrigation with treated domestic wastewater (TWW) affects the physicochemical properties of soils, but little research has been conducted for different soils in subtropical regions. Consequently, in order to evaluate the effects of domestic wastewater (treated by A2/O process) irrigation on the hydraulic properties, soil salinity and sodicity of four typical subtropical agricultural soils, a soil-column experiment was conducted for one year with eight cycles of wetting and drying. A clay soil (red soil), a silty clay soil (aquic soil), a loamy clay soil (purple soil), and a silty clay loam soil (paddy soil) were subjected to three irrigation modes: (a) cyclic irrigation with TWW (W1), (b) alternating irrigations with TWW and distilled water (W2), and (c) irrigation with distilled water as a control (CK). Our results indicated that EC values increased significantly (p < 0.05) with TWW irrigation for all the soils. TWW irrigation increased the concentrations of Na+, K+, Ca2+, Mg2+, and SAR, ESP values in the red soil, for the W2 treatment especially. In contrast, it decreased Na+, K+, Ca2+, Mg2+ accumulation and ESP values in the aquic soil. Moreover, the soil physical properties exhibited correlations with soil salinity. The saturated hydraulic conductivity (Ks) of the red soil, purple soil, and paddy soil were lower under the W1 and W2 treatments than CK, but the Ks of the aquic soil for W1 were 183.7% higher than that under CK. The unsaturated hydraulic conductivity (Kψ) of the purple soil and paddy soil decreased after TWW irrigation, but those of the aquic soil increased. The water-retention capacities (WRCs) of the TWW-irrigated red soil and aquic soil decreased as a consequence of a shift in the pore-size distribution toward wider pores, but the those of the purple soil and paddy soil improved, associated with narrower pores. The W2 treatment alleviated the impact of TWW on the aquic soil, purple soil, and paddy soil but negatively affected the physical properties, salinity, and sodicity of the red soil. Our results will provide useful information for managing soil and water under TWW irrigation in subtropical regions.
1. Introduction
Water shortages during the last few decades have affected billions of people globally, posing serious problems for food security and future environmental sustainability in many parts of the world [1]. About 70% of the water used worldwide is for irrigation [2]. In response to the increasing problem of water shortages, the use of treated wastewater is considered the most suitable and reliable alternative for agricultural water management, which also has the advantage of reducing the point source pollution caused by wastewater discharge. However, wastewater sources are complex, including domestic sewage, some industrial wastewater, and rainwater, resulting in treated wastewater containing high levels of suspended solids, salts, and other materials. The researchers found that high-salinity wastewater irrigation led to soil salinization and damaged soil [3,4,5], such as its hydraulic properties and structure [6,7]. Compared with high-salinity-treated wastewater, domestic wastewater in densely populated areas, such as universities and communities, have the characteristics of a single and stable source, good biodegradability, and a low salinity content. Because of the low treatment cost, treated domestic wastewater (TWW) has great potential for reuse.
Due to the differences in salinity and salt ion concentrations in treated wastewater, previous studies could not reach a consensus on the effects of wastewater irrigation on the soil hydraulic properties. The saturated hydraulic conductivity (Ks) of soil improved with the increase in salt concentration in irrigation water [8]. However, Tang et al. [9] reported that low salinity in irrigation water can promote the formation of soil aggregates and enhance hydraulic conductivity. Marchuk [10] reported that K+ in irrigation water can cause the dispersion of clay, whereas when the concentration of Na+ in soil is high, the Na+ leaching caused by the K+ replacing the exchange site and the soil hydraulic conductivity are improved.
Because of the different properties of soils, such as salt ion migration characteristics and clay content, the soil salinity, sodicity, and Dispersion Index under treated wastewater irrigation can differ greatly [11]. The high clay and CaCO3 contents in a calcareous clayey soil limited the deeper movement of Na+ ions [12]. The dissolution of CaCO3 in the calcareous, clayey soil during treated wastewater irrigation leads to the increase in Ca2+ ions in soil solution, which compete with Na+ for exchangeable sites, thus limiting the SAR increase in the soil [13,14]. Moreover, soil salinity and sodicity can affect soil hydraulic properties by changing the pore size distribution, in the form of clay dispersion and flocculation [15].
The rain events occur during TWW irrigation is sufficient to remove some substances that affect the physical properties of soils, such as salts [16]. The ESP increased after TWW irrigation, resulting in the dispersion of soil clay, while Na+ in the soil was leached with the rainfall, the soil structure gradually restored [17]. However, some studies have shown that improving water quality (rainwater) during the process of TWW irrigation has a negative impact on soil hydraulic properties, which is due to the dilution of ion concentration in soil solution and the enhancement of soil swelling and dispersion, thus reducing soil hydraulic conductivity [18]. Wang et al. [19] found that cyclic irrigation with TWW can improve the available water of clay soil (soil water content when soil water suction is 33~1500 kPa), whereas alternative irrigation with TWW and distilled water decreased the available water.
Progress has been made, but most previous studies about the effects of TWW irrigation on soil hydraulic properties were conducted in arid and semi-arid regions, but little research has been conducted for humid regions [20]. Subtropical areas are suitable for plant growth due to the good conditions of light and heat, but dry summers and highly variable rainfall may threaten crop production [21]. The use of TWW can satisfy the water requirements of crops in climatically variable subtropical environments. The hydraulic characteristics are the critical aspects for evaluating the effect of irrigation on wastewater [22], and understanding variations in indices such as hydraulic conductivity, which are vital for establishing rational irrigation schedules, irrigation management, and restoring soil resources after irrigation with wastewater [23,24]. However, the effects of low-salinity TWW irrigation on the hydraulic properties of typical subtropical soils are still unclear.
The objective of this study was to identify changes in the physicochemical properties of four typical agricultural soils under different TWW irrigation modes. The irrigation wastewater was campus domestic wastewater treated by the Anoxic/anaerobic/oxic (A2/O) process, and a clay soil (red soil), a silty clay soil (aquic soil), a loamy clay soil (purple soil), and a silty clay loam soil (paddy soil) were selected because of their clay contents and EC values gradient. The soils were cyclically irrigated with TWW (W1), alternating irrigation with TWW and distilled water (W2, applying distilled water after each irrigation with TWW), and cyclically irrigated with distilled water (CK) in a controlled environment. In addition, we postulated that the W2 treatment could mitigate the impact of TWW on the soil’s hydraulic and chemical properties.
2. Materials and Methods
2.1. Experimental Site and Soil Preparation
The experimental site has a typical subtropical humid monsoon climate, with an average temperature range of 16–18.5 °C, and an annual rainfall of 1369.7 mm, with long wet periods of 6–9 months accounting for more than 70% of the total annual rainfall. Four typical subtropical soils, a clay soil (red soil, 28°11′47″ N, 113°7′32″ E), a silty clay soil (aquic soil, 29°03′22″ N, 113°00′46″ E), a loamy clay soil (purple soil, 28°16′52″ N, 113°19′36″ E), and a silty clay loam soil (paddy soil, 28°18′44″ N, 113°16′44″ E) were selected for filling the soil columns. They were collected from the arable layer (within the 0~40 cm layer) in the cultivated fields of Hunan Province of China, where the soil-column experiment was also conducted (Figure 1). The bulk densities of the four soils were between 1.17–1.35 g/cm3, and other physical and chemical properties of the soils before the experiment are presented in Table 1. The soil particle compositions were determined by the hydrometer method. The pH and electrical conductivity (EC) (1:5 soil: water extracts) were measured using a Mettler-Toledo Seven Excellence™ multi-parameter tester (S470-B, Toledo International Inc., Greifensee, Zurich, Switzerland). Na+, Ca2+, K+, and Mg2+ concentrations were measured using an ICP-AES spectrophotometer (TAS-990, Pgeneral, Beijing, China). The cation exchange capacity (CEC) was determined by saturating the soil with 1 M CH3COONH4, buffering at pH 5.2. Organic matter (OM) was measured using the potassium dichromate sulfuric acid oxidation external heating method.
2.2. Analysis of the Treated Domestic Wastewater
The TWW was treated by the Anoxic/anaerobic/oxic (A2/O) process and collected from wastewater outlets around Hunan Agricultural University, which accorded with the Chinese national integrated wastewater discharge standard (GB8978-1996) and the water quality of reclaimed urban wastewater for farmland irrigation (GB200922-2007). The TWW was sampled for each irrigation for the analysis of pH, electrical conductivity (EC), Na+, Ca2+, K+, and Mg2+ concentrations, total suspended solids (TSS), and chemical oxygen demand (COD) (Table 2). TSS was determined by drying method, COD was measured by potassium dichromate method, and the test methods of other parameters are shown in Section 2.1. The sodium adsorption ratio (SAR) of the TWW was calculated as:
According to the classification of wastewater quality published by the US Salinity Laboratory (Riverside, CA, USA) [25], the TWW has low salinity and low sodium water (EC < 250 µs/cm and SAR < 10).

Table 2.
Quality of the treated domestic wastewater (mean ± standard deviation).
| pH | EC (µS·cm−1) | Na+ (mg·L−1) | Ca2+ (mg·L−1) | K+ (mg·L−1) | Mg2+ (mg·L−1) | SAR (mg·L−0.5) | TSS (mg·L−1) | COD (mg·L−1) |
|---|---|---|---|---|---|---|---|---|
| 7.02 ± 0.23 | 204.24 ± 32.31 | 5.09 ± 2.18 | 9.12 ± 3.90 | 3.23 ± 1.85 | 2.3 ± 1.28 | 2.09 ± 1.67 | 7.07 ± 2.67 | 125.56 ± 30.42 |
2.3. Soil-Column Experiment
The experimental design consisted of four soil types and three irrigation modes with three replicates, for a total of 36 soil columns. The soils were processed by air-drying, crushing, and passing through a sieve (5 mm) and were then added to plastic columns (26 cm in diameter). Holes were drilled at the bottom of the columns to allow airflow and drainage. A gauze and a layer of quartz sand (20–40 mesh) 5 cm thick were taped to the base of each column to support the soil. The columns were prepared by adding soil in increments of 5 cm, and an additional 2 cm was added to enable the soil to settle using distilled water. The soil was 17 cm deep, and the bulk density was 1.2 g/cm3. Tensiometers were installed to a depth of 10 cm in three randomly selected columns (Figure 2).
The three irrigation modes were: (1) cyclic irrigation with TWW (W1, TWW was used for each irrigation), (2) alternating irrigations with TWW and distilled water (W2, TWW used at the first irrigation, and distilled water used at the next irrigation), and (3) cyclic irrigation with distilled water (CK) as a control. Each column was flooded with 6 L of water each time to saturate the soil and ensure that there was about a 5 cm water layer above the soil column to measure the infiltration rate (IR). The holes at the bottom of the columns were blocked during irrigation, so the water was in full contact with the soils. The holes were unblocked after 24 h of irrigation to allow the water to infiltrate and drain, and IR was determined by measuring the time needed for 2 cm of water to infiltrate. All columns were placed in an open-air area for drying, and mulch was placed on the columns during rain to prevent splashing. The columns were irrigated again when the soil-water suction reached 80 kPa (soil moisture content is about 60% of the field capacity). The experiment was terminated when the IRs of the last three times were relatively stable. This experiment lasted for around one year with eight cycles of wetting and drying.
2.4. Analysis and Calculation of Soil Properties
Undisturbed soil samples were excavated from the surface (0~5 cm) of soil columns using stainless-steel rings (5 cm tall and 5 cm in diameter), and the remaining surface soil was used to determine the EC and exchangeable cations. The undisturbed soil samples were placed in distilled water for 24 h to be saturated for determining the saturated hydraulic conductivity (Ks) and soil-water characteristic curves (SWCCs). Ks was measured using the constant-head method [26] and calculated through the Darcy’s equation:
where Q is the flow through the pores, L is the sample length, A is the cross-sectional area of the sample, and ΔP is the change in hydrostatic pressure.
The SWCCs were determined using a pressure plate apparatus (WD 58-1500F1, SM Company, Tucson, AZ, USA). Soil-water contents were recorded during the process of achieving a constant sample mass, and this process was repeated when the soil suction was 33, 80, 280, 500, 1000, and 1500 kPa.
The pore-size distribution was inferred from the SWCCs, drainable water in the macropores (>0.02 mm) was drained between 0 and 33 kPa, available water in the effective pores (0.0002–0.02 mm) was drained between 33 and 1500 kPa, and residual water in the micropores (<0.0002 mm) was retained at 1500 kPa [27].
Unsaturated hydraulic conductivity (Kψ) was calculated using the van Genuchten model [28] and the Mualem relative permeability model [29]. In order to compare Kψ under TWW irrigation and distilled water irrigation, relative Kψ (K/Ki) was calculated as the ratio of Kψ of the samples irrigated by TWW (K) divided by Kψ for CK (Ki) at the same water content.
2.5. Soil-Water Characteristic Curve Model
The SWCCs were fitted to the empirical model of van Genuchten [30] using RETC software (Van Genuchten, Version 6.0. US Salinity laboratory, Riverside, CA, USA):
where θ(h) is the volumetric water content (cm3/cm3), θr is the residual volumetric water content (cm3/cm3), θs is the saturated volumetric water content (cm3/cm3), h is the soil suction (cm), and α, m, and n are fitting parameters, where m = 1 − (1/n).
2.6. Statistical Analysis
Basic calculations were performed using Microsoft Excel, and statistical tests were conducted using Statistical Program for Social Sciences (SPSS) 21. The statistical significances of Ks and the chemical properties after TWW irrigation were independently determined using a one-way Analysis of Variance (ANOVA). Two-way ANOVA was applied to test the effect of the interaction between soil type and irrigation mode on the soil’s physical properties. The datasets consist of the results in three replicate soil columns for each treatment (W1, W2, and CK).
3. Results
3.1. Soil Hydraulic Properties
3.1.1. Saturated Hydraulic Conductivity
The Ks of the red soil, purple soil, and paddy soil were significantly (p = 0.008, p = 0.042, p = 0.034, respectively) decreased after TWW irrigation (Figure 3). The Ks of the red soil under the W1 and W2 treatments were less than that under CK, being 2.111 cm/min, 2.432 cm/min compared with 3.309 cm/min. The Ks of the purple soil and the paddy soil followed a similar pattern, being 0.275 cm/min, 0.292 cm/min, and 0.328 cm/min under the W1, W2, and CK treatments, respectively, and those of the paddy soil were 0.258 cm/min, 0.273 cm/min, and 0.355 cm/min, respectively. This result indicates an adverse effect of TWW on the Ks of soils, which is consistent with the experimental results of Bourazanis et al. and Schacht et al. [30,31]. However, the Ks of the aquic soil under the W1 and W2 treatment were 183.67% more and 24.11% less than that under CK.
3.1.2. Relative Unsaturated Hydraulic Conductivity
K/Ki were generally >1 for the aquic soil and <1 for the paddy soil (Figure 4), i.e., the Kψ of the aquic soil increased and that for the paddy soil decreased after TWW irrigation. The Kψ of the red soil, however, varied with the water content. For the purple soil, K/Ki was generally <1 under the W1 and W2 treatments when the water content was <0.4 cm3/cm3, and the saturated water content of the purple soil was 0.42 cm3/cm3. Therefore, in general, TWW irrigation reduces the Kψ of the purple soil. K/Ki of the aquic soil, purple soil, and paddy soil under the W2 treatment were closer to 1 than those under the W1 treatment, indicating that the W2 treatment had less effect on the Kψ of these soils.
3.2. Soil-Water Characteristic Curves
SWCCs contain information for water content in the pores at any level of suction. The water contents of the red soil and aquic soil were lower for the W1 and W2 treatments than CK at the same matric suction (Figure 5), indicating that the W1 and W2 treatments negatively affected the water-retention capacity (WRC). This is consistent with the experimental result of Assouline et al. [32]. WRCs generally tended to be higher for the W1 treatment than the W2 treatment for the red soil, whereas the change of WRCs of the aquic soil showed an opposite trend. Different to the red soil and aquic soil, the TWW irrigation positively affected the WRC of the purple soil and paddy soil. The improvement of soil’s WRC after wastewater irrigation was also found by Tunc et al. [33]. Compared with the CK treatment, the WRC of the purple soil under the W1 treatment increased more than that under the W2 treatment, whereas WRCs of the paddy soil differed by little between the two TWW irrigation modes. The differences of SWCCs under different soil types and irrigation modes are related to the accumulation of salt ions in soil and the impact on soil particles after TWW irrigation. The experimental SWCC data for all soils were fitted using the van Genuchten model [28] and RETC optimization software, with good results (R2 > 0.99) (Table 3).
3.3. Pore-Size Distribution
The pore-size distribution of the red soil and aquic soil shifted toward wider pores with DWW irrigation. Compared with the CK treatment, the microporosities of the red soil and aquic soil decreased and the macroporosities increased under the W1 and W2 treatments (Figure 6). The microporosities of the red soil under the W1 and W2 treatments were 3.98% and 11.28% less than CK, respectively. The proportions of effective pores in the red soil were 0.3% higher and 4.81% lower, and the macroporosities were 3.68% and 16.09% higher under the W1 and W2 treatments than CK, respectively. The microporosities of the aquic soil were 2.77% and 0.26% lower for the W1 and W2 treatments than CK, respectively. The proportions of effective pores of the aquic soil were 1.29% higher and 1.65% lower, and the macroporosities were 1.48% and 1.91% higher under the W1 and W2 treatments than CK, respectively. The fraction of coarse pores was larger for the W2 treatmemt than W1 in the red soil but was smaller in the aquic soil.
The purple soil and paddy soil had higher proportions of narrower pores, unlike the red soil and aquic soil. The microporosities of the purple soil were 10.16% and 4.02% higher, the proportions of effective pores were 3.07% and 0.95% lower, and the macroporosities were 7.08% and 3.07% lower for the W1 and W2 treatments than CK, respectively. For the paddy soil, the microporosities were 3.04% and 4.28% higher, the proportions of effective pores were 4.63% and 2.85% lower, and the macroporosities were 1.60% and 1.43% lower under the W1 and W2 treatments than CK, respectively.
3.4. Soil Salinity and Sodicity
The EC, SAR values, and Na+, Ca2+, K+, Mg2+ ions concentration under the W1, W2, and CK treatments are presented in Table 4. The order of magnitude of EC values was W1 > W2 > CK for all the soils. The increase in soil salinity was mainly a result of the high EC in the TWW, and distilled water irrigation in the W2 treatment prevents excessive salt accumulation [30]. There were differences in salt ion accumulation among these four soil types after TWW irrigation. It is worth noting that the accumulation of Na+, Ca2+, and K+ ions in the red soil under the W2 treatment were significantly (p = 0.000, p = 0.012, p = 0.000, respectively) higher than those under the W1, and the SAR and ESP values showed a similar variation trend. TWW irrigation significantly decreased Na+, Ca2+, K+, and Mg2+ ions concentration and ESP values of the aquic soil. The Na+, Ca2+, K+, and Mg2+ ions concentration of the purple soil under the W1 treatment were significantly different from those under the W2 and CK treatments. There were significant differences in the Ca2+ ion concentration, SAR and ESP values of the paddy soil under the W1, W2 and CK treatments, but the Na+ and K+ ions concentration under the W1 and W2 treatments were not significantly different from those under CK.
3.5. Correlation Analysis
To further investigate the relationships between soil physical properties (e.g., pore size distribution, parameters of the VG model) and soil salinity and sodicity, a correlation analysis was performed, and the results were shown in Table 5. The proportions of the red soil pores show a highly significant correlation (p < 0.01) with Na+, K+, SAR, and ESP, θr and n showed a highly significant (p < 0.01) negative correlation with EC, and α was related to EC, Na+, K+, SAR, CEC, and ESP. In the aquic soil, macropores and effective pores were significantly (p < 0.05) negatively correlated with K+ ions and SAR, respectively, and EC and SAR had an extremely significant (p < 0.01) effects on α. The pore size distribution and α of the purple soil were significantly affected by EC, Na+, Ca2+, K+, Mg2+, and SAR (p < 0.05), and α was also affected by CEC and ESP. θr of the paddy soil was significantly correlated with EC, CEC, and ESP (p < 0.05).
One of the benefits of our experiment was to characterize the effects of soil type and irrigation mode on the physical behavior of the TWW-irrigated soils. We used Ks, soil pores, and van Genuchten (VG) model parameters for the statistical analysis, and the results of the two-way ANOVA indicated that these factors were separately influenced by soil types and irrigation modes (p < 0.05) (Table 6). The interactions between soil types and irrigation modes were significant (p = 0.006), indicating that the soil type and irrigation mode should be taken into account when establishing schemes for irrigation with wastewater.
4. Discussion
4.1. Soil Hydraulic Properties
The variations of Ks are mainly related to the sealing of the soil surface and the connectivity of the soil pores. Except for the aquic soil under the W1 treatment, the lower Ks (Figure 3) of the red soils (clay), purple soil (loamy), and paddy soil (silty clay loam) after TWW irrigation have been observed. This may be due to the accumulation of suspended solids (SS) and colloidal solids that blocked the pores in the soil surface [24]. This mechanism depends on the concentration of SS in the TWW, and with the concentration increase, the reduction in Ks increases [34]. The decrease in Ks was therefore larger for the W1 treatment than the W2. In addition, the presence of salt ions in the TWW-irrigated soils may cause clay particles to swell during saturation with distilled water, leading to the narrowing of the water-conducting pores [35]. Moreover, organic pollutants in TWW can provide an available carbon source for microorganisms, promote microbial growth and reproduction, increase biofilm thickness, and reduce soil water conductivity [36]. This process also likely decreased the Ks and Kψ of the TWW-irrigated samples. The lower Ks in the samples irrigated with wastewater are in agreement with previous experiments [30,31], who stated that the hydraulic conductivity of a clayey loamy soil and a loamy soil decreased after irrigation with wastewater.
Ks of the aquic soil (silty clay) was higher for the W1 treatment than CK. The dispersion of soil particles depends on the relative concentration of Na+ ion. EC value of the aquic soil was nearly four-fold higher for the W1 treatment than CK, and the Na+ concentrations under the two treatments were similar (Table 4). Therefore, a higher EC value promotes the flocculation of soil particles, improves the stability of soil aggregates [37], decreases the repulsion between soil particles [38], and widens the water-conducting pores, thus increased Ks of the aquic soil under the W1 treatment. This mechanism also led to the increase in Kψ of the aquic soil after TWW irrigation. Shainberg and Letey [39] also reported that increased ECs can maintain hydraulic conductivity by balancing the effect of exchangeable sodium percentage (ESP) on clay swelling.
4.2. Soil-Water Characteristic Curves
Water retention is affected by soil porosity and pore size distribution [40]. The reductions in the WRC of the red soil (clay) and aquic soil (silty clay) (Figure 5) after TWW irrigation were due to a decrease in microporosities and an increase in macroporosities (Figure 6). Assouline and Narkis [32] similarly indicated that irrigation with wastewater decreased the WRC of clay soil by increasing the mean pore radius.
The increase in the WRC of the purple soil (loamy) after TWW irrigation is likely due to increases in microporosity. Tunc and Sahin [33] also found that irrigation with wastewater increased the micropore volume, which in turn increased field capacity and the overall available water capacity (the retained water at −33 kPa and −1520 kPa) of a loamy soil. SS and the dispersed clay particles accumulated in the purple soil, which could have also contributed to the higher WRC. Loy et al. [41] and Tarchitzky et al. [42] also observed that irrigation with wastewater increased the available water capacity of clayey and sandy soils due to the SS and organic matter in the wastewater.
4.3. Pore-Size Distribution
TWW irrigation increased the proportion of macropores in the red soil, and the pore-size distribution for the W2 treatment was broader than that for W1 (Figure 6), which could be ascribed to more Na+ ion accumulation. Furthermore, the ESP and SAR values of the red soil for the W2 treatment were higher than those for W1, whereas the EC values for the two treatments were similar (Table 4). As a result, the W2 treatment caused a greater dispersion of the red soil particles [44] and dispersed clay leaching due to shrink-swell cycles [45], resulting in wider pore development. The relative concentration of Na+ ions determine the dispersion of soil particles. The soil pores in the aquic soil were wider for the W1 treatment than W2, which may have been due to the higher EC but lower ESP value in the soil solution under the W1 treatment (Table 3), and the flocculation of clay [46]. Decreased microporosity and increased macroporosity of the aquic soil were consistent with the higher Kψ (Figure 4) and lower WRC (Figure 5) for the W1 treatment than W2. Due to the lower clay content in the purple soil and paddy soil, the effect of soil salinity and sodicity variation after TWW irrigation on soil particles was not strong, and the pores may have been narrowed by blocking the SS in the TWW. The alteration of the pore-size distribution was consistent with the lower Kψ (Figure 4) and higher WRC (Figure 5) of the paddy soil after TWW irrigation.
4.4. Soil Salinity and Sodicity
The salt ions migration, accumulation, and distribution are related to particle size distribution, clay mineral types, and exchange characteristics of salt ions in the soils [11]. Therefore, there were different characteristics of salt ion accumulation across different soil types. We assumed that the W2 treatment will mitigate the impact of TWW on soil salt ion accumulation, but this is not the case. The Na+ ion concentration, SAR, and ESP values of the red soil under the W2 treatment were significantly higher than those under the W1 treatment (Table 3). This may be because under the W1 treatment, exchangeable Na+, Ca2+, K+, and Mg2+ ions were replaced by H+, Al3+ ions, and leaching out. Red soil, in particular, has a strong leaching effect because it is under the climatic conditions of high temperatures and consistent rain, dry and wet alternation, in which Na+ and Ca2+ ions leaching are more serious. However, the dissolution and leaching of the H+ ion during distilled water irrigation under the W2 treatment reduced the ability to replace Na+ and Ca2+ ions. Salt ions are adsorbed on exchangeable complexes in the red soil, which is difficult for leaching out during irrigation. Therefore, the concentrations of the Na+ and Ca2+ ions were higher under the W2 treatment than W1. Moreover, the red soil under the W2 treatment had higher SAR and ESP than W1. This led to more serious degradation of the red soil structure and its hydraulic properties under the W2 treatment, as shown by the results of the SWCCs (Section 3.2) and pore-size distribution (Section 3.3).
In contrast to the accumulation of salt ion in the red soil, Na+, Ca2+, K+, and Mg2+ ion concentrations of the aquic soil decreased after TWW irrigation. This may be because TWW irrigation increased the EC values of the aquic soil, enhanced flocculation of clay, and decreased the specific surface area, which thus reduced the adsorption sites of salt ions, resulting in the decrease in exchangeable Na+, Ca2+, K+, and Mg2+ ions concentration in the soil solution and ESP values. Compared with the CK treatment, the higher EC values and lower ESP values of the aquic soil after TWW irrigation led to soil flocculation and a macroporosities increase (Section 3.3). Therefore, TWW irrigation increased Kψ (Section 3.1.2) and decreased the WRC (Section 3.2) of the aquic soil.
4.5. Application of Wastewater to the Soils
According to the results and the two-way ANOVA analysis (Table 5), TWW irrigation mode is an important factor affecting soil hydraulic properties and soil salinity. The W2 treatment alleviated the impact of TWW on the soil structure and hydraulic properties of the aquic soil, purple soil, and paddy soil, but intensified the damage to the red soil. This is due to the accumulation of more Na+ ions and higher SAR and ESP in the red soil under the W2 treatment than W1, and the red soil contains higher clay (Table 1), which enhanced soil swelling and clay dispersion. Wastewater may therefore not be suitable for irrigating the red soil in subtropical regions. The effects of Na+ ions in the red soil occured when the soil was leached with rainwater (close to distilled water) during the rainy season due to the high clay content, especially the highly variable rainfall in subtropical regions [47], causing the dispersion and eluviation of clay particles, which irreversibly damaged the soil, as reported by Lado and Ben-Hur [12].
The increases in Kψ (Figure 4) and decreased ESP suggest that TWW could be used as an alternative water source for the aquic soil, because it may decrease runoff and erosion. The reduction in Ks caused by the accumulation of SS in the topsoil, however, suggests that fields should be regularly plowed to prevent the formation of seals. Most of the SS in the TWW was retained by the topsoil [24], and salt ions can degrade the soil structure, subsequently affecting the hydraulic conductivities. Some studies have investigated the efficient methods of irrigation with wastewater, such as rapid application [48], for reducing the clogging of soil pores, but the concentrations of SS and salt in the wastewater should still be carefully examined.
5. Conclusions
The treated domestic wastewater (TWW) is used for irrigation, which can not only meet the water demand, but also reduce point source pollution. However, there are few studies on the effects of low-salinity TWW irrigation on the physicochemical properties of typical soils in the subtropical region. Therefore, we conducted a cumulative irrigation experiment to investigate the effect of TWW irrigation on soil salinity, sodicity, and hydraulic properties of the red soil, aquic soil, purple soil, and paddy soil.
The Ks and Kψ of the red soil, purple soil, and paddy soil decreased after TWW irrigation, whereas those of the aquic soil under W1 treatment increased. TWW decreased the proportion of micropores and increased the proportion of macropores of the red soil and aquic soil, which thus deteriorated the WRCs. However, the change of pore size distributions in purple soil and paddy soil were opposite to those in red soil and aquic soil, and the WRCs of the purple soil and paddy soil were improved. Correlation analysis showed that the hydraulic properties of the soils irrigated by TWW were influenced by soil salinity and salt ion concentration. The EC values of all the tested soils increased significantly (p < 0.05). The Na+ concentration, ESP, and SAR values of the red soil under TWW irrigation were higher than those under CK, and the soil sodicity increased to a higher level under the W2 treatment than W1.
The results of the two-way ANOVA indicated that soil type and irrigation mode had important impacts on the soil physicochemical under TWW irrigation. The W2 treatment (alternating irrigations with DWW and distilled water) could mitigate the effect of TWW on the hydraulic characteristics of the aquic soil, purple soil, and paddy soil, but it intensified the effect on those of the red soil. TWW should thus not be applied to the red soil in subtropical regions, but it may serve as an alternative source of irrigation water for the aquic soil, purple soli, and paddy soil. Soil hydraulic properties, salinity, and sodicity, however, should be continually monitored due to the negative effects of DWW irrigation on soil structure, and the high level of SS and sodium in TWW should be taken into account.
Author Contributions
Conceptualization, H.W. and J.L.; methodology, J.L. and C.H.; software, J.L.; validation, J.L.; formal analysis, J.L; investigation, J.L. and C.H.; resources, H.W.; data curation, J.L.; writing—original draft preparation, J.L.; writing—review and editing, J.L. and H.W.; visualization, J.L.; supervision, H.W.; project administration, H.W.; funding acquisition, H.W. All authors have read and agreed to the published version of the manuscript.
Funding
This research was supported by the National Natural Science Foundation of China (grant number 41471185).
Institutional Review Board Statement
Not applicable.
Informed Consent Statement
Not applicable.
Data Availability Statement
Data are contained within the paper.
Acknowledgments
The authors thank Shuai Tan for her technical help.
Conflicts of Interest
The authors declare no conflict of interest. The funders had no role in the design of the study; in the collection, analyses, or interpretation of data; in the writing of the manuscript, or in the decision to publish the results.
References
- Xu, Z.; Chau, S.N.; Chen, X.; Zhang, J.; Li, Y.; Dietz, T.; Wang, J.; Winkler, J.A.; Fan, F.; Huang, B.; et al. Assessing progress towards sustainable development over space and time. Nature 2020, 577, 74–78. [Google Scholar] [CrossRef] [PubMed]
- FAO (Food and Agriculture Organization of the United Nations). The State of World Fisheries and Aquaculture. Available online: http://www.fao.org/fishery/en (accessed on 23 January 2017).
- Muyen, Z.; Moore, G.A.; Wrigley, R.J. Soil salinity and sodicity effects of wastewater irrigation in South East Australia. Agric. Water Manag. 2011, 99, 33–41. [Google Scholar] [CrossRef]
- Becerra-Castro, C.; Lopes, A.R.; Vaz-Moreira, I.; Silva, E.F.; Manaia, C.M.; Nunes, O.C. Wastewater reuse in irrigation: A microbiological perspective on implications in soil fertility and human and environmental health. Environ. Int. 2015, 75, 117–135. [Google Scholar] [CrossRef] [PubMed]
- Levy, G.J.; Dag, A.; Raviv, M.; Zipori, I.; Medina, S.; Saadi, I.; Krasnovski, A.; Eizenberg, H.; Laor, Y. Annual spreading of olive mill wastewater over consecutive years: Effects on cultivated soils’ physical properties. Land Degrad. Dev. 2018, 29, 176–187. [Google Scholar] [CrossRef]
- Bedbabis, S.; Rouina, B.B.; Boukhris, M.; Ferrara, G. Effect of irrigation with treated wastewater on soil chemical properties and infiltration rate. J. Environ. Manag. 2014, 133, 45–50. [Google Scholar] [CrossRef]
- Travis, M.J.; Wiel-Shafran, A.; Weisbrod, N.; Adar, E.; Gross, A. Greywater reuse for irrigation: Effect on soil properties. Sci. Total Environ. 2010, 408, 2501–2508. [Google Scholar] [CrossRef]
- Li, F.H.; Yan, H.; Pang, C.L.; Xia, Q. Soil hydraulic conductivity affected by slight saline water irrigation in North China. Trans. Chin. Soc. Agric. Eng. 2013, 39, 73–80. [Google Scholar]
- Tang, S.Q.; She, D.L. Influence of water quality on soil saturated hydraulic conductivity and infiltration properties. Trans. Chin. Soc. Agric. Mach. 2016, 47, 108–114. [Google Scholar]
- Marchuk, S.; Marchuk, A. Effect of applied potassium concentration on clay dispersion, hydraulic conductivity, pore structure and mineralogy of two contrasting Australian soils. Soil Tillage Res. 2018, 182, 35–44. [Google Scholar] [CrossRef]
- Hu, C.W.; Wang, H.; Wu, Y.; Lu, J.Y.; Li, Y.Y. Migration characteristics and its differences of reclaimed water salinity in different subtropical soils. Trans. Chin. Soc. Agric. Eng. 2018, 34, 99–107. [Google Scholar]
- Lado, M.; Bar-Tal, A.; Azenkot, A.; Assouline, S.; Ravina, I.; Erner, Y.; Fine, P.; Dasberg, S.; Ben-Hur, M. Changes in chemical properties of semiarid soils under long-term secondary treated wastewater irrigation. Soil Sci. Soc. Am. J. 2012, 76, 1358–1369. [Google Scholar] [CrossRef]
- Agassi, M.; Tarchitzky, J.; Keren, R.; Chen, Y.; Goldstein, D.; Fizik, E. Effects of prolonged irrigation with treated municipal effluent on runoff rate. J. Environ. Qual. 2003, 32, 1053–1057. [Google Scholar] [CrossRef]
- Lado, M.; Ben-Hur, M.; Assouline, S. Effects of effluent irrigation on seal formation, infiltration, and soil loss during rainfall. Soil Sci. Soc. Am. J. 2005, 69, 1432–1439. [Google Scholar] [CrossRef]
- Leuther, F.; Schlüter, S.; Wallach, R.; Vogel, H.J. Structure and hydraulic properties in soils under long-term irrigation with treated wastewater. Geoderma 2019, 333, 90–98. [Google Scholar] [CrossRef]
- Ben-Hur, M. Sewage water treatments and reuse in Israel. In Water in the Middle East and in North Africa; Springer: Berlin/Heidelberg, Germany, 2004; pp. 167–180. [Google Scholar]
- Blum, J.; Herpin, U.; Melfi, A.J.; Montes, C.R. Soil properties in a sugarcane plantation after the application of treated sewage effluent and phosphogypsum in Brazil. Agric. Water Manag. 2012, 115, 203–216. [Google Scholar] [CrossRef]
- Bagarello, V.; Iovino, M.; Palazzolo, E.; Panno, M.; Reynolds, W.D. Field and laboratory approaches for determining sodicity effects on saturated soil hydraulic conductivity. Geoderma 2006, 130, 1–13. [Google Scholar] [CrossRef]
- Wang, H.; Huang, Z.Z.; Tan, S.; Hu, C.W.; Wu, Y. Effects of irrigation with reclaimed water on hydraulic characteristics of red soil. Trans. Chin. Soc. Agric. Eng. 2019, 35, 120–127. [Google Scholar]
- Andrews, D.M.; Robb, T.; Elliott, H.; Watson, J.E. Impact of long-term wastewater irrigation on the physicochemical properties of humid region soils: “The living filter” site case study. Agric. Water Manag. 2016, 178, 239–247. [Google Scholar] [CrossRef]
- Muchow, R.C.; Hammer, G.L.; Vanderlip, R.L. Assessing climatic risk to sorghum production in water-limited subtropical environments II. Effects of planting date, soil water at planting, and cultivar phenology. Field Crops Res. 1994, 36, 235–246. [Google Scholar] [CrossRef]
- Coppola, A.; Santini, A.; Botti, P.; Vacca, S.; Comegna, V.; Severino, G. Methodological approach for evaluating the response of soil hydrological behavior to irrigation with treated municipal wastewater. J. Hydrol. 2004, 292, 114–134. [Google Scholar] [CrossRef]
- Walker, W.R.; Prestwich, C.; Spofford, T. Development of the revised USDA-NRCS intake families for surface irrigation. Agric. Water Manag. 2006, 85, 157–164. [Google Scholar] [CrossRef]
- Machiwal, D.; Jha, M.K.; Mal, B.C. Modelling infiltration and quantifying spatial soil variability in a wasteland of Kharagpur, India. Biosyst. Eng. 2006, 95, 569–582. [Google Scholar] [CrossRef]
- US Salinity Laboratory. Diagnosis and Improvement of Saline and Alkaline Soils; Handbook No. 60; Department of Agriculture, U.S. Government Printing Office: Washington, DC, USA, 1954; p. 160.
- Klute, A.; Dirksen, C. Hydraulic conductivity and diffusivity: Laboratory methods. Methods Soil Anal. Part 1 Phys. Mineral. Methods 1986, 5, 687–734. [Google Scholar]
- Saxton, K.E.; Rawls, W.J. Soil water characteristic estimates by texture and organic matter for hydrologic solutions. Soil Sci. Soc. Am. J. 2006, 70, 1569–1578. [Google Scholar] [CrossRef]
- Van Genuchten, M.T. A closed-form equation for predicting the hydraulic conductivity of unsaturated soils. Soil Sci. Soc. Am. J. 1980, 44, 892–898. [Google Scholar] [CrossRef]
- Mualem, Y. A new model for predicting the hydraulic conductivity of unsaturated porous media. Water Resour. Res. 1976, 12, 513–522. [Google Scholar] [CrossRef]
- Bourazanis, G.; Katsileros, A.; Kosmas, C.; Kerkides, P. The effect of treated municipal wastewater and fresh water on saturated hydraulic conductivity of a clay-loamy soil. Water Resour. Manag. 2016, 30, 2867–2880. [Google Scholar] [CrossRef]
- Schacht, K.; Marschner, B. Treated wastewater irrigation effects on soil hydraulic conductivity and aggregate stability of loamy soils in Israel. J. Hydrol. Hydromech. 2015, 1, 47–54. [Google Scholar] [CrossRef]
- Assouline, S.; Narkis, K. Effects of long-term irrigation with treated wastewater on the hydraulic properties of a clayey soil. Water Resour. Res. 2011, 47, 1–12. [Google Scholar] [CrossRef]
- Tunc, T.; Sahin, U. The changes in the physical and hydraulic properties of a loamy soil under irrigation with simpler-reclaimed wastewaters. Agric. Water Manag. 2015, 158, 213–224. [Google Scholar] [CrossRef]
- Levy, G.J.; Rosenthal, A.; Tarchitzky, J.; Shainberg, I.; Chen, Y. Soil hydraulic conductivity changes caused by irrigation with reclaimed waste water. J. Environ. Qual. 1999, 28, 1658–1664. [Google Scholar] [CrossRef]
- Levy, G.J.; Goldstein, D.; Mamedov, A.I. Saturated hydraulic conductivity of semiarid soils: Combined effects of salinity, sodicity, and rate of wetting. Soil Sci. Soc. Am. J. 2005, 69, 653–662. [Google Scholar] [CrossRef]
- Zhou, H.; Xu, G. Integrated effects of temperature and COD/N on an up-flow anaerobic filter-biological aerated filter: Performance, biofilm characteristics and microbial community. Bioresour. Technol. 2019, 293, 122004. [Google Scholar] [CrossRef] [PubMed]
- Rahimi, H.; Pazira, E.; Tajik, F. Effect of soil organic matter, electrical conductivity and sodium adsorption ratio on tensile strength of aggregates. Soil Tillage Res. 2000, 54, 145–153. [Google Scholar] [CrossRef]
- Chorom, M.; Rengasamy, P.; Murray, R.S. Clay dispersion as influenced by pH and net particle charge of sodic soils. Soil Res. 1994, 32, 1243–1252. [Google Scholar] [CrossRef]
- Shainberg, I.; Letey, J. Response of soils to sodic and saline conditions. Hilgardia 1984, 52, 1–57. [Google Scholar] [CrossRef]
- Gonçalves RA, B.; Gloaguen, T.V.; Folegatti, M.V.; Libardi, P.L.; Lucas, Y.; Montes, C.R. Pore size distribution in soils irrigated with sodic water and wastewater. Rev. Bras. Ciência Solo 2010, 34, 701–707. [Google Scholar] [CrossRef]
- Loy, S.; Assi, A.T.; Mohtar, R.H.; Morgan, C.; Jantrania, A. The effect of municipal treated wastewater on the water holding properties of a clayey, calcareous soil. Sci. Total Environ. 2018, 643, 807–818. [Google Scholar] [CrossRef]
- Tarchitzky, J.; Chen, Y.; Banin, A.S. Humic substances and pH effects on sodium-and calcium-montmorillonite flocculation and dispersion. Soil Sci. Soc. Am. J. 1993, 57, 367–372. [Google Scholar] [CrossRef]
- Magesan, G.N.; Williamson, J.C.; Sparling, G.P.; Schipper, L.A.; Lloyd-Jones, A.R. Hydraulic conductivity in soils irrigated with wastewaters of differing strengths: Field and laboratory studies. Aust. J. Soil Res. 1999, 37, 391–402. [Google Scholar]
- Warrington, D.N.; Goldstein, D.; Levy, G.J. Clay translocation within the soil profile as affected by intensive irrigation with treated wastewater. Soil Sci. 2007, 172, 692–700. [Google Scholar] [CrossRef]
- Presley, D.R.; Ransom, M.D.; Kluitenberg, G.J.; Finnell, P.R. Effects of thirty years of irrigation on the genesis and morphology of two semiarid soils in Kansas. Soil Sci. Soc. Am. J. 2004, 68, 1916–1926. [Google Scholar] [CrossRef]
- Zhang, X.C.; Norton, L.D. Effect of exchangeable Mg on saturated hydraulic conductivity, disaggregation and clay dispersion of disturbed soils. J. Hydrol. 2002, 260, 194–205. [Google Scholar] [CrossRef]
- Frenkel, H.; Goertzen, J.O.; Rhoades, J.D. Effects of clay type and content, exchangeable sodium percentage, and electrolyte concentration on clay dispersion and soil hydraulic conductivity. Soil Sci. Soc. Am. J. 1978, 42, 32–39. [Google Scholar] [CrossRef]
- Nadav, I.; Arye, G.; Tarchitzky, J.; Chen, Y. Enhanced infiltration regime for treated-wastewater purification in soil aquifer treatment (SAT). J. Hydrol. 2012, 420, 275–283. [Google Scholar] [CrossRef]
Figure 1.
Collection sites of the experimental soils for filling the soil columns (●), and the site of the soil-column experiment (★).
Figure 1.
Collection sites of the experimental soils for filling the soil columns (●), and the site of the soil-column experiment (★).

Figure 2.
Schematic of a soil column.
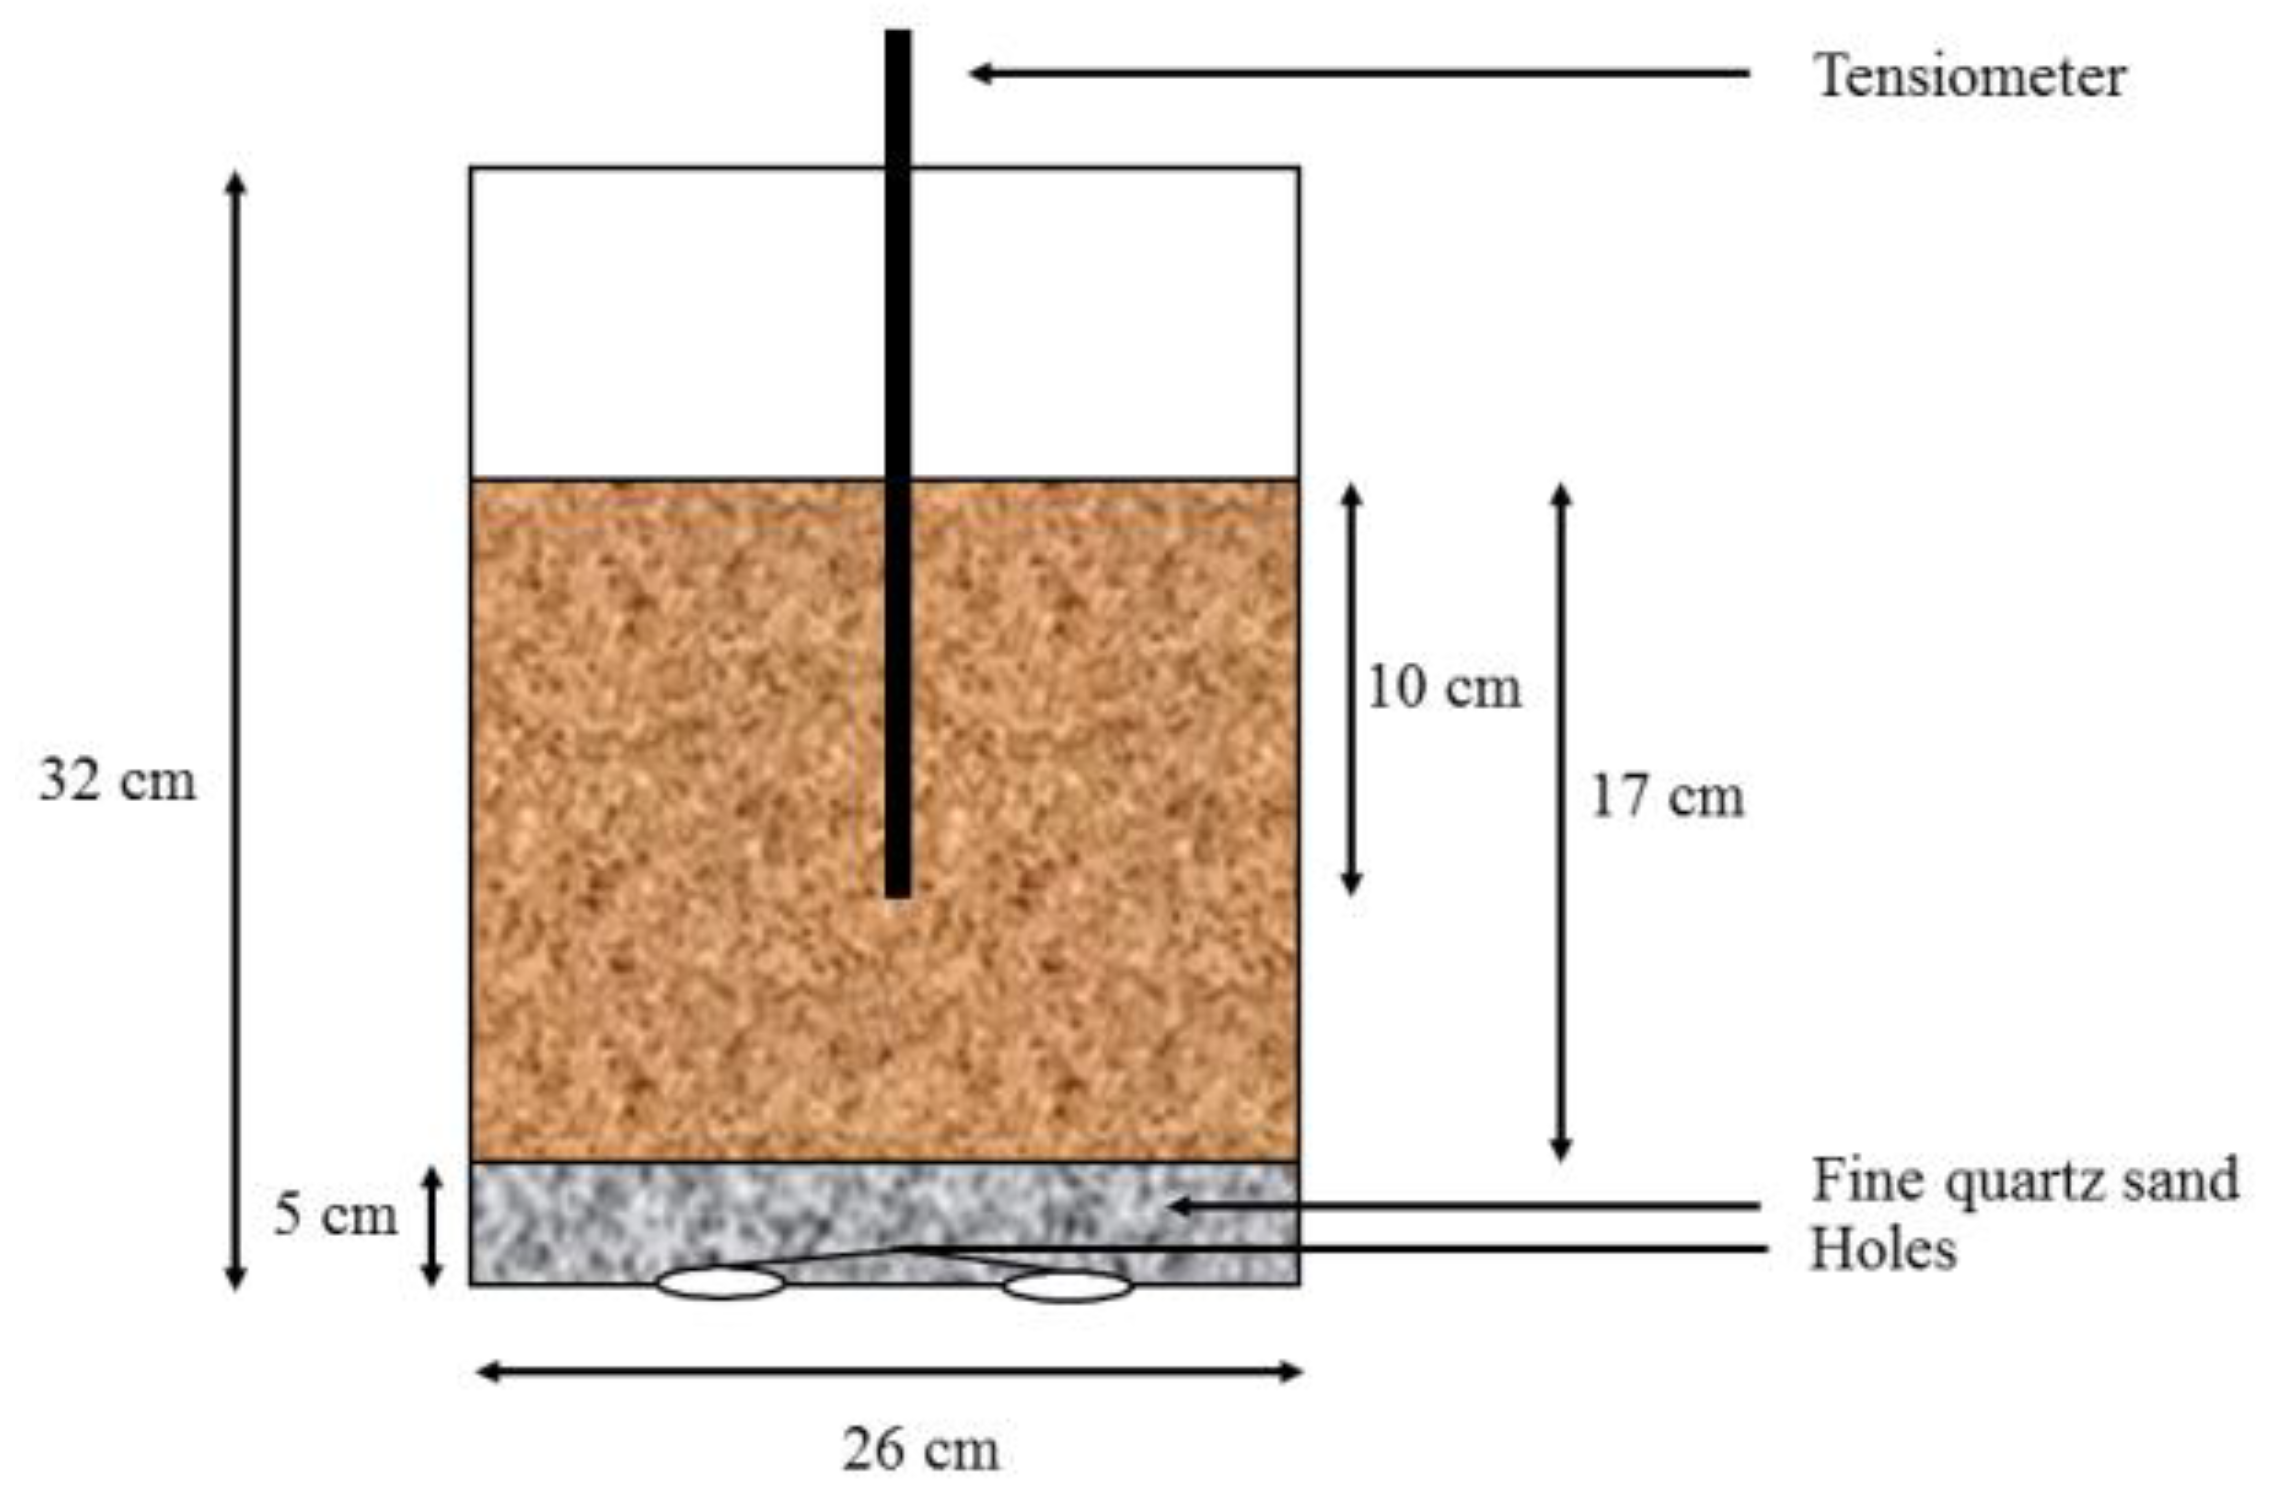
Figure 3.
Saturated hydraulic conductivity (mean ± standard error) of the (a) red soil, (b) aquic soil, (c) purple soil, and (d) paddy soil under the W1, W2, and CK treatments. The error bars represent the standard errors used for comparison in a Duncan test, and the different letters indicate significant differences among the irrigation modes for the same soil (p < 0.05).
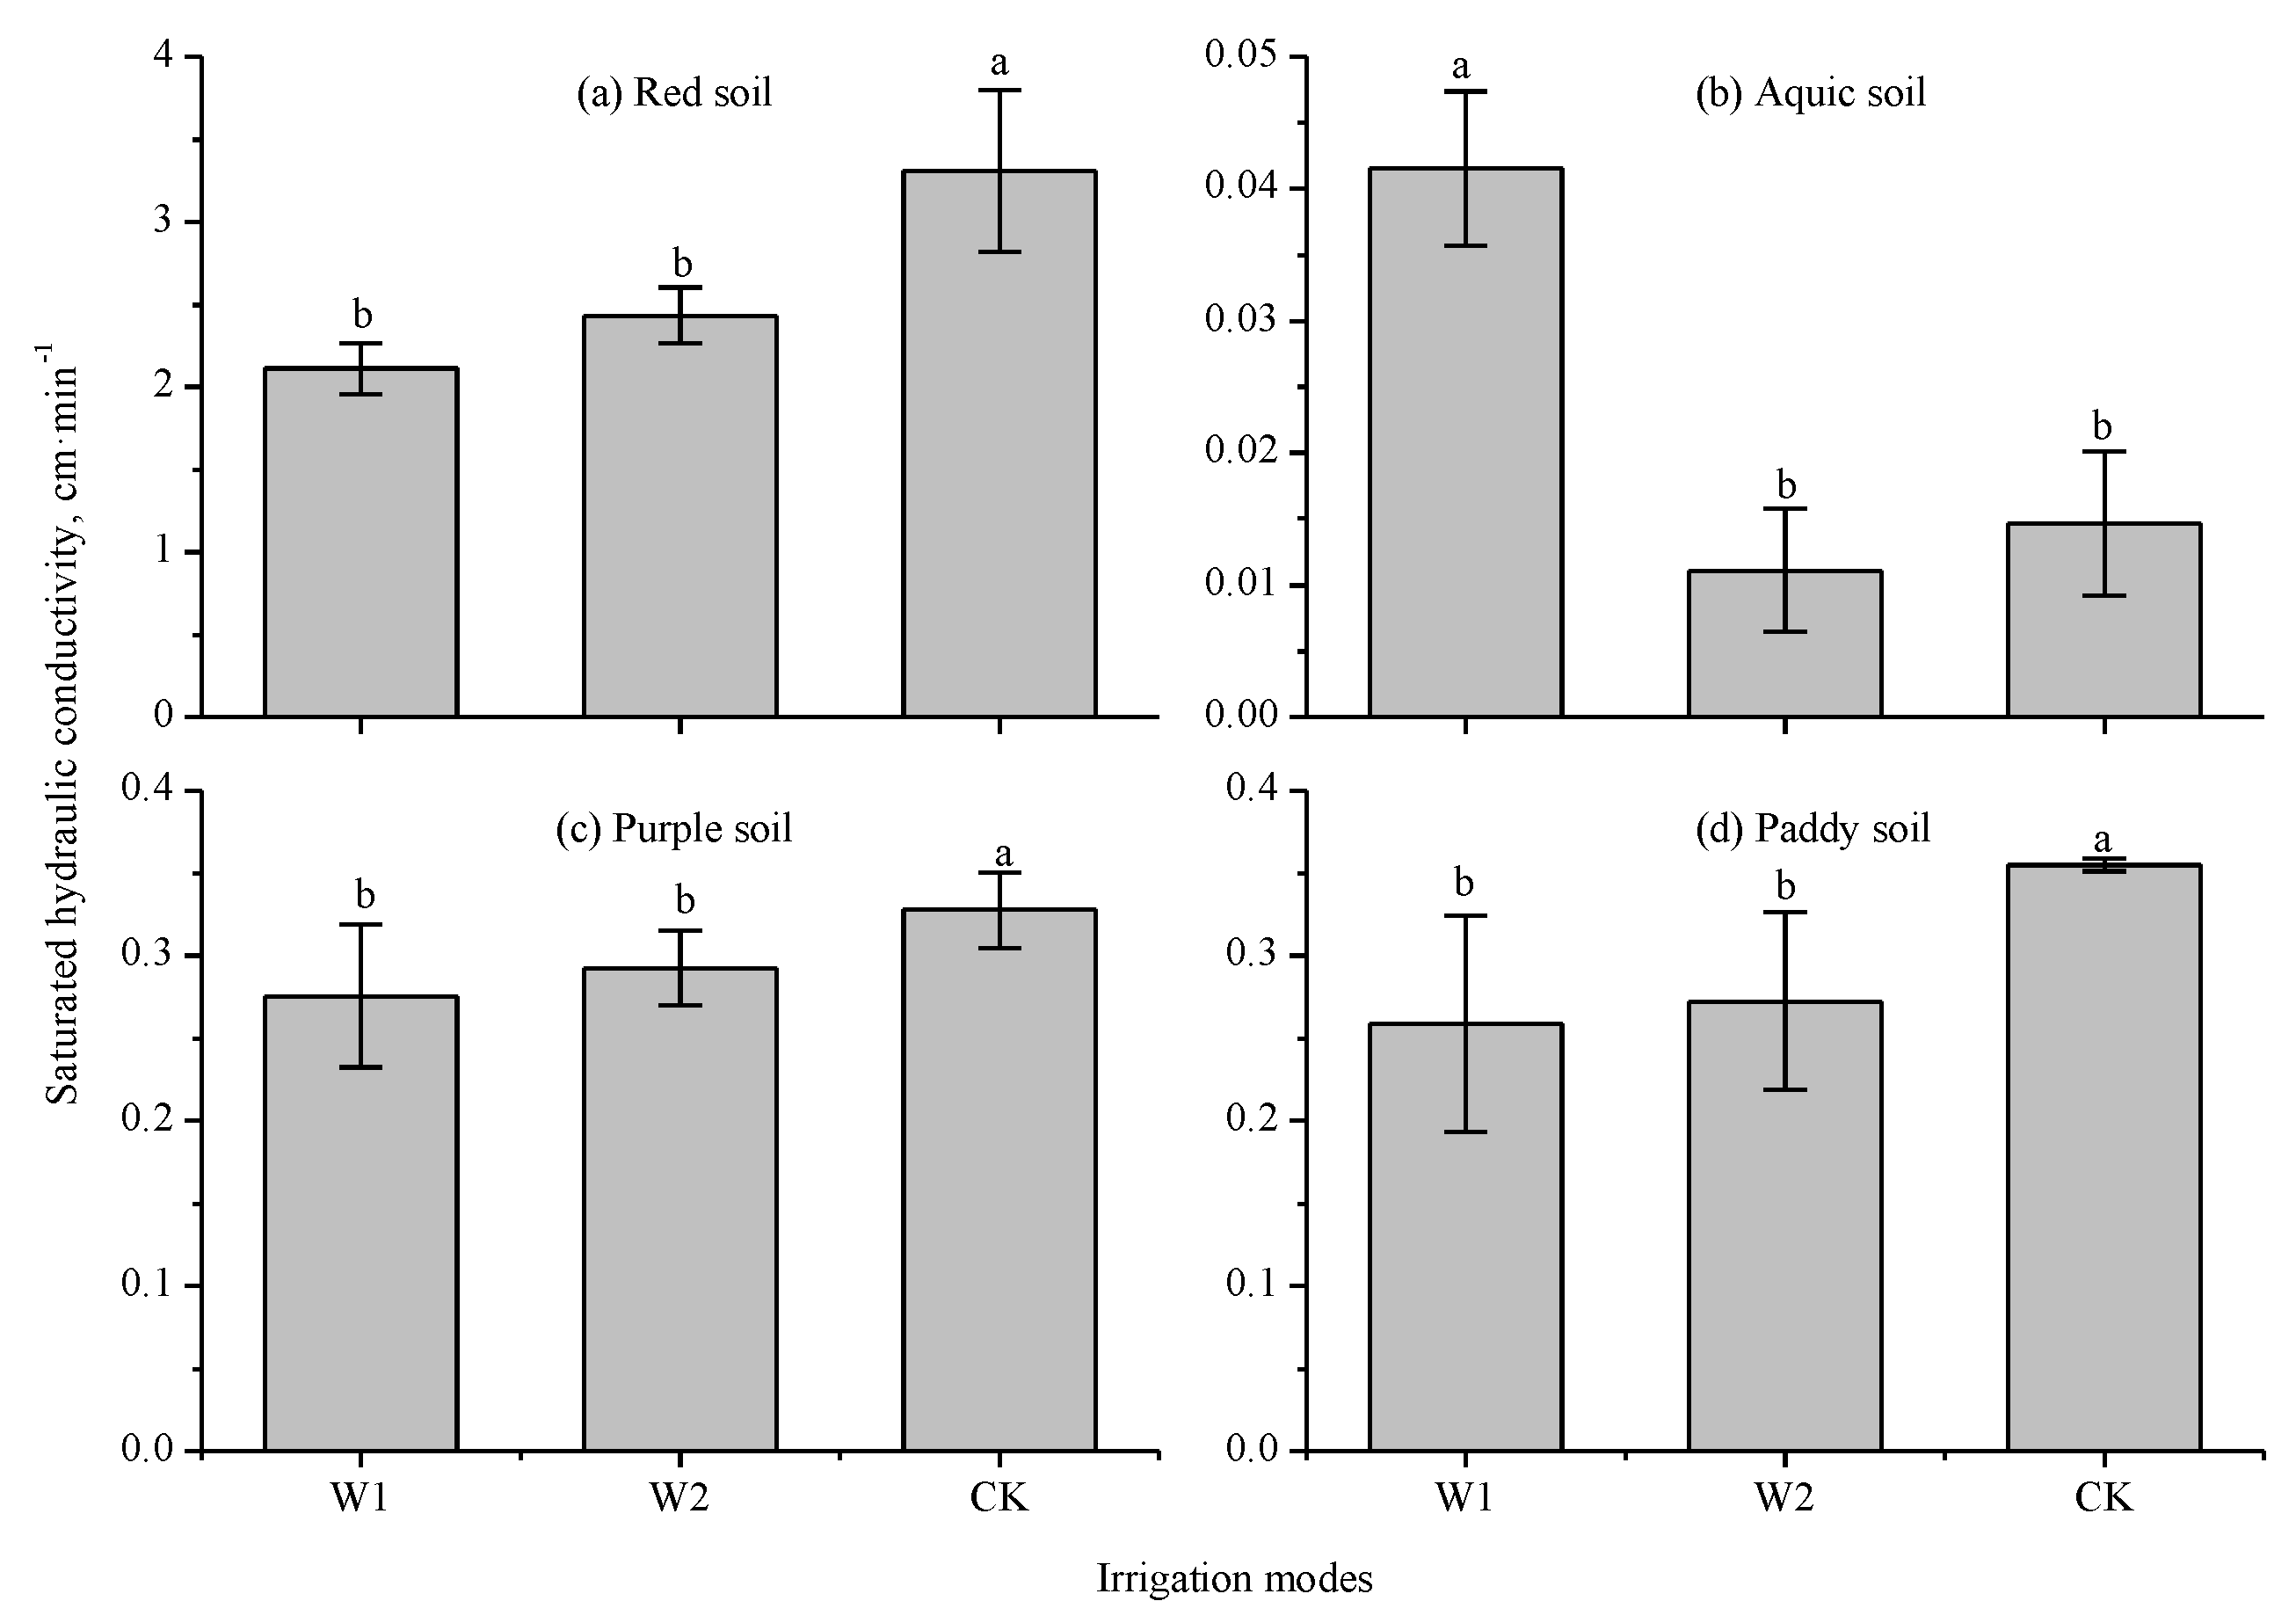
Figure 4.
Relative unsaturated hydraulic conductivity of the (a) red soil, (b) aquic soil, (c) purple soil, and (d) paddy soil.
Figure 4.
Relative unsaturated hydraulic conductivity of the (a) red soil, (b) aquic soil, (c) purple soil, and (d) paddy soil.

Figure 5.
Soil-water characteristic curves for the (a) red soil, (b) aquic soil, (c) purple soil, and (d) paddy soil under the W1, W2, and CK treatments.
Figure 5.
Soil-water characteristic curves for the (a) red soil, (b) aquic soil, (c) purple soil, and (d) paddy soil under the W1, W2, and CK treatments.

Figure 6.
Pore-size distribution for the (a) red soil, (b) aquic soil, (c) purple soil, and (d) paddy soil under W1, W2, and CK.
Figure 6.
Pore-size distribution for the (a) red soil, (b) aquic soil, (c) purple soil, and (d) paddy soil under W1, W2, and CK.
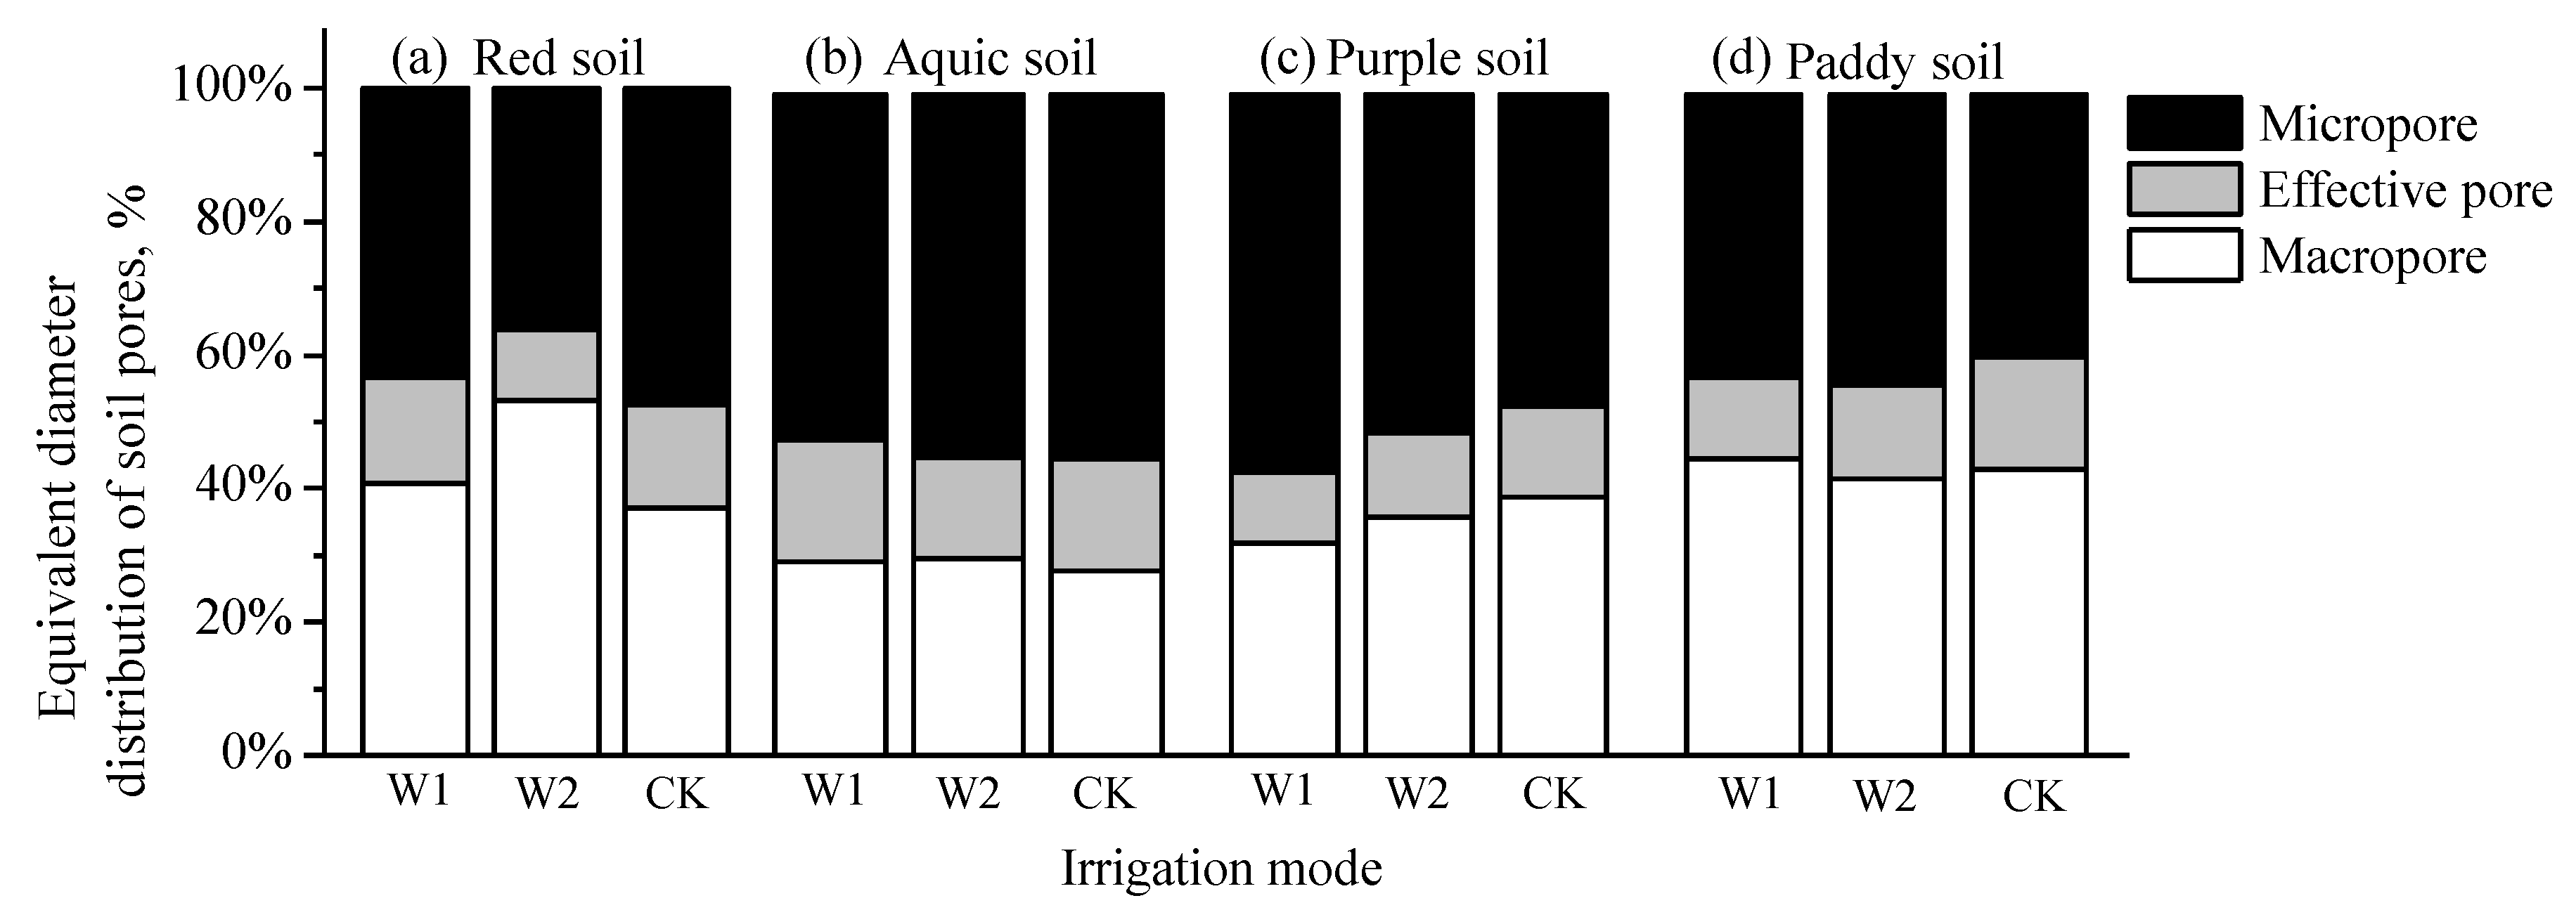
Table 1.
Physical and chemical properties of the selected soils (mean ± standard deviation).
| Parament | Red Soil | Aquic Soil | Purple Soil | Paddy Soil |
|---|---|---|---|---|
| 2–0.02 mm/(%) | 12 | 15 | 34 | 25 |
| 0.02–0.002 mm/(%) | 32 | 47 | 33 | 49 |
| <0.002 mm/(%) | 56 | 38 | 33 | 26 |
| EC/(μs/cm) | 46.70 ± 3.25 | 157.05 ± 10.75 | 196.20 ± 12.22 | 96.60 ± 0.40 |
| pH | 5.05 ± 0.06 | 5.69 ± 0.02 | 7.50 ± 0.06 | 5.03 ± 0.01 |
| Na+/(cmol/kg) | 0.30 ± 0.13 | 1.57 ± 0.01 | 1.66 ± 0.01 | 0.88 ± 0.13 |
| Ca2+/(cmol/kg) | 3.17 ± 0.04 | 8.56 ± 0.05 | 16.92 ± 0.18 | 6.39 ± 0.06 |
| K+/(cmol/kg) | 0.15 ± 0.01 | 1.46 ± 0.01 | 2.06 ± 0.08 | 0.44 ± 0.01 |
| Mg2+/(cmol/kg) | 0.50 ± 0.01 | 3.23 ± 0.03 | 3.29 ± 0.04 | 0.97 ± 0.05 |
| CEC | 13.09 ± 0.22 | 14.60 ± 1.19 | 20.38 ± 0.03 | 10.24 ± 0.19 |
| OM | 2.28 ± 0.39 | 15.26 ± 3.20 | 18.67 ± 0.04 | 16.09 ± 2.01 |
Table 3.
The fitting parameters of VG model of soil water characteristic curves after irrigation.
| Soil Type | Treatments | θs /(cm3·cm−3) | θr /(cm3·cm−3) | α | n |
|---|---|---|---|---|---|
| Red soil | W1 | 0.538 | 0.119 | 0.411 | 1.152 |
| W2 | 0.544 | 0.157 | 1.093 | 1.235 | |
| CK | 0.520 | 0.210 | 0.087 | 1.288 | |
| Aquic soil | W1 | 0.452 | 0 | 1.006 | 1.065 |
| W2 | 0.457 | 0 | 1.843 | 1.057 | |
| CK | 0.470 | 0 | 1.743 | 1.055 | |
| Purple soil | W1 | 0.424 | 0 | 67.166 | 1.040 |
| W2 | 0.439 | 0.048 | 6.380 | 1.069 | |
| CK | 0.446 | 0 | 26.96 | 1.057 | |
| Paddy soil | W1 | 0.500 | 0.086 | 85.732 | 1.079 |
| W2 | 0.488 | 0.039 | 100.41 | 1.062 | |
| CK | 0.498 | 0.001 | 42.459 | 1.065 |
Table 4.
Basic chemical properties of the soils before and after irrigation (means ± standard deviations).
Table 4.
Basic chemical properties of the soils before and after irrigation (means ± standard deviations).
| Soil Type | Treatments | EC (µS·cm−1) | Na+ (cmol·kg−1) | Ca2+ (cmol·kg−1) | K+ (cmol·kg−1) | Mg2+ (cmol·kg−1) | SAR(cmol•kg·0.5) | CEC (cmol·kg−1) | ESP (%) |
|---|---|---|---|---|---|---|---|---|---|
| Red soil | W1 | 59.55 ± 3.65 a | 0.337 ± 0.013 b | 3.554 ± 0.137 b | 0.190 ± 0.033 a | 0.693 ± 0.097 a | 0.231 ± 0.003 b | 12.755 ± 0.125 b | 2.64 ± 0.13 b |
| W2 | 58.70 ± 3.71 a | 0.793 ± 0.069 a | 4.142 ± 0.184 a | 0.473 ± 0.065 b | 0.710 ± 0.072 a | 0.509 ± 0.031 a | 12.383 ± 0.217 c | 6.40 ± 0.67 a | |
| CK | 32.25 ± 2.19 b | 0.156 ± 0.011 c | 4.054 ± 0.190 a | 0.160 ± 0.030 c | 0.644 ± 0.070 a | 0.102 ± 0.004 c | 13.415 ± 0.169 a | 1.16 ± 0.10 c | |
| Aquic soil | W1 | 141.8 ± 8.61 a | 1.652 ± 0.021 c | 9.366 ± 0.042 c | 0.597 ± 0.017 c | 4.040 ± 0.027 b | 0.638 ± 0.008 b | 14.948 ± 0.297 b | 11.05 ± 0.08 b |
| W2 | 55.53 ± 2.84 b | 1.689 ± 0.016 b | 8.777 ± 0.036 b | 0.560 ± 0.021 b | 3.794 ± 0.019 c | 0.674 ± 0.003 a | 16.793 ± 0.146 a | 10.06 ± 0.01 c | |
| CK | 34.37 ± 1.97 c | 1.758 ± 0.013 a | 9.547 ± 0.071 a | 0.640 ± 0.006 a | 4.243 ± 0.034 a | 0.669 ± 0.001 a | 13.236 ± 0.342 c | 13.29 ± 0.25 a | |
| Purple soil | W1 | 199.47 ± 10.68 a | 1.936 ± 0.027 b | 22.127 ± 0.097 a | 0.701 ± 0.073 b | 4.640 ± 0.051 a | 0.529 ± 0.008 b | 16.093 ± 0.452 c | 12.04 ± 0.51 a |
| W2 | 155.03 ± 10.75 b | 2.058 ± 0.039 a | 21.693 ± 0.075 b | 0.836 ± 0.045 a | 4.387 ± 0.047 b | 0.570 ± 0.011 a | 18.901 ± 0.471 a | 10.90 ± 0.48 b | |
| CK | 122.63 ± 7.14 c | 2.031 ± 0.013 a | 21.530 ± 0.134 b | 0.820 ± 0.039 a | 4.415 ± 0.038 b | 0.564 ± 0.003 a | 17.395 ± 0.169 b | 11.68 ± 0.04 ab | |
| Paddy soil | W1 | 252.13 ± 11.96 a | 1.837 ± 0.015 a | 6.575 ± 0.046 c | 0.679 ± 0.014 a | 1.928 ± 0.027 b | 0.891 ± 0.007 a | 13.033 ± 0.143 a | 14.10 ± 0.04 c |
| W2 | 199.03 ± 12.22 b | 1.840 ± 0.047 a | 7.085 ± 0.074 a | 0.601 ± 0.026 a | 2.050 ± 0.029 a | 0.861 ± 0.020 b | 10.954 ± 0.258 b | 16.80 ± 0.03 b | |
| CK | 180.73 ± 11.53 c | 1.798 ± 0.031 a | 6.872 ± 0.053 b | 0.608 ± 0.067 a | 1.966 ± 0.017 b | 0.855 ± 0.013 b | 10.471 ± 0.349 b | 17.18 ± 0.28 a |
Different letters in the same column of the same soil type indicate significant differences between different treatments (p < 0.05).
Table 5.
Basic correlation between soil physical properties and soil salinity.
| Soil type | Parameters | EC | Na | Ca | K | Mg | SAR | CEC | ESP |
|---|---|---|---|---|---|---|---|---|---|
| Red soil | Macropores | 0.579 | 0.942 ** | 0.258 | 0.988 ** | 0.109 | 0.951 ** | −0.754 * | 0.936 ** |
| Effective pores | −0.460 | −0.823 ** | −0.743 * | 0.649 | −0.732 * | −0.797 * | 0.754 * | −0.830 ** | |
| Micropores | −0.761 * | −0.965 ** | −0.407 | −0.801 ** | −0.634 | −0.960 ** | 0.950 ** | −0.967 ** | |
| θs | 0.329 | 0.375 | −0.466 | 0.588 | −0.564 | 0.415 | −0.237 | 0.360 | |
| θr | −0.906 ** | −0.37 | 0.396 | −0.064 | −0.643 | −0.389 | 0.734 * | −0.373 | |
| α | 0.705 * | 0.987 ** | 0.276 | 0.949 ** | 0.312 | 0.993 ** | −0.874 ** | 0.983 ** | |
| n | −0.819 ** | −0.171 | 0.593 | 0.104 | −0.488 | −0.198 | 0.568 | −0.173 | |
| Aquic soil | Macropores | 0.142 | −0.625 | −0.475 | −0.706 * | −0.310 | 0.334 | 0.289 | −0.388 |
| Effective pores | 0.356 | −0.395 | 0.358 | 0.014 | 0.450 | −0.734 * | −0.455 | 0.267 | |
| Micropores | −0.664 | 0.240 | −0.223 | 0.197 | 0.112 | 0.339 | −0.154 | 0.232 | |
| θs | −0.42 | 0.133 | 0.081 | −0.023 | 0.382 | −0.007 | −0.417 | 0.409 | |
| θr | - | - | - | - | - | - | - | - | |
| α | −0.955 ** | −0.397 | −0.397 | −0.076 | −0.158 | 0.941 ** | 0.123 | 0.112 | |
| n | −0.179 | −0.091 | −0.091 | −0.384 | 0.080 | −0.513 | −0.098 | −0.040 | |
| Purple soil | Macropores | −0.786 * | 0.568 | −0.735 * | 0.736 * | −0.783 * | 0.626 | 0.506 | −0.394 |
| Effective pores | −0.501 | 0.392 | −0.462 | 0.680* | −0.662 | 0.434 | 0.482 | −0.451 | |
| Micropores | 0.947 ** | −0.741 * | 0.931 ** | −0.549 | 0.718 * | −0.793 * | −0.463 | 0.235 | |
| θs | −0.681 * | 0.606 | −0.736 * | −0.139 | −0.155 | 0.617 | 0.082 | 0.216 | |
| θr | −0.141 | 0.690 * | −0.273 | 0.330 | −0.441 | 0.638 | 0.717 * | −0.572 | |
| α | 0.694 * | −0.907 ** | 0.778 ** | −0.784 * | 0.923 ** | −0.921 ** | −0.939 ** | 0.761 * | |
| n | −0.567 | 0.730 * | −0.682 * | −0.011 | −0.279 | 0.720 * | 0.360 | −0.075 | |
| Paddy soil | Macropores | 0.546 | 0.290 | −0.500 | 0.631 | −0.688 * | 0.608 | 0.537 | −0.517 |
| Effective pores | −0.565 | −0.144 | 0.418 | −0.210 | 0.007 | −0.355 | −0.604 | 0.629 | |
| Micropores | 0.432 | 0.667 * | 0.211 | 0.281 | 0.208 | 0.408 | −0.354 | −0.272 | |
| θs | −0.169 | −0.793 * | −0.476 | −0.411 | 0.064 | −0.397 | −0.027 | −0.111 | |
| θr | 0.778 * | 0.204 | −0.639 | 0.474 | −0.192 | 0.553 | 0.838 ** | −0.873 ** | |
| α | 0.479 | 0.562 | 0.147 | 0.139 | 0.413 | 0.331 | 0.432 | −0.379 | |
| n | 0.082 | −0.620 | −0.589 | −0.244 | 0.007 | −0.183 | 0.218 | −0.345 |
** Extremely significant correlation in 0.01 level (bilateral); * Significant correlation in 0.05 level (bilateral).
Table 6.
Statistical comparisons of soil physical properties (two-way ANOVA) between the four soil types (T), three irrigation modes (M), and their interactions (T × M).
Table 6.
Statistical comparisons of soil physical properties (two-way ANOVA) between the four soil types (T), three irrigation modes (M), and their interactions (T × M).
| Ks | Soil Pores | VG model Parameter | ||||||
|---|---|---|---|---|---|---|---|---|
| Macropores | Effective Pores | Micropores | θs | θr | α | n | ||
| T | 2611.6 ** | 391.8 ** | 28.6 ** | 319.1 ** | 126.0 ** | 4241.5 ** | 42410.6 ** | 11.2 ** |
| M | 15.4 ** | 71.6 * | 6.5 * | 35.2 ** | 1.1 | 292.7 ** | 5832.7 ** | 1.4 |
| T × M | 15.6 ** | 65.9 ** | 19.1 ** | 37.6 ** | 2.2 ** | 75.9 ** | 2230.8 ** | 1.0 |
** Extremely significant correlated in 0.01 level (bilateral); * Significant correlated in 0.05 level (bilateral).
Publisher’s Note: MDPI stays neutral with regard to jurisdictional claims in published maps and institutional affiliations. |
© 2022 by the authors. Licensee MDPI, Basel, Switzerland. This article is an open access article distributed under the terms and conditions of the Creative Commons Attribution (CC BY) license (https://creativecommons.org/licenses/by/4.0/).
Share and Cite
MDPI and ACS Style
Lu, J.; Wang, H.; Hu, C. Changes in Physicochemical Properties of Typical Subtropical Soils under Different Treated Domestic Wastewater Irrigation Modes. Sustainability 2022, 14, 10197. https://doi.org/10.3390/su141610197
AMA Style
Lu J, Wang H, Hu C. Changes in Physicochemical Properties of Typical Subtropical Soils under Different Treated Domestic Wastewater Irrigation Modes. Sustainability. 2022; 14(16):10197. https://doi.org/10.3390/su141610197
Chicago/Turabian StyleLu, Jiayu, Hui Wang, and Chuanwang Hu. 2022. "Changes in Physicochemical Properties of Typical Subtropical Soils under Different Treated Domestic Wastewater Irrigation Modes" Sustainability 14, no. 16: 10197. https://doi.org/10.3390/su141610197
Note that from the first issue of 2016, this journal uses article numbers instead of page numbers. See further details here.