
A Multitemporal and Multilevel Land Surface Temperature Regional Attribute Change Analysis in Henan, China, Using MODIS Imagery

 ,
,
Abstract
:1. Introduction
2. Materials and Methods
2.1. Study Area
2.2. Data
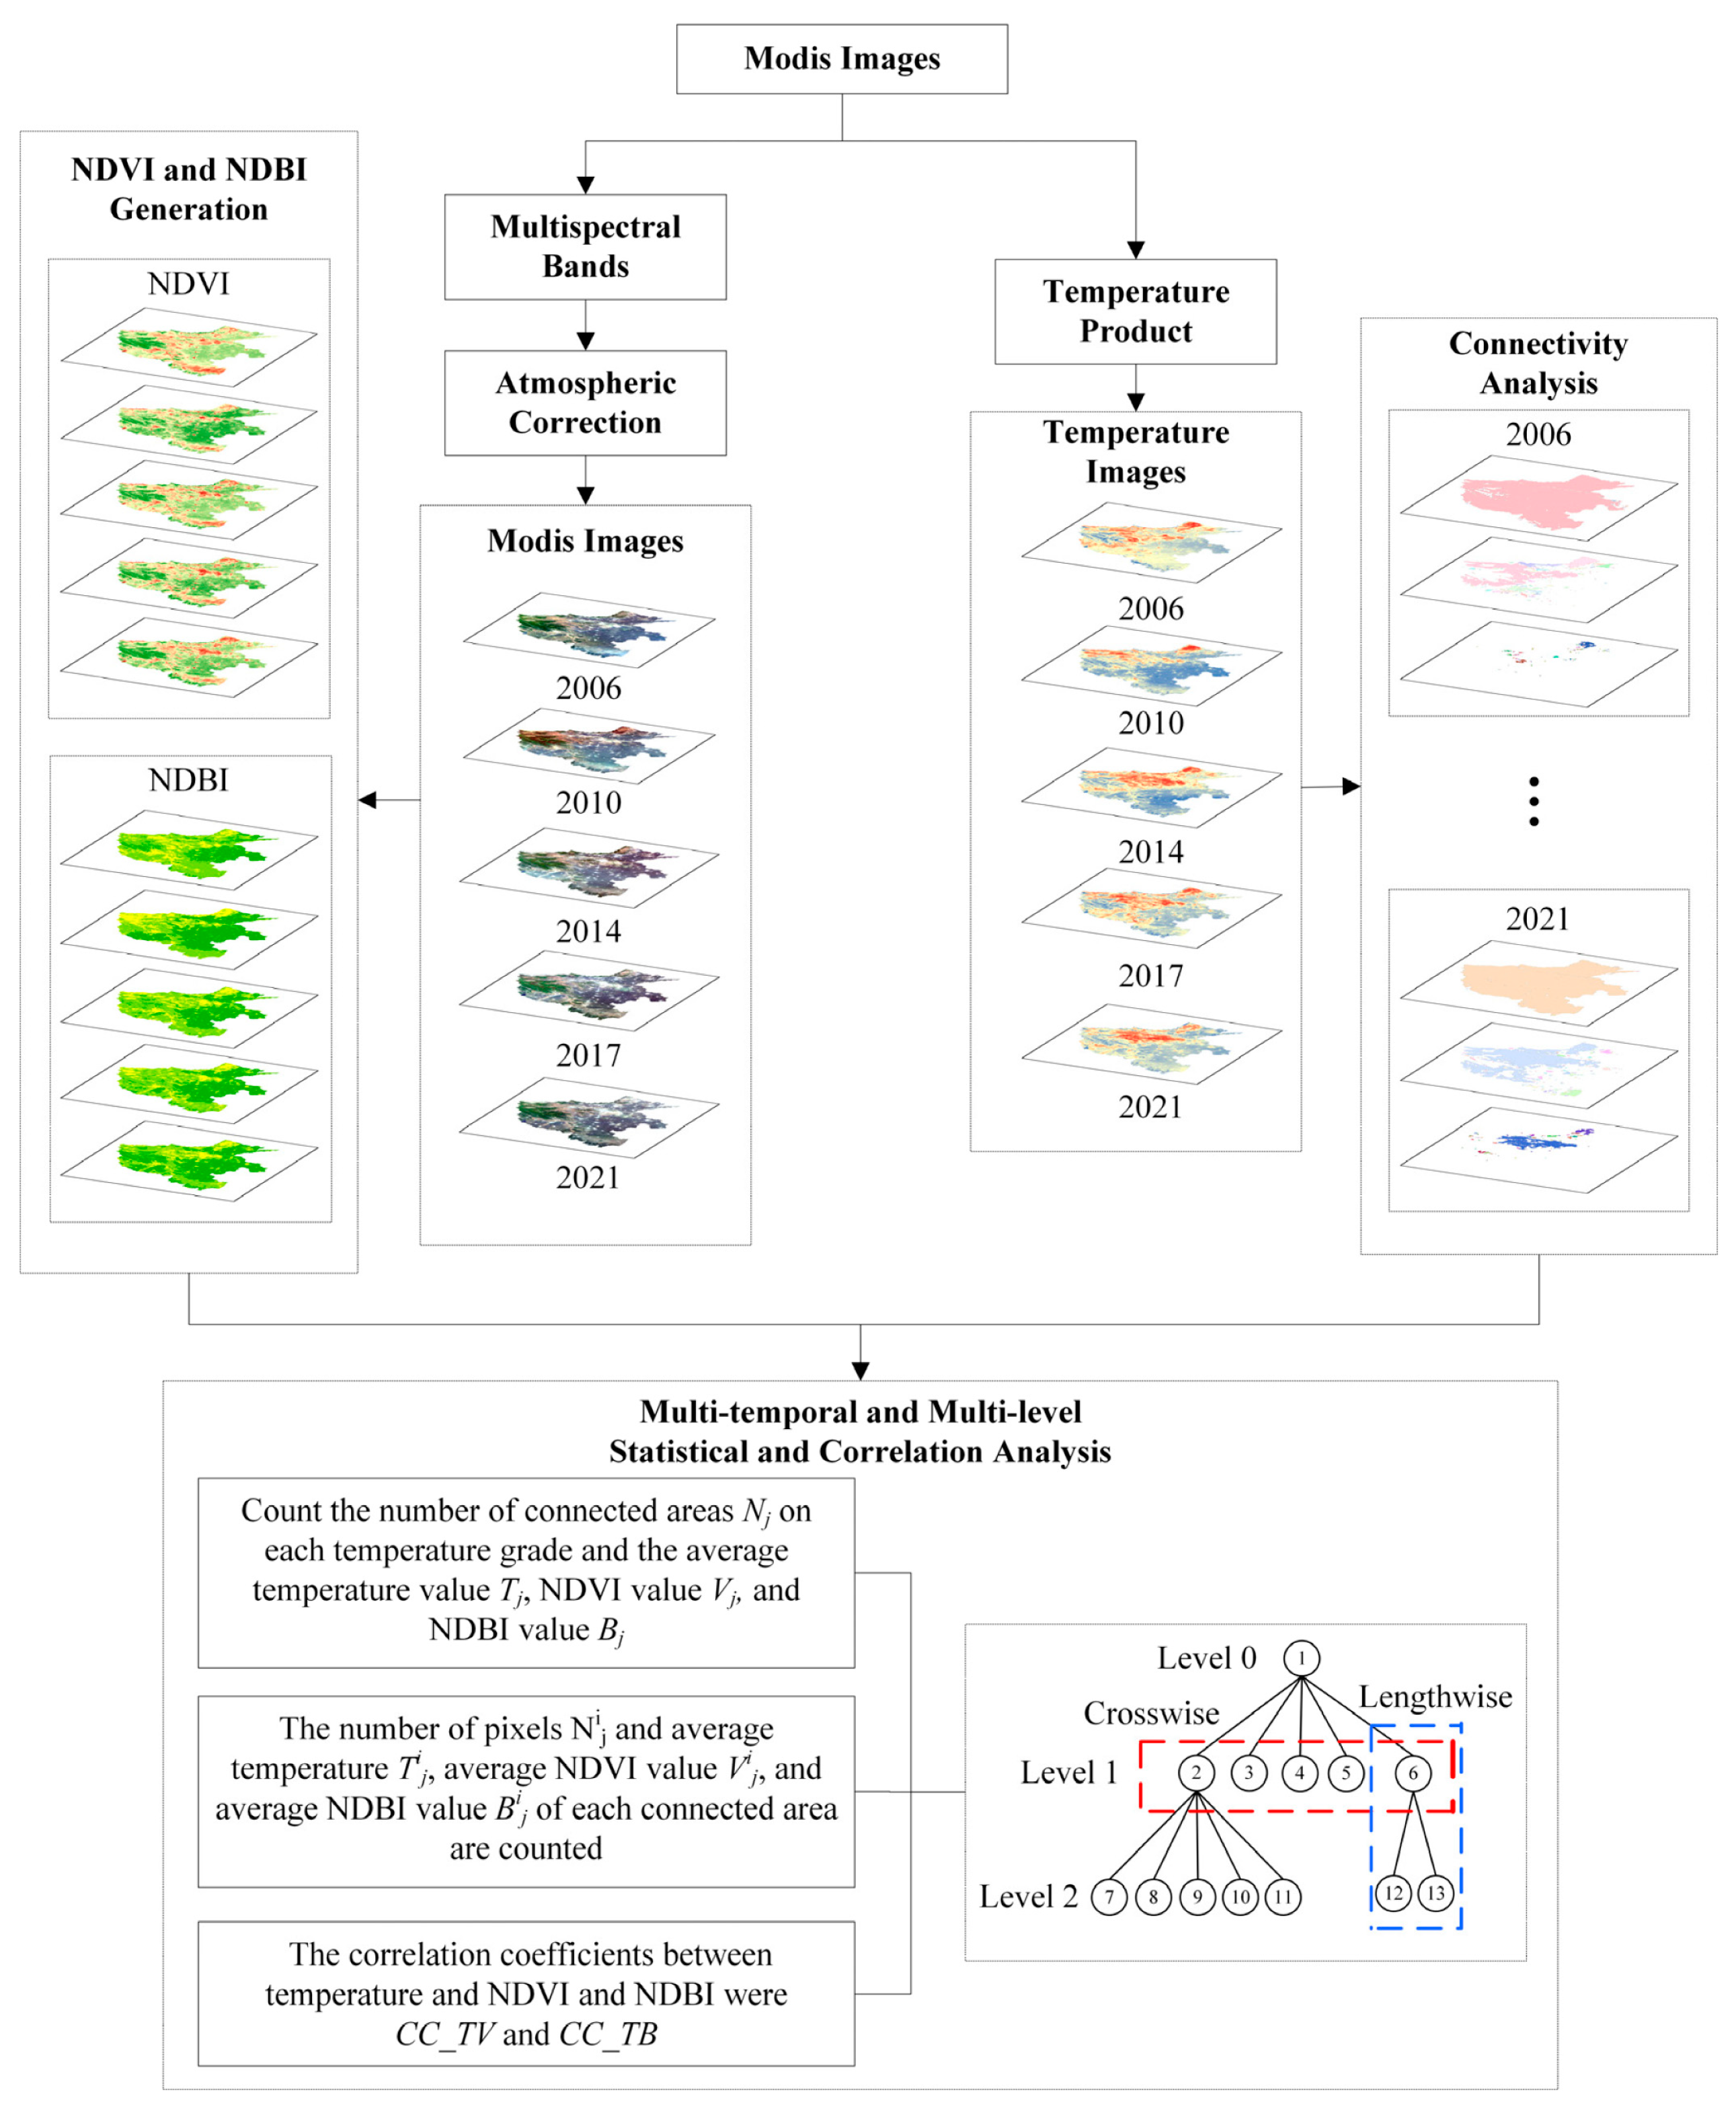
2.3. Methods
2.3.1. LST, NDVI, and NDBI Generated from MODIS Data
2.3.2. Connectivity Analysis of LST Data
2.3.3. MTML Attribute Information Statistics and Correlation Analyses
3. Results
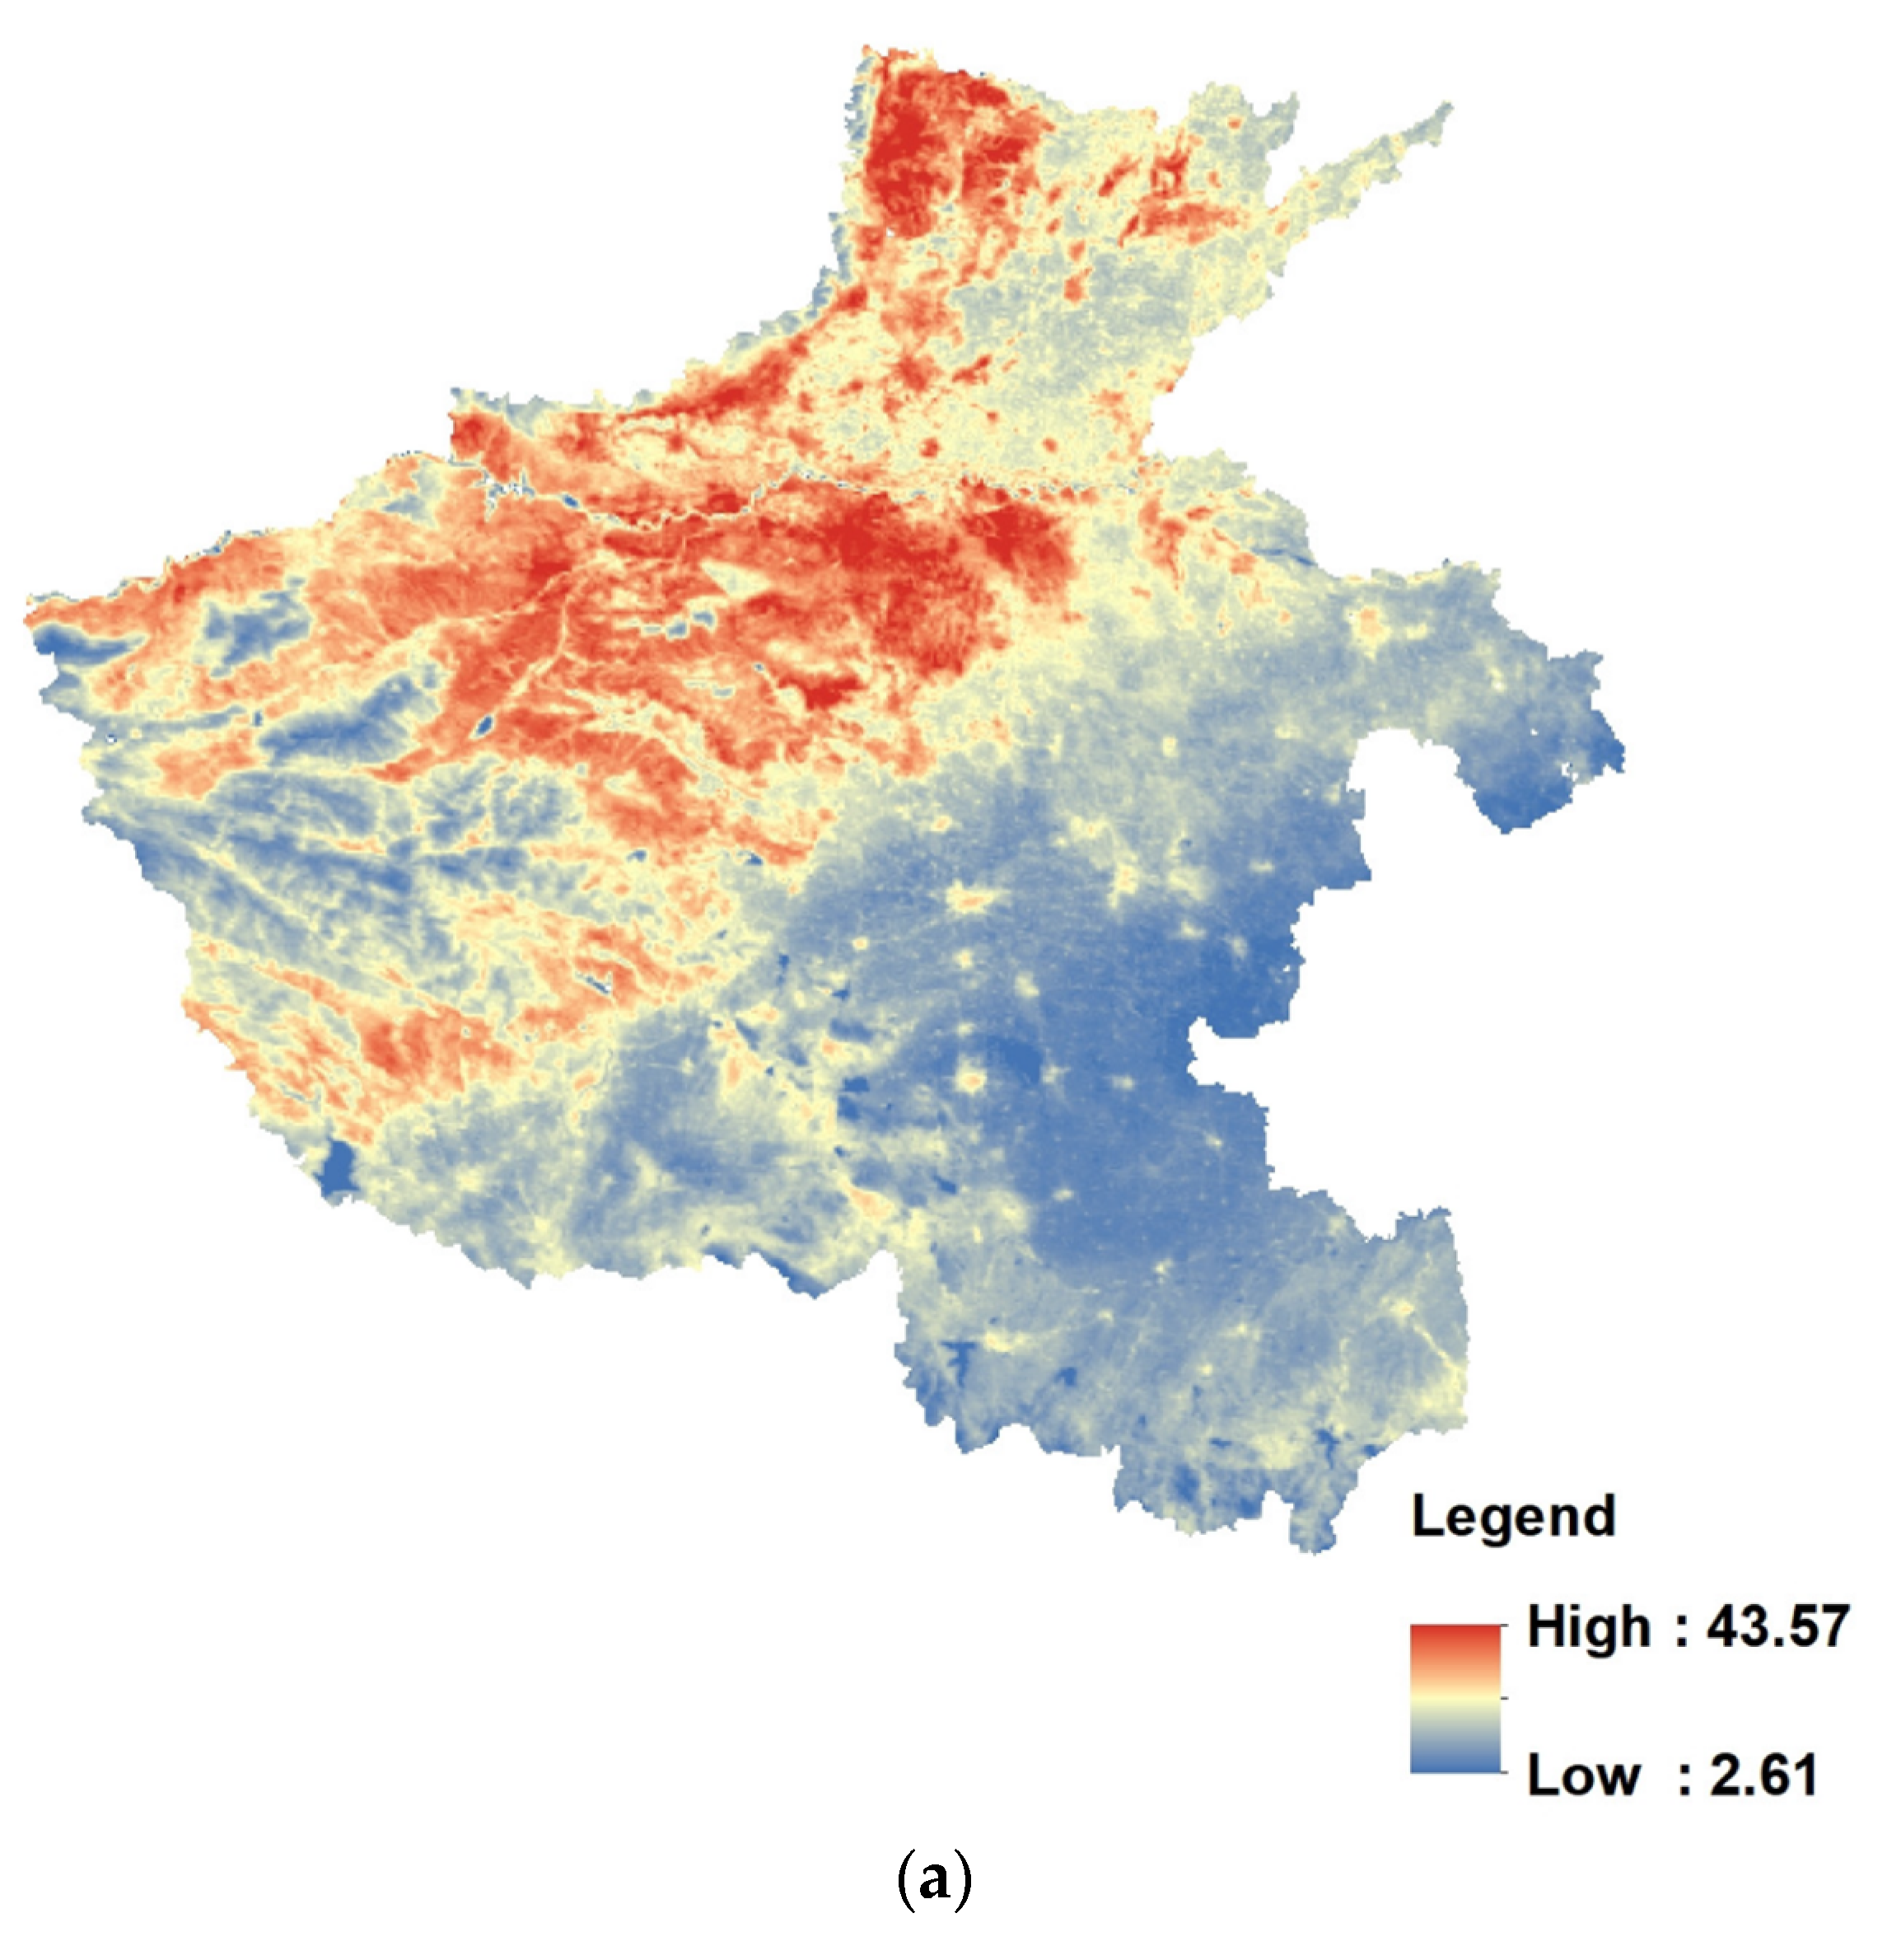
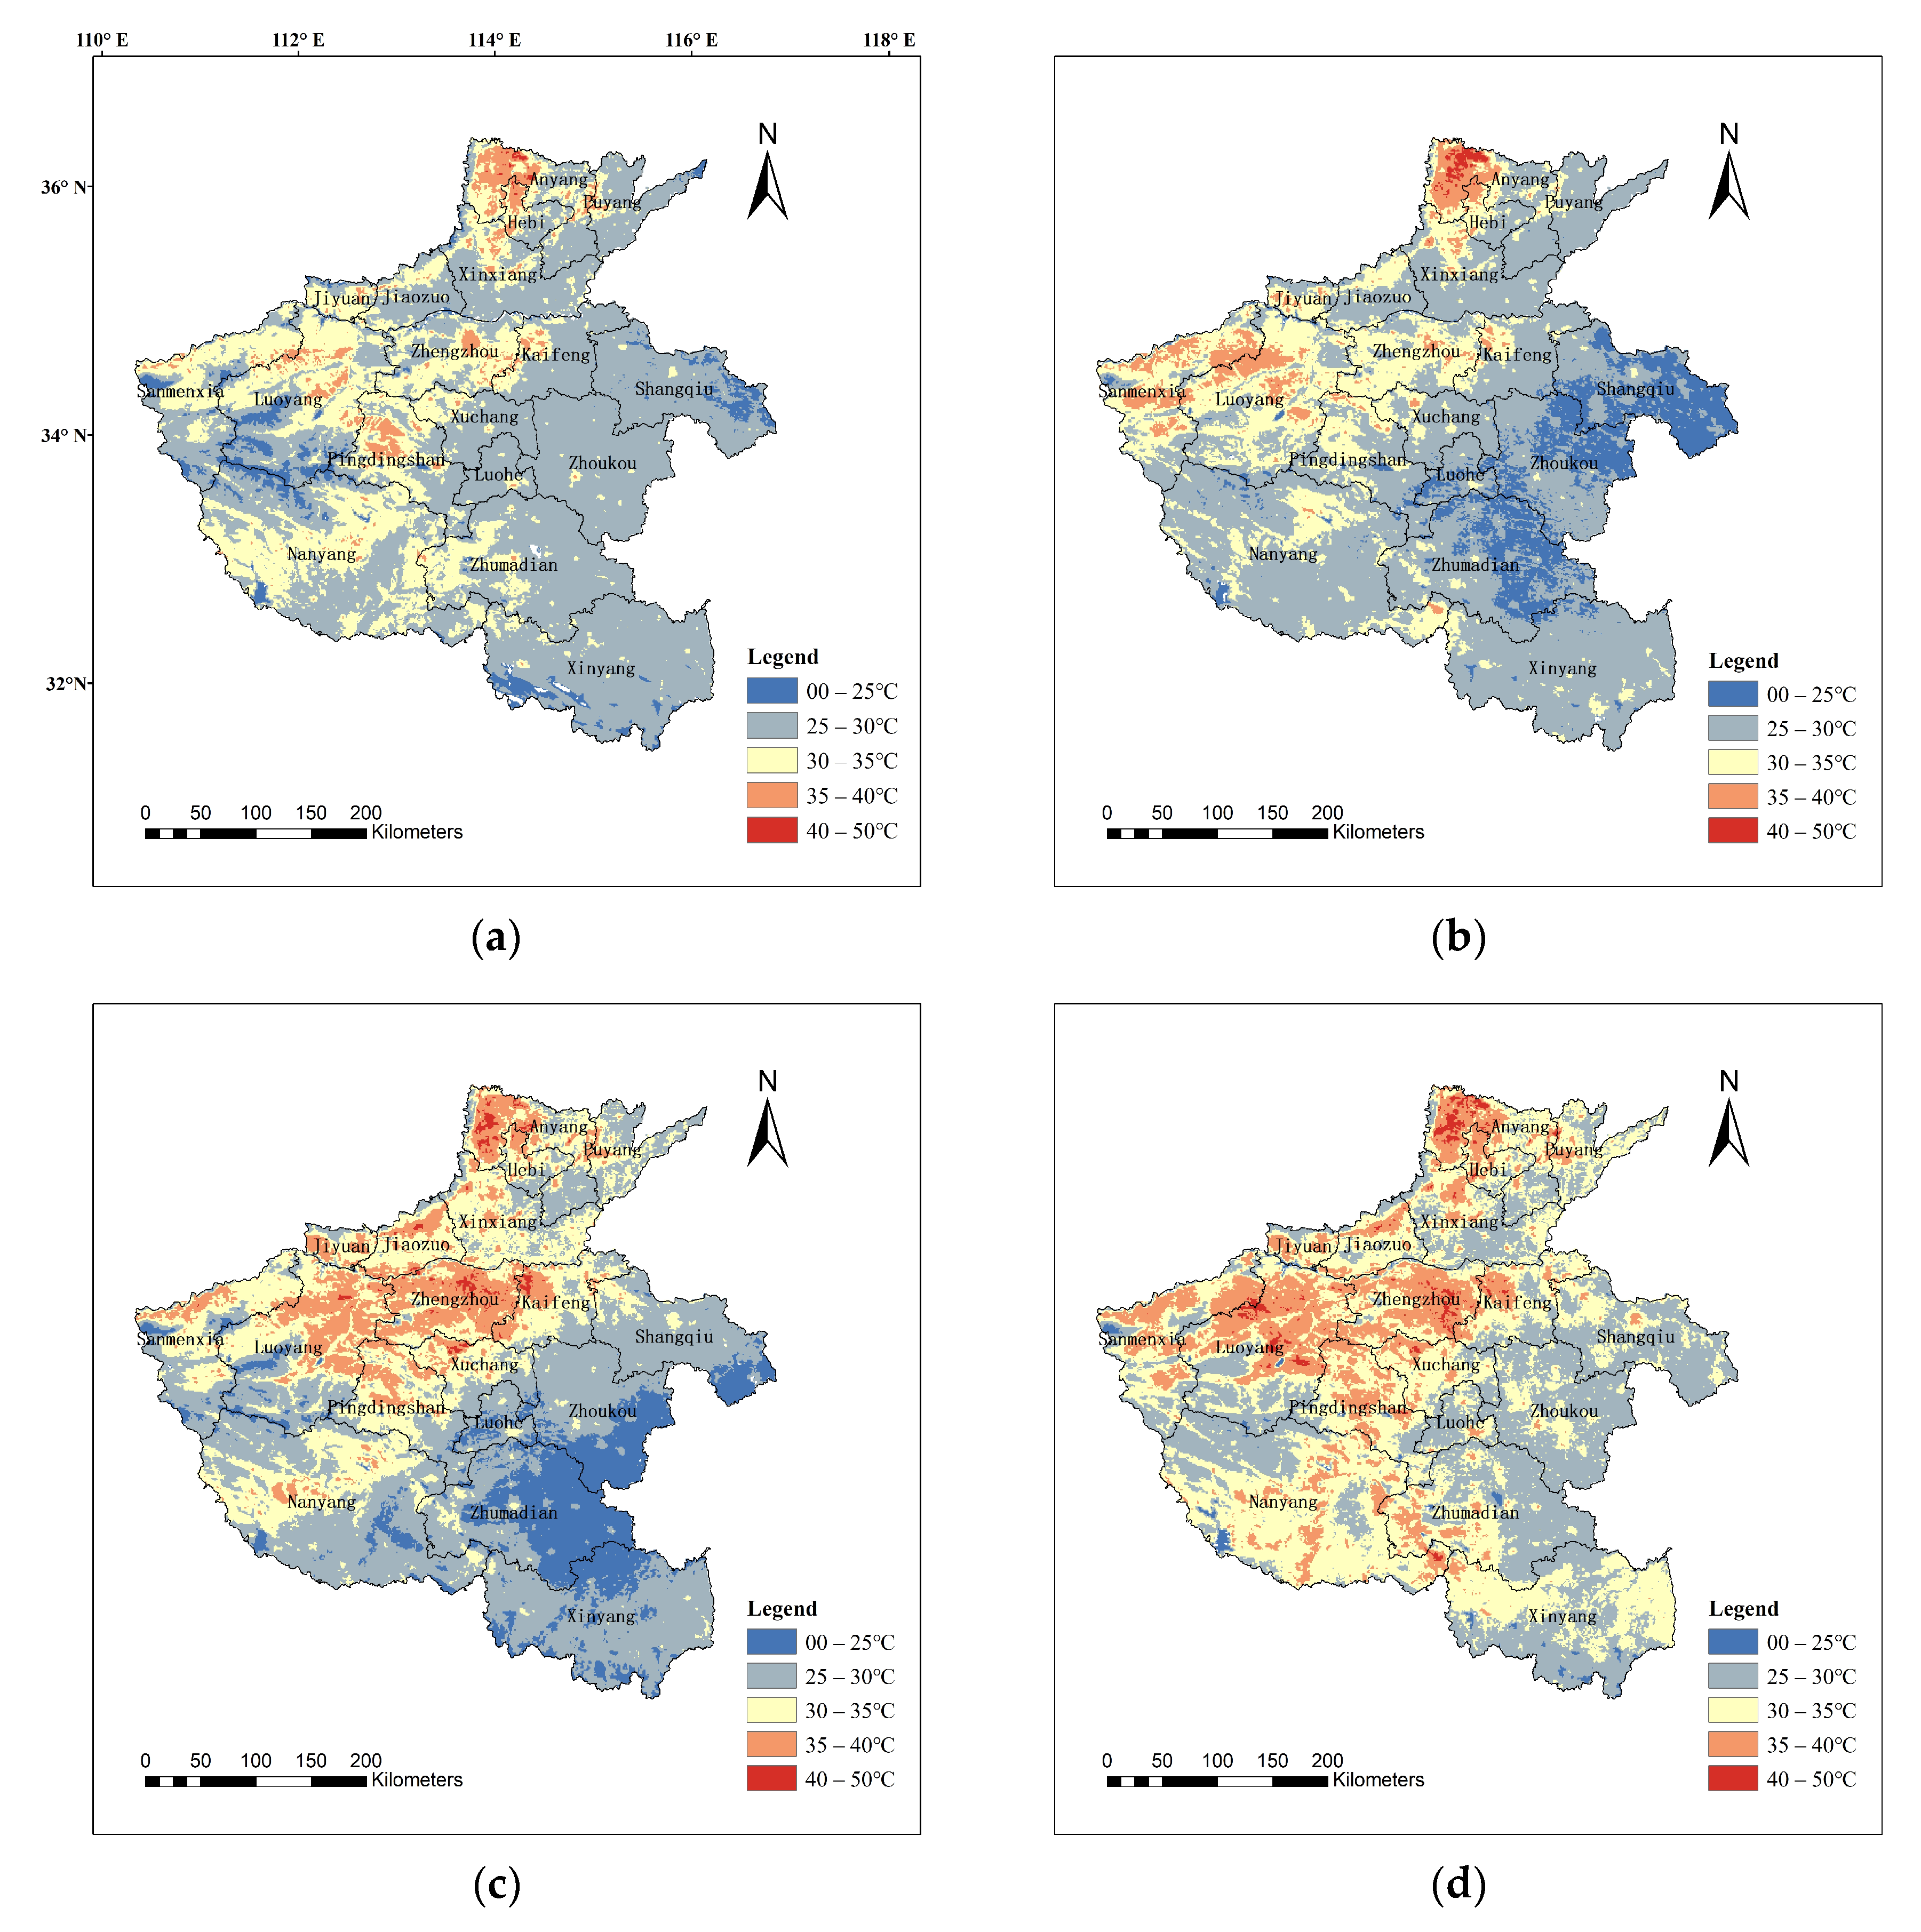
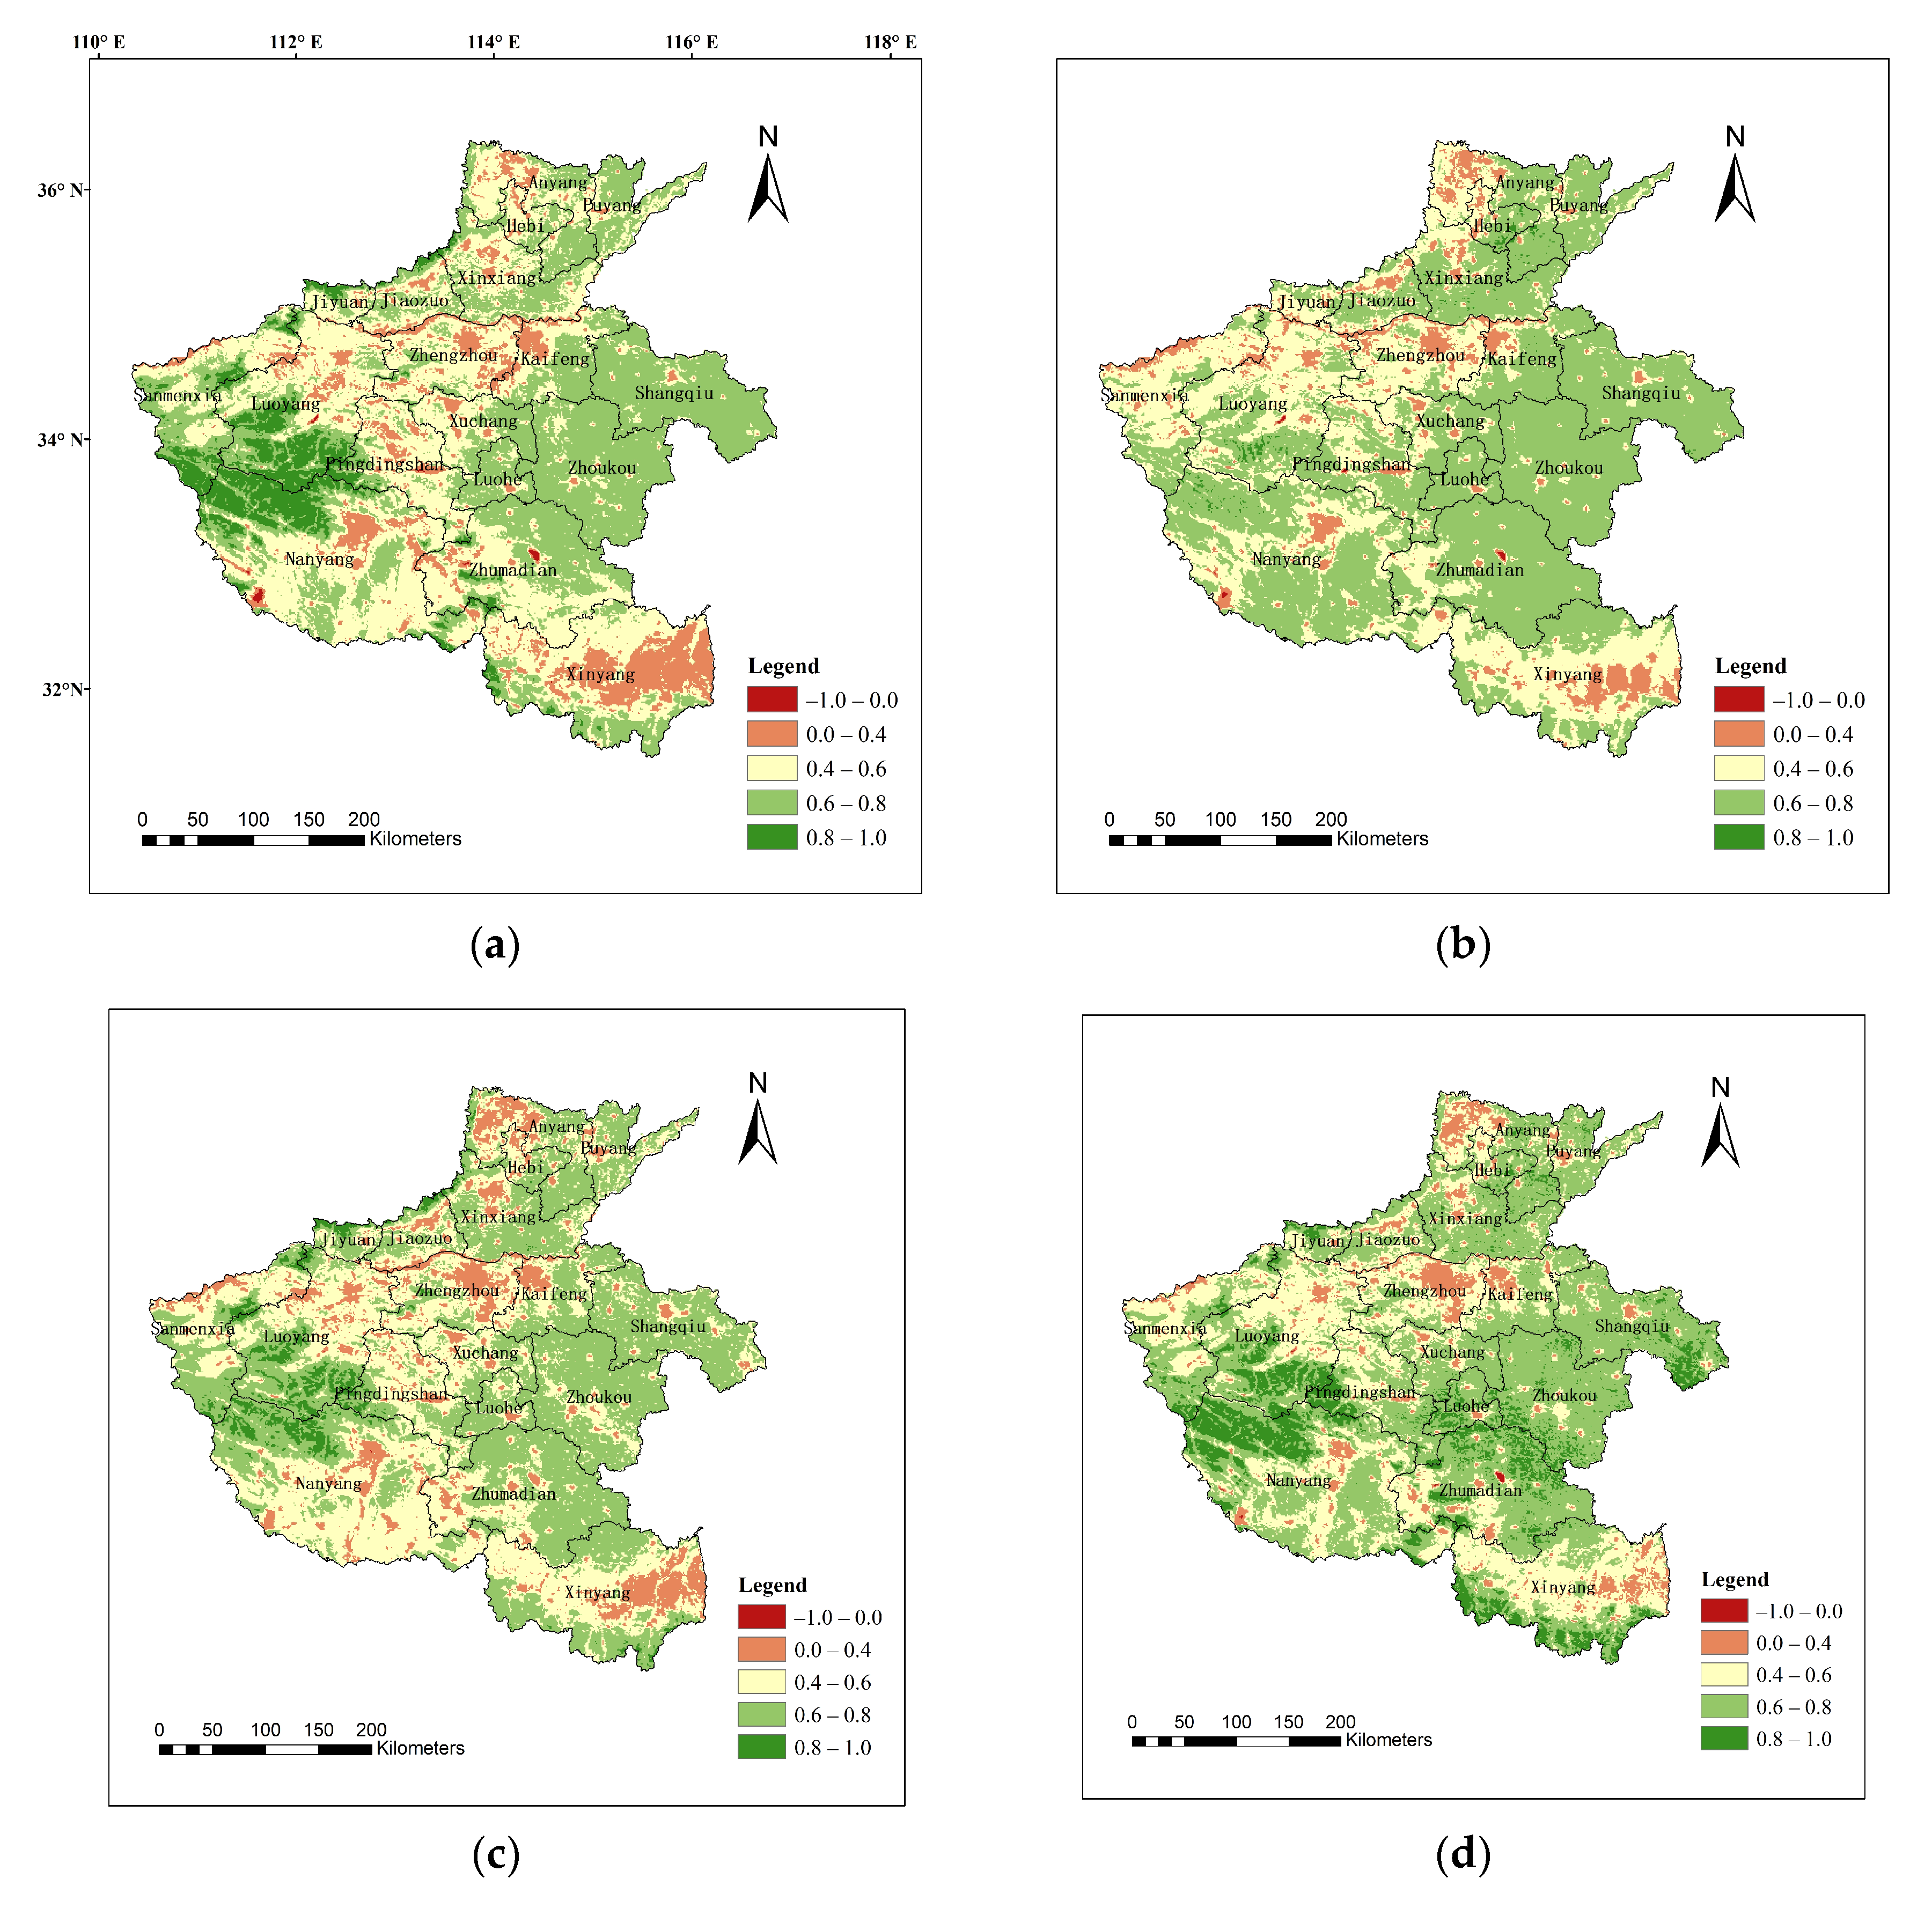
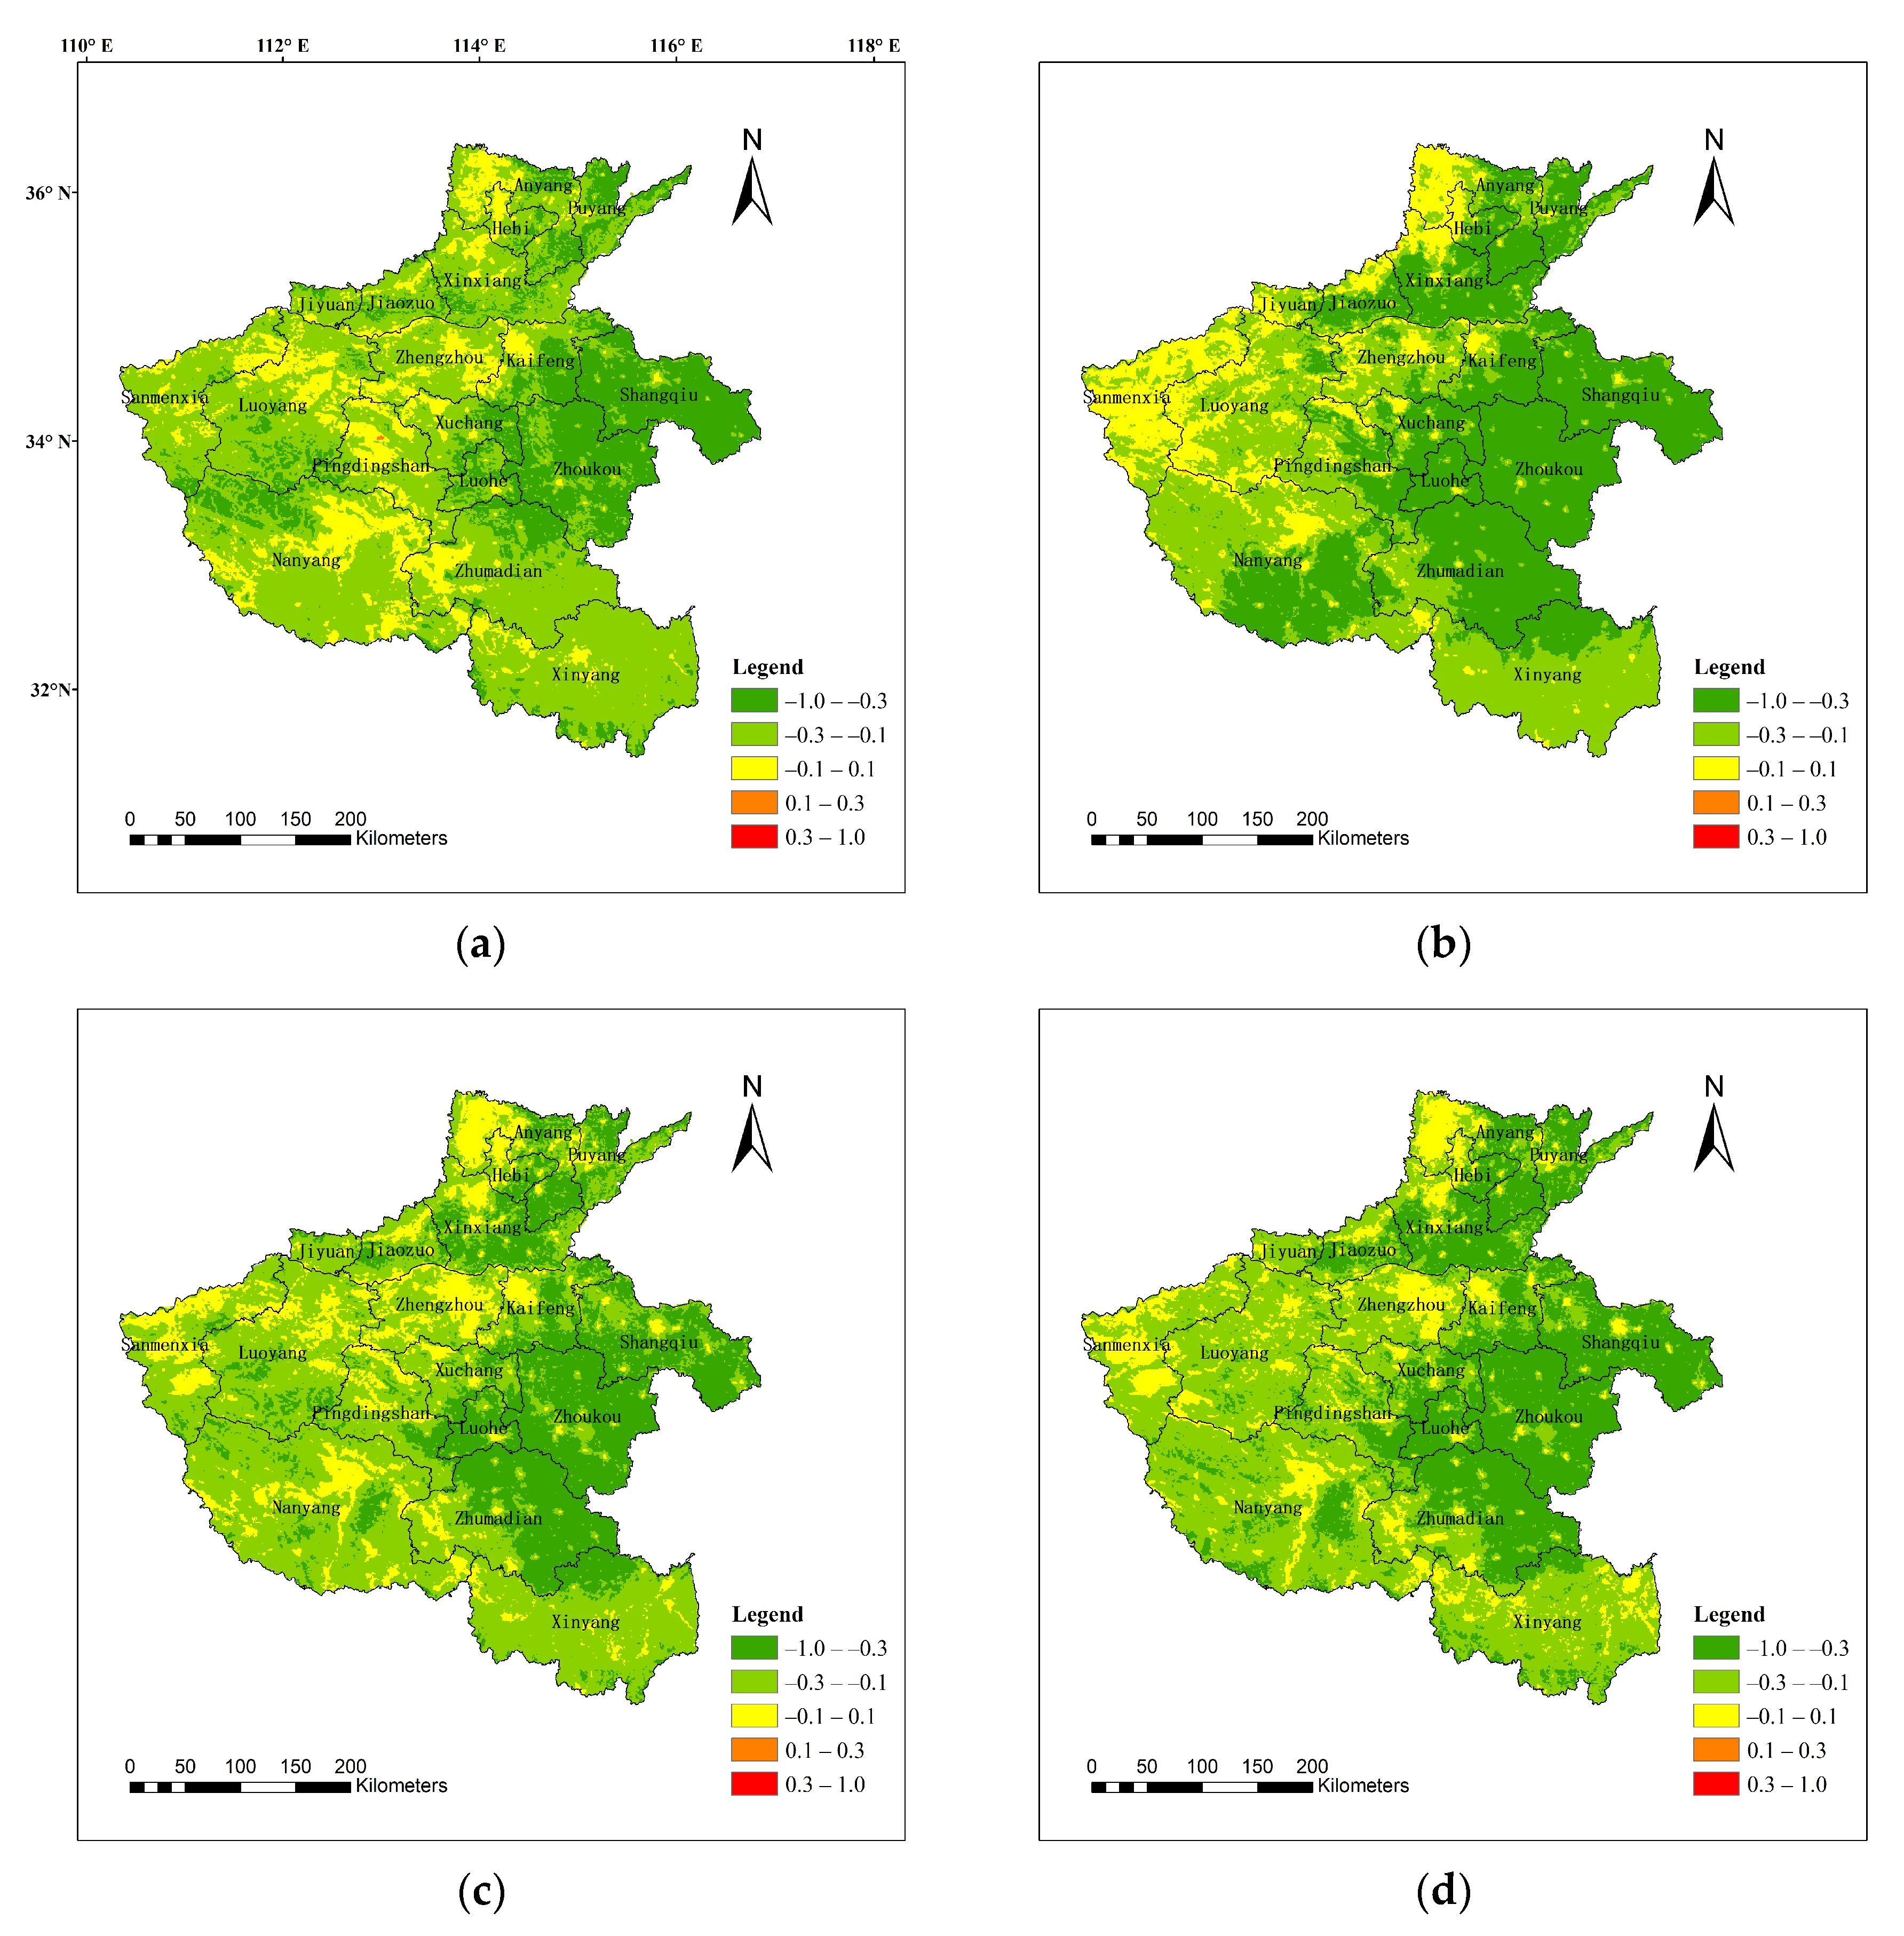
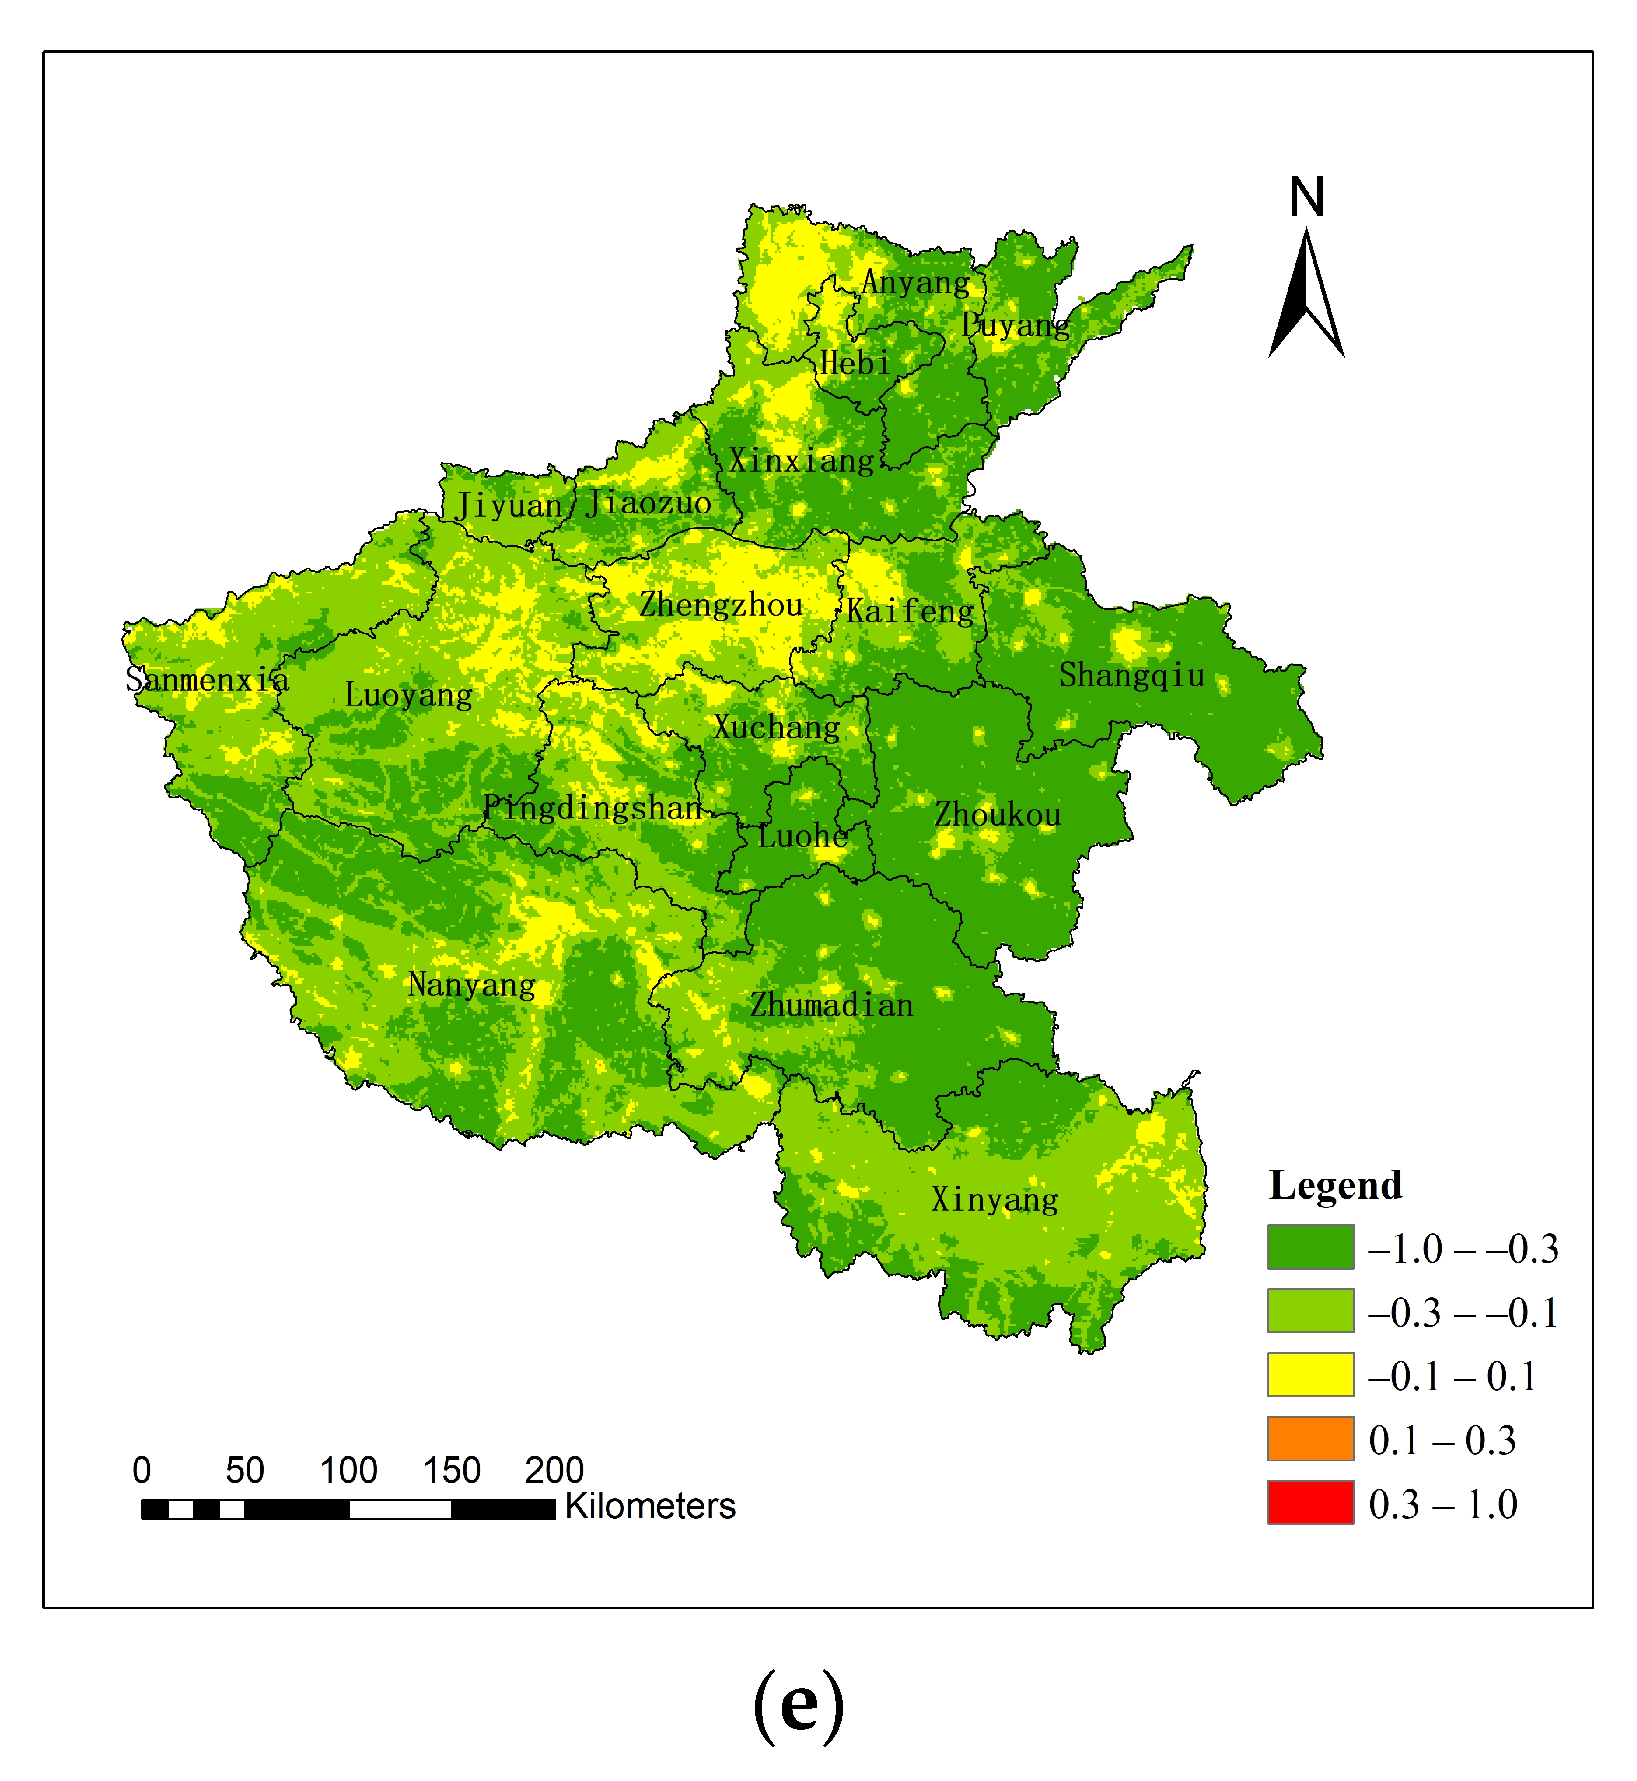
3.1. LST and Feature-Type Index Values Generated from MODIS Data
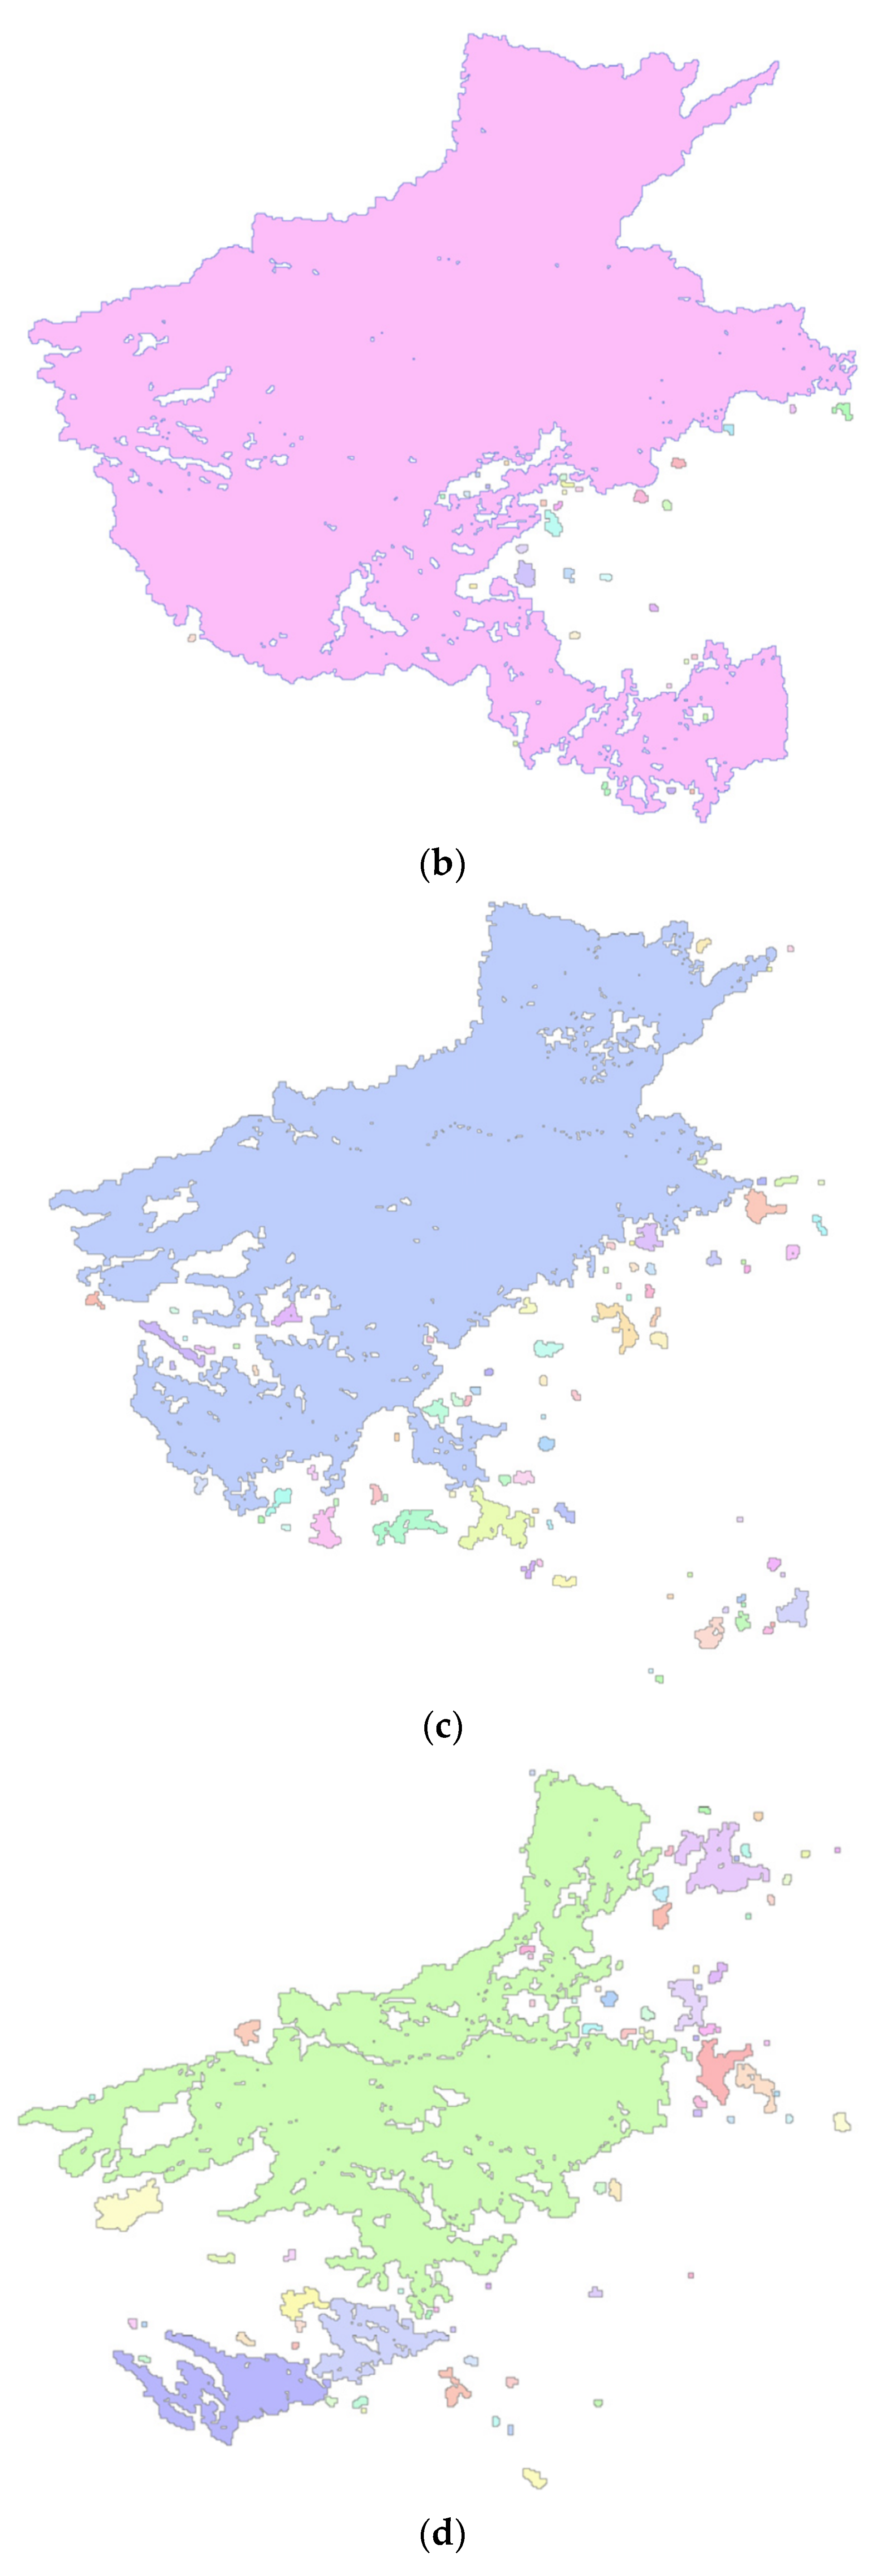
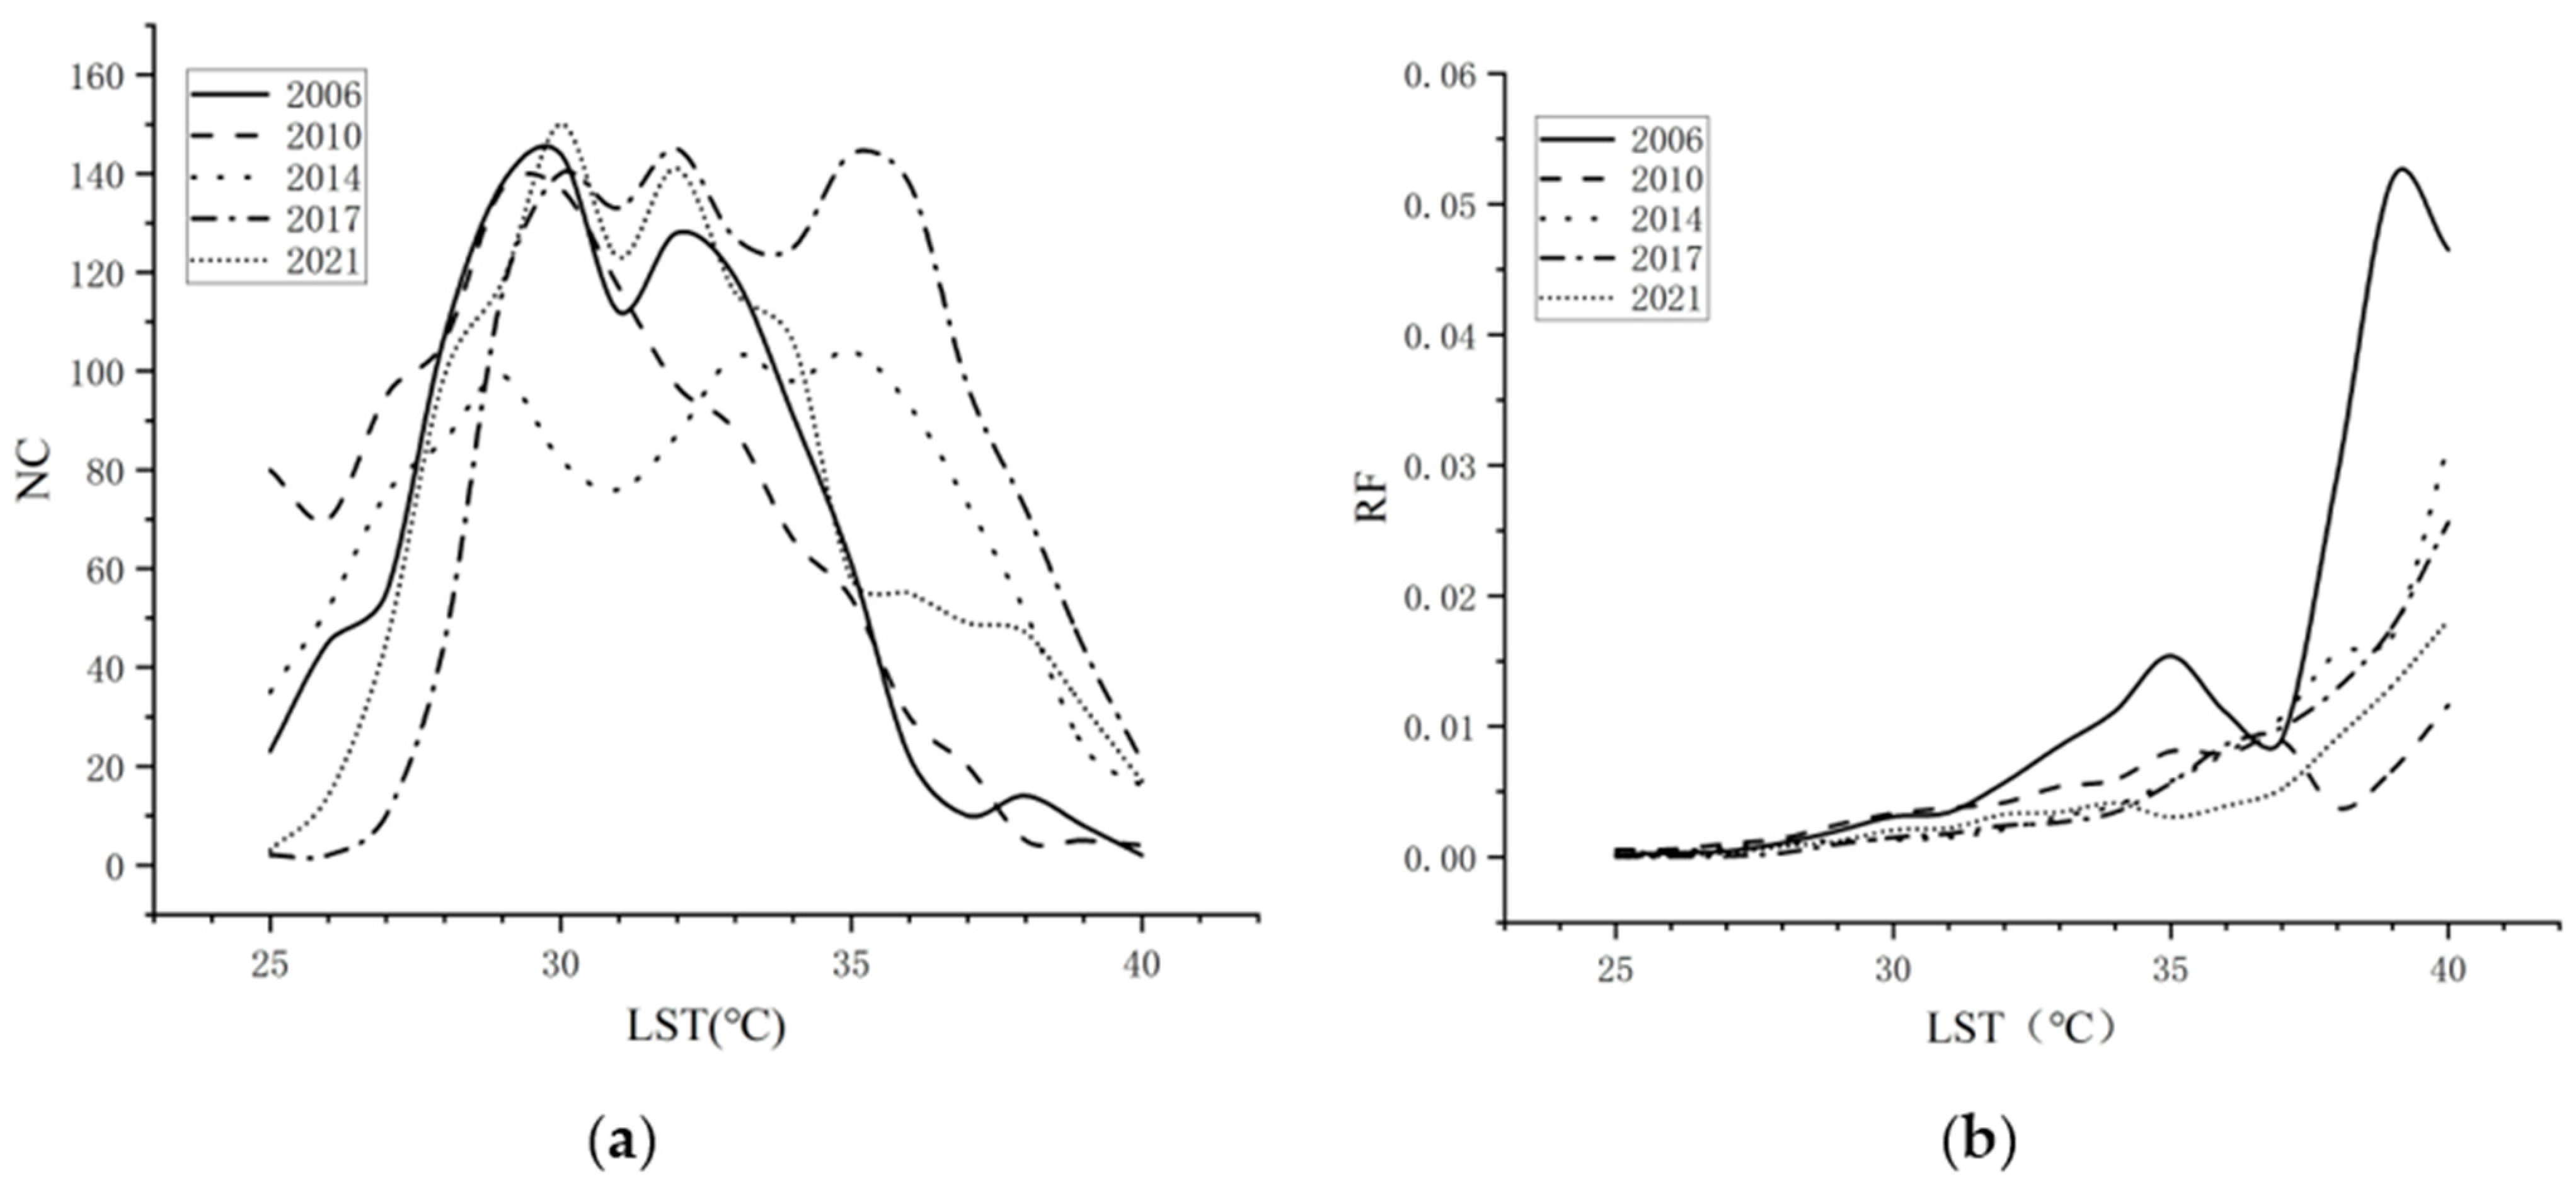
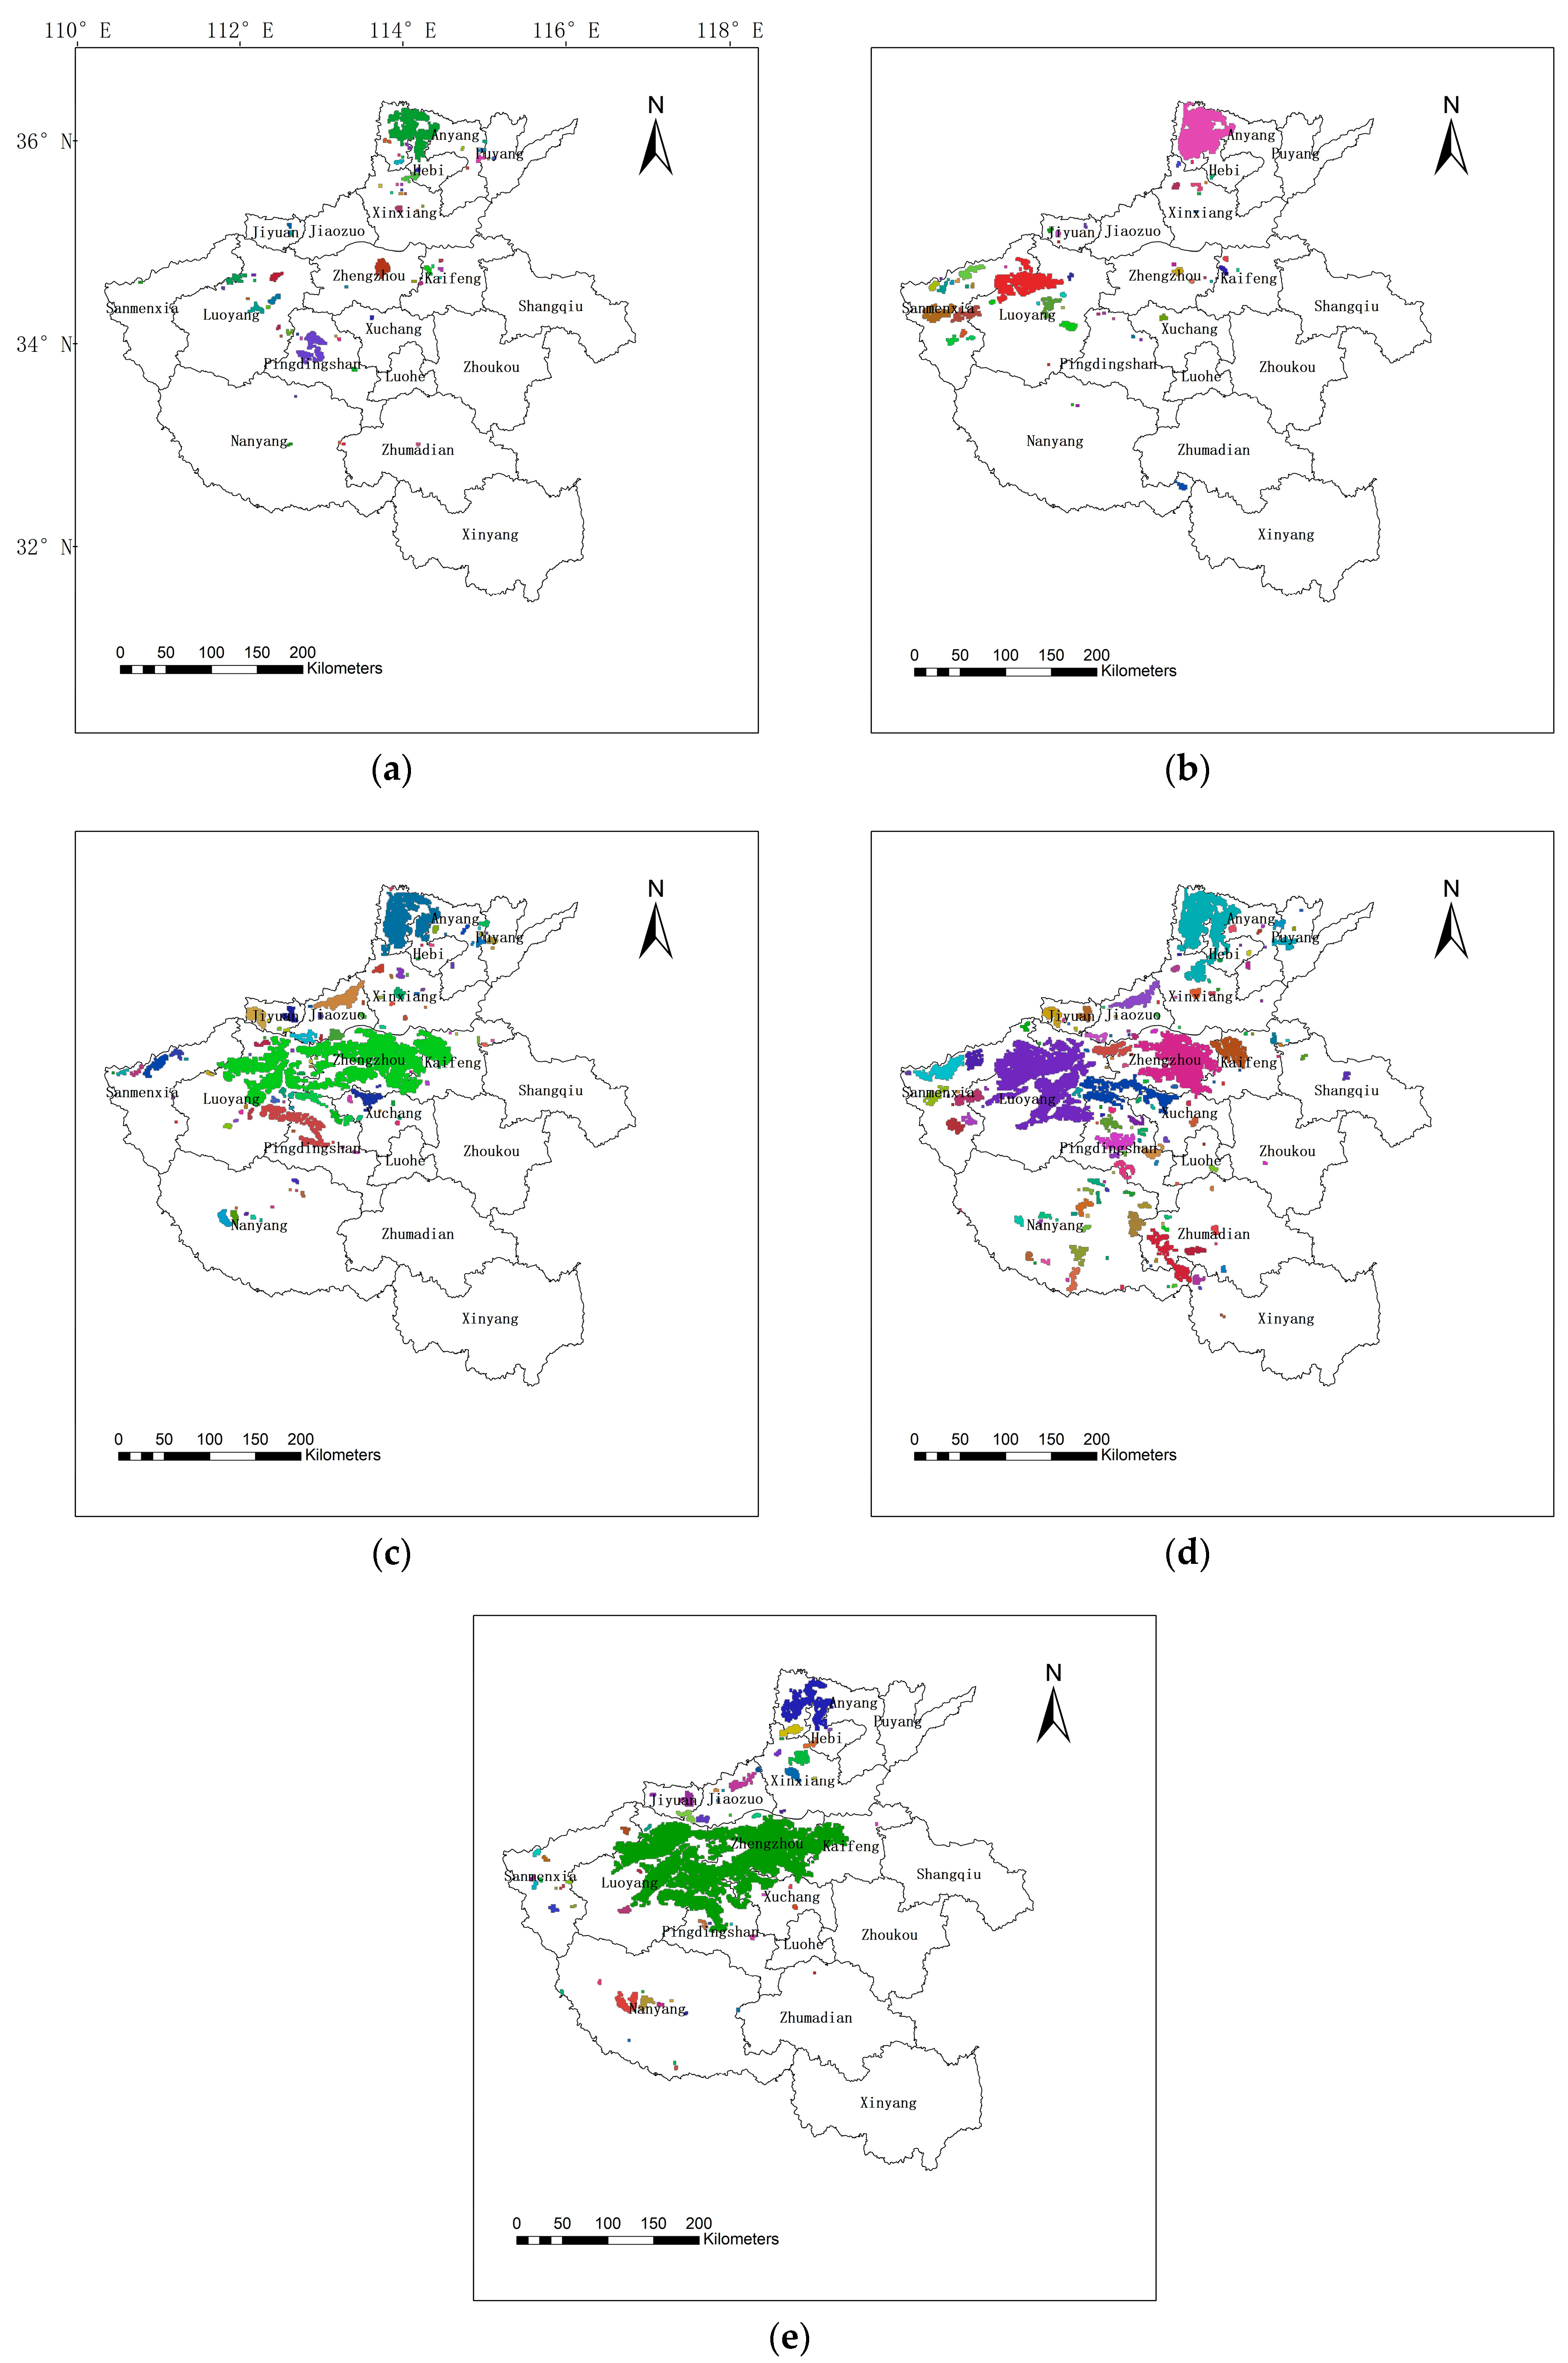
3.2. Connectivity Analysis of LST Data
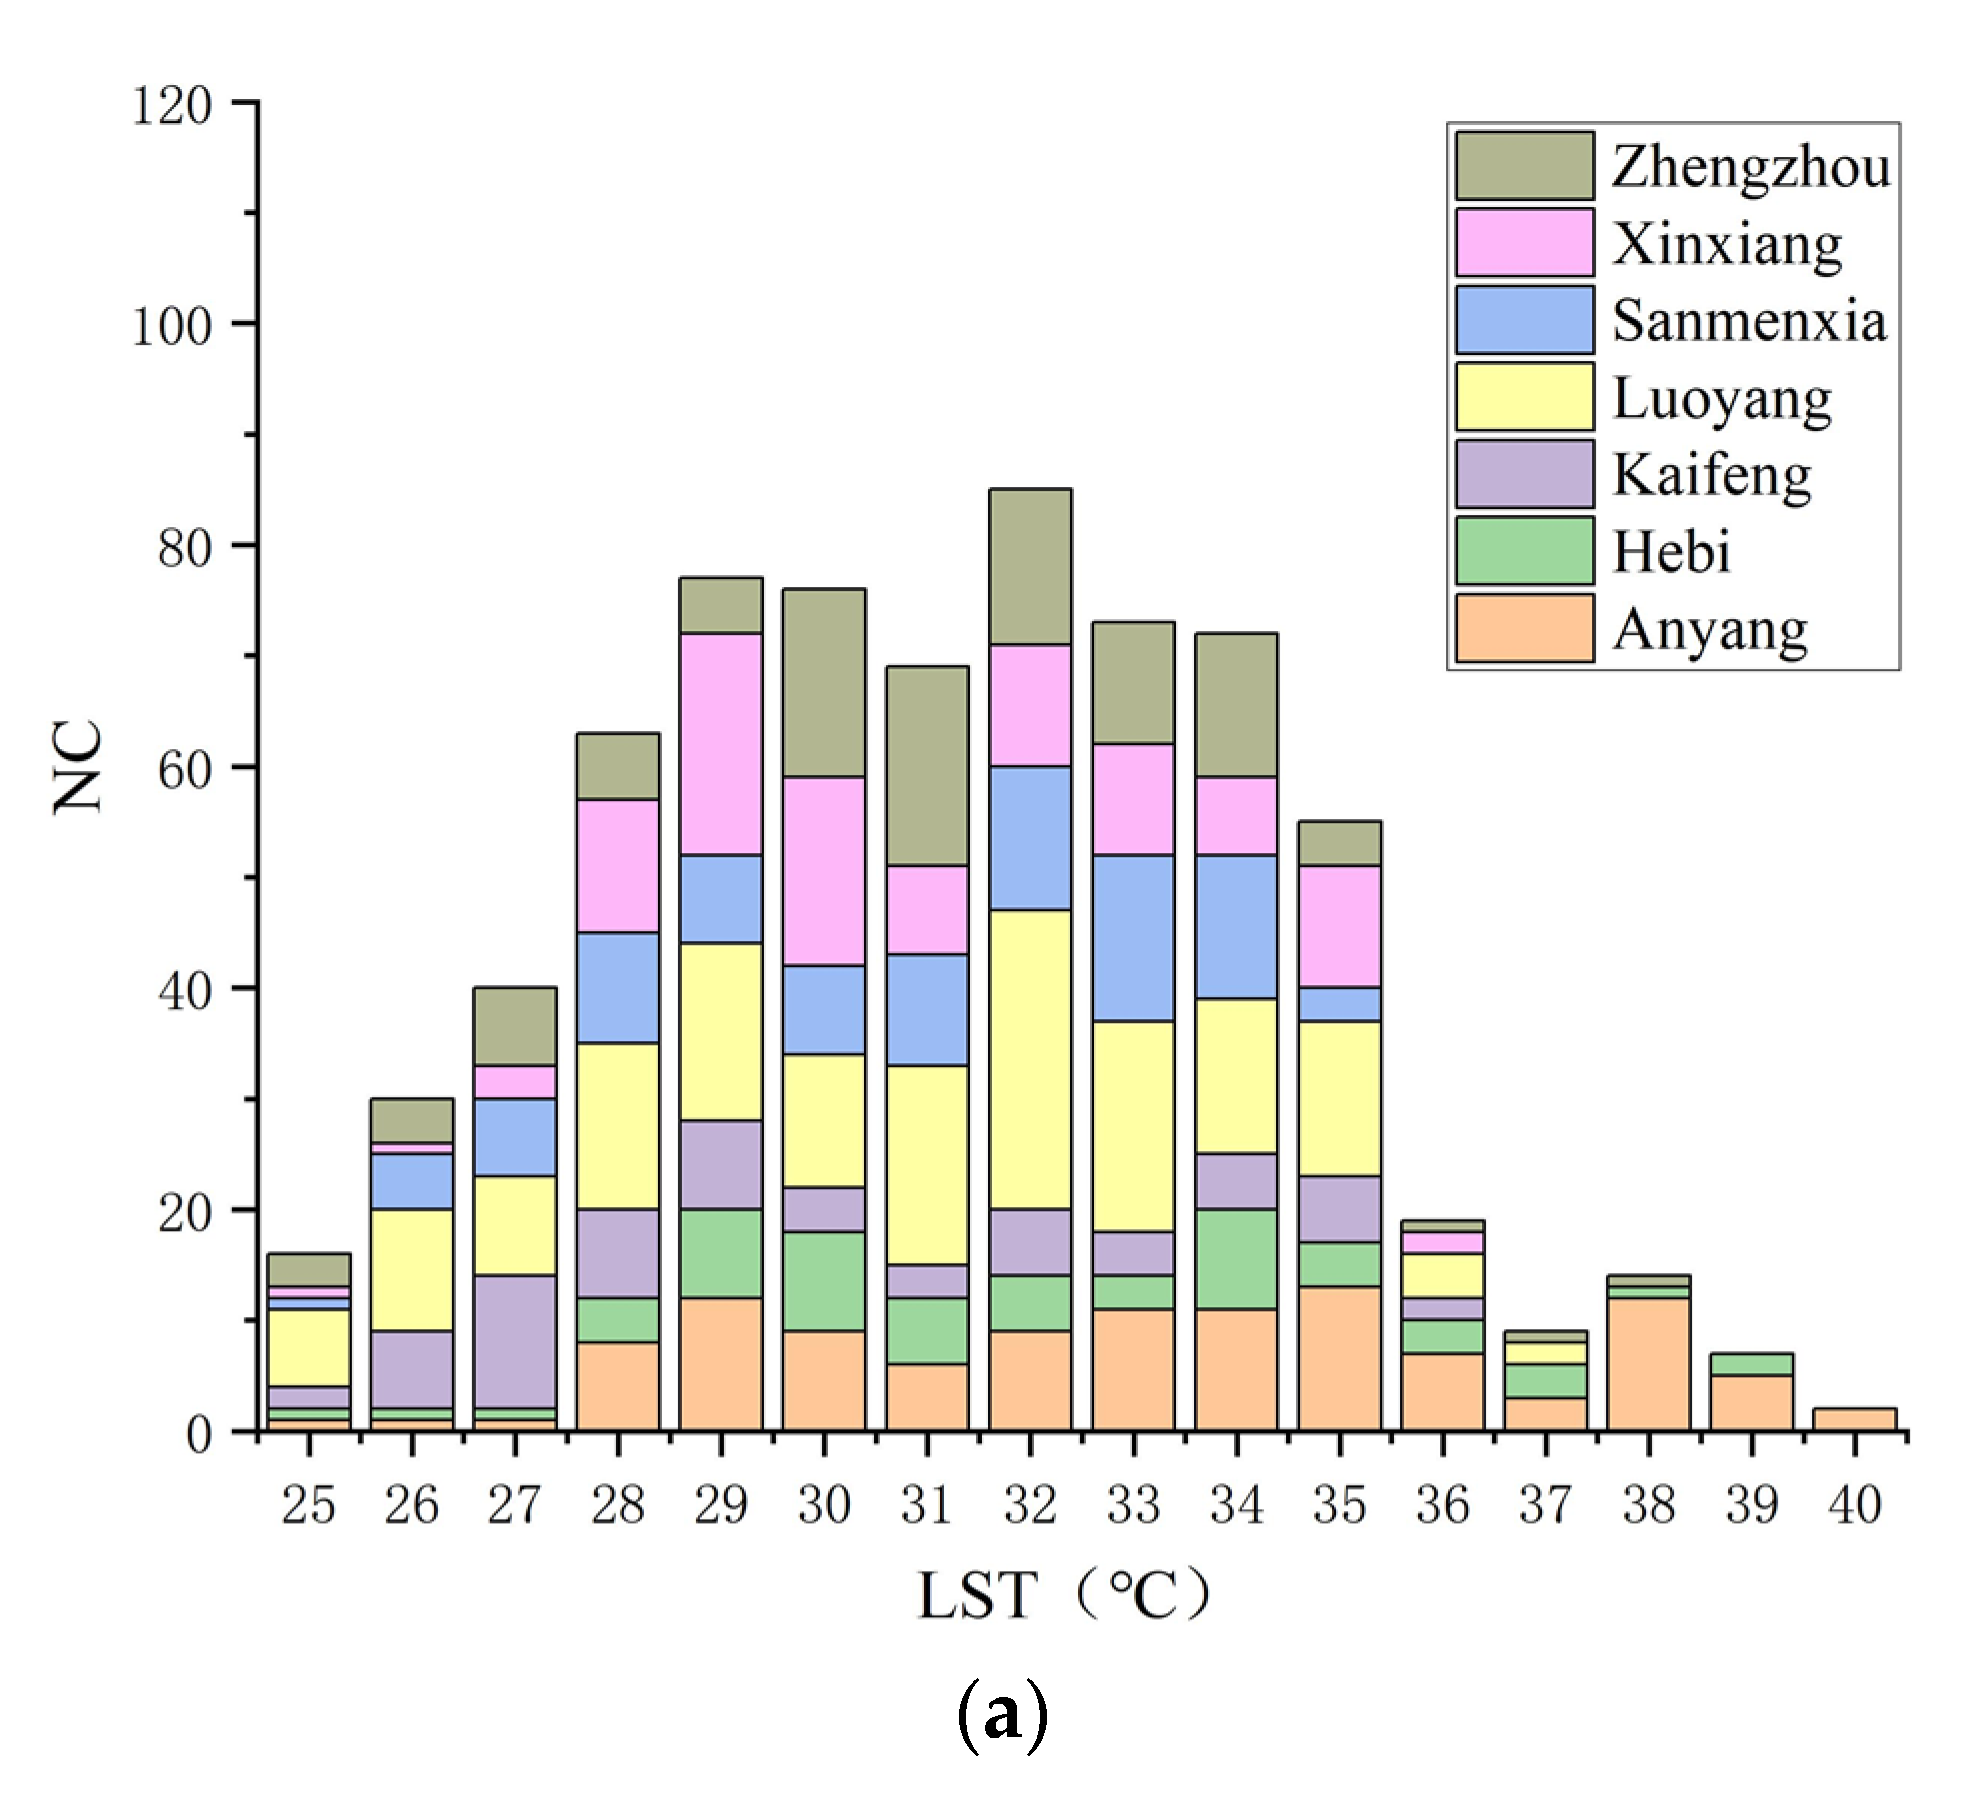
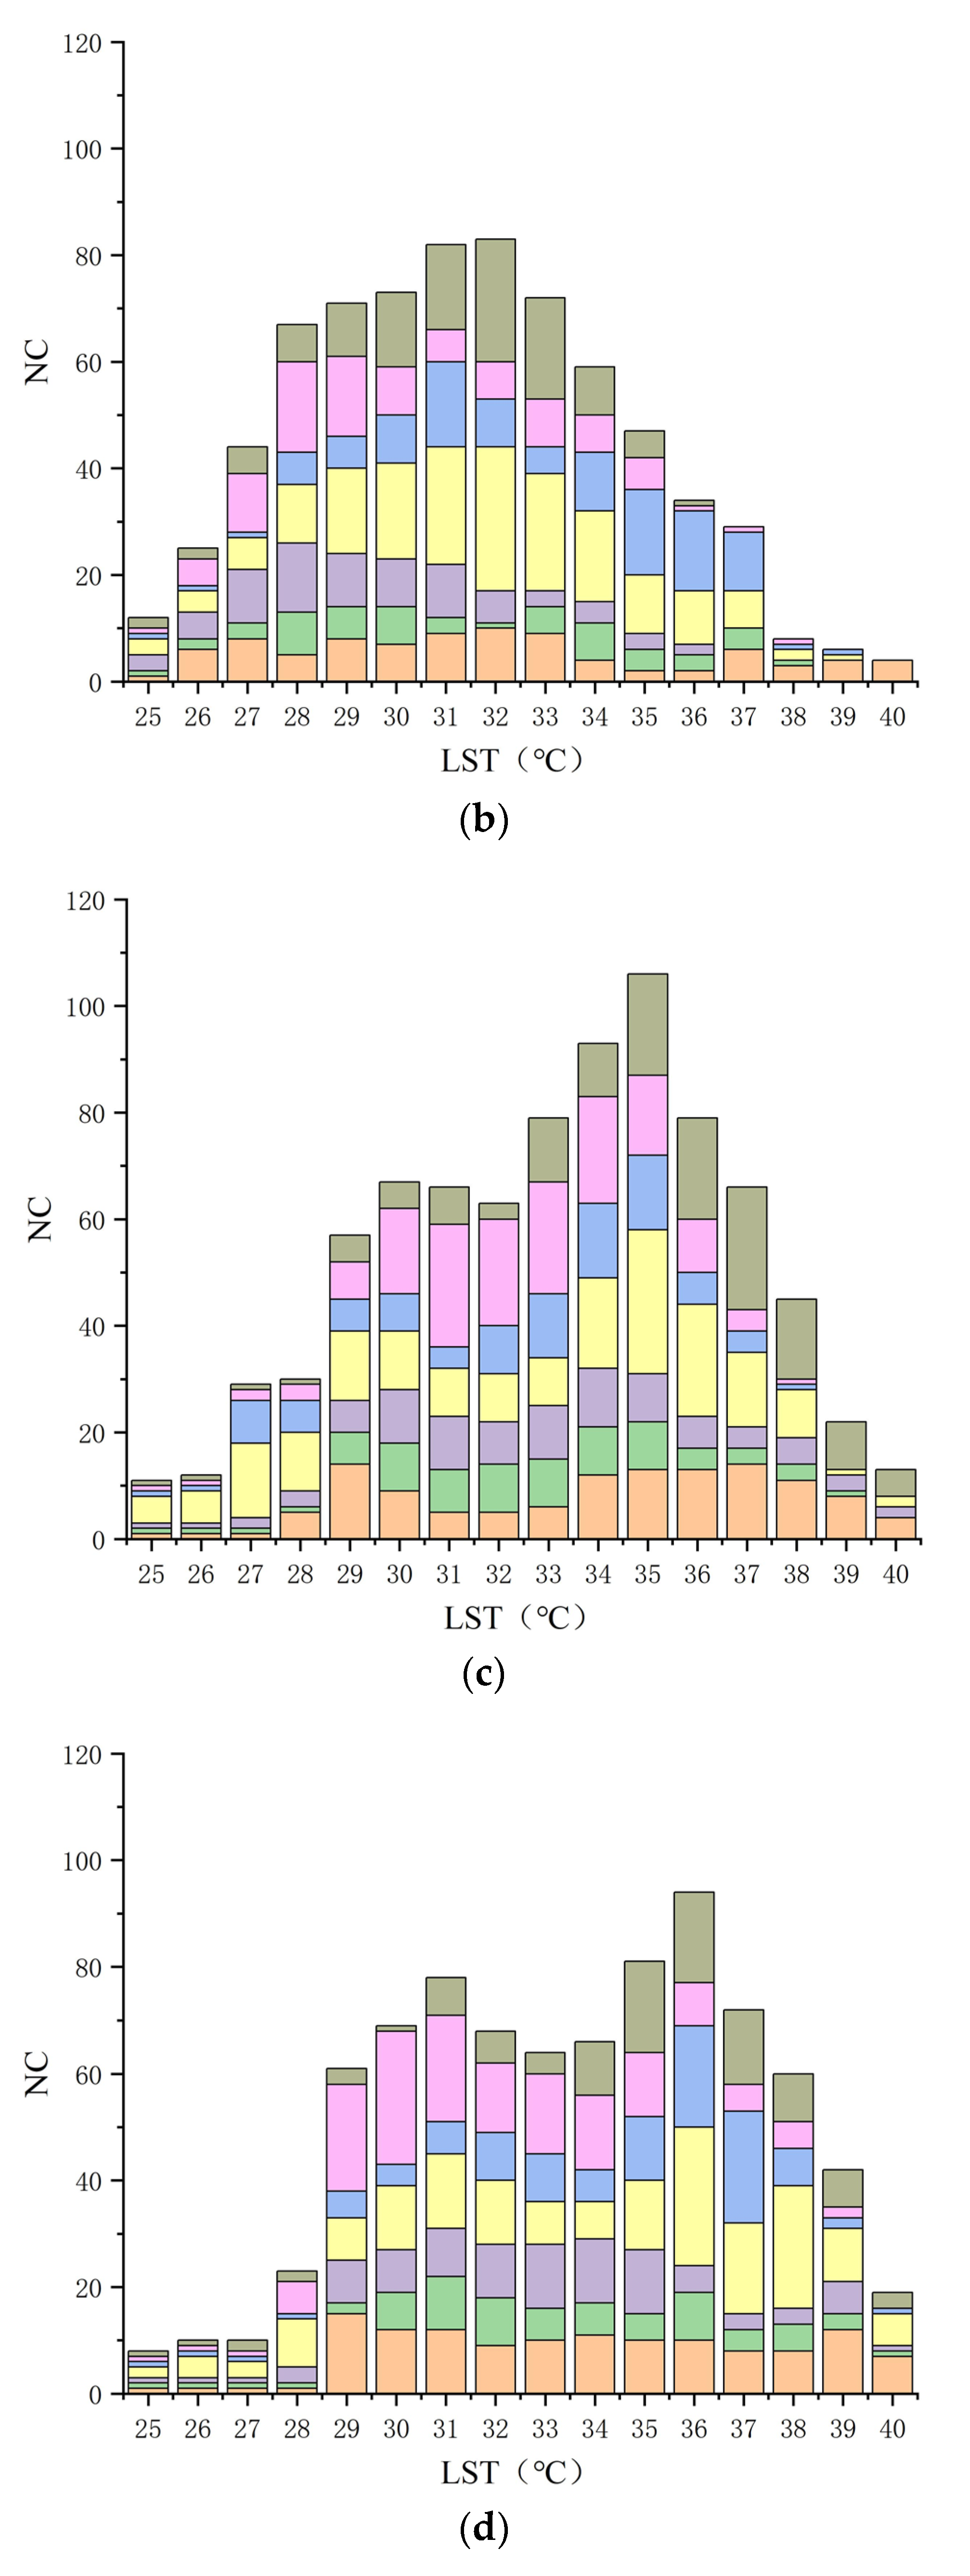
3.3. Statistical and Correlation Analysis of Connected Regions
4. Discussion
4.1. Influence of Connected Region Size
4.2. Properties of High LST Regions in Different Districts
5. Conclusions
Author Contributions
Funding
Institutional Review Board Statement
Informed Consent Statement
Data Availability Statement
Conflicts of Interest
References
- Peng, J.; Xie, P.; Liu, Y.X.; Ma, J. Urban thermal environment dynamics and associated landscape pattern factors: A case study in the Beijing metropolitan region. Remote Sens. Environ. 2016, 173, 145–155. [Google Scholar] [CrossRef]
- National Bureau of Statistics. China Statistics Yearbook; China Statistics Press: Beijing, China, 2021.
- Jenerette, G.D.; Harlan, S.L.; Stefanov, W.L.; Martin, C.A. Ecosystem services and urban heat riskscape moderation: Water, green spaces, and social inequality in Phoenix, USA. Ecol. Appl. 2011, 21, 2637–2651. [Google Scholar] [CrossRef] [PubMed]
- Du, S.H.; Xiong, Z.Q.; Wang, Y.C.; Guo, L. Quantifying the multilevel effects of landscape composition and configuration on land surface temperature. Remote Sens. Environ. 2016, 178, 84–92. [Google Scholar] [CrossRef]
- Lu, L.; Weng, Q.; Xiao, D.; Guo, H.; Hui, W. Spatiotemporal Variation of Surface Urban Heat Islands in Relation to Land Cover Composition and Configuration: A Multi-Scale Case Study of Xi’an, China. Remote Sens. 2020, 12, 2713. [Google Scholar] [CrossRef]
- Shahfahad; Rihan, M.; Naikoo, M.W.; Ali, M.A.; Rahman, A. Urban Heat Island Dynamics in Response to Land-Use/Land-Cover Change in the Coastal City of Mumbai. J. Indian Soc. Remote Sens. 2021, 49, 2227–2247. [Google Scholar] [CrossRef]
- Yao, L.; Sun, S.; Song, C.; Li, J.; Xu, Y. Understanding the spatiotemporal pattern of the urban heat island footprint in the context of urbanization, a case study in Beijing, China. Appl. Geogr. 2021, 133, 102496. [Google Scholar] [CrossRef]
- Rizwan, A.M.; Dennis, Y.C.L.; Liu, C.H. A review on the generation, determination and mitigation of Urban Heat Island. J. Environ. Sci. 2008, 20, 120–128. [Google Scholar] [CrossRef]
- Zhou, W.Q.; Wang, J.; Cadenasso, M.L. Effects of the spatial configuration of trees on urban heat mitigation: A comparative study. Remote Sens. Environ. 2017, 195, 1–12. [Google Scholar] [CrossRef]
- Li, H.D.; Zhou, Y.Y.; Wang, X.; Zhou, X.; Zhang, H.W.; Sodoudi, S. Quantifying urban heat island intensity and its physical mechanism using WRF/UCM. Sci. Total Environ. 2019, 650, 3110–3119. [Google Scholar] [CrossRef]
- Manley, G. On the Frequency of Snowfall in Metropolitan England. Q. J. R. Meteorol. Soc. 1958, 84, 70–72. [Google Scholar] [CrossRef]
- Deosthali, V. Impact of rapid urban growth on heat and moisture islands in Pune City, India. Atmos. Environ. 2000, 34, 2745–2754. [Google Scholar] [CrossRef]
- Saaroni, H.; Ben-Dor, E.; Bitan, A.; Potchter, O. Spatial distribution and microscale characteristics of the urban heat island in Tel-Aviv, Israel. Landsc. Urban Plan. 2000, 48, 1–18. [Google Scholar] [CrossRef]
- Kim, Y.-H.; Baik, J.-J. Maximum Urban Heat Island Intensity in Seoul. J. Appl. Meteorol. 2002, 41, 651–659. [Google Scholar] [CrossRef]
- Giridharan, R.; Ganesan, S.; Lau, S.S.Y. Daytime urban heat island effect in high-rise and high-density residential developments in Hong Kong. Energy Build. 2004, 36, 525–534. [Google Scholar] [CrossRef]
- Rao, P.K. Remote sensing of urban heat islands from an environmental satellite. Bull. Am. Meteorol. Soc. 1972, 53, 647–648. [Google Scholar]
- Sobrino, J.A.; Jimenez-Munoz, J.C.; Soria, G.; Romaguera, M.; Guanter, L.; Moreno, J.; Plaza, A.; Martincz, P. Land surface emissivity retrieval from different VNIR and TIR sensors. IEEE Trans. Geosci. Remote Sens. 2008, 46, 316–327. [Google Scholar] [CrossRef]
- Li, J.J.; Wang, X.R.; Wang, X.J.; Ma, W.C.; Zhang, H. Remote sensing evaluation of urban heat island and its spatial pattern of the Shanghai metropolitan area, China. Ecol. Complex. 2009, 6, 413–420. [Google Scholar] [CrossRef]
- Li, Y.Y.; Zhang, H.; Kainz, W. Monitoring patterns of urban heat islands of the fast-growing Shanghai metropolis, China: Using time-series of Landsat TM/ETM+ data. Int. J. Appl. Earth Obs. Geoinf. 2012, 19, 127–138. [Google Scholar] [CrossRef]
- Jimenez-Munoz, J.C.; Sobrino, J.A.; Skokovic, D.; Mattar, C.; Cristobal, J. Land Surface Temperature Retrieval Methods from Landsat-8 Thermal Infrared Sensor Data. IEEE Geosci. Remote Sens. Lett. 2014, 11, 1840–1843. [Google Scholar] [CrossRef]
- Chen, M.; Zhou, Y.; Hu, M.; Zhou, Y. Influence of Urban Scale and Urban Expansion on the Urban Heat Island Effect in Metropolitan Areas: Case Study of Beijing-Tianjin-Hebei Urban Agglomeration. Remote Sens. 2020, 12, 3491. [Google Scholar] [CrossRef]
- Yang, J.; Zhan, Y.; Xiao, X.; Xia, J.C.; Li, X. Investigating the diversity of land surface temperature characteristics in different scale cities based on local climate zones. Urban Clim. 2020, 34, 100700. [Google Scholar] [CrossRef]
- Cui, F.; Hamdi, R.; Yuan, X.; He, H.; Maeyer, P.D. Quantifying the response of surface urban heat island to urban greening in global north megacities. Sci. Total Environ. 2021, 801, 149553. [Google Scholar] [CrossRef]
- Song, Z.; Yang, H.; Huang, X.; Yu, W.; Huang, J.; Ma, M. The spatiotemporal pattern and influencing factors of land surface temperature change in China from 2003 to 2019. Int. J. Appl. Earth Obs. Geoinf. 2021, 104, 102537. [Google Scholar] [CrossRef]
- Guo, M.; Chen, S.; Wang, W.; Liang, H.; Hao, G.; Liu, K. Spatiotemporal variation of heat fluxes in Beijing with land use change from 1997 to 2017. Phys. Chem. Earth 2019, 110, 51–60. [Google Scholar] [CrossRef]
- Hawkins, T.W.; Brazel, A.J.; Stefanov, W.L.; Bigler, W.; Saffell, E.M. The role of rural variability in urban heat island determination for Phoenix, Arizona. J. Appl. Meteorol. 2004, 43, 476–486. [Google Scholar] [CrossRef]
- Chen, X.L.; Zhao, H.M.; Li, P.X.; Yin, Z.Y. Remote sensing image-based analysis of the relationship between urban heat island and land use/cover changes. Remote Sens. Environ. 2006, 104, 133–146. [Google Scholar] [CrossRef]
- Duan, S.B.; Li, Z.L.; Tang, B.H.; Wu, H.; Tang, R.L. Generation of a time-consistent land surface temperature product from MODIS data. Remote Sens. Environ. 2014, 140, 339–349. [Google Scholar] [CrossRef]
- Estoque, R.C.; Murayama, Y.; Myint, S.W. Effects of landscape composition and pattern on land surface temperature: An urban heat island study in the megacities of Southeast Asia. Sci. Total Environ. 2017, 577, 349–359. [Google Scholar] [CrossRef]
- The People’s Government of Henan Province. Provincial Situation; Henan Daily News Group Co., Ltd.: Zhengzhou, China, 2021.
- Wan, Z.; Zhang, Y.; Zhang, Q.; Li, Z.L. Validation of the land-surface temperature products retrieved from Terra Moderate Resolution Imaging Spectroradiometer data. Remote Sens. Environ. 2002, 83, 163–180. [Google Scholar] [CrossRef]
- Fu, H. Spatial-Temporal Reconstruction and Analysis of Dynamic Driving Factors for Land Surface Temperatures in Urban Area. Ph.D. Thesis, Wuhan University, Wuhan, China, 2020. [Google Scholar]
- Ji, R. Temporal and Spatial Variation of Surface Temperature and Influencing Factors Analysis in Liaoning Province from 1960 to 2016. Master’s Thesis, Liaoning Normal University, Dalian, China, 2018. [Google Scholar]
- Purevdorj, T.; Tateishi, R.; Ishiyama, T.; Honda, Y. Relationships between percent vegetation cover and vegetation indices. Int. J. Remote Sens. 1998, 19, 3519–3535. [Google Scholar] [CrossRef]
- Zha, Y.; Gao, J.; Ni, S. Use of normalized difference built-up index in automatically mapping urban areas from TM imagery. Int. J. Remote Sens. 2003, 24, 583–594. [Google Scholar] [CrossRef]
- Salembier, P.; Oliveras, A.; Garrido, L. Antiextensive connected operators for image and sequence processing. IEEE Trans. Image Processing A Publ. IEEE Signal Processing Soc. 1998, 7, 555–570. [Google Scholar] [CrossRef] [PubMed]
- Braga-Neto, U.; Goutsias, J. Connectivity on Complete Lattices: New Results. Comput. Vis. Image Underst. 2002, 85, 22–53. [Google Scholar] [CrossRef]
- Zhao, Z.; Cheng, G.; Wang, C.; Wang, S.; Wang, H. City Grade Classification Based on Connectivity Analysis by Luojia I Night-Time Light Images in Henan Province, China. Remote Sens. 2020, 12, 1705. [Google Scholar] [CrossRef]
- Hobbs, R.J. Effects of landscape fragmentation on ecosystem processes in the Western Australian wheatbelt. Biol. Conserv. 1993, 64, 193–201. [Google Scholar] [CrossRef]


| Number | Time | Orbital Number (Terra Satellite) | Scene-Center Time (Local Time) | Avg. Air Temperature | Humidity | Condition | Resolution (m) |
|---|---|---|---|---|---|---|---|
| 1 | 2006-05-15 | h27v05 | 11:20 | 23.7 °C | 39% | Fair | 1000 |
| 2 | 2010-05-01 | h27v05 | 11:30 | 23.2 °C | 59% | Fair | 1000 |
| 3 | 2014-05-07 | h27v05 | 11:10 | 25.6 °C | 33% | Fair | 1000 |
| 4 | 2017-04-29 | h27v05 | 11:10 | 25.6 °C | 24% | Fair | 1000 |
| 5 | 2021-05-08 | h27v05 | 11:20 | 26.7 °C | 41% | Fair | 1000 |
| Category | Description | Equation |
|---|---|---|
| Size and number of one connected region and number of connected regions at one level | Pixel number of ith connected region at jth temperature level;number of connected regions at jth level | , |
| Mean LST of one connected region | Average LST of ith connected region at jth temperature level | |
| Mean NDVI of one connected region | Average NDVI of ith connected region at jth temperature level | |
| Mean NDBI of one connected region | Average NDBI of ith connected region at jth temperature level | |
| Mean LST at one level | Average LST of all connected regions at jth temperature level | |
| Mean NDVI at one level | Average NDVI of all connected regions at jth temperature level | |
| Mean NDBI at one level | Average NDBI of all connected regions at jth temperature level | |
| Correlation coefficient | Correlation coefficients of LST and NDVI and LST and NDBI | CC_TV, CC_TB |
| Attribute | Year | Minimum | Maximum | Mean | Standard Deviation |
|---|---|---|---|---|---|
| LST | 2006-05-15 | 0.27 | 43.43 | 29.03 | 2.91 |
| 2010-05-01 | 1.53 | 45.11 | 28.45 | 3.33 | |
| 2014-05-07 | 2.61 | 43.57 | 29.39 | 4.24 | |
| 2017-04-29 | 2.85 | 45.17 | 31.57 | 3.34 | |
| 2021-05-08 | 0.51 | 44.13 | 30.63 | 3.46 | |
| NDVI | 2006-05-15 | −0.2720 | 0.8963 | 0.5779 | 0.1393 |
| 2010-05-01 | −0.3902 | 0.8555 | 0.6044 | 0.1286 | |
| 2014-05-07 | −0.1380 | 0.9024 | 0.5784 | 0.1320 | |
| 2017-04-29 | −0.2953 | 0.8998 | 0.6335 | 0.1411 | |
| 2021-05-08 | −0.2189 | 0.9568 | 0.6548 | 0.1501 | |
| NDBI | 2006-05-15 | −0.5751 | 0.1192 | −0.2182 | 0.1041 |
| 2010-05-01 | −0.5516 | 0.1270 | −0.2717 | 0.1493 | |
| 2014-05-07 | −0.4880 | 0.1050 | −0.2311 | 0.1123 | |
| 2017-04-29 | −0.6016 | 0.1035 | −0.2524 | 0.1318 | |
| 2021-05-08 | −0.5577 | 0.1092 | −0.2750 | 0.1295 |
| Date | Size (Pixels) | NC | RF | AT (°C) | AV | AB | CC_TV | CC_TB |
|---|---|---|---|---|---|---|---|---|
| 2006-05-15 | 1–10 | 20 | 0.1111 | 33.41 | 0.4267 | −0.0763 | −0.4391 | −0.0718 |
| 11–30 | 47 | 0.0545 | 33.26 | 0.4404 | −0.0841 | −0.6488 | 0.1781 | |
| 31–60 | 23 | 0.0230 | 33.33 | 0.4317 | −0.0833 | −0.3862 | −0.0736 | |
| >60 | 38 | 0.0019 | 33.82 | 0.4398 | −0.0722 | −0.4258 | 0.0036 | |
| 2010-05-01 | 1–10 | 25 | 0.1111 | 32.86 | 0.4519 | −0.0786 | −0.6124 | 0.3263 |
| 11–30 | 36 | 0.0558 | 33.40 | 0.4077 | −0.0877 | −0.1623 | 0.0204 | |
| 31–60 | 8 | 0.0251 | 33.35 | 0.4615 | −0.1208 | 0.0461 | 0.4268 | |
| >60 | 28 | 0.0013 | 33.88 | 0.4297 | −0.0812 | 0.0326 | 0.1785 | |
| 2014-05-07 | 1–10 | 17 | 0.1111 | 33.20 | 0.4987 | −0.1402 | −0.0003 | 0.1282 |
| 11–30 | 33 | 0.0520 | 33.40 | 0.4789 | −0.1243 | 0.0724 | −0.3213 | |
| 31–60 | 10 | 0.0228 | 33.92 | 0.5144 | −0.1544 | −0.4923 | 0.0723 | |
| >60 | 27 | 0.0007 | 34.08 | 0.4875 | −0.1186 | −0.3574 | 0.1008 | |
| 2017-04-29 | 1–10 | 26 | 0.1111 | 33.29 | 0.5754 | −0.1902 | −0.3135 | 0.3660 |
| 11–30 | 59 | 0.0534 | 33.31 | 0.5389 | −0.1766 | −0.0343 | −0.1283 | |
| 31–60 | 31 | 0.0235 | 33.80 | 0.5271 | −0.1728 | −0.0425 | −0.2955 | |
| >60 | 29 | 0.0005 | 34.28 | 0.5166 | −0.1481 | 0.0132 | −0.1158 | |
| 2021-05-08 | 1–10 | 31 | 0.1111 | 33.05 | 0.5557 | −0.1732 | −0.4759 | 0.4153 |
| 11–30 | 47 | 0.0547 | 33.34 | 0.5216 | −0.1472 | −0.0238 | 0.1033 | |
| 31–60 | 26 | 0.0252 | 33.49 | 0.4951 | −0.1314 | −0.1498 | 0.2374 | |
| >60 | 37 | 0.0009 | 33.94 | 0.5139 | −0.1385 | −0.1167 | 0.0710 |
| Date | City | Anyang | Hebi | Kaifeng | Luoyang | Sanmenxia | Xinxiang | Zhengzhou | |
|---|---|---|---|---|---|---|---|---|---|
| Direction | |||||||||
| 2006-05-15 | CM | 13 | 9 | 12 | 27 | 15 | 20 | 18 | |
| LM | 16 | 15 | 12 | 13 | 11 | 12 | 14 | ||
| 2010-05-01 | CM | 10 | 8 | 13 | 27 | 16 | 17 | 23 | |
| LM | 16 | 14 | 12 | 15 | 15 | 14 | 12 | ||
| 2014-05-07 | CM | 14 | 9 | 11 | 27 | 14 | 23 | 30 | |
| LM | 16 | 15 | 16 | 16 | 14 | 14 | 16 | ||
| 2017-04-29 | CM | 15 | 10 | 12 | 26 | 21 | 25 | 17 | |
| LM | 16 | 16 | 16 | 16 | 16 | 15 | 16 | ||
| 2021-05-08 | CM | 23 | 9 | 10 | 23 | 19 | 18 | 14 | |
| LM | 15 | 14 | 14 | 16 | 13 | 14 | 16 | ||
Publisher’s Note: MDPI stays neutral with regard to jurisdictional claims in published maps and institutional affiliations. |
© 2022 by the authors. Licensee MDPI, Basel, Switzerland. This article is an open access article distributed under the terms and conditions of the Creative Commons Attribution (CC BY) license (https://creativecommons.org/licenses/by/4.0/).
Share and Cite
Zhao, Z.; Sun, B.; Cheng, G.; Wang, C.; Yang, N.; Wang, H.; Tang, X. A Multitemporal and Multilevel Land Surface Temperature Regional Attribute Change Analysis in Henan, China, Using MODIS Imagery. Sustainability 2022, 14, 10071. https://doi.org/10.3390/su141610071
Zhao Z, Sun B, Cheng G, Wang C, Yang N, Wang H, Tang X. A Multitemporal and Multilevel Land Surface Temperature Regional Attribute Change Analysis in Henan, China, Using MODIS Imagery. Sustainability. 2022; 14(16):10071. https://doi.org/10.3390/su141610071
Chicago/Turabian StyleZhao, Zongze, Bingke Sun, Gang Cheng, Cheng Wang, Na Yang, Hongtao Wang, and Xiaojie Tang. 2022. "A Multitemporal and Multilevel Land Surface Temperature Regional Attribute Change Analysis in Henan, China, Using MODIS Imagery" Sustainability 14, no. 16: 10071. https://doi.org/10.3390/su141610071