
Integrated Stochastic Life Cycle Assessment and Techno-Economic Analysis for Shrub Willow Production in the Northeastern United States

 , ,
, ,  , , ,
, , ,
Abstract
:1. Introduction

| Source | Environmental Impacts Studied | Economic Impacts Studied | System Boundary | Functional Unit | Conversion Technology | End Product | Lignocellulosic Feedstock(s) | Country |
|---|---|---|---|---|---|---|---|---|
| [10] | Fossil energy savings, Petroleum savings, greenhouse gas (CO2, CH4, N2O), air quality, acidification, land use and biodiversity, soil health | Minimum selling price, delivered feedstock cost | Cradle-to-grave | Farming 1 ha of land and 1 km traveled | Combustion | Transportation fuel (stover-derived ethanol) | Corn stover | US |
| [7] | Greenhouse gas, land use | Minimum fuel selling price | Cradle-to-plant | ND a | Co-combustion | Electricity and heating | Willow, Miscanthus | Ireland |
| [9] | Greenhouse gas, fossil energy consumption, water consumption, wastewater generation | Minimum fuel selling price | Cradle-to-gate | ND | Fast-pyrolysis upgrading design | Transportation Fuel | Pine, forest residue | US |
| [11] | Greenhouse gas (CO2) | Minimum fuel product selling price | Cradle-to-gate | 1 MJ of fuel combusted in an automobile | Fast pyrolysis, upgrading, combustion | Biofuel | Pine, tulip poplar, hybrid poplar, switchgrass, corn stover | US |
| [12] | Greenhouse gas (CO2, CH4, N2O) | Required selling price | Cradle-to-grave | 1000 MJ of energy equivalent | Fast pyrolysis, combustion | Pellet fuel, biofuel, biopower | Switchgrass, hybrid willow, miscanthus | US |
| [13] | Acidification, ecotoxicity, eutrophication, global warming, human health, ozone depletion, photochemical ozone formation, resource depletion, respiratory effects | Return on investment | Well-to-pump | MJ of ethanol, dodecane kWh of electricity kg of chemical (ethyl acetate, ethylene) | Combustion | Ethanol, dodecane, electricity, ethyl acetate, ethylene, | Banagrass, Energy cane | US |
| [15] | Greenhouse gas (CO2) | Production cost, unit revenue, return on investment, Minimum electricity selling price | Well-to-pump | 1 MJ | Combustion | Electricity | Banagrass, Energy cane | US |
| [14] | Greenhouse gas (CO2, CH4, N2O) | Minimum selling price | Cradle-to-factory gate | 1 MJ bioethanol | Combustion | Ethanol | Spruce logging residues | Sweden |
| [8] | Greenhouse gas, air emissions | Minimum fuel selling price | Cradle-to-grave | 1 GJ of fuel | Gasification hydrothermal, fast pyrolysis | Marine biofuel | Eucalyptus residues, pine residues, spruce resides, corn stover, rice husks and straw, barley straw, wheat straw, sugarcane bagasse, sorghum bagasse | Brazil, Sweden |
2. Methodology
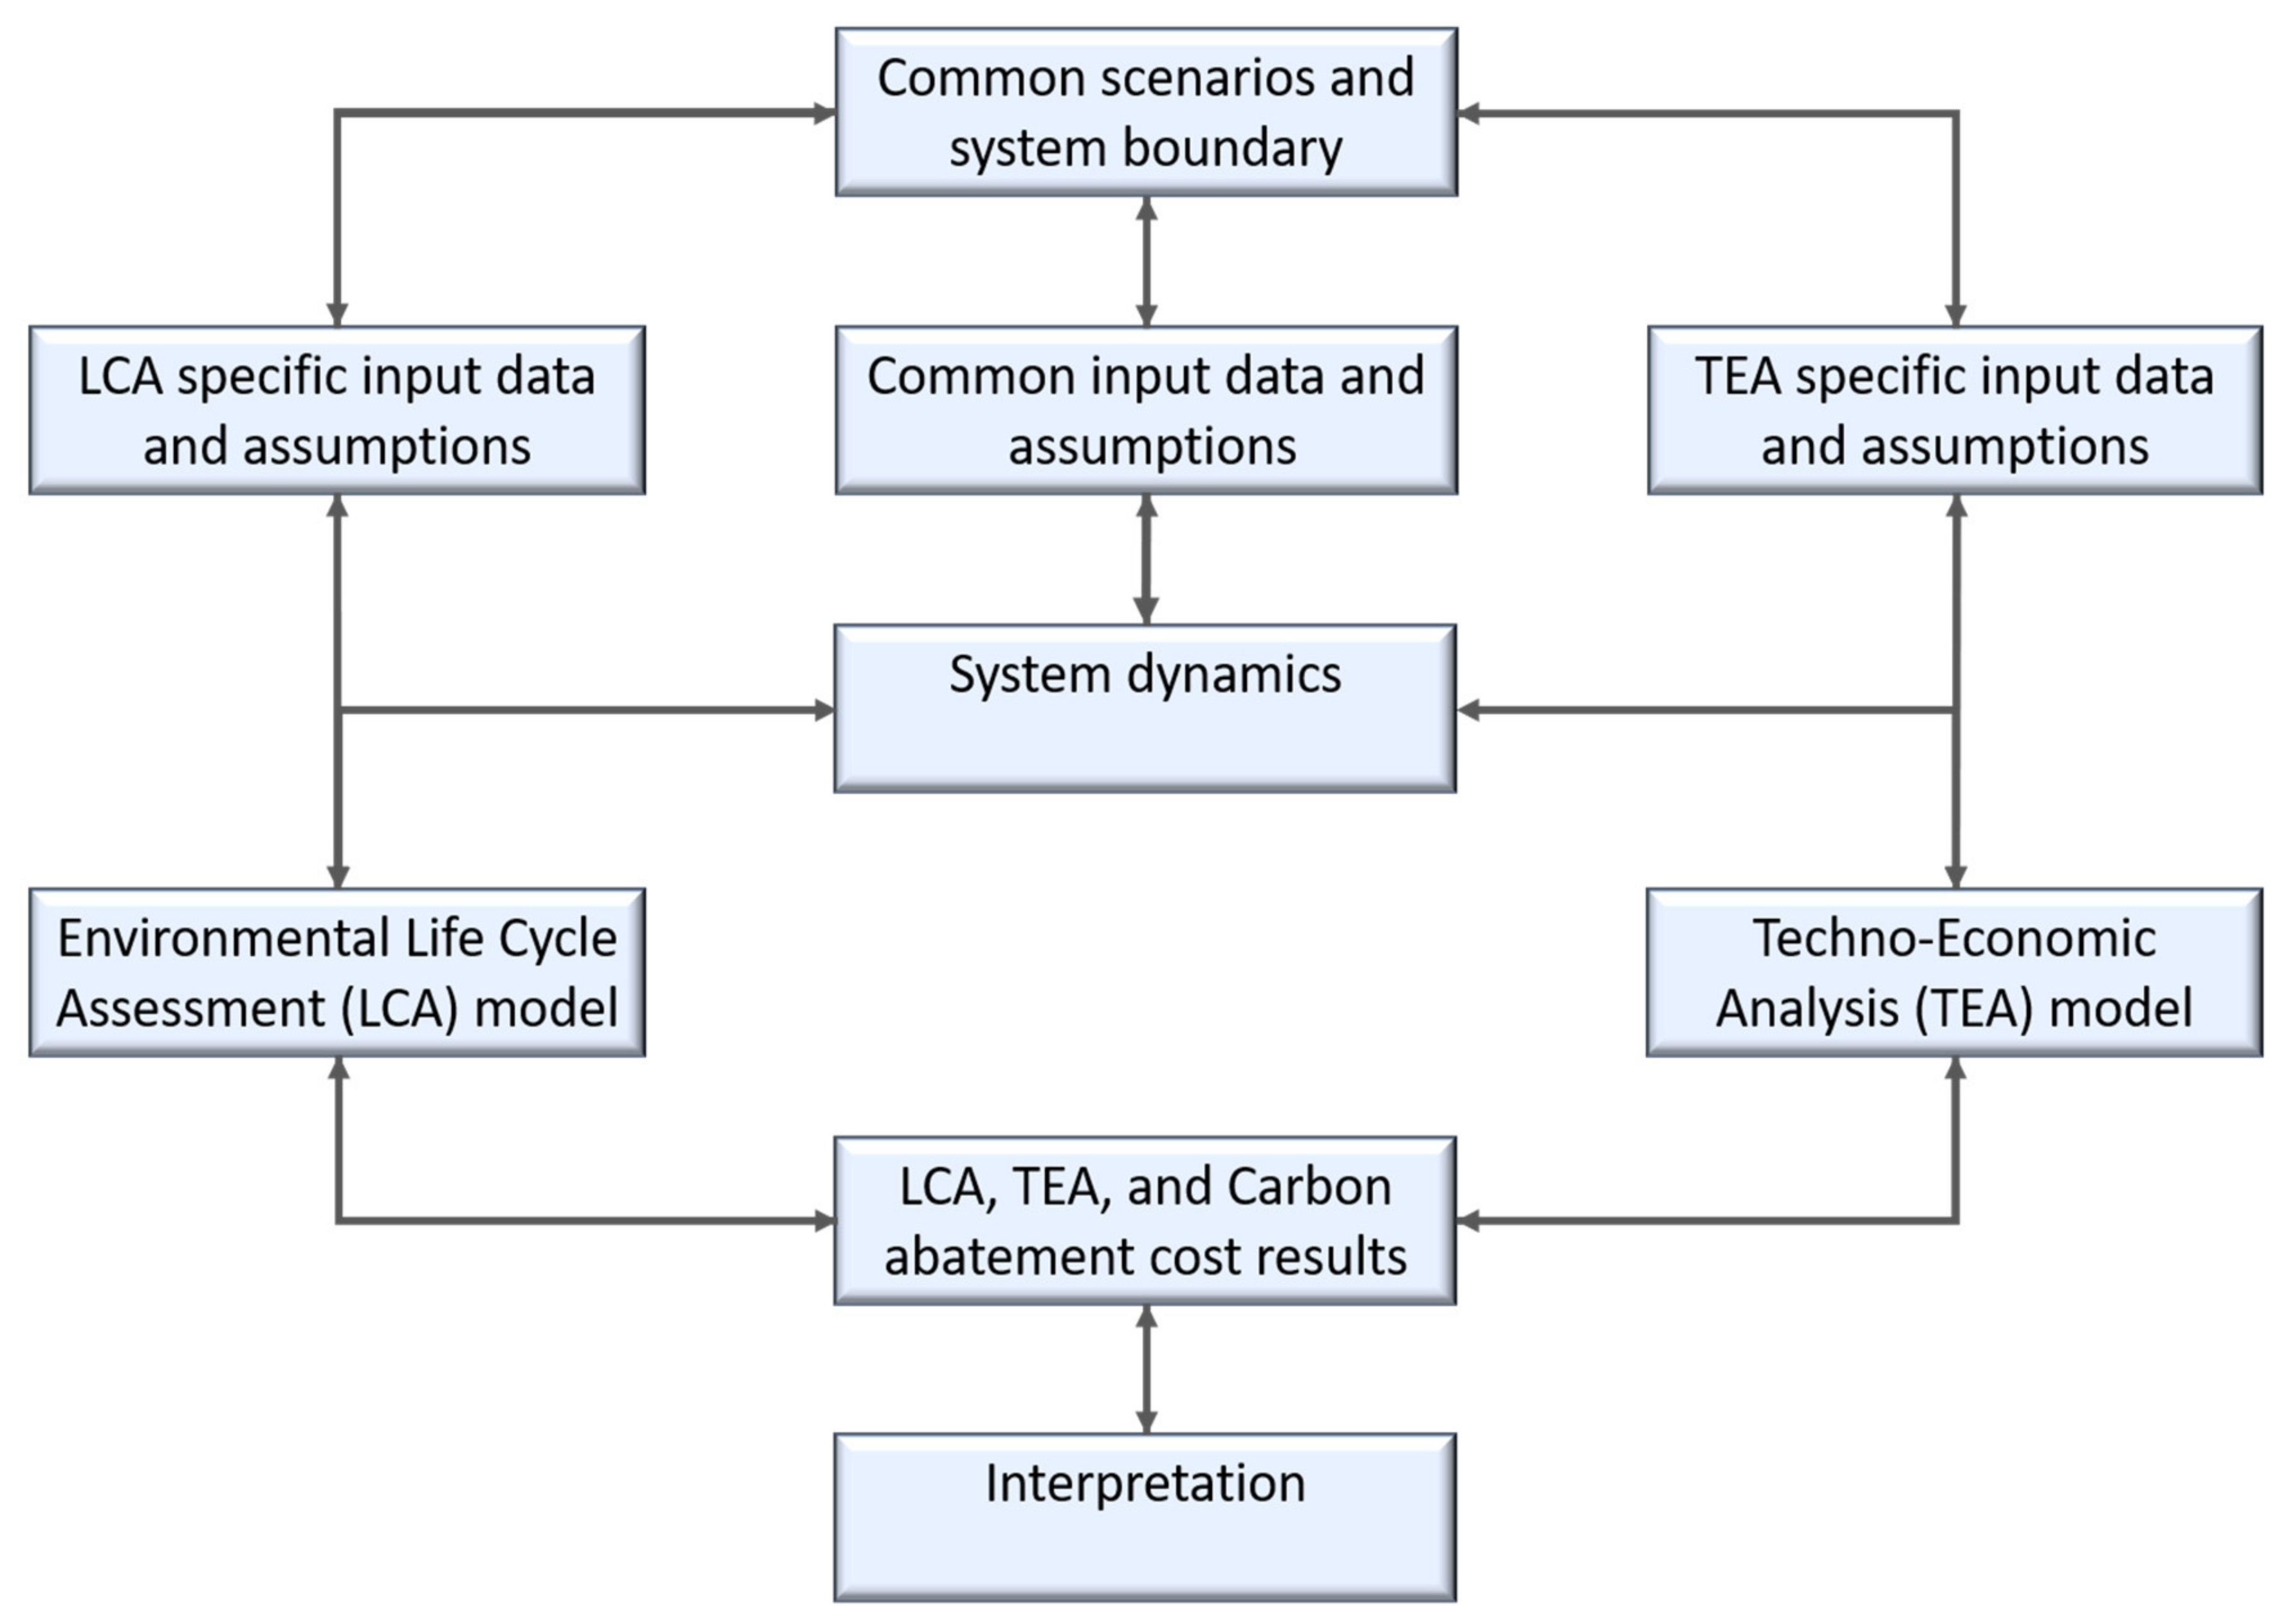
2.1. Integrated LCA and TEA Framework of Willow Production
2.2. System Dynamics of Willow Biomass Supply Chain
2.3. LCA Modeling
2.4. TEA Modeling: EcoWillow 4.0 S
2.5. Monte Carlo Simulation for the LCA and TEA
3. Results and Discussion
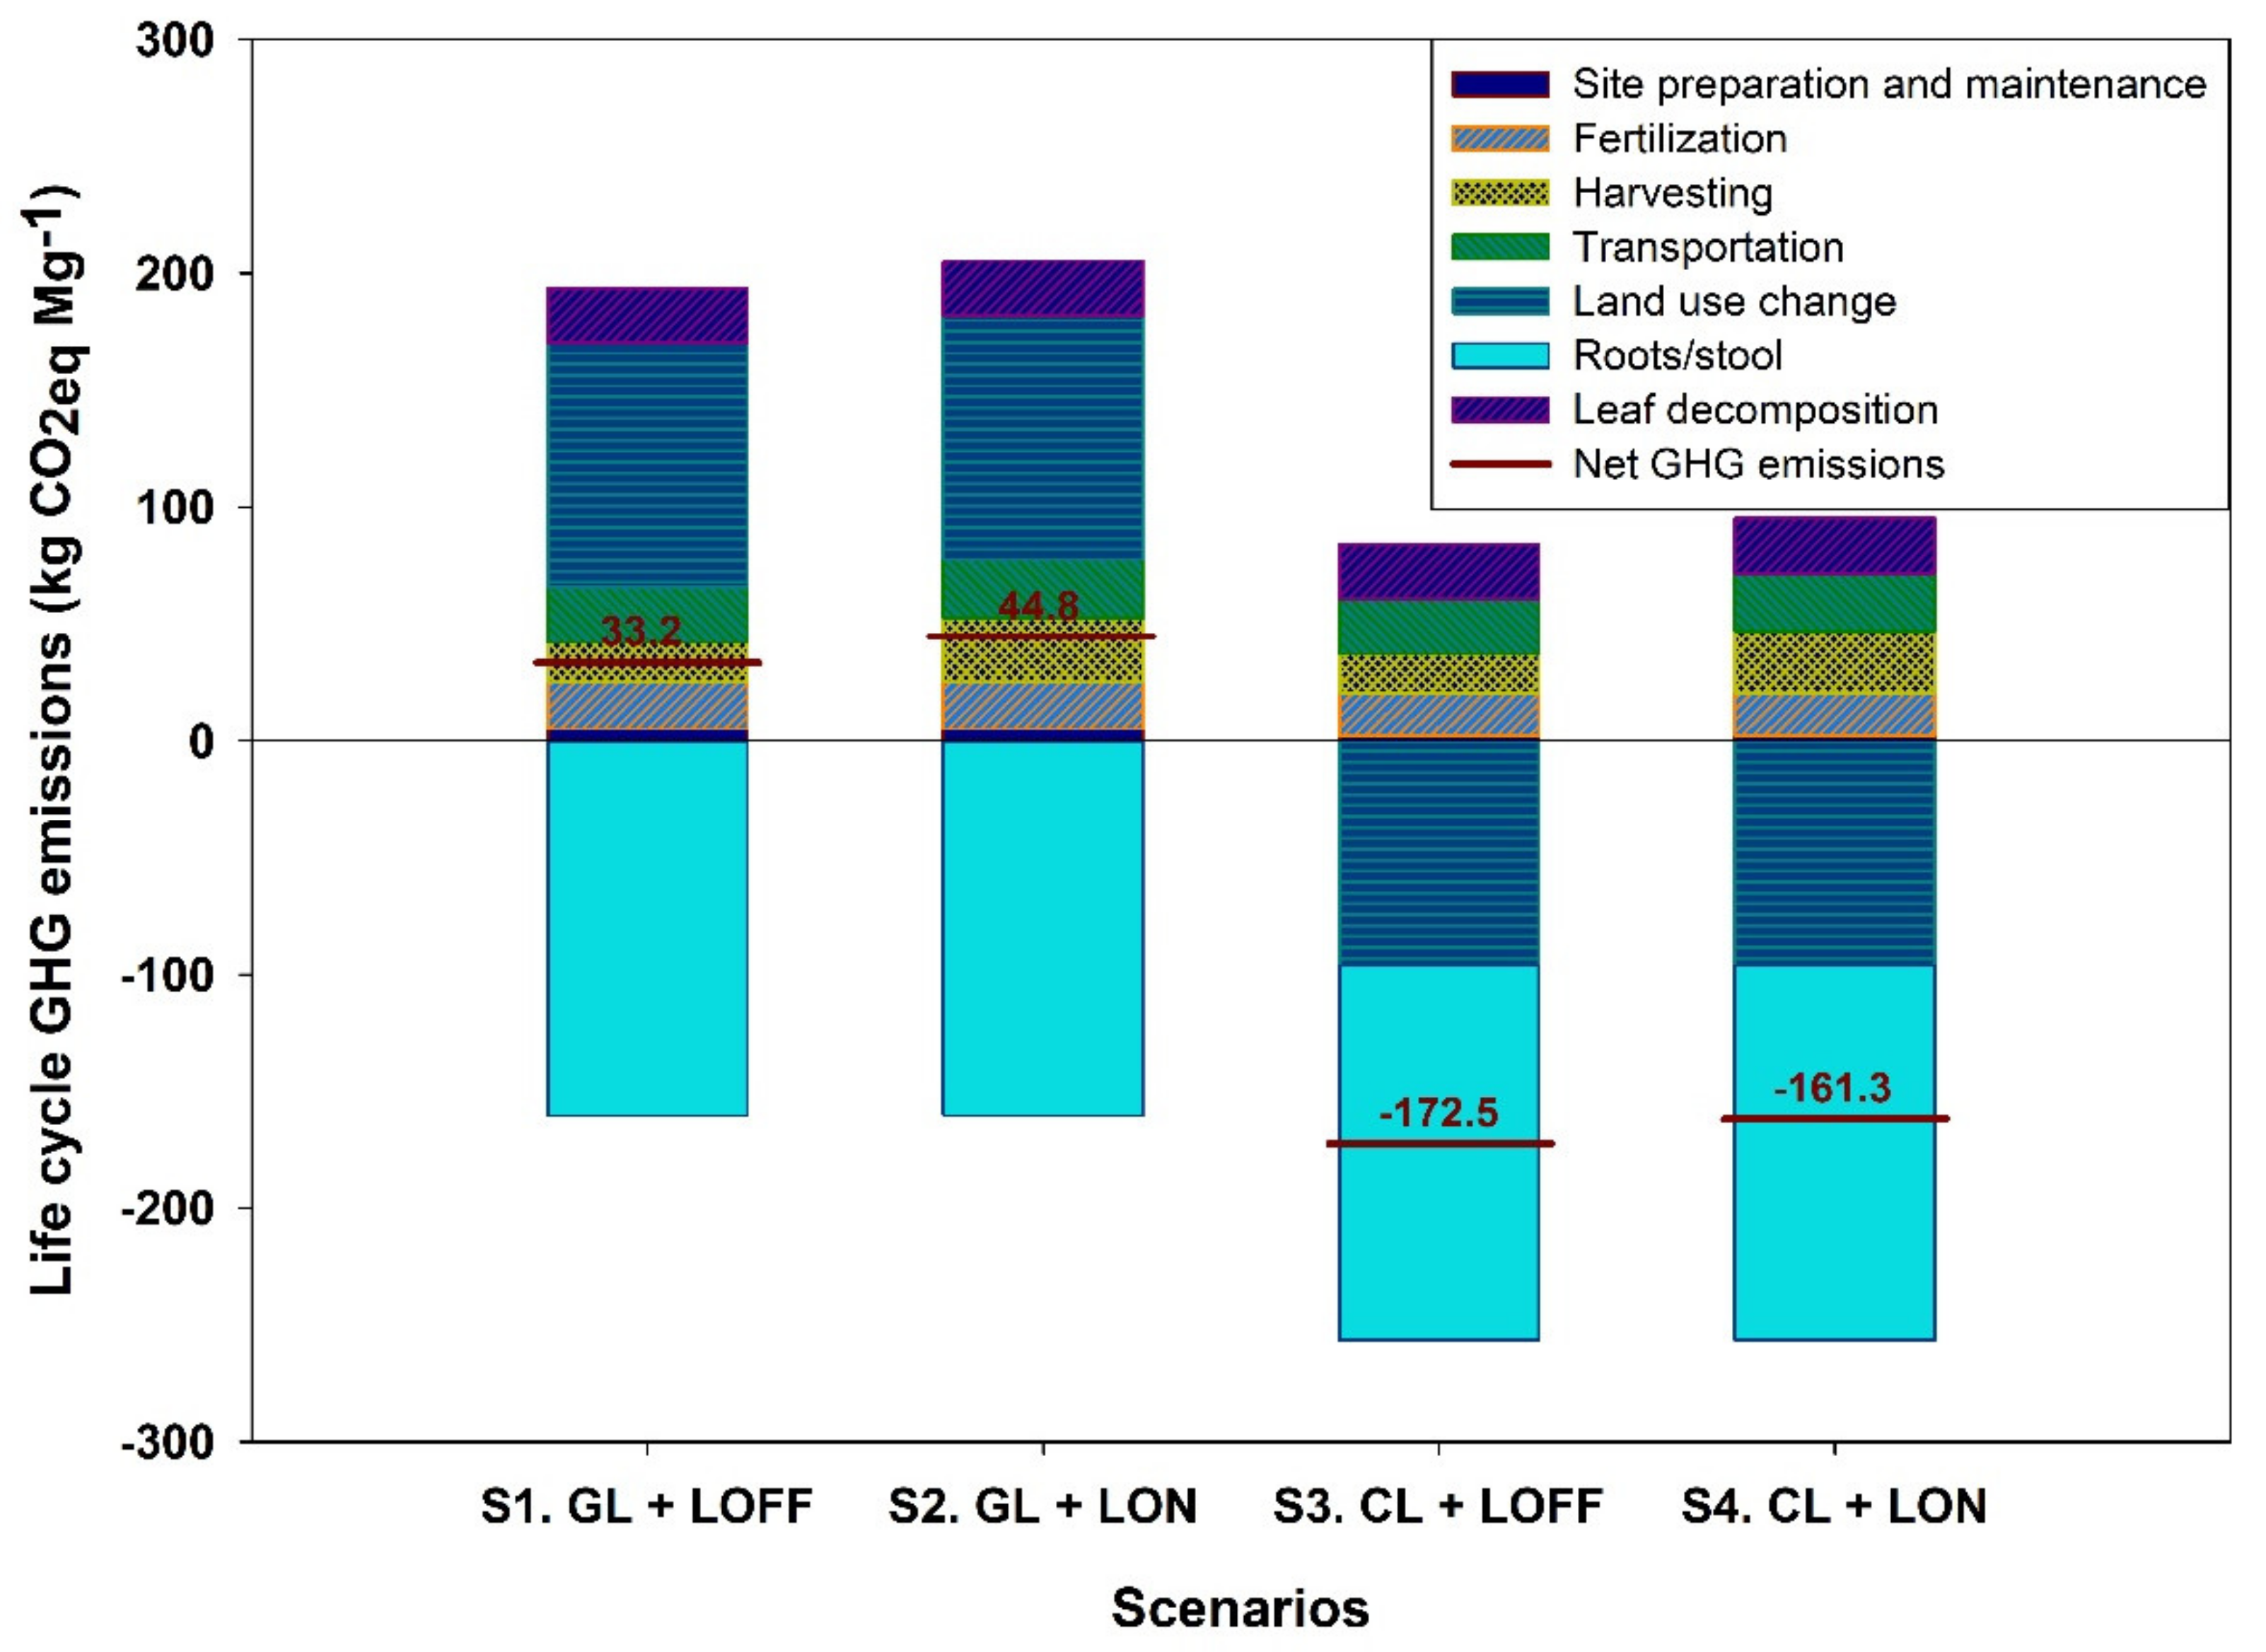
3.1. LCA Results
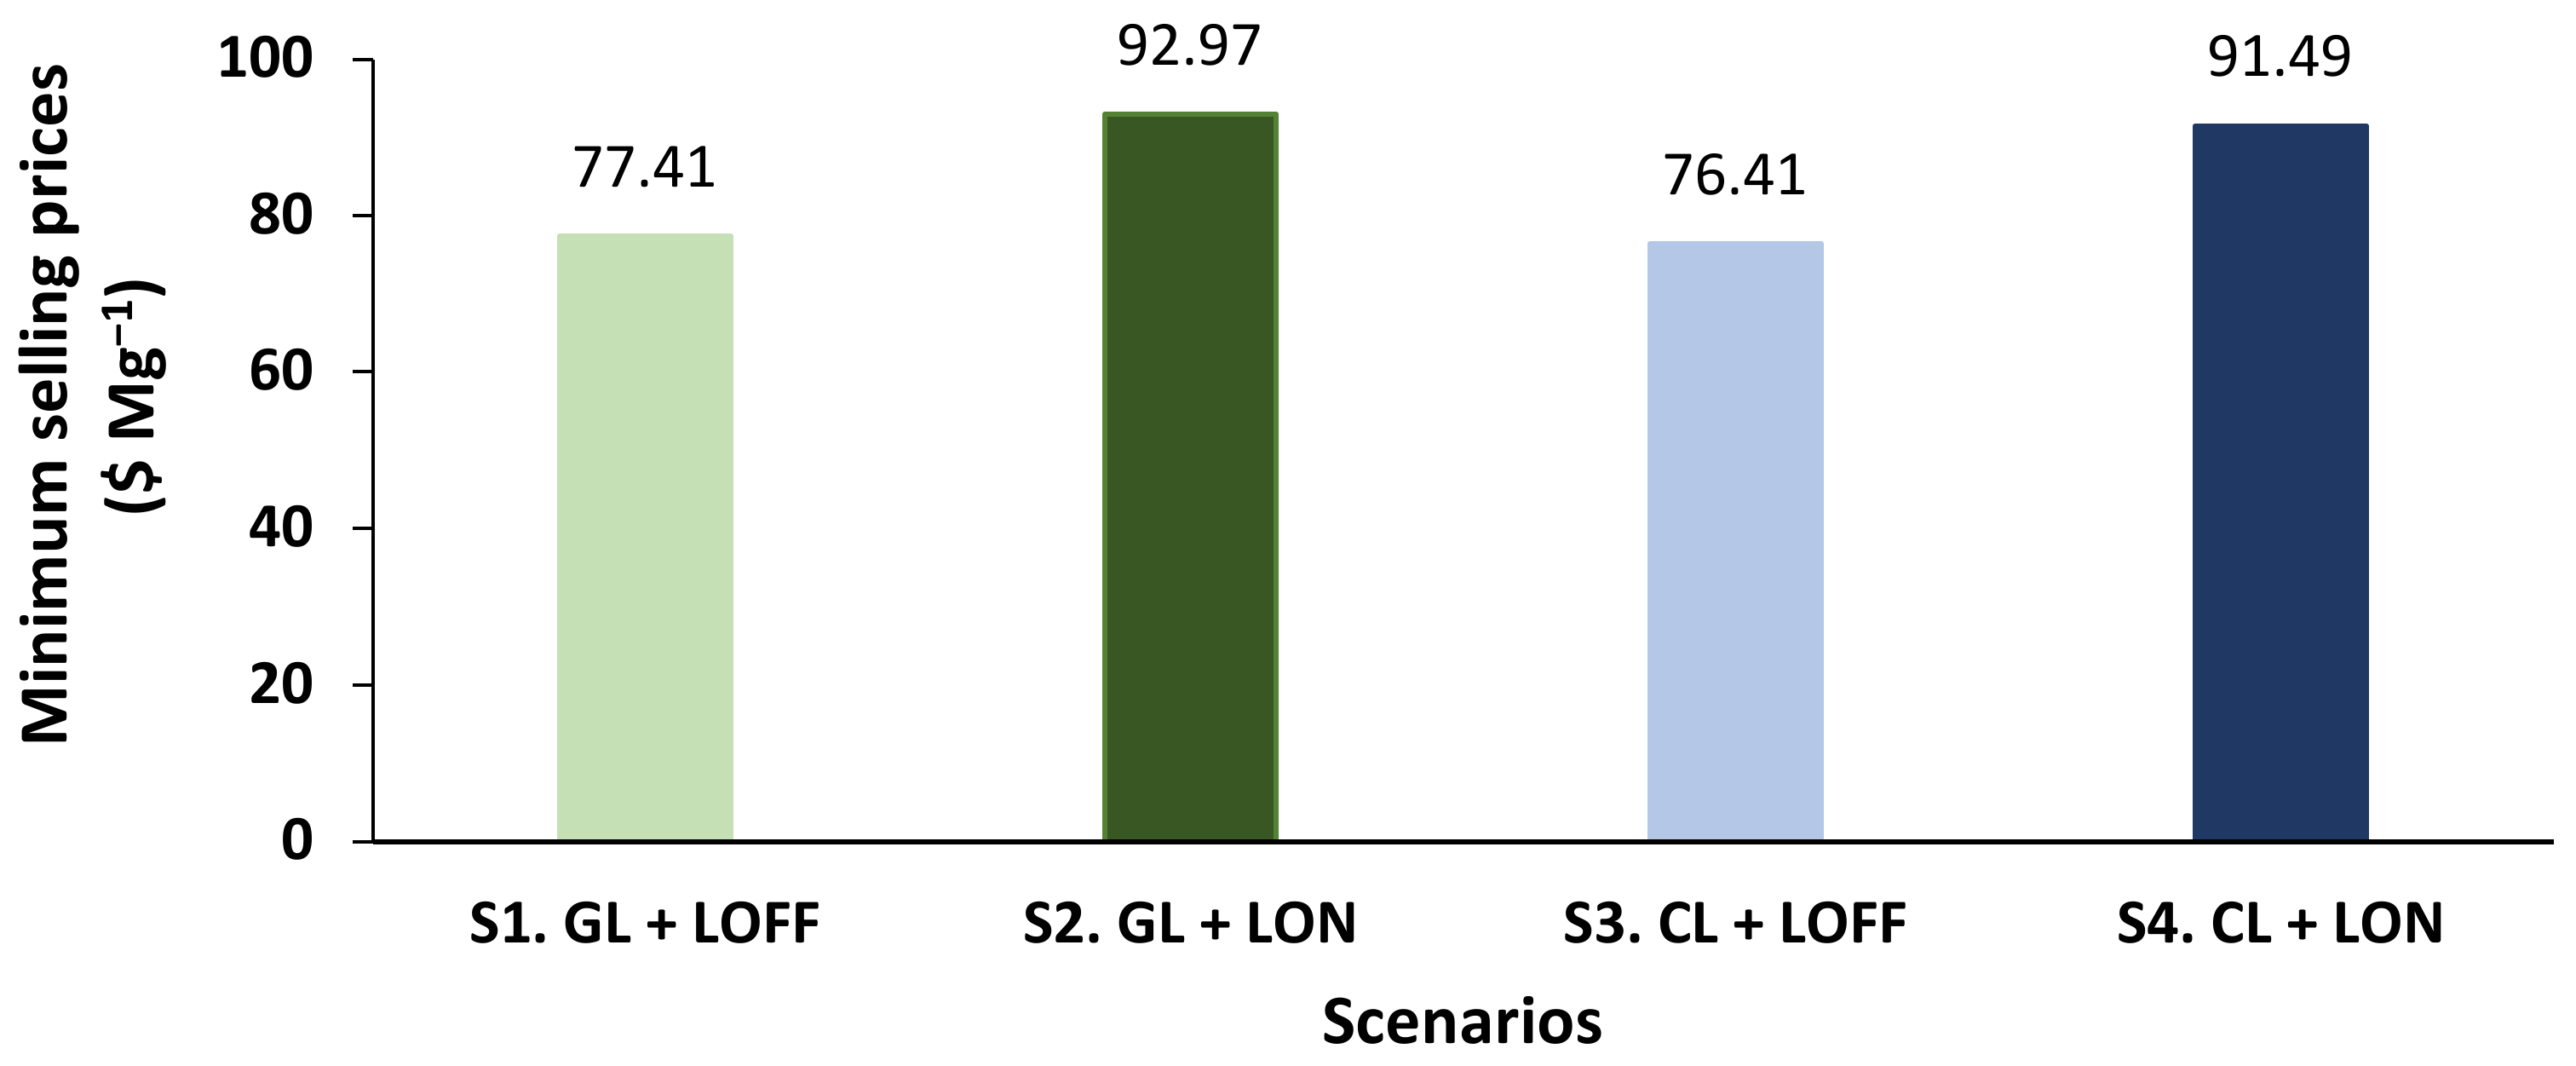
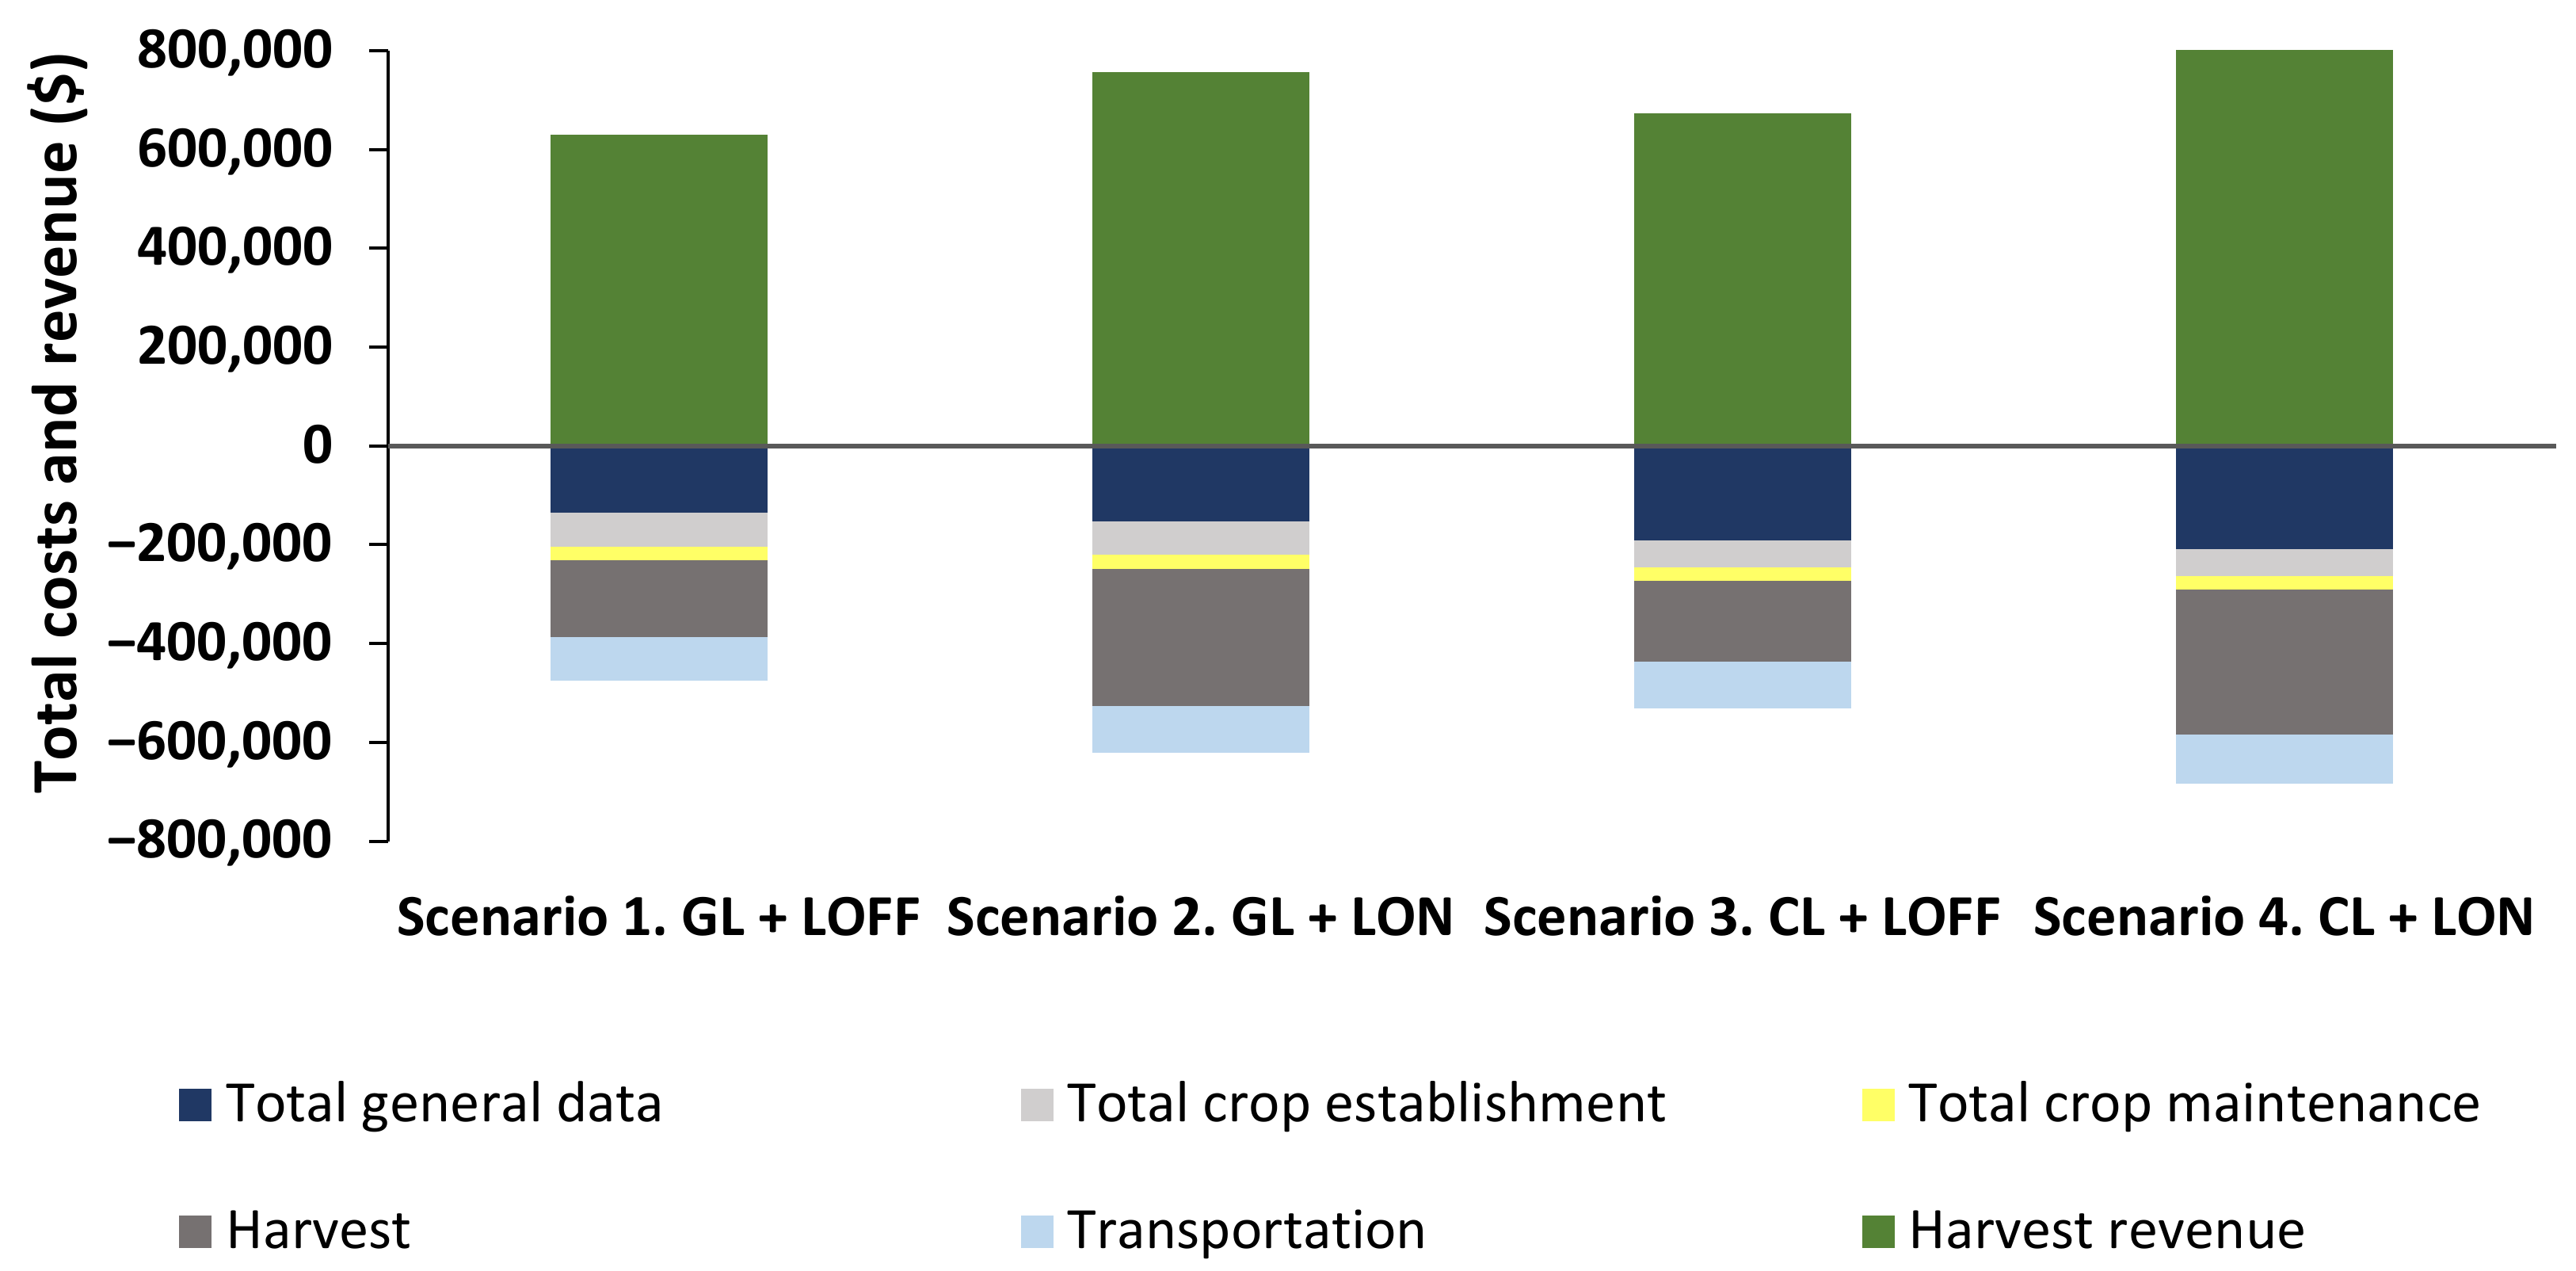
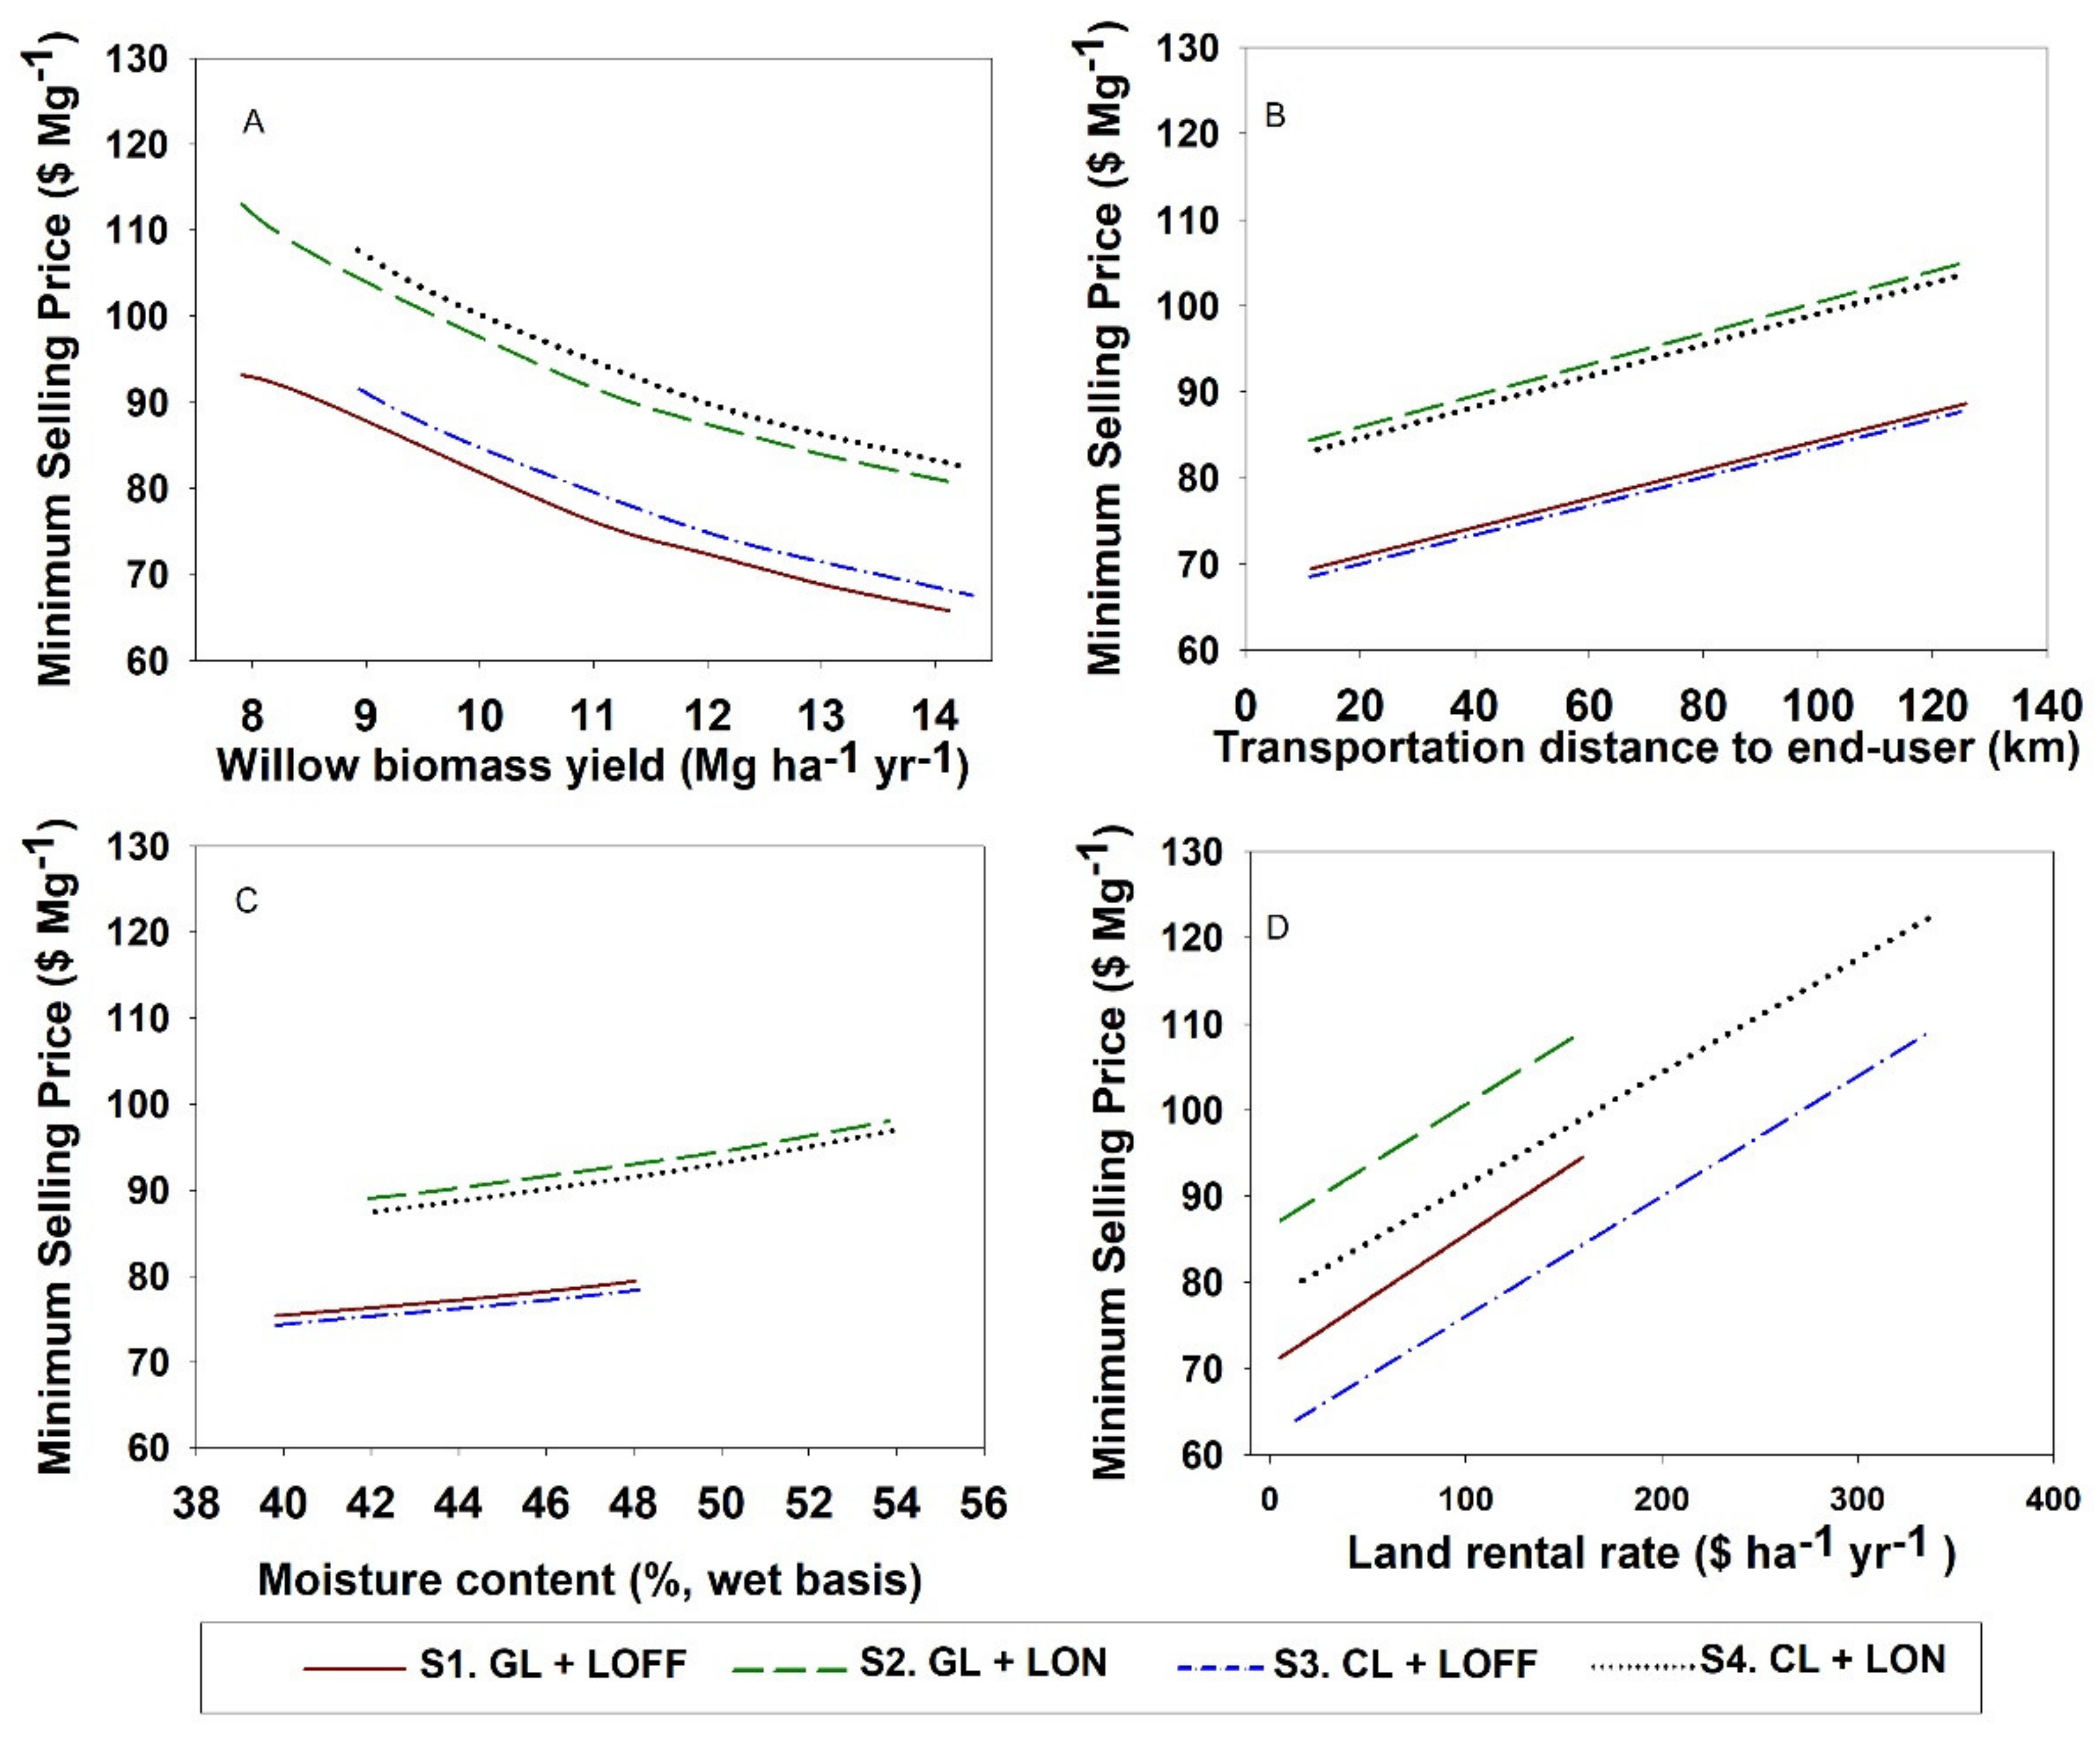
3.2. MSP Results
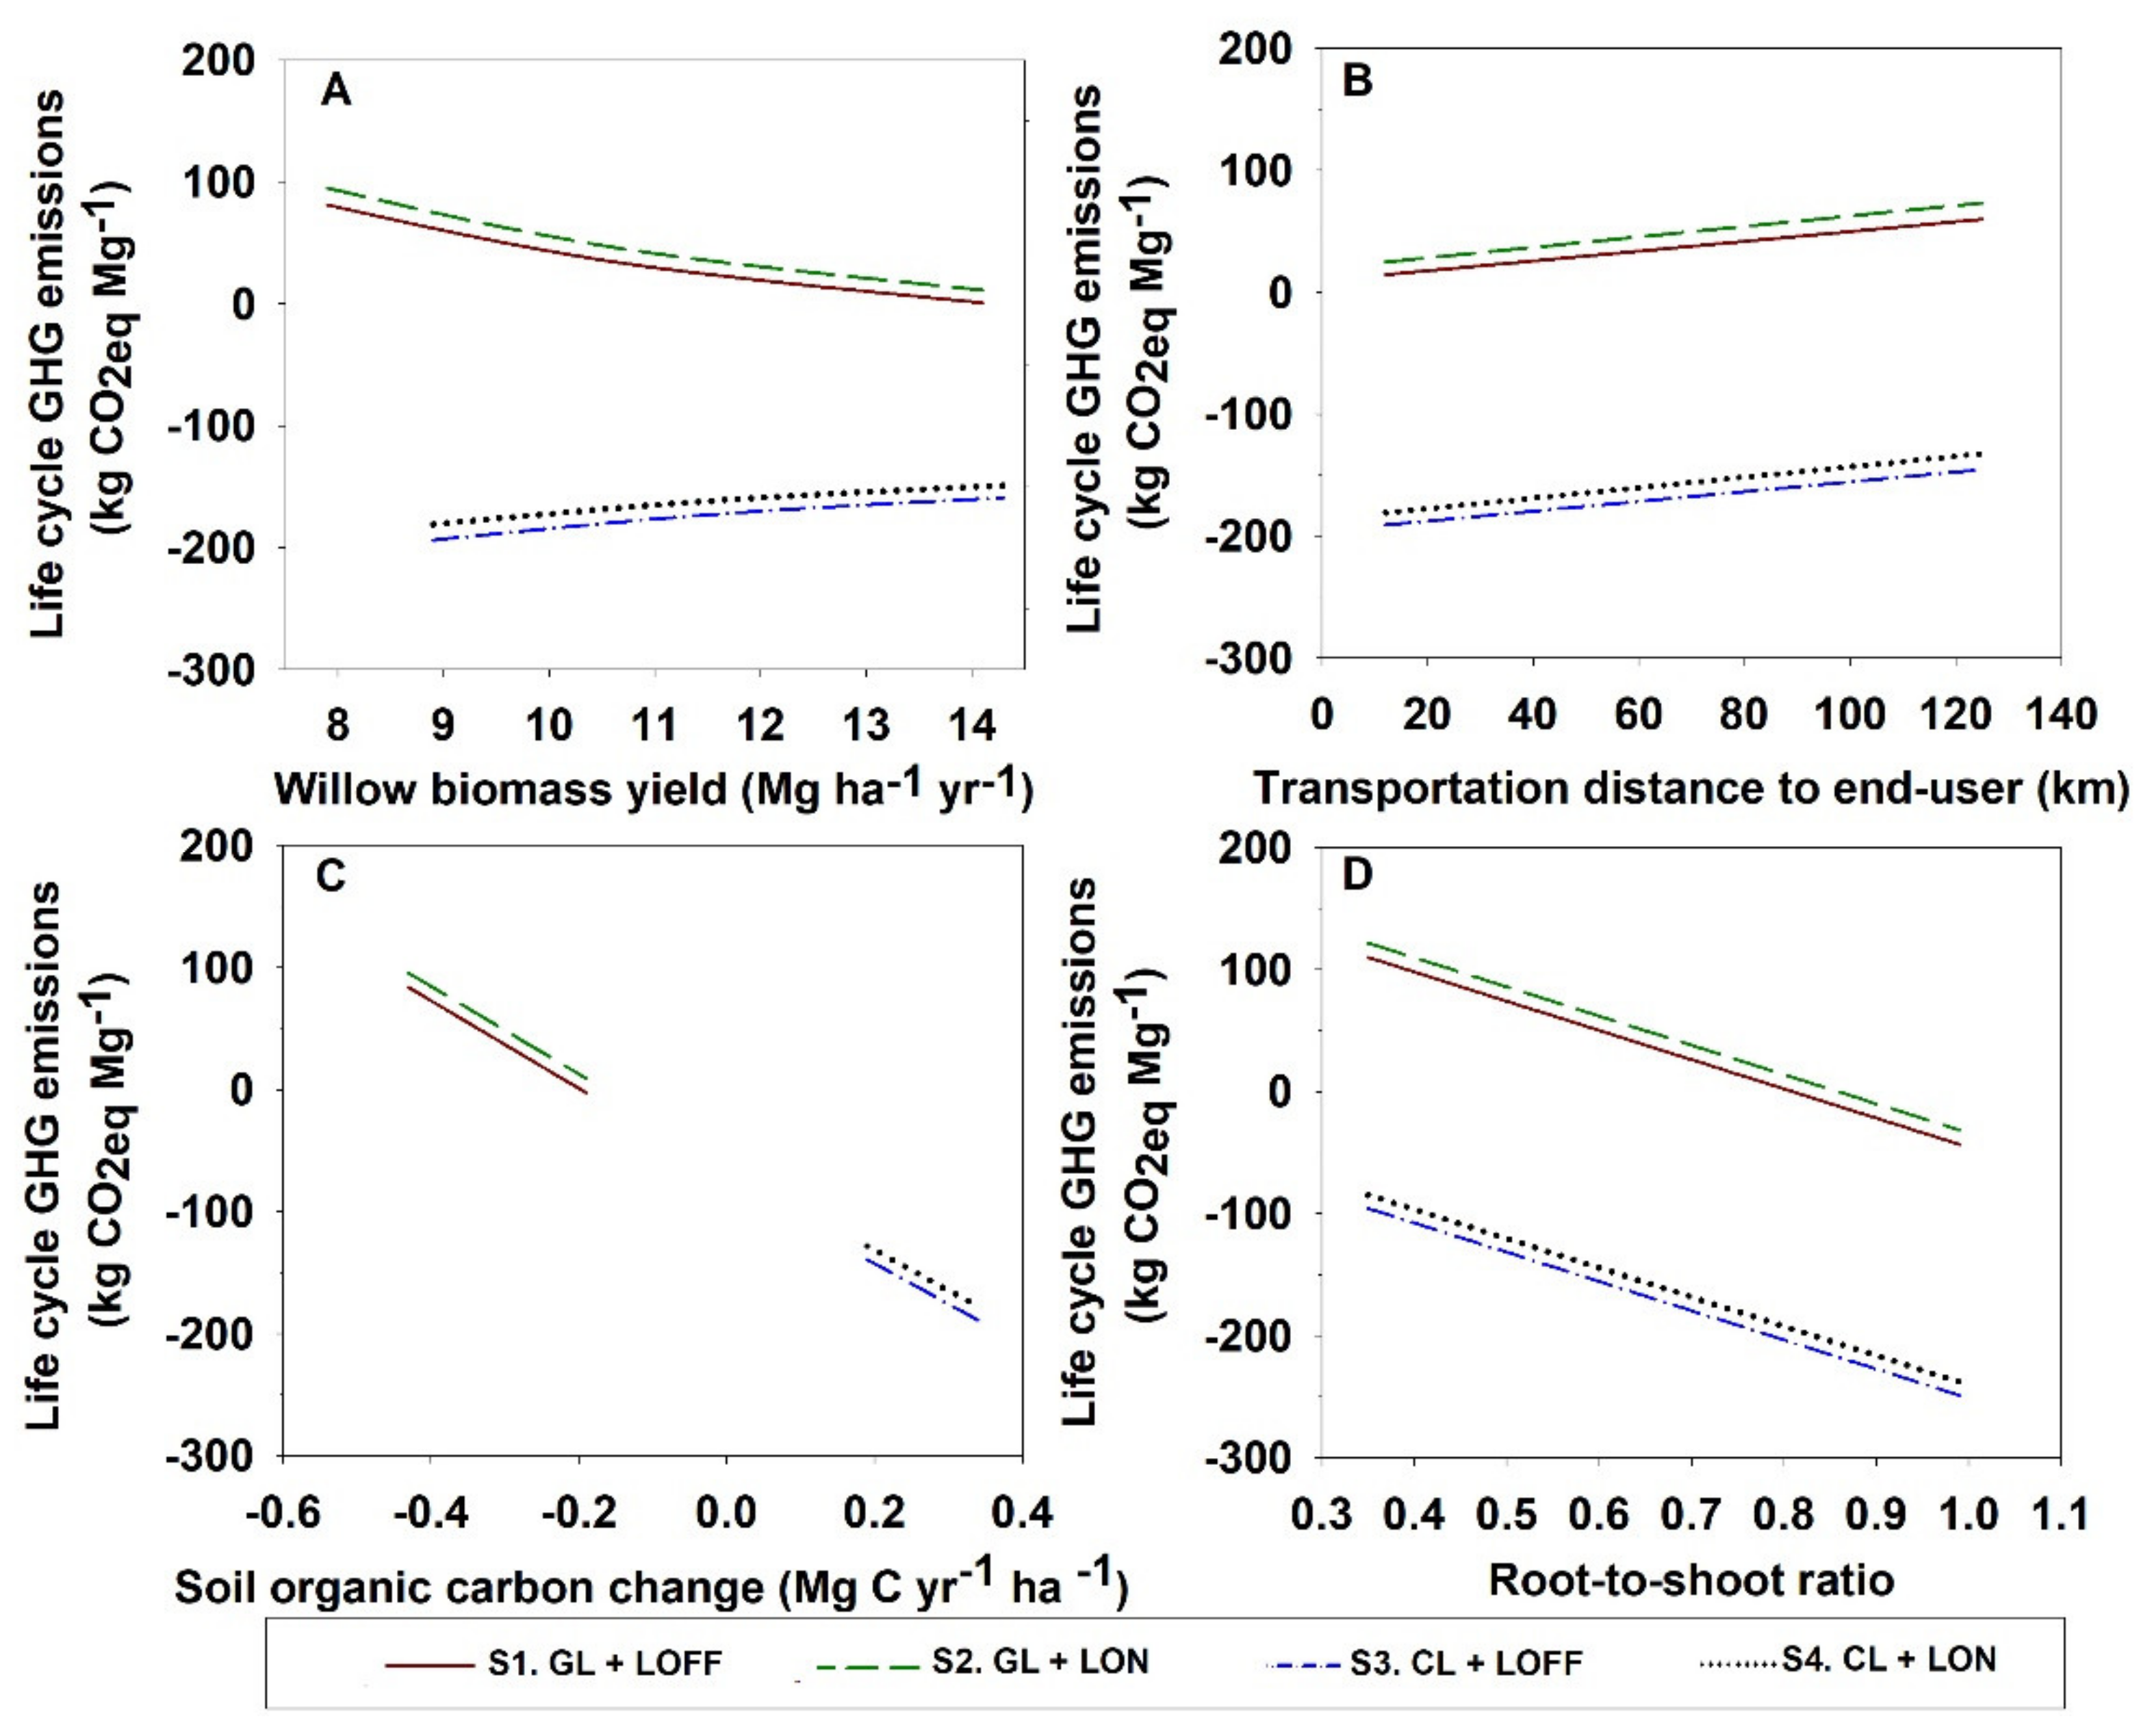
3.3. Life Cycle Environmental and Financial Impacts
3.4. CAC Values
4. Conclusions
Author Contributions
Funding
Institutional Review Board Statement
Informed Consent Statement
Data Availability Statement
Acknowledgments
Conflicts of Interest
References
- U.S. Energy Information Administration (EIA). U.S. Energy Consumption by Source and Sector, 2019. 2019. Available online: https://www.eia.gov/totalenergy/data/monthly/pdf/flow/css_2019_energy.pdf (accessed on 1 January 2021).
- U.S. Energy Information Administration. Renewable Energy Explained. 2021. Available online: https://www.eia.gov/energyexplained/renewable-sources/ (accessed on 17 May 2022).
- Stoof, C.R.; Richards, B.K.; Woodbury, P.B.; Fabio, E.S.; Brumbach, A.R.; Cherney, J.; Das, S.; Geohring, L.; Hansen, J.; Hornesky, J.; et al. Untapped Potential: Opportunities and Challenges for Sustainable Bioenergy Production from Marginal Lands in the Northeast USA. Bioenergy Res. 2015, 8, 482–501. [Google Scholar] [CrossRef]
- Yang, S.; Volk, T.A.; Fortier, M.O.P. Willow biomass crops are a carbon negative or low-carbon feedstock depending on prior land use and transportation distances to end users. Energies 2020, 13, 4251. [Google Scholar] [CrossRef]
- Krzyżaniak, M.; Stolarski, M.J.; Szczukowski, S.; Tworkowski, J. Life Cycle Assessment of New Willow Cultivars Grown as Feedstock for Integrated Biorefineries. Bioenergy Res. 2016, 9, 224–238. [Google Scholar] [CrossRef] [Green Version]
- Frank, J.R.; Brown, T.R.; Volk, T.A.; Heavey, J.P. A stochastic techno-economic analysis of shrub willow production using EcoWillow 3.0S. Biofuels Bioprod. Biorefining 2018, 12, 846–856. [Google Scholar] [CrossRef]
- Styles, D.; Jones, M.B. Life-cycle environmental and economic impacts of energy-crop fuel-chains: An integrated assessment of potential GHG avoidance in Ireland. Environ. Sci. Policy 2008, 11, 294–306. [Google Scholar] [CrossRef]
- Tanzer, S.E.; Posada, J.; Geraedts, S.; Ramírez, A. Lignocellulosic marine biofuel: Technoeconomic and environmental assessment for production in Brazil and Sweden. J. Clean. Prod. 2019, 239, 117845. [Google Scholar] [CrossRef]
- Jones, S.; Meyer, P.; Snowden-Swan, L.; Padmaperuma, A.; Tan, E.; Dutta, A.; Jacobson, J.; Cafferty, K. Process Design and Economics for the Conversion of Lignocellulosic Biomass to Hydrocarbon Fuels. 2013. Available online: https://www.osti.gov/biblio/1126275-process-design-economics-conversion-lignocellulosic-biomass-hydrocarbon-fuels-fast-pyrolysis-hydrotreating-bio-oil-pathway (accessed on 17 May 2022).
- Sheehan, J.; Aden, A.; Paustian, K.; Killian, K.; Brenner, J.; Walsh, M.; Nelson, R. Energy and environmental aspects of using corn stover for fuel ethanol. J. Ind. Ecol. 2003, 7, 117–146. [Google Scholar] [CrossRef]
- Meyer, P.A.; Snowden-Swan, L.J.; Rappé, K.G.; Jones, S.B.; Westover, T.L.; Cafferty, K.G. Field-to-Fuel Performance Testing of Lignocellulosic Feedstocks for Fast Pyrolysis and Upgrading: Techno-economic Analysis and Greenhouse Gas Life Cycle Analysis. Energy Fuels 2016, 30, 9427–9439. [Google Scholar] [CrossRef]
- Liu, W.; Wang, J.; Richard, T.L.; Hartley, D.S.; Spatari, S.; Volk, T.A. Economic and life cycle assessments of biomass utilization for bioenergy products. Biofuels Bioprod. Biorefining 2017, 11, 633–647. [Google Scholar] [CrossRef]
- Rajendran, K.; Murthy, G.S. How does technology pathway choice influence economic viability and environmental impacts of lignocellulosic biorefineries? Biotechnol. Biofuels 2017, 10, 268. [Google Scholar] [CrossRef]
- Olofsson, J.; Barta, Z.; Börjesson, P.; Wallberg, O. Integrating enzyme fermentation in lignocellulosic ethanol production: Life-cycle assessment and techno-economic analysis. Biotechnol. Biofuels 2017, 10, 51. [Google Scholar] [CrossRef] [Green Version]
- Rajendran, K. Effect of Moisture Content on Lignocellulosic Power Generation: Energy, Economic and Environmental Impacts. Processes 2017, 5, 78. [Google Scholar] [CrossRef] [Green Version]
- Shah, A.; Baral, N.R.; Manandhar, A. Technoeconomic Analysis and Life Cycle Assessment of Bioenergy Systems. Adv. Bioenergy 2016, 1, 189–247. [Google Scholar] [CrossRef]
- Wang, Y.; Wang, J.; Zhang, X.; Grushecky, S. Environmental and Economic Assessments and Uncertainties of Multiple Lignocellulosic Biomass Utilization for Bioenergy Products: Case Studies. Energies 2020, 13, 6277. [Google Scholar] [CrossRef]
- Djomo, S.N.; Kasmioui, O.E.; Ceulemans, R. Energy and greenhouse gas balance of bioenergy production from poplar and willow: A review. GCB Bioenergy 2011, 3, 181–197. [Google Scholar] [CrossRef]
- Zakaria, A.; Ismail, F.B.; Lipu, M.S.H.; Hannan, M.A. Uncertainty models for stochastic optimization in renewable energy applications. Renew. Energy 2020, 145, 1543–1571. [Google Scholar] [CrossRef]
- Caputo, J.; Balogh, S.B.; Volk, T.A.; Johnson, L.; Puettmann, M.; Lippke, B.; Oneil, E. Incorporating Uncertainty into a Life Cycle Assessment (LCA) Model of Short-Rotation Willow Biomass (Salix spp.) Crops. Bioenergy Res. 2014, 7, 48–59. [Google Scholar] [CrossRef]
- Shah, A.; Darr, M. A techno-economic analysis of the corn stover feedstock supply system for cellulosic biorefineries. Biofuels Bioprod. Biorefining 2016, 10, 542–559. [Google Scholar] [CrossRef]
- Yang, S. Understanding Land Use and Land Cover Change: National Forest Dynamics and Regional Willow Crop Environmental Impacts Based on Spatial Modeling and Spatial Life Cycle Assessment. Ph.D. Thesis, State University of New York, Syracuse, NY, USA, 2017. [Google Scholar]
- Qin, Z.; Dunn, J.B.; Kwon, H.; Mueller, S.; Wander, M.M. Soil carbon sequestration and land use change associated with biofuel production: Empirical evidence. GCB Bioenergy 2016, 8, 66–80. [Google Scholar] [CrossRef] [Green Version]
- Eisenbies, M.H.; Volk, T.A.; de Souza, D.P.L.; Hallen, K.W. Cut-and-chip harvester material capacity and fuel performance on commercial-scale willow fields for varying ground and crop conditions. GCB Bioenergy 2020, 12, 380–395. [Google Scholar] [CrossRef] [Green Version]
- Eisenbies, M.H.; Volk, T.A.; Posselius, J.; Shi, S.; Patel, A. Quality and Variability of Commercial-Scale Short Rotation Willow Biomass Harvested Using a Single-Pass Cut-and-Chip Forage Harvester. Bioenergy Res. 2015, 8, 546–559. [Google Scholar] [CrossRef]
- Sleight, N.J.; Volk, T.A. Recently Bred Willow (Salix spp.) Biomass Crops Show Stable Yield Trends Over Three Rotations at Two Sites. Bioenergy Res. 2016, 9, 782–797. [Google Scholar] [CrossRef]
- Qin, Z.; Dunn, J.B.; Kwon, H.; Mueller, S.; Wander, M.M. Influence of spatially dependent, modeled soil carbon emission factors on life-cycle greenhouse gas emissions of corn and cellulosic ethanol. GCB Bioenergy 2016, 8, 1136–1149. [Google Scholar] [CrossRef]
- Brown, T.R. A critical analysis of thermochemical cellulosic biorefinery capital cost estimates. Biofuels Bioprod. Biorefining 2015, 9, 412–421. [Google Scholar] [CrossRef]
- EIA. Gasoline and Diesel Fuel Update 2014; U.S. Energy Information Administration: Washington, DC, USA, 2011.
- National Agricultural Statistics Service United States Department of Agriculture. 2014 Census of Agriculture; National Agricultural Statistics Service United States Department of Agriculture: Washington, DC, USA, 2014.
- New York State Energy Research and Development Authority (NYSERDA). Renewable Fuels Roadmap and Sustainable Biomass Feedstock Supply for New York; New York State Energy Research and Development Authority: Albany, NY, USA, 2010. [Google Scholar]
- Gregory, A.S.; Dungait, J.A.J.; Shield, I.F.; Macalpine, W.J.; Cunniff, J.; Durenkamp, M.; White, R.P.; Joynes, A.; Richter, G.M. Species and Genotype Effects of Bioenergy Crops on Root Production, Carbon and Nitrogen in Temperate Agricultural Soil. Bioenergy Res. 2018, 11, 382–397. [Google Scholar] [CrossRef] [Green Version]
- Pacaldo, R.S.; Volk, T.A.; Briggs, R.D. Carbon Sequestration in Fine Roots and Foliage Biomass Offsets Soil CO2 Effluxes along a 19-year Chronosequence of Shrub Willow (Salix x dasyclados) Biomass Crops. Bioenergy Res. 2014, 7, 769–776. [Google Scholar] [CrossRef]
- Pacaldo, R.S.; Volk, T.A.; Briggs, R.D. Greenhouse Gas Potentials of Shrub Willow Biomass Crops Based on Below- and Aboveground Biomass Inventory Along a 19-Year Chronosequence. Bioenergy Res. 2013, 6, 252–262. [Google Scholar] [CrossRef]
- De Klein, C.; Novoa, R.; Ogle, S.; Smith, K.; Rochette, P.; Wirth, T. N20 Emissions from Managed Soils, and CO2 Emissions from Lime and Urea Application. In 2006 IPCC Guidelines for National Greenhouse Gas Inventories; Institute for Global Environmental Strategies (IGES) for the IPCC: Kanagawa, Japan, 2006; Available online: https://www.ipcc-nggip.iges.or.jp/public/2006gl/pdf/4_Volume4/V4_11_Ch11_N2O&CO2.pdf (accessed on 10 December 2021).
- Environmental Protection Agency (EPA). Greenhouse Gas Emissions: Understanding Global Warming Potentials. 2020. Available online: https://www.epa.gov/ghgemissions/understanding-global-warming-potentials (accessed on 12 January 2021).
- Therasme, O.; Volk, T.A.; Eisenbies, M.H.; San, H.; Usman, N. Hot Water Extracted and Non-extracted Willow Biomass Storage Performance: Fuel Quality Changes and Dry Matter Losses. Front. Energy Res. 2020, 7, 165. [Google Scholar] [CrossRef] [Green Version]
- Abrahamson, L.P.; Volk, T.A.; Smart, L.B.; Cameron, K.D. Shrub Willow Biomass Producer’s Handbook; State University of New York: Syracuse, NY, USA, 2010. [Google Scholar]
- Rutz, D.; Dimitrious, L. Sustainable Short Rotation Coppice: A Handbook; WIP Renewable Energies: Munich, Germany, 2015. [Google Scholar]
- De Souza, D. Nutrient Removal in Willow Biomass Crops is Impacted over Multiple Rotations, Timing of Harvest, and Harvesting System. Ph.D. Thesis, State University of New York College of Environmental Science and Forestry, Syracuse, NY, USA, 2020. [Google Scholar]
- Sleight, N.J.; Volk, T.A.; Fandrich, K.; Eisenbies, M.H. Above- and belowground biomass of willow cultivars: Quantities, distribution and carbon storage. In Proceedings of the Mid Atlantic Biomass Energy Conference, State College, PA, USA, 12–14 September 2017. [Google Scholar]
- Heller, M.C.; Keoleian, G.A.; Volk, T.A. Life cycle assessment of a willow bioenergy cropping system. Biomass Bioenergy 2003, 25, 147–165. [Google Scholar] [CrossRef]
- Björnebo, L.; Spatari, S.; Gurian, P.L. A greenhouse gas abatement framework for investment in district heating. Appl. Energy 2018, 211, 1095–1105. [Google Scholar] [CrossRef]
- Department of Environmental Conservation. Establishing a Value of Carbon Guidelines for Use by State Agencies. 2020. Available online: https://www.dec.ny.gov/docs/administration_pdf/vocguid22.pdf (accessed on 17 May 2022).
- Masum, M.F.H.; Dwivedi, P.; Anderson, W.F. Estimating unit production cost, carbon intensity, and carbon abatement cost of electricity generation from bioenergy feedstocks in Georgia, United States. Renew. Sustain. Energy Rev. 2020, 117, 109514. [Google Scholar] [CrossRef]

| Activities Performed | Included in the Integrated Analysis | Timeline (Months) | ||
|---|---|---|---|---|
| Cropland | Grassland | |||
| 1.0. Nursery | √ | √ | 1–12 | |
| 2.0. Field preparation | ||||
| 2.1. Vegetation removal | √ | √ | 4–7 | |
| 2.2. Contact herbicide application | × | √ | 4–7 | |
| 2.3. Plowing and tilling | × | √ | 8–9 | |
| 2.4. Disking | √ | √ | 8–9 | |
| 2.5. Plant cover crop | × | √ | 8–9 | |
| 2.6. Kill cover crop | × | √ | 16–17 | |
| 2.7. Planting | √ | √ | 16–17 | |
| 2.8. Preemergent herbicide application after planting | √ | √ | 16–17 | |
| 2.9. Weed control (1st growing season) | × | √ | 18–21 | |
| 2.10. Stool removal | √ | √ | 280–282 | |
| 3.0. Field maintenance | ||||
| 3.1. Coppicing | √ | √ | 25–27 | |
| 3.2. Weed control (2nd growing season) | √ | √ | 30–33 | |
| 3.3. Fertilizer application | √ | √ | 29,65,101,137,173,209,245 | |
| 4.0. Harvest and transportation | Leaf-off | Leaf-on | ||
| 4.1. Harvest operation | √ | √ | 59–63, 95–99, 131–135, 167–171, 203–207, 239–243, 275–279 | 54–58, 90–94, 126–130, 162–166, 198–202, 234–238, 270–274 |
| 4.2. Transportation to end user’s gate | √ | √ | ||
| 5.0. Miscellaneous | ||||
| 5.1. Underground carbon change (roots) a | √ | √ | ||
| 5.2. Direct land-use change (SOC) a | √ | √ | ||
| 5.3. Leaf decay a | √ | √ | ||
| 5.4. Administration costs b | √ | √ | 1–282 | |
| 5.5. Land rental costs b | √ | √ | 1–282 | |
| Variable Input Parameters | Units | 95% Confidence Interval | Type of Distribution | Source | |||
|---|---|---|---|---|---|---|---|
| S1. GL + LOFF | S2. GL + LON | S3. CL + LOFF | S4. CL + LON | ||||
| Willow yield (dry basis) | Mg ha−1 yr−1 | 7.90 to 14.12 | 7.91 to 14.11 | 8.94 to 14.33 | 8.93 to 14.26 | Beta: S1 & S2/Weibull: S3 & S4 | [4] |
| Moisture content | % (wet basis) | 39.83 to 48.02 | 41.93 to 53.83 | 39.83 to 48.12 | 42.09 to 54.06 | Beta | [25] |
| Transportation distance (field to end-user) | km | 12.65 to 125.79 | 12.33 to 124.96 | 12.42 to 124.88 | 12.58 to 124.27 | Gamma | [4] |
| Root-to-shoot ratio | 0.35 to 0.99 | 0.35 to 0.99 | 0.35 to 0.99 | 0.35 to 0.99 | Beta | [26] | |
| Soil organic carbon (SOC) change a | Mg C ha−1 yr−1 | −0.42 to −0.19 | −0.42 to −0.19 | 0.19 to 0.34 | 0.19 to 0.34 | Triangular | [4,23,27] |
| Planting costs | $ ha−1 | 1154.72 to 1754.96 | 1152.17 to 1754.14 | 1153.06 to 1751.69 | 1155.48 to 1752.06 | Beta | [28] |
| Farm (base) diesel price b | % change | −11.95 to 15.48 | −11.95 to 15.48 | −11.95 to 15.48 | −11.95 to 15.48 | Logistic | [29] |
| Land rental rates | $ ha−1 yr−1 | 6.41 to 159.73 | 6.59 to 156.02 | 16.35 to 337.72 | 16.35 to 336.59 | Gamma | [30] |
| Harvesting Parameters | Units | S1. GL + LOFF | S2. GL + LON | S3. CL + LOFF | S4. CL + LON |
|---|---|---|---|---|---|
| Harvester efficiency | % | 0.91 | 0.88 | 0.90 | 0.88 |
| Fuel consumption (in-row) | L ha−1 | 70.77 | 138.16 | 74.89 | 144.48 |
| Harvest rate | ha h−1 | 1.26 | 0.57 | 1.19 | 0.53 |
| Harvest throughput | Mgwet h−1 | 73.21 | 35.16 | 74.57 | 35.88 |
| Harvester speed | km h−1 | 6.30 | 2.84 | 5.93 | 2.67 |
| Harvester rental (excluding fuel) | $ h−1 | 350 | 350 | 350 | 350 |
Publisher’s Note: MDPI stays neutral with regard to jurisdictional claims in published maps and institutional affiliations. |
© 2022 by the authors. Licensee MDPI, Basel, Switzerland. This article is an open access article distributed under the terms and conditions of the Creative Commons Attribution (CC BY) license (https://creativecommons.org/licenses/by/4.0/).
Share and Cite
Frank, J.; Therasme, O.; Volk, T.A.; Brown, T.; Malmsheimer, R.W.; Fortier, M.-O.; Eisenbies, M.H.; Ha, H.; Heavey, J. Integrated Stochastic Life Cycle Assessment and Techno-Economic Analysis for Shrub Willow Production in the Northeastern United States. Sustainability 2022, 14, 9007. https://doi.org/10.3390/su14159007
Frank J, Therasme O, Volk TA, Brown T, Malmsheimer RW, Fortier M-O, Eisenbies MH, Ha H, Heavey J. Integrated Stochastic Life Cycle Assessment and Techno-Economic Analysis for Shrub Willow Production in the Northeastern United States. Sustainability. 2022; 14(15):9007. https://doi.org/10.3390/su14159007
Chicago/Turabian StyleFrank, Jenny, Obste Therasme, Timothy A. Volk, Tristan Brown, Robert W. Malmsheimer, Marie-Odile Fortier, Mark H. Eisenbies, HakSoo Ha, and Justin Heavey. 2022. "Integrated Stochastic Life Cycle Assessment and Techno-Economic Analysis for Shrub Willow Production in the Northeastern United States" Sustainability 14, no. 15: 9007. https://doi.org/10.3390/su14159007