Article

Bioremediation of Vanadium from Contaminated Water in Bioreactor Using Methylocystis hirsuta Bacterium: Comparisons with In Silico 2D and 3D Simulations

by
Fatemeh Samaei
1,†,
Fatemeh Yazdian
2,*,†,
Farid Menaa
3,*,† and
Ashrafalsadat Hatamian-Zarmi
2,†
1
Technical and Engineering Faculty, Islamic Azad University, Tehran 14778-93855, Iran
2
Department of Life Science Engineering, Faculty of New Science and Engineering, University of Tehran, Tehran 14179-35840, Iran
3
Departments of Internal Medicine and Advanced Technologies, Fluorotronics-California Innovations Corporation, San Diego, CA 92037, USA
*
Authors to whom correspondence should be addressed.
These authors contributed equally to this work.
Sustainability 2022, 14(14), 8807; https://doi.org/10.3390/su14148807
Submission received: 8 March 2022 / Revised: 22 June 2022 / Accepted: 4 July 2022 / Published: 19 July 2022
(This article belongs to the Special Issue Advances in Technologies for Wastewater Treatment and Reuse)

Abstract

:
The elimination of poisonous wastes (e.g., heavy metals) from polluted water remains challenging, both in industrialized societies and developing countries. To overcome this human health and environmental issue, biotechnology (e.g., biosorption, bioaccumulation) is being applied as an economic and eco-friendly option compared to physicochemical methods (e.g., adsorption, membrane filtration, and coagulation–flocculation). The development of the appropriate biotechnology process (i.e., bioremediation) requires more accurate information and details, which are possible to obtain through the design of a set of resources and various computer applications. In sustainable remediation, microorganisms are one of the feasible choices for modifying and remaking the natural condition. In this in silico study, the methanotroph Methylocystis hirsuta (M. hirsuta) was used for the first time to simulate the removal of vanadium (Vn) from contaminated water through two-dimensional (2D) and three-dimensional (3D) modeling using COMSOL 4.4 software. Rotating machinery-laminar flow, transport of diluted species, and reaction engineering physics were also used. Independency analyses of the numerical network, concentration contour, velocity contour, concentration–time, and velocity–distance charts were also calculated. The data consistently showed that the removal of Vn increased with increasing velocity (which depends on time). Indeed, the amount of pollutant removal at 120 rpm, 160 rpm, and 200 rpm was maintained at 10%, 12%, and 12%, respectively. The simulation results showed excellent conformity (less than 20%) with previously reported laboratory results. This proposed model of bioremediation is thus a reliable and accurate solution for the removal of heavy metals (i.e., Vn and possibly others) from polluted areas (such as contaminated water).

1. Introduction

It is worth mentioning that industries producing heavy metals most often discharge contaminated wastewater with large amounts of metals such as cadmium (Cd), chrome (Cr), copper (Cu), nickel (Ni), arsenic (As), lead (Pb), vanadium (Vn), and zinc (Zn). De facto, these industries represent the most dangerous chemical-intensive industries [1,2,3]. Cleaning up the contaminated water and soil from heavy metals is challenging because they are nonbiodegradable [3,4]. Since many natural environments worldwide are contaminated by heavy metallic waste, the development of cost-effective technologies to remove this waste from polluted water and soil has become urgent and important [3,5,6].
The different physicochemical methods currently applied to remove heavy metals from wastewater, such as chemical precipitation, ion exchange, adsorption, membrane filtration, coagulation–flocculation, flotation, and electrochemical methods have been largely described [3,7,8]. Herein, we report the application of biological and computer-based methods. If the concentration of heavy metals is extremely low, physicochemical methods (e.g., remediation by solvent, adsorption, and absorption by some materials) are unsuitable or costly. In this situation, to remove heavy metals, biological methods such as biosorption and bioaccumulation are noteworthy options [9]. In sustainable remediation, using microorganisms and plants is one of the feasible choices for modifying and remaking the natural condition of the soil. Indeed, although high levels of heavy metals in the soil lead to disadvantageous modification of the microbial community, low concentrations are crucial for microorganism growth [10].
The calculated use of biological degradation methods (such as plants, microorganisms, and microbial processes or products) to remove, degrade, or decrease the concentration of environmental pollutants/contaminants from places where they have been released is called bioremediation [3,11,12]. Pollutant concentrations are decreased to acceptable levels in the areas owned by farmers and/or regulatory agencies [13,14,15,16]. Bioremediation is most often used around the world to create healthier soils, to decontaminate sediments, to clean up water sources (e.g., groundwater aquifers), and to improve air quality [16]. Usually, the control measures required to reach optimal process conditions are evaluated [17,18]. Some of the advantages and disadvantages of using bioremediation processes in comparison with other remediation technologies can be inserted. Therefore, unlike the disruptive excavation-based remediation processes, bioremediation is less intrusive and facilitates remediation of environmental impacts without damaging delicate ecosystems [16,19,20,21]. Susceptibility of bioremediation to environmental changes, such as differences in available oxygen, pH, or temperature [22], must be considered. Interestingly, bioremediation is much less expensive for treating a hazardous waste compared to that of conventional treatment methods such as vacuuming, absorbing, burning, dispersing, or moving/transferring contaminants from one environmental medium to another [14,16,23]. Bioremediation often requires very long periods of time [24,25]. The products of biodegradation may be more persistent or toxic than the parent compound [26,27].
To remove Cu, Cd, and Pb, some bacteria, including Bacillus sp., Pseudomonas sp., Micrococcus sp., Thiobacillus ferroxidans, and leptospirillum ferroxidans, are used to oxidize iron and sulfur [28]. In a study to investigate biosorption characteristics of Cr (VI), Cu (II), and Fe (III) ions, the living biomass of Bacillus licheniformis was used [29]. Vn is used widely in steelmaking as an industrially vital element. A high concentration of Vn in the human body causes dizziness, vomiting, nausea, and kidney damages; its pollution in water is a global issue [30]. Nowadays, to remove sulfide from streams, chemical methods are switched to biological methods, including the use of sulfur oxidizing bacteria (SOB). Due to the presence of different types of bacteria and diversity in their capabilities, the abilities of seven well-known SOBs were studied [31].
Herein, the methanotroph Methylocystis hirsuta was used to remove Vn. M. hirsuta, isolated from a groundwater aquifer, is an anaerobic and Gram-negative bacterium with single or cluster cells of relatively small size (0.3–0.6 × 0.7–1 μm). M. hirsuta reproduces by normal cell division; budding division does not occur. Cells are not motile but possess a spiny surface layer composed of polysaccharides [23]. In this study, a one-dimensional (1D) reactive transport model that was time-dependent was used. Several biogeochemical processes were simulated during the trace-metal-contaminated bioremediation of aquifers. The numerical solution of equations was determined by finite difference approximation. Before designing uranium bioremediation, some key processes must be simulated to achieve the highest accuracy [32].
In this study, and to the best of our knowledge, the Vn reduction through 2D and 3D simulations using Comsol Multiphysics software was reported for the first time. The rotating machinery-laminar flow, transport of diluted species, and reaction engineering physics were used. The in silico results were compared with experimental data. Independency analyses of the numerical network, concentration contour, velocity contour, concentration–time chart, and velocity–distance chart were also calculated.

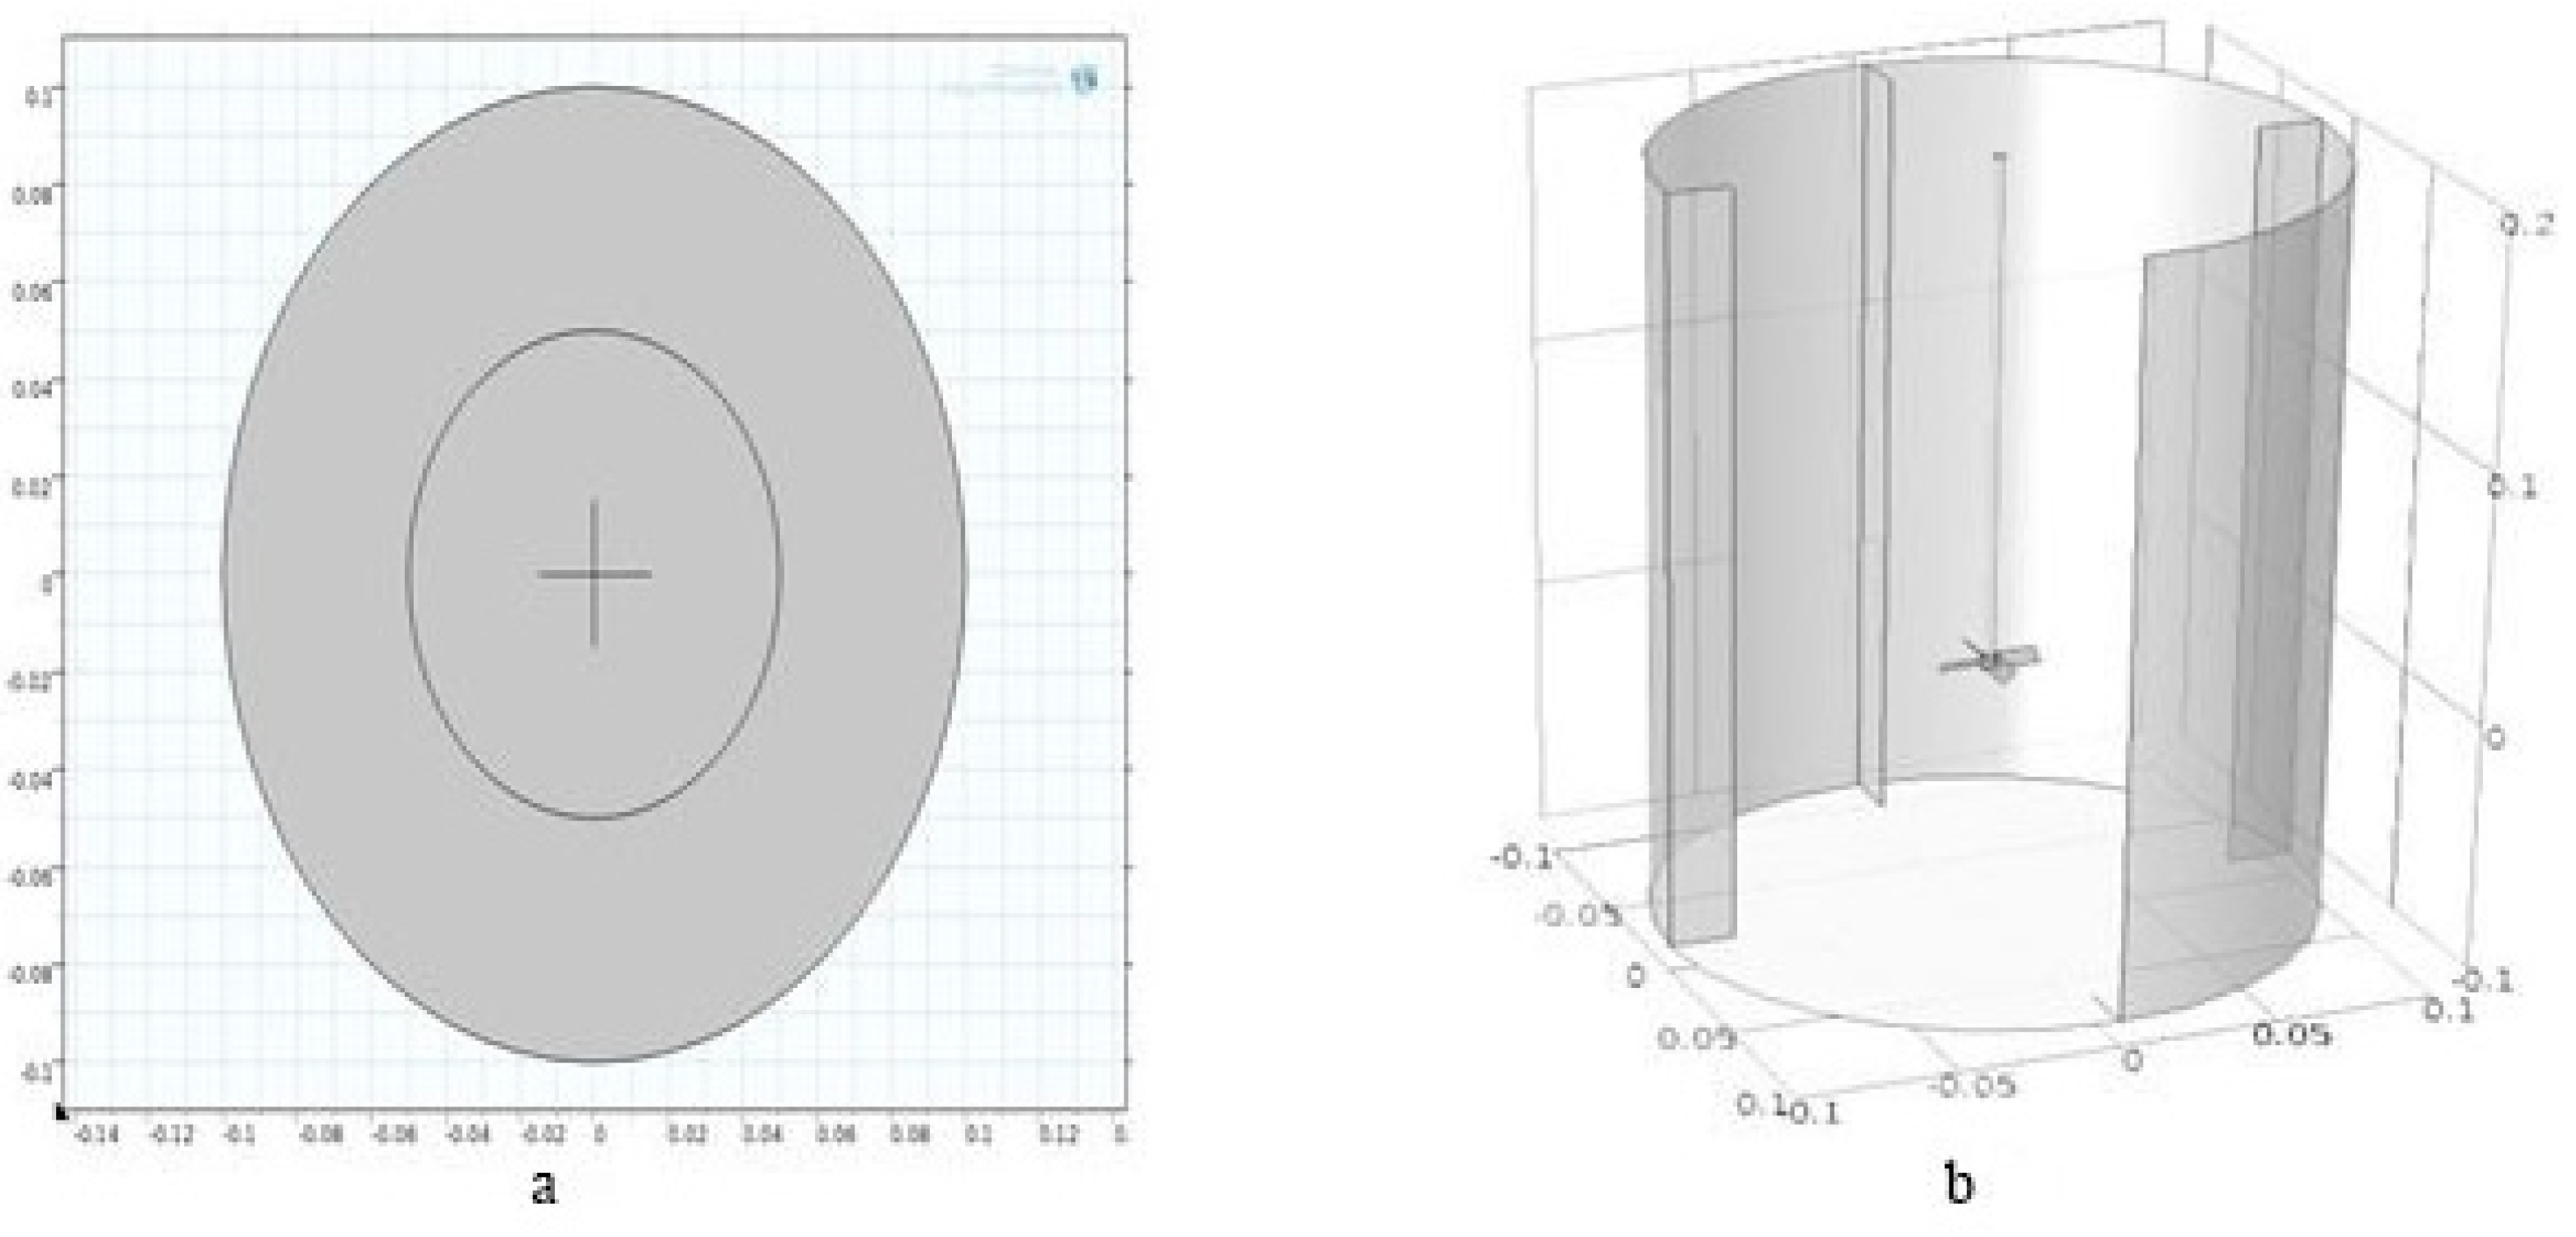
2. Material and Methods

In this simulation, the M. hirsuta performance on the removal of biological contaminants was simulated. Two geometries were designed in 2D and 3D using the Comsol Multiphysics 4.4 software. Several simplifying assumptions, boundary conditions, and meshing geometry were used in the system.
Simplifying assumptions
The assumptions for the simulation were the following:
  • The culture medium with microorganisms and the inside metal was considered a single-phase.
  • The vanadium concentration and microorganisms were spread homogeneously throughout the system.
  • The physical properties of the solution changing with time were ignored.
  • The system temperature was constant and set at 25 °C [33,34].
Model Geometry
The model comprised two parts (i.e., a vessel and an impeller with 4 blades with pitch angel of 45°) and was made by employing 2D and 3D COMSOL software. Figure 1 shows the 2D and 3D structures of the model. In a 2D structure, the vessel diameter and the impeller diameter were assumed at 0.2 m and 0.08 m, respectively. In 3D, the vessel diameter, height, and the impeller diameter were assumed at 0.2 m, 0.3 m, and 0.03 m, respectively.
The whole model in 2D was meshed as a free triangle and had a finer size, and it was divided into 9630 elements. In contrast, the model in 3D was meshed as a free tetrahedron and was divided into 38,091 elements.
Governing Equation
COMSOL has several types of physics for different simulations [35]. In the current simulation, three physics were used: (i) rotating machinery-laminar flow, (ii) transport of diluted species, and (iii) reaction engineering.
Rotating machinery-laminar flow
Due to the Reynolds number, the flow is laminar, and because of the existence of the impeller in bioreactor rotating machinery, laminar flow physics was selected.
Equations (1)–(4) show the governing relations to rotating flow. Equation (1) is the momentum equation, and Equation (2) represents the continuity equation.
ρ u t * + ρ ( u .   ) u = .   [ p I + μ ( u + ( u ) t ) 2 3 μ ( .   u ) I ] + F
ρ t * + .   ( ρ u ) = 0
d X = d X ( r b p , ω ,   t * )
ω = wt * , t * = frozen   time
where u, ρ, μ, and F are the velocity vector (m/s), density (kg/m3), viscosity (Pa·s), and body force term (N), respectively. rbp, ω, w, and t are the rotation axis base point, angular velocity (rad/s), angular frequency (rad/s), and frozen time (s), respectively [35].
Transport of diluted species
The transport of diluted species interface is used to compute the concentration field of a dilute solute in a solvent. The transport and reactions of the species dissolved in gas, liquid, or solid can be computed. The driving forces for transport can be diffusion by Fick’s law, convection when coupled to fluid flow, and migration when coupled to an electric field.
Depending on the licensed products, modeling multiple species transport is possible. Fick’s law (Equation (3)) is used in this physics [35].
c t + u .   c = .   ( D   c ) + R
where C, D, R, u, and t are the concentration of Vn (mol/m3), the diffusivity coefficient (m2/s), reaction rate (mol/m3·s), the velocity vector (m/s), and time (s), respectively.
The main equation that describes the solute transfer from aqueous phase is the continuity equation. This equation is also called the convection and diffusion equation [34]. The continuity equation should be solved numerically to obtain the concentration’s solute distribution. To solve the continuity equation, the velocity distribution is needed. Velocity distribution is obtained by solving the momentum equation, i.e., Navier–Stokes equations. Therefore, the momentum and continuity equations should be coupled and solved simultaneously to obtain the concentration distribution of solute [34].
Reaction engineering
The reactor type in which the reaction occurs is very important [35]. The design of an industrial chemical reactor must satisfy the requirements, which are the chemical factors, the mass transfer factors, the heat transfer factors, the safety factors, and economic factors [36]. The reactor is a batch, and the reaction is of the first order and is irreversible by governing the Equation (4):
d c i d t = ν i r
where c, t, r, and ν i are concentration (mol/m3), time (s), rate (mol/m3·s), and the Stoichiometric coefficients, respectively [35].

3. Results and Discussion

3.1. Independency Analysis of Numerical Network

To analyze the numerical network, the geometry was meshed into three types.
Table 1 shows the number of mesh elements in various mesh types. The final concentration of Vn (in the last time step) was checked. There was no significant difference in the final concentration of Vn, and independency of the numerical network was established. Finally, the fine mesh was selected.
Table 2 shows the final concentration of vanadium in the last time step.

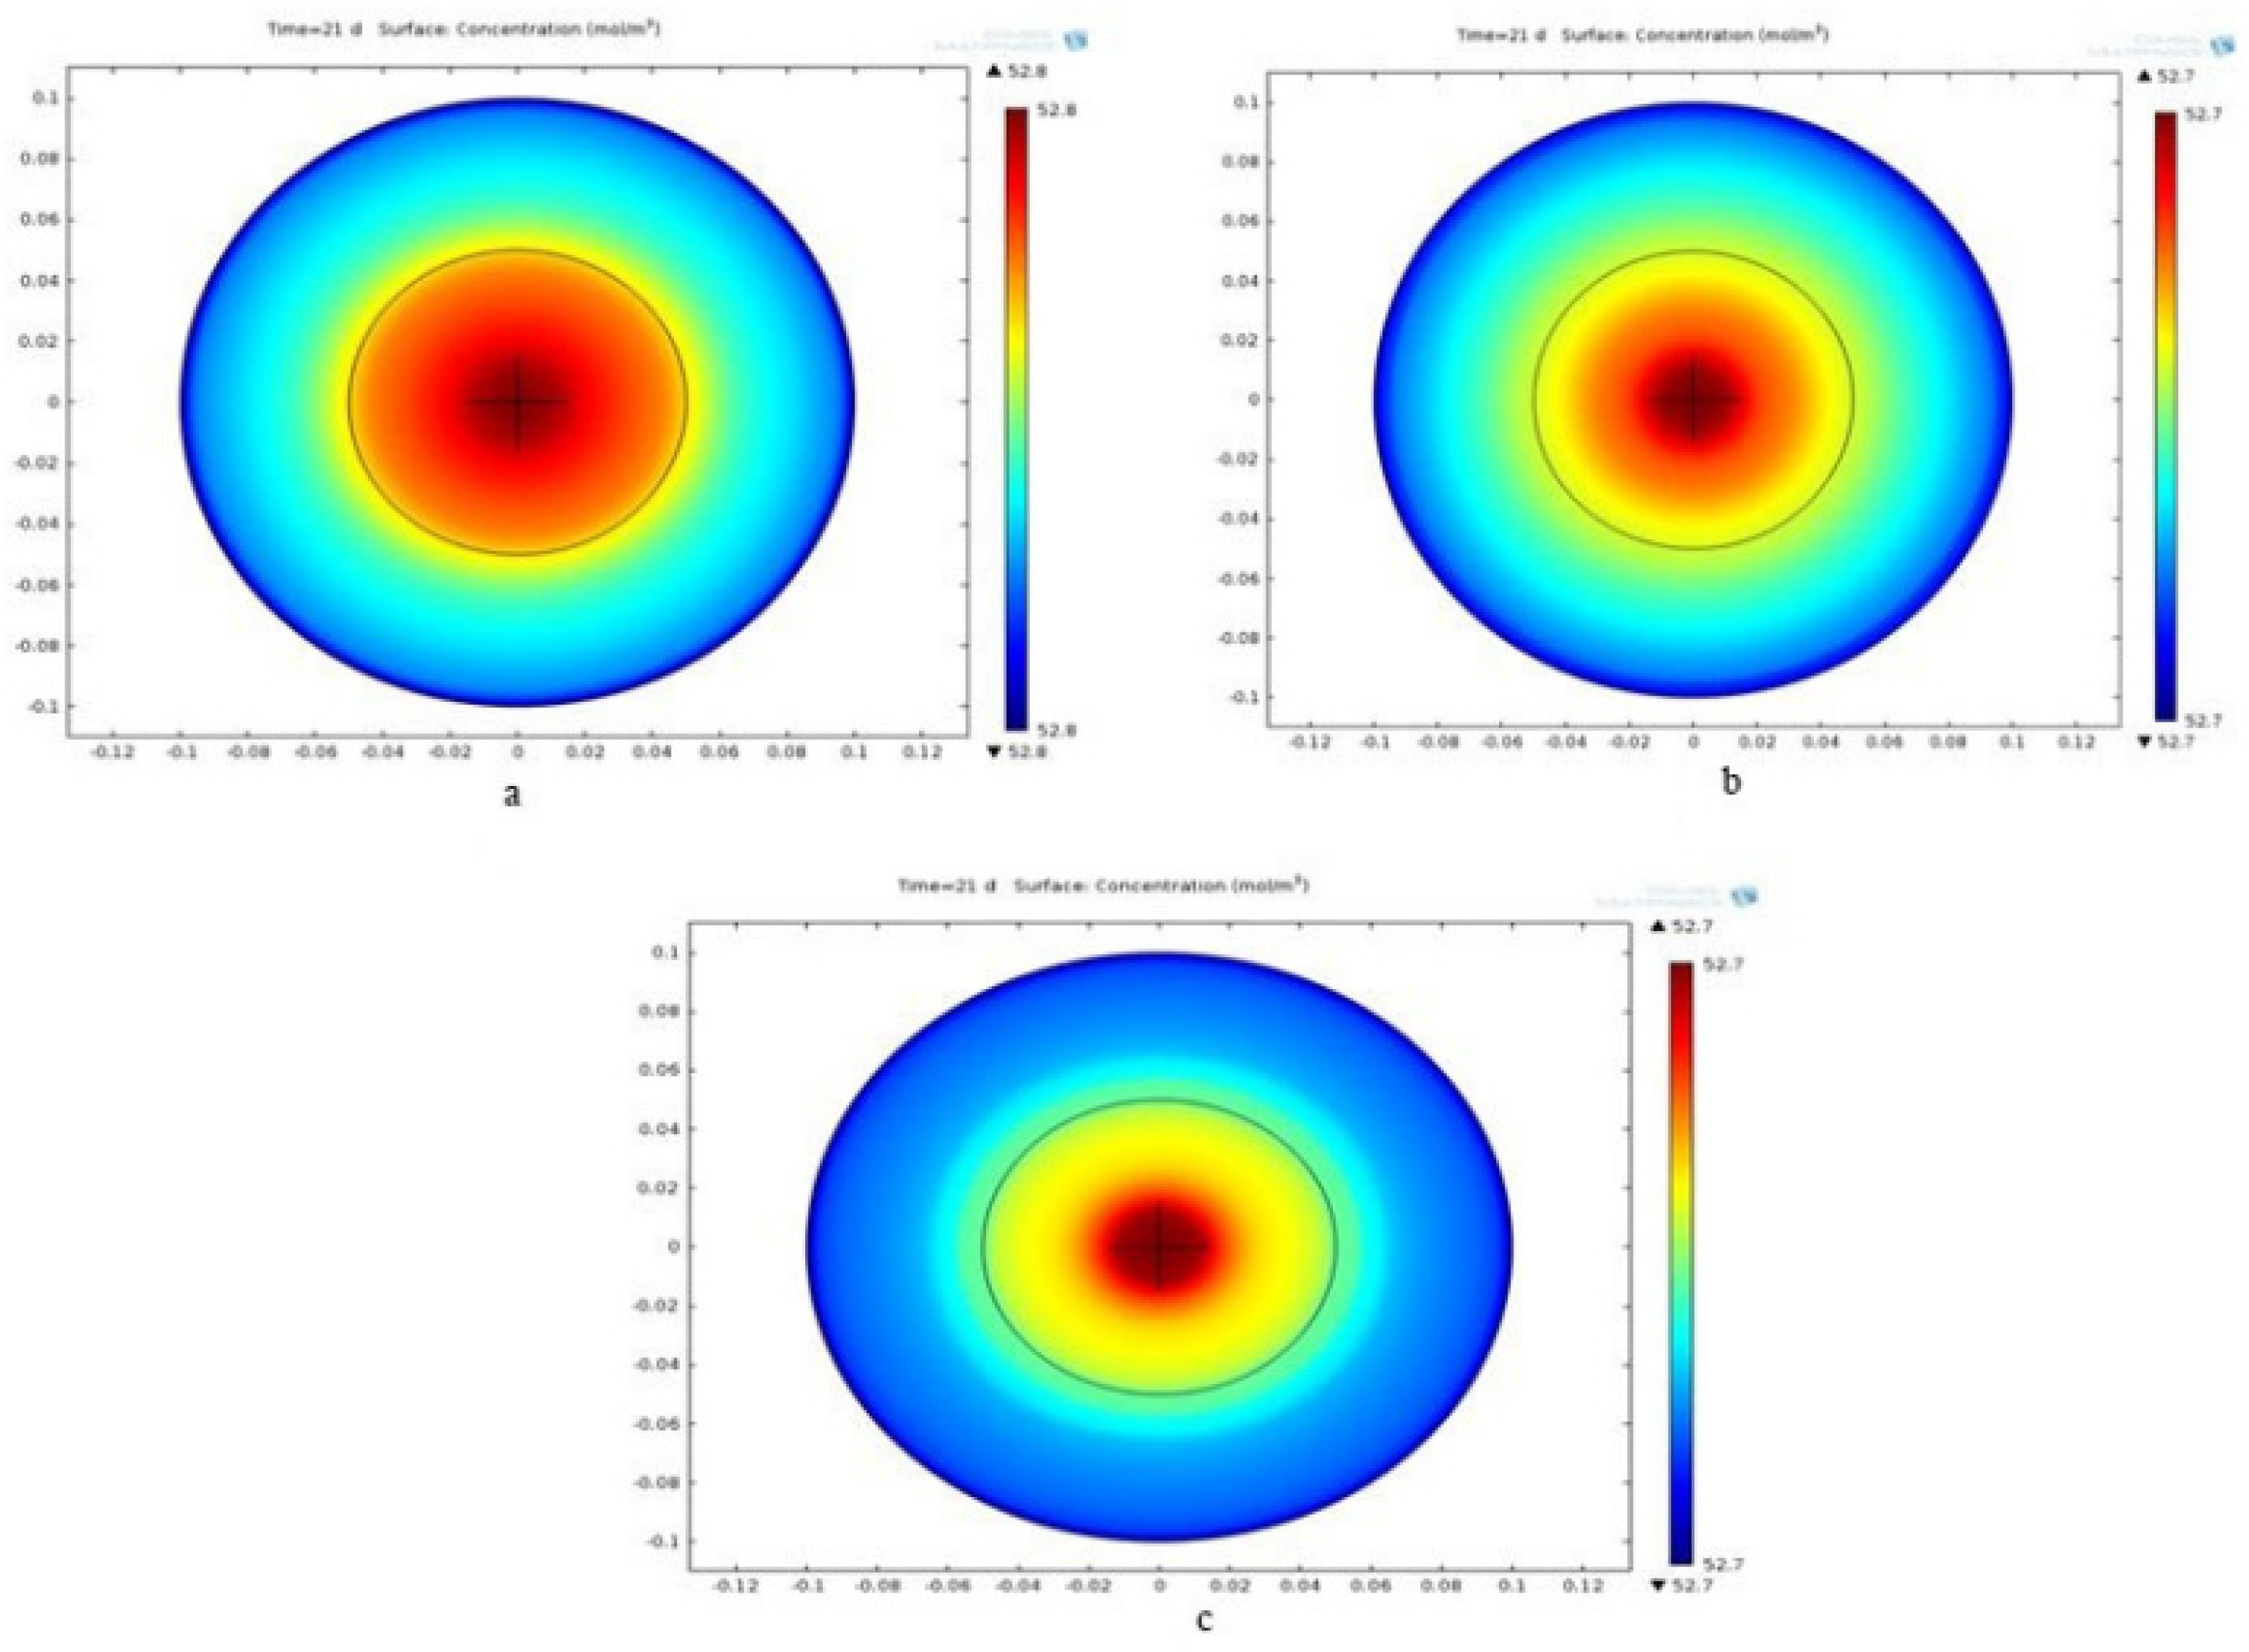
3.2. Results of the 2D Simulation

3.2.1. Concentration Contour

Vn is removed during the reaction of Va→W in the presence of Methylocystis hirsuta bacteria. To investigate the concentration of Vn, contours of Vn concentration were calculated. After simulation, concentration contour was defined in 21 days. Figure 2 shows the concentration contour of Vn at 120, 160, and 200 rpm.
As can be seen from Figure 2, the Vn concentration gradient is significant at the regions near the center of the bioreactor. From the center to the side, the concentration of Vn decreased. High mass transfer flux occurs in these regions so most elimination occurred near the wall. The more the velocity increased, the smaller the area was around the bioreactor center (which has the maximum concentration). Additionally, the best removal rate happens within a shorter distance from the center. This result means that an increment in velocity makes the final removal rate happen in a shorter space.

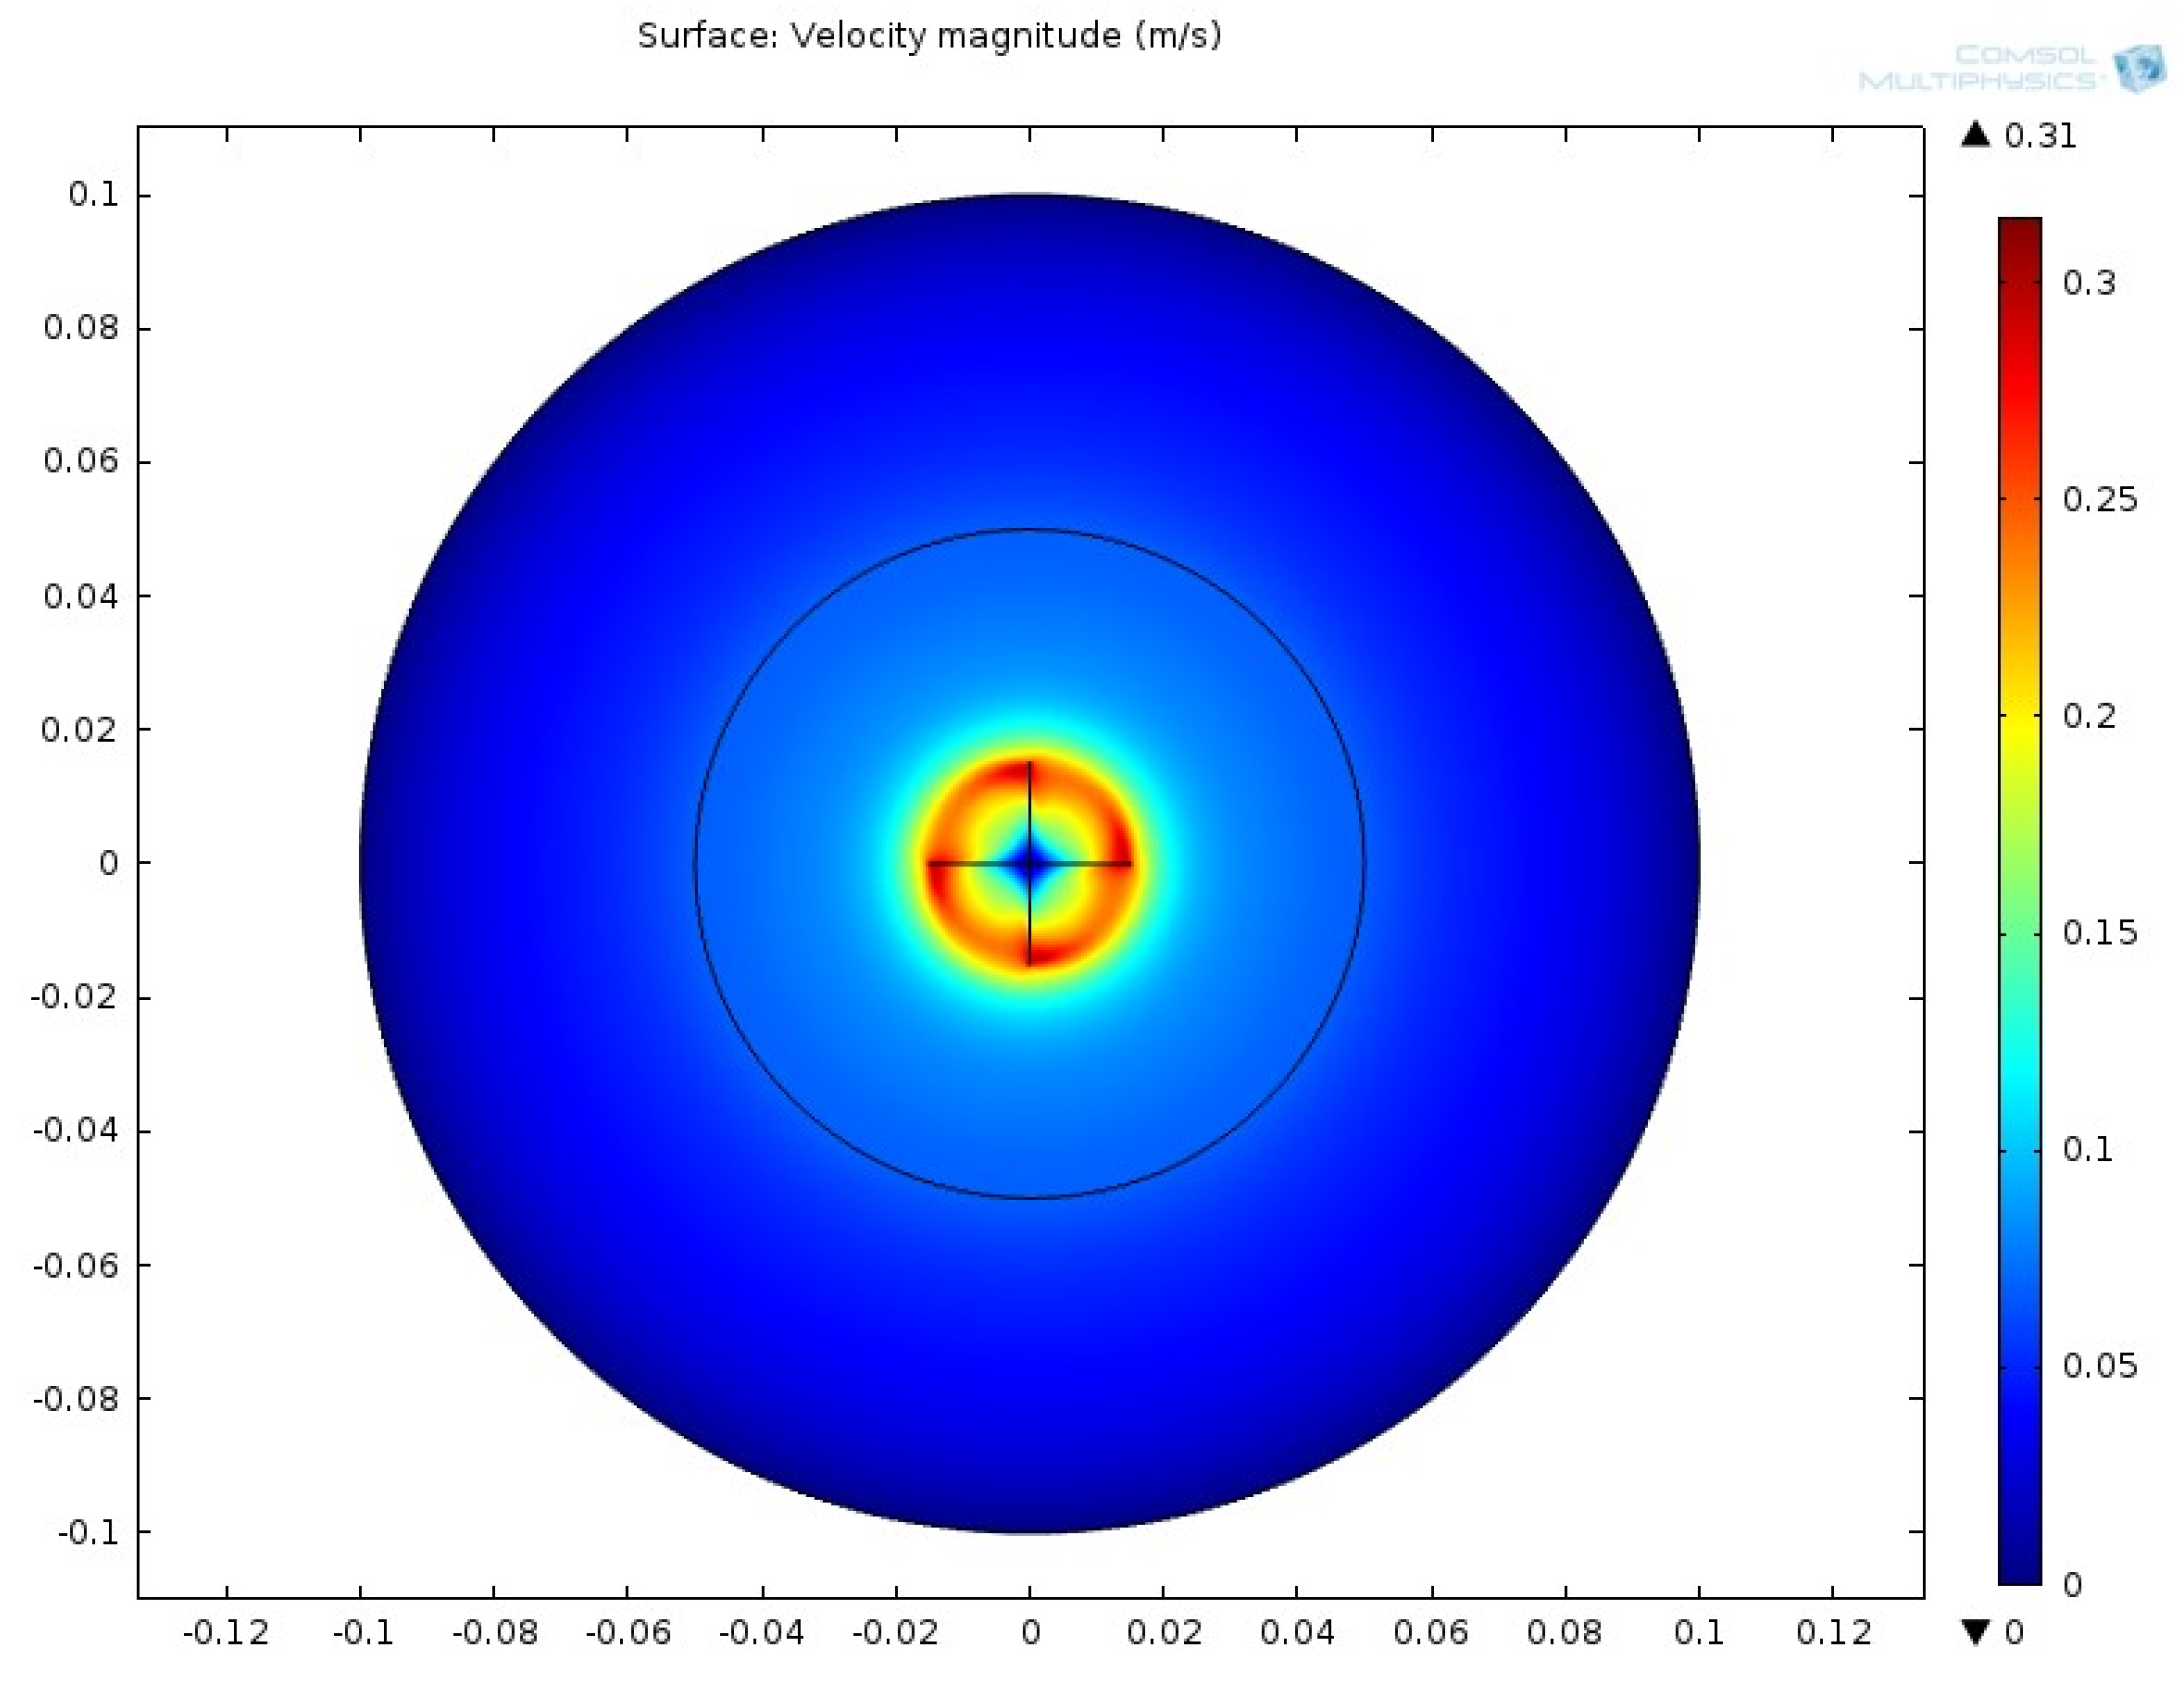
3.2.2. Velocity Contour

The velocity field in the bioreactor was simulated by solving the Navier–Stokes’s equations. Figure 3 shows the result of spatial velocity variation in the bioreactor. The right side of the figure shows the assigned speed for each color.

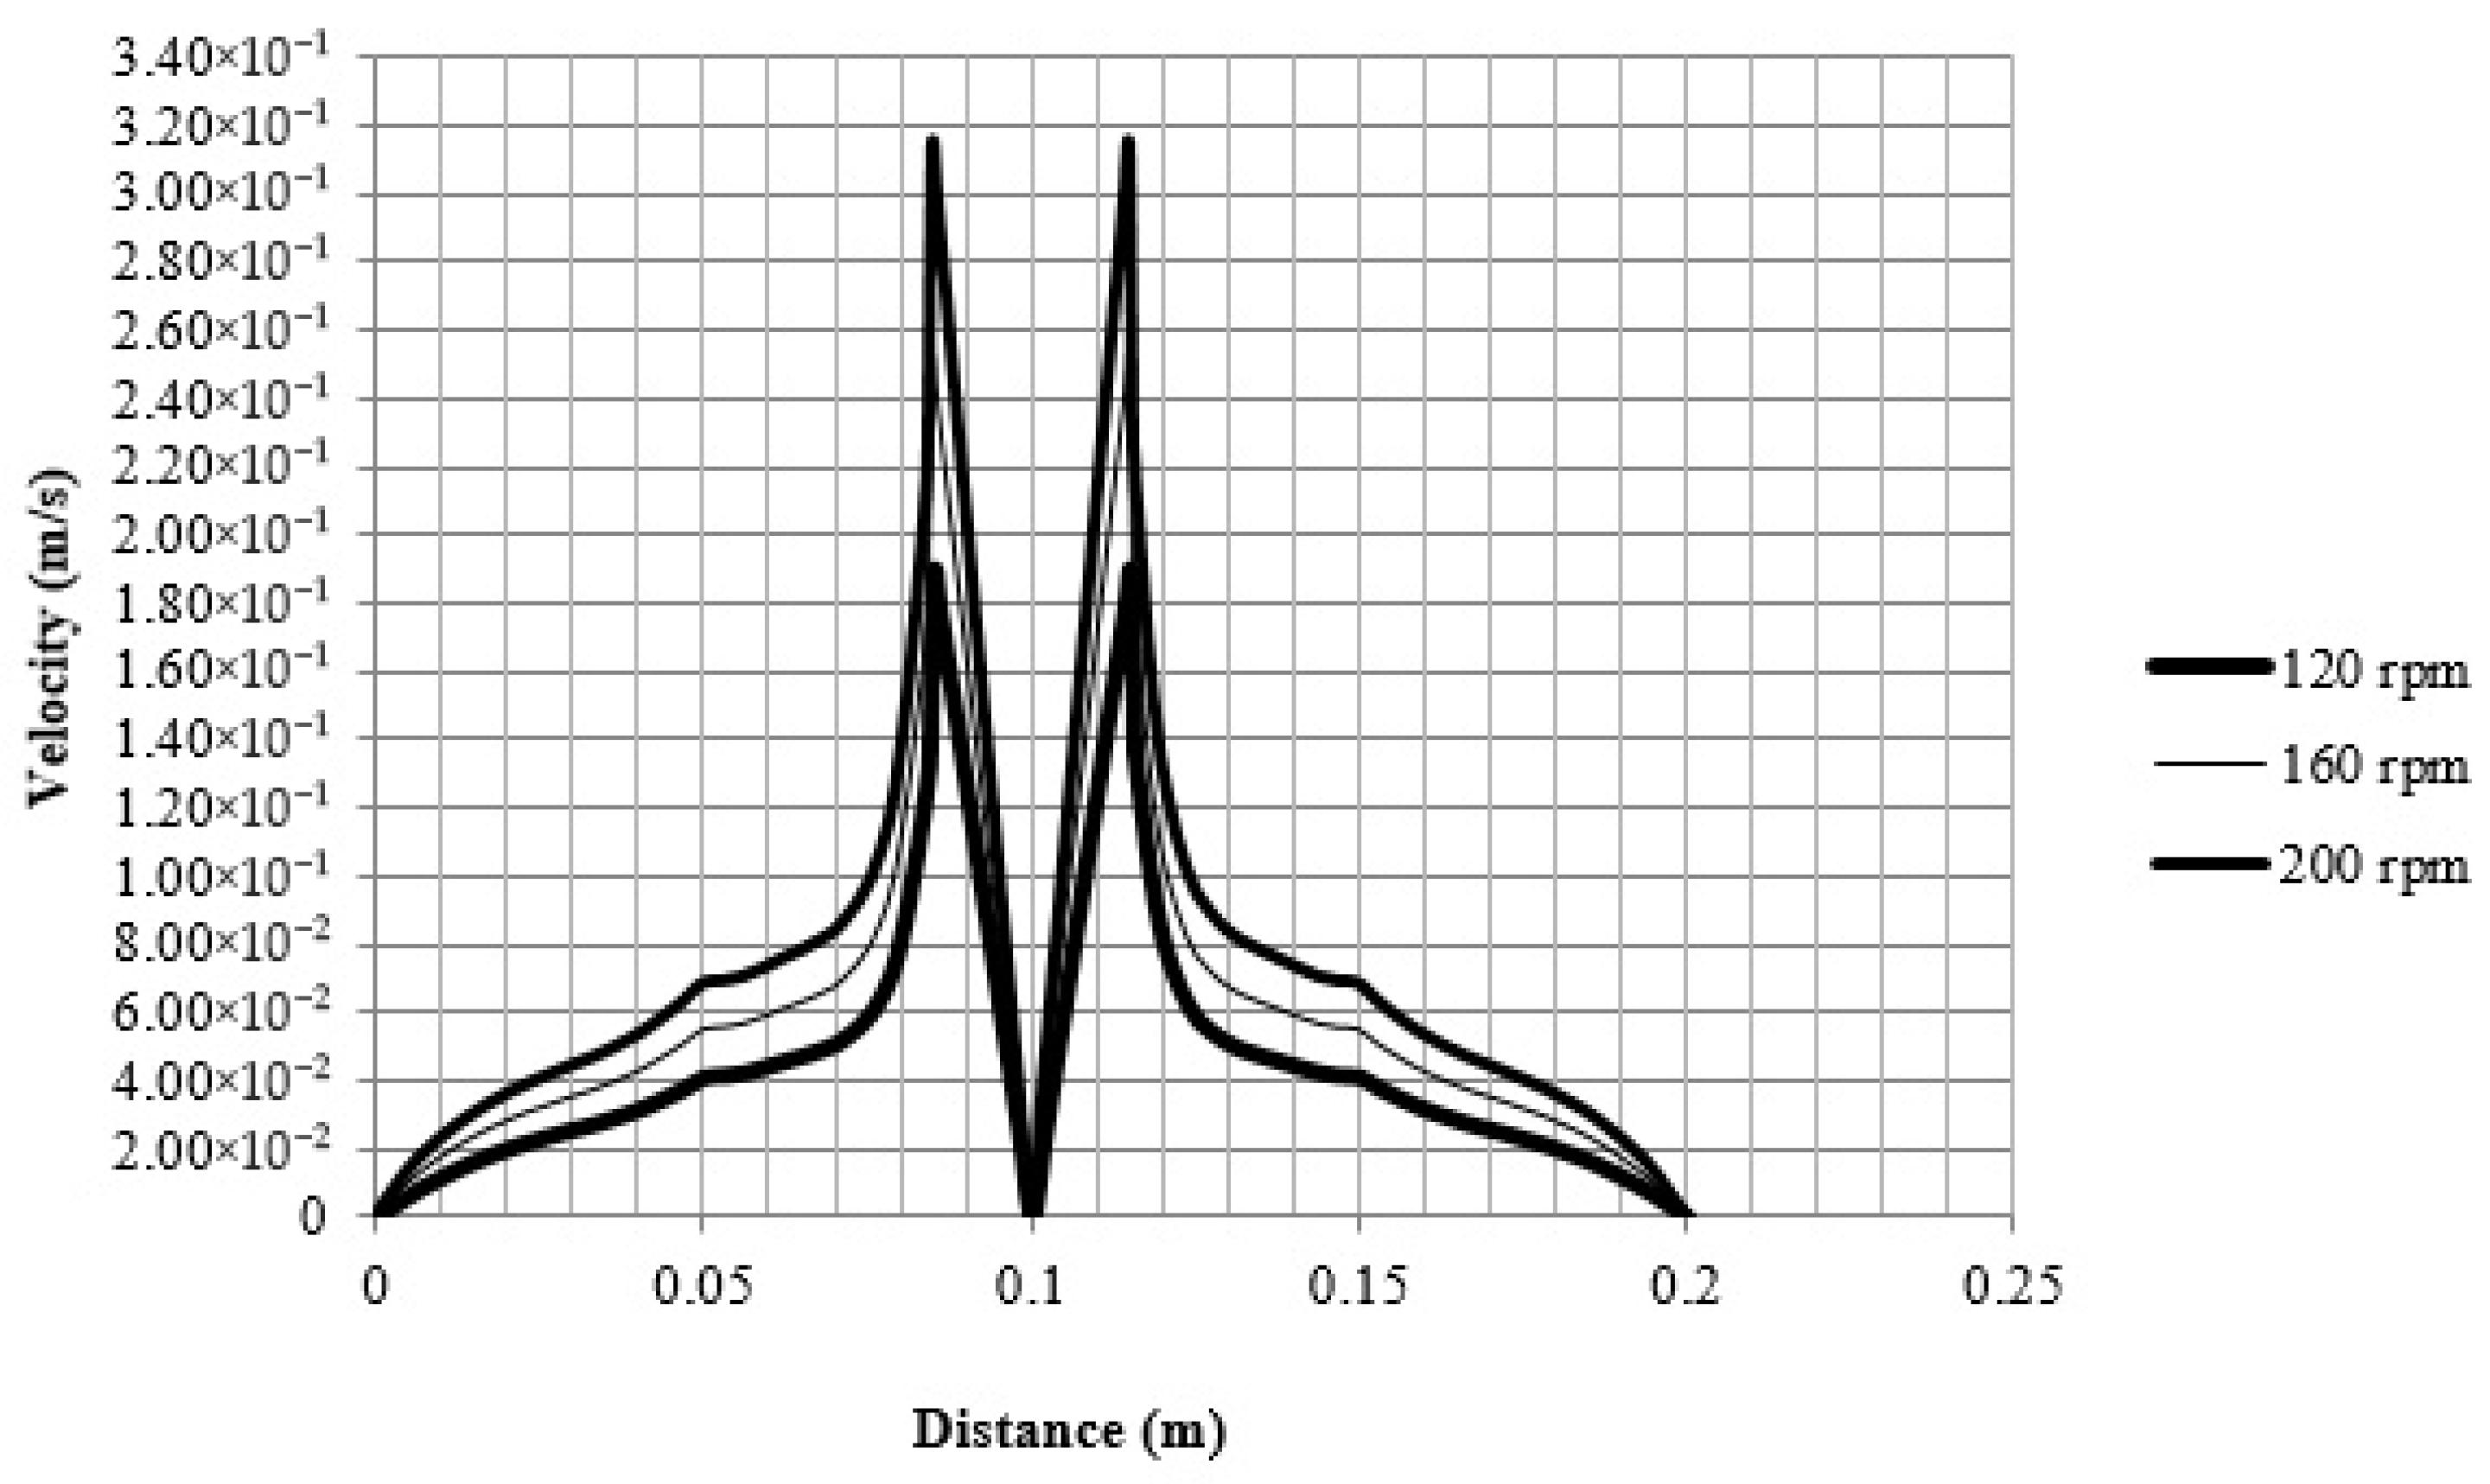
3.2.3. Velocity–Distance Chart

The model’s equations with the appropriate boundary conditions were solved numerically using COMSOL software. This software employs the finite element method (FEM) for numerical solutions of model equations [34].
Momentum simulation was performed at steady state; for this reason, the velocity–distance chart was examined (Figure 4).
As represented in Figure 4, the velocity of the center is zero. By gradually increasing the distance from the center, the velocity chart increased with increasing slope, and by the end of the impeller, it reached its maximum amount. The velocity then decreased until it reached zero on the side. The velocity profile is almost parabolic in the last region.

3.2.4. Vanadium Concentration vs. Time

The concentration–time changes in Vn were obtained. The results at three velocities (i.e., 120 rpm, 160 rpm, and 200 rpm) are illustrated. At the beginning of the reaction (at t = 0), the concentration of Vn is the highest and equals 0.98 mol/m3. At 21 days after the initial 2D simulation, this rate was decreased to 86% at 120 rpm and to 81% at 160 rpm and 200 rpm.

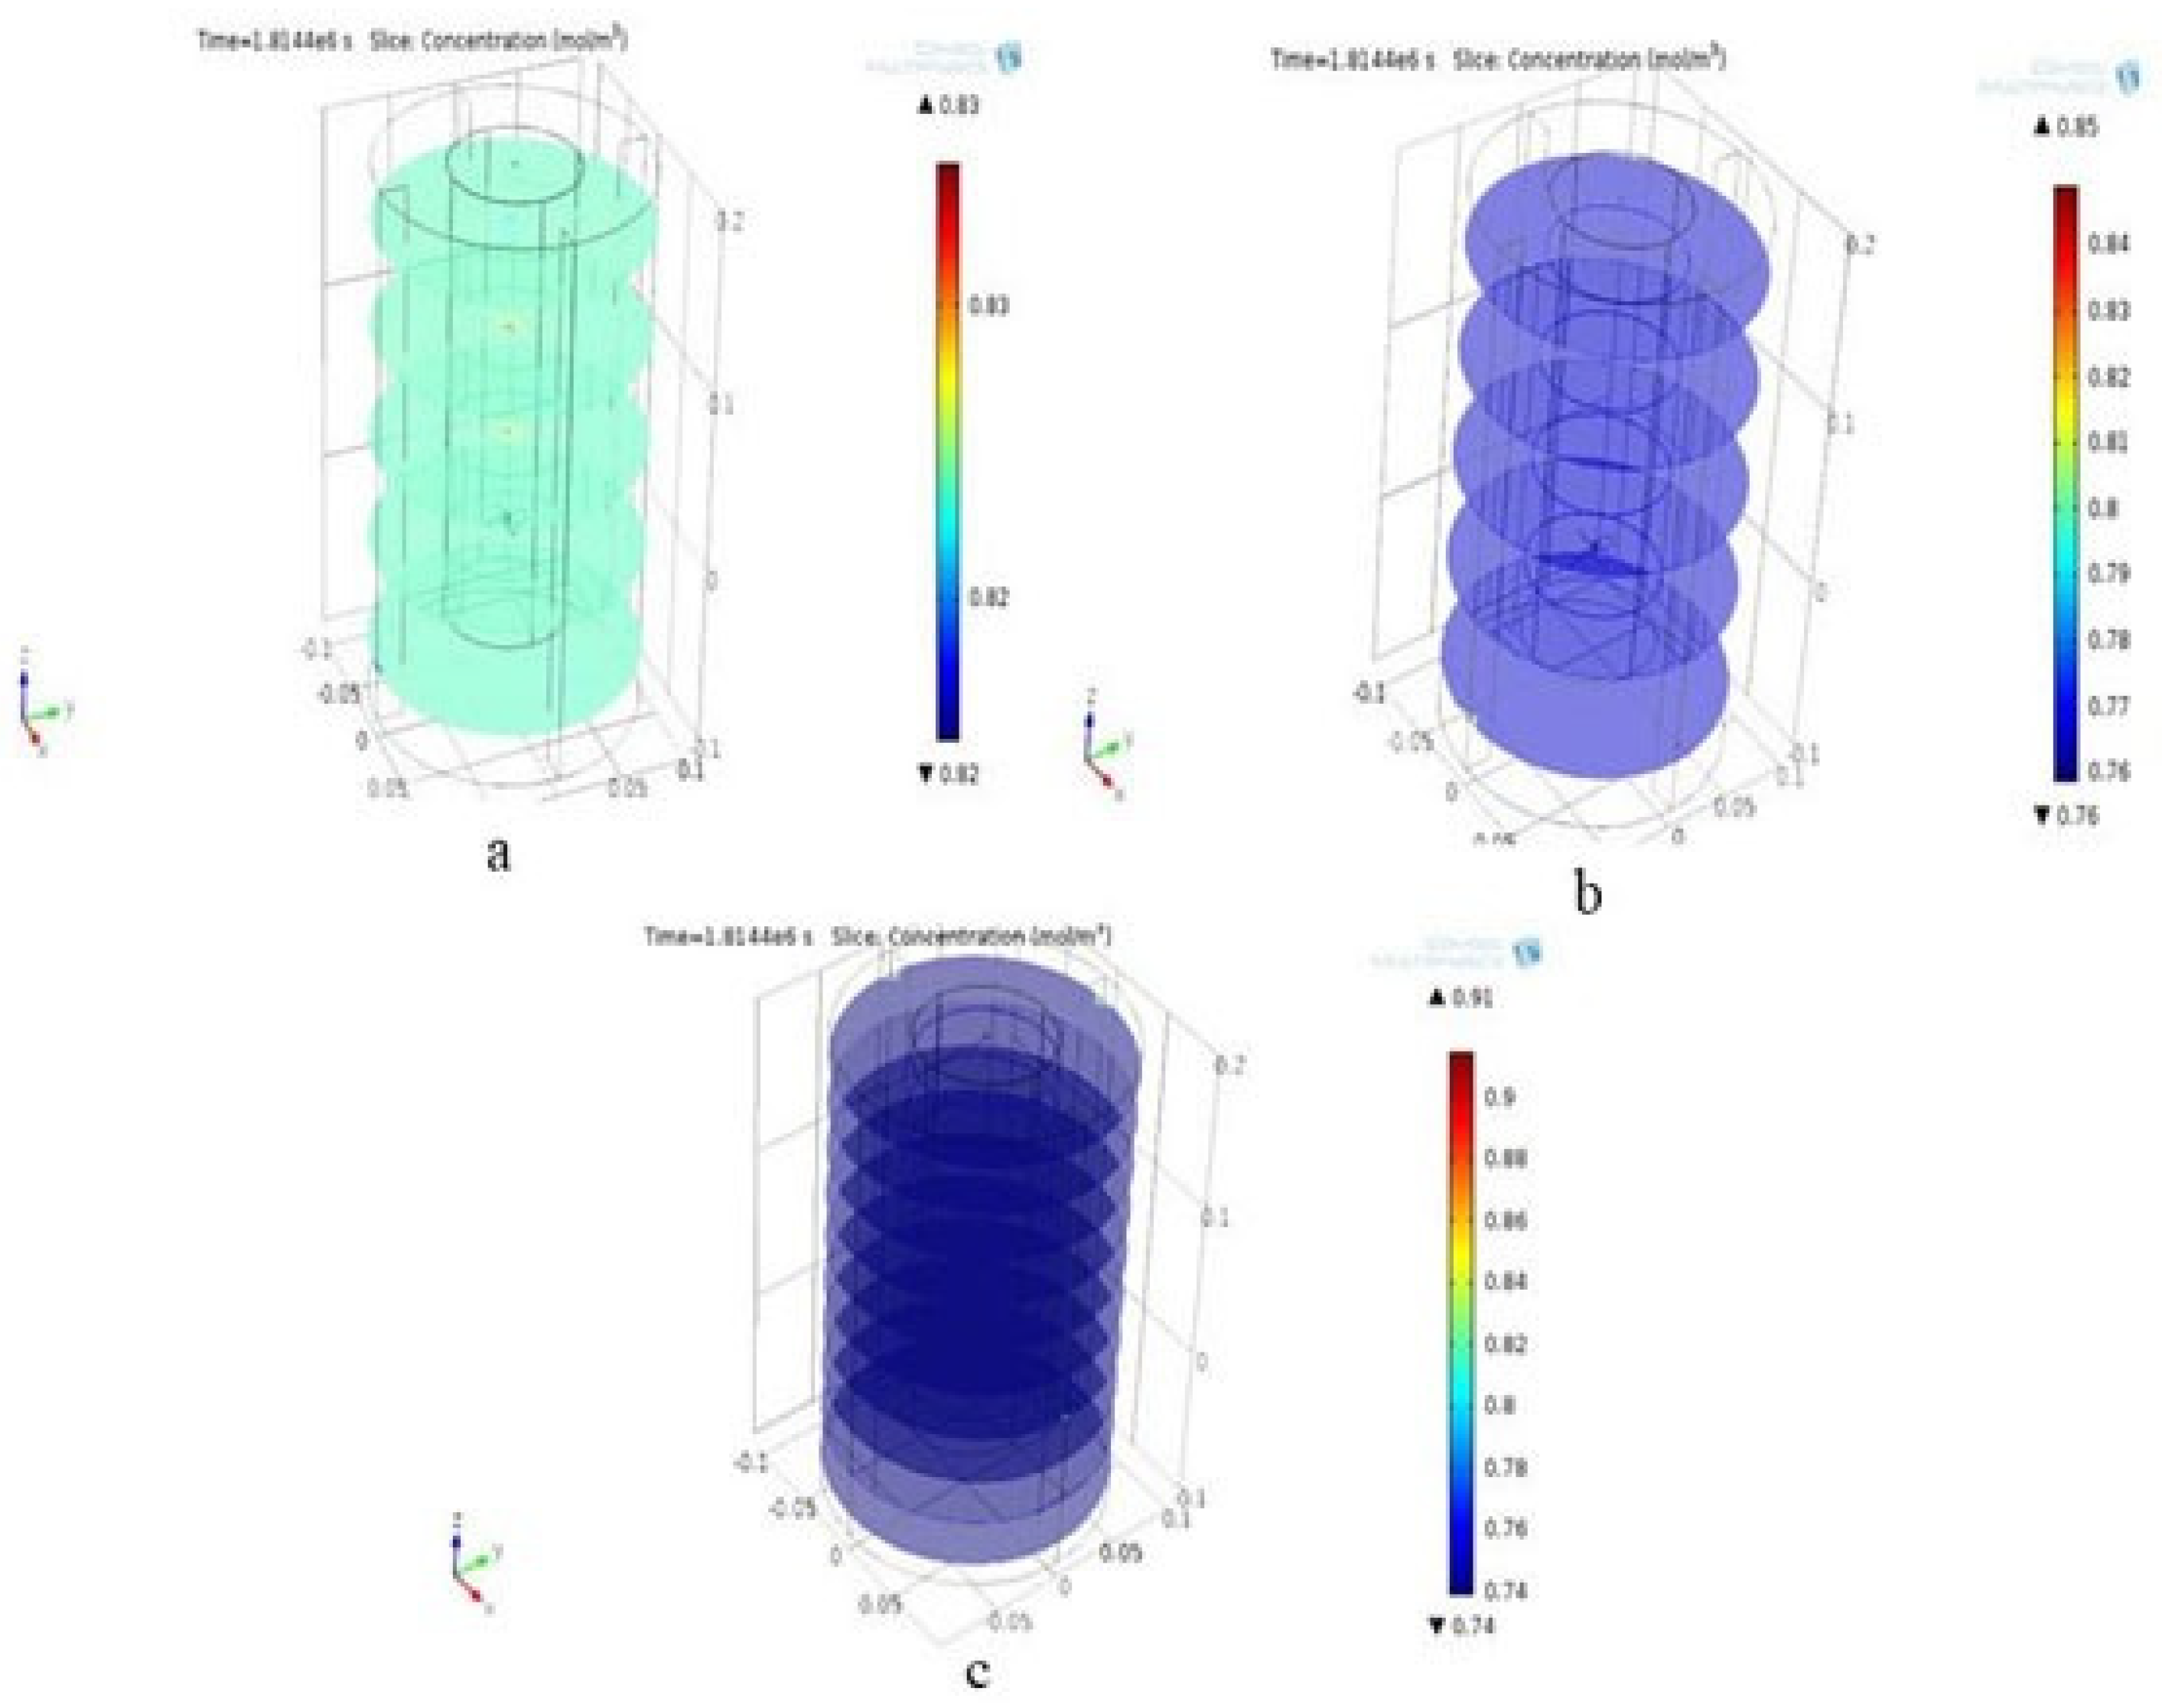
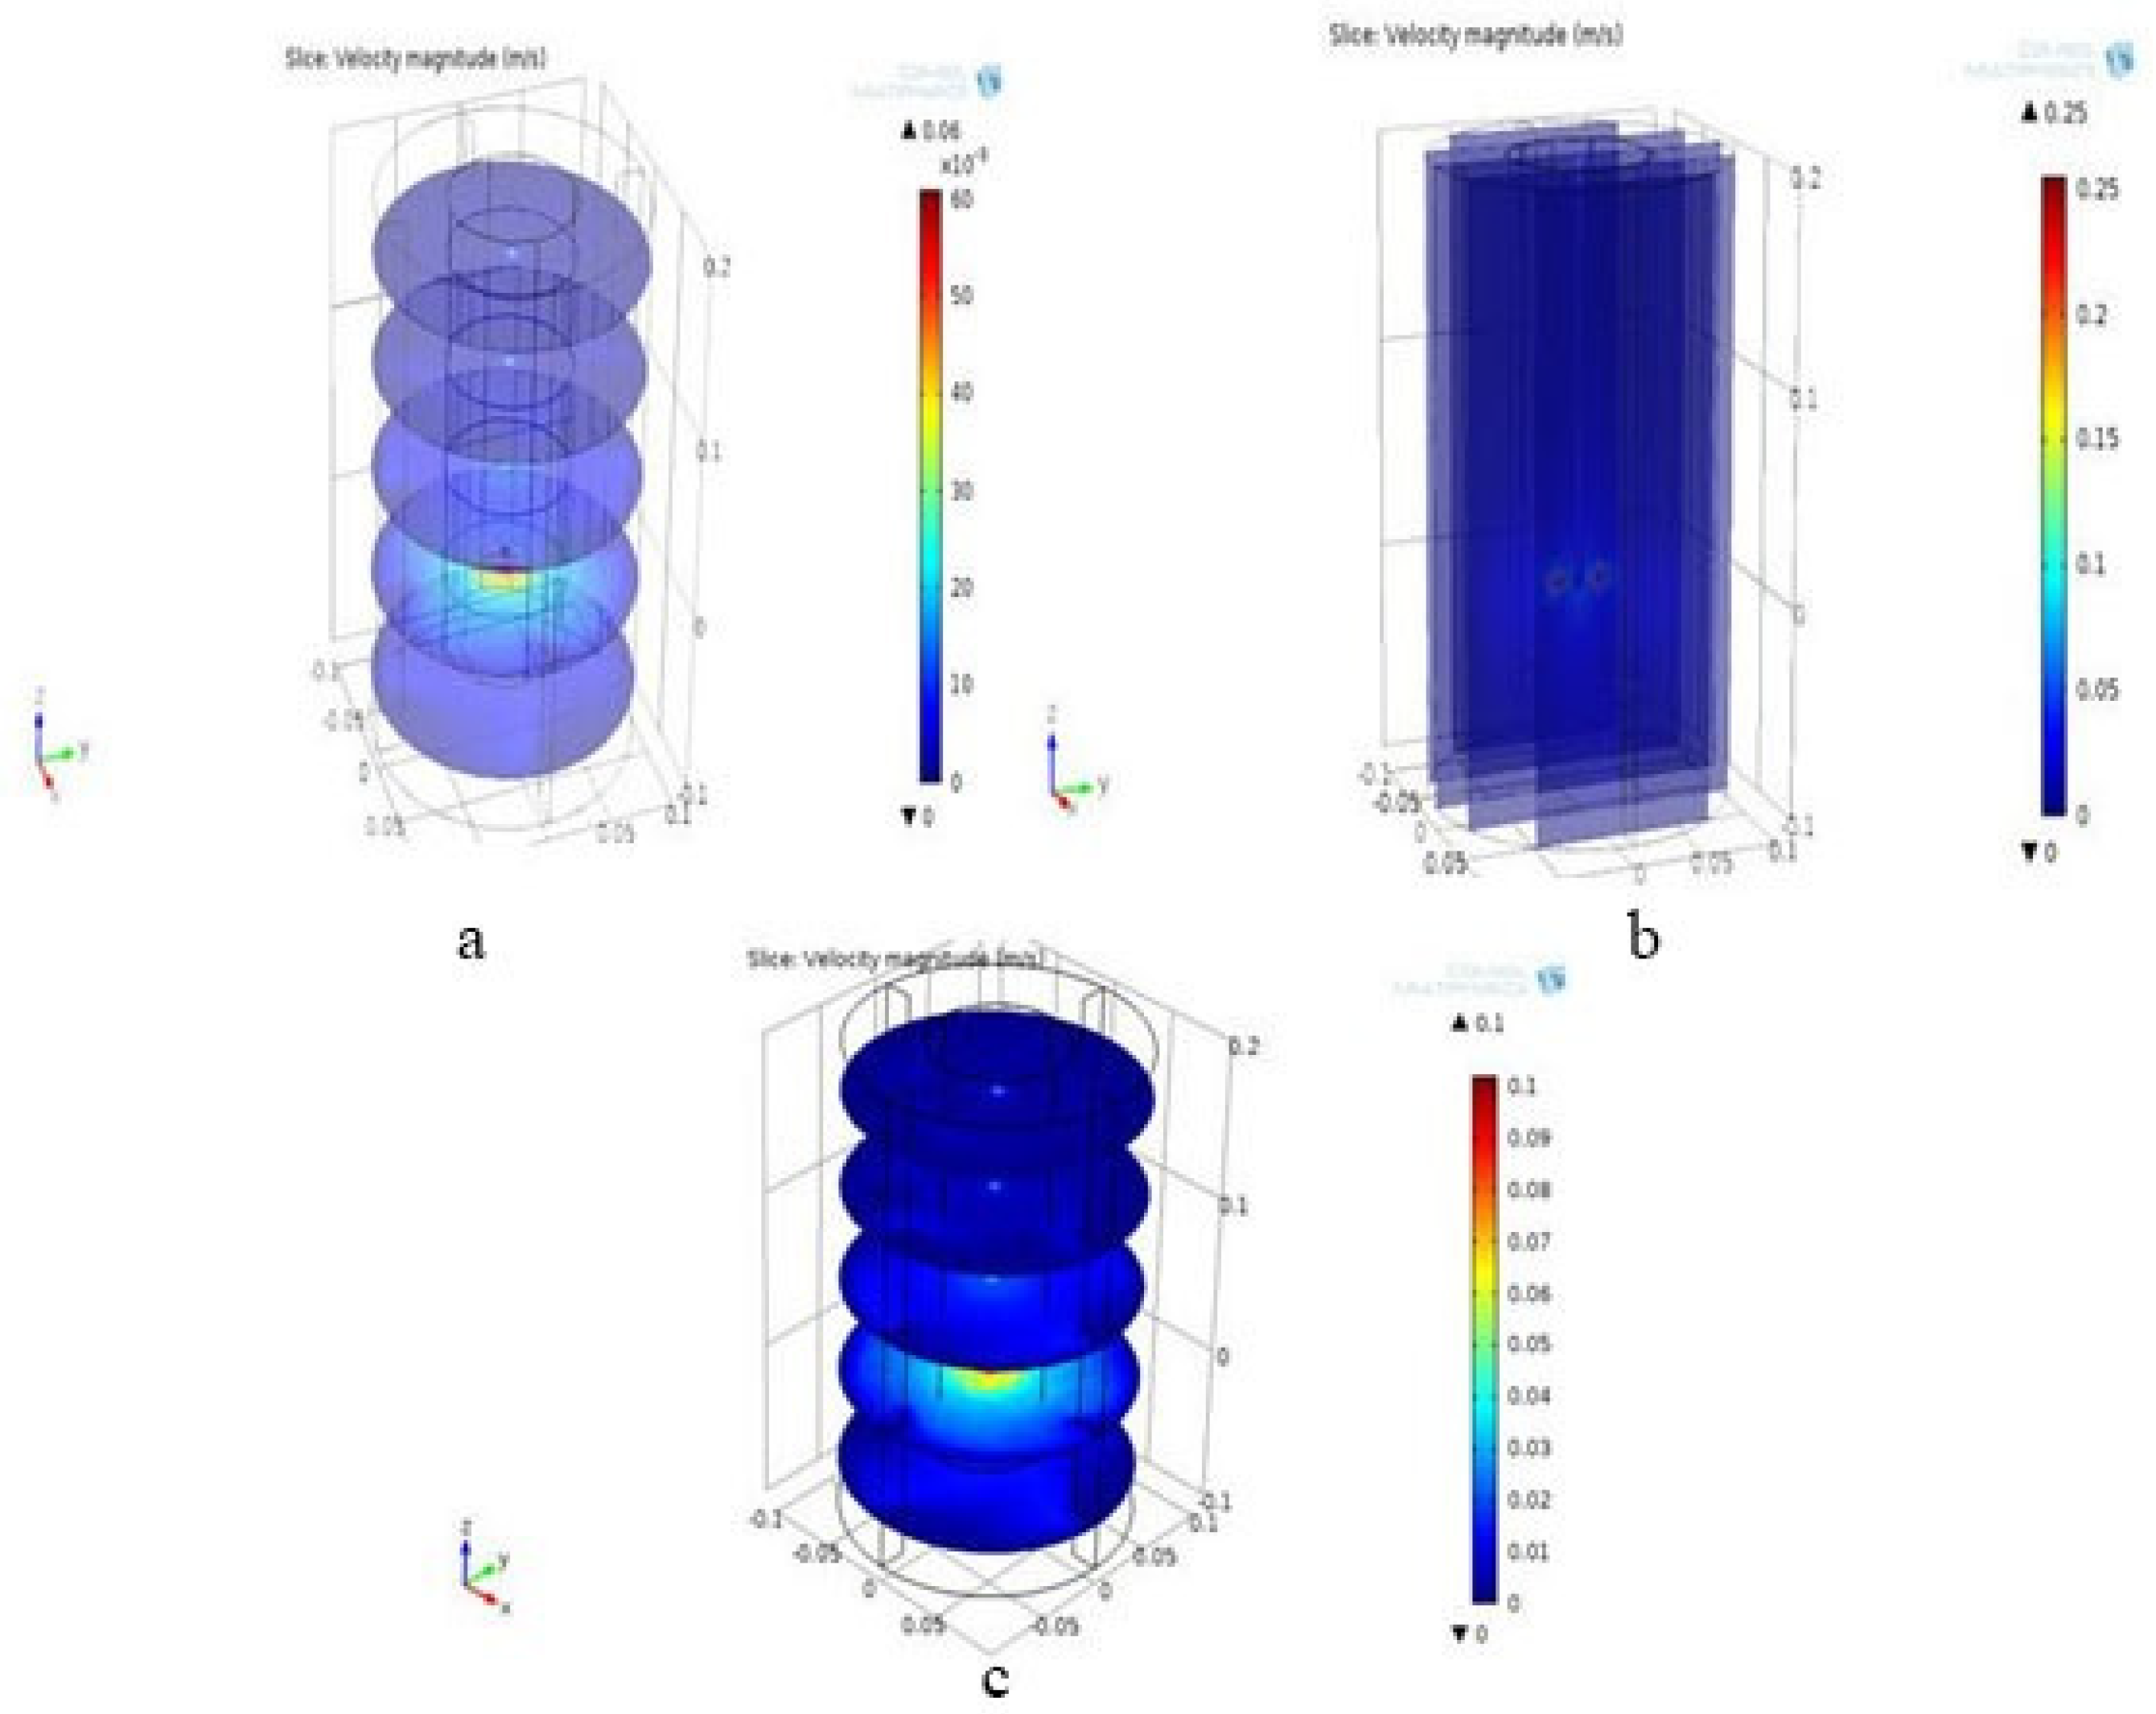
3.3. Results of 3D Simulation

3.3.1. Concentration Contour

The simulation in 3D was more precise than that in 2D. In comparison with the 2D simulation, the final removal rate was achieved at a shorter distance from the center, as represented in Figure 5.

3.3.2. Velocity Contour

The local variations in velocity resulting from the bioreactor at 120, 160, and 200 rpm are depicted in Figure 6.

3.3.3. Vanadium Concentration vs. Time

After the 21-day 3D simulation, the Vn concentration was reduced to 82% at 120 rpm, to 76% at 160 rpm, and to 74% at 200 rpm.
Table 3 shows the comparison of the elimination rates in the 2D and 3D simulation cases. According to the table, in the 2D simulation, the Vn removal amounts at 160 rpm and 200 rpm were the same but the amount was lower at 120 rpm. In comparison, 200 rpm was the best parameter for Vn removal throughout the 3D simulation.
In this study, COMSOL was used to simulate a 1D equilibrium transport lead–phenol binary system. The saturated sandy soil was considered as an aquifer and granular dead anaerobic sludge (GDAS) [37]. In order to describe absorption data in a binary system, three isothermal models were applied: the combined Langmuir–Freundlich model, the Extended Langmuir model, and the Extended Freundlich model [37]. We observed that the root mean squared error between the numerical and experimental results did not exceed 0.04, which is in line with previously published data [37]. In another study, three similar isothermal models were applied.
Taken together, the simulation data presented in this work compared with experimental data [38,39,40], including the experimental data on Vn previously reported by our team [40], show consistency in the application of our model for the bioremediation of deleterious heavy metals, such as Vn, found in contaminated water.

4. Conclusions

Bioremediation is a technology where biological organisms are used to remove or neutralize an environmental pollutant via a metabolic process. Herein, the COMSOL 2D and 3D simulations along with Fick’s law and Navier–Stokes equations were used, for the first time, to understand how the elimination process of Vn from contaminated water occurs in the presence of M. hirsuta. Concentration–time chart, velocity–distance chart, concentration contour, and velocity contour were investigated. At higher velocity and time increments, the connection time between the microorganism (M. hirsuta) and the metal (Vn) increased and led to an increase in bioremoval by the microorganism. The simulation data match quite well with previously reported experimental data. It confirms that the proposed model is reliable and accurate and can be applied as a sustainable bioremediation option for the removal of Vn pollutants and possibly others to be tested.

Author Contributions

Conceptualization, F.Y. and F.M.; Data curation, F.Y., F.M. and A.H.-Z.; Formal analysis, F.S., F.Y., F.M. and A.H.-Z.; Funding acquisition, F.Y.; Investigation, F.S., F.Y. and F.M.; Methodology, F.S., F.Y. and F.M.; Project administration, F.Y.; Resources, F.Y.; Software, F.S., F.Y. and F.M.; Supervision, F.Y. and F.M.; Validation, F.S., F.Y. and F.M.; Visualization, F.Y. and F.M.; Writing—original draft, F.S. and F.Y.; Writing—review & editing, F.M. All of the authors have substantially and equally contributed to this work. All authors have read and agreed to the published version of the manuscript.

Funding

This research is supported by the Iran National Science Foundation (INSF; Project # 90008230).

Institutional Review Board Statement

Not applicable.

Informed Consent Statement

Not applicable.

Data Availability Statement

Data are available upon request to the corresponding author.

Acknowledgments

The authors thank INSF for funding this project.

Conflicts of Interest

The authors declare no conflict of interest. All of the authors have read and accepted the submission of this article. All of the authors declare that this manuscript has not been published or is under consideration elsewhere.

References

  1. Barakat, M.A. New Trends in Removing Heavy Metals from Industrial Wastewater. Arab. J. Chem. 2011, 4, 361–377. [Google Scholar] [CrossRef] [Green Version]
  2. Sabonian, M.; Mahanpoor, K. Optimization of Photocatalytic Reduction of Cr(Vi) in Water with Nano Zno/Todorokite as a Catalyst: Using Taguchi Experimental Design. Iran. J. Chem. Chem. Eng. 2019, 38, 105–113. [Google Scholar]
  3. Iqbal, M.; Ahmed, S.; Rehman, W.; Menaa, F.; Ullah, A. Heavy Metal Levels in Vegetables Cultivated in Pakistan Soil Irrigated with Untreated Wastewater: Preliminary Results. Sustainability 2020, 12, 8891. [Google Scholar] [CrossRef]
  4. Farrokhnia, A.; Abdolahpour, S.; Abbasi, Z. Removal of Pb (II) Ion and Safranin Dye from Aqueous Solution by Sheep Wool. Iran. J. Chem. Chem. Eng. 2019, 38, 155–163. [Google Scholar]
  5. He, J.; Chen, J.P. A Comprehensive Review on Biosorption of Heavy Metals by Algal Biomass: Materials, Performances, Chemistry, and Modeling Simulation Tools. Bioresour. Technol. 2014, 160, 67–78. [Google Scholar] [CrossRef]
  6. Al-Suhaibani, N.; Seleiman, M.F.; El-Hendawy, S.; Abdella, K.; Alotaibi, M.; Alderfasi, A. Integrative Effects of Treated Wastewater and Synthetic Fertilizers on Productivity, Energy Characteristics, and Elements Uptake of Potential Energy Crops in an Arid Agro-Ecosystem. Agronomy 2021, 11, 2250. [Google Scholar] [CrossRef]
  7. Fu, F.; Wang, Q. Removal of Heavy Metal Ions from Wastewaters: A Review. J. Environ. Manag. 2011, 92, 407–418. [Google Scholar] [CrossRef]
  8. Davarnejad, R.; Karimi Dastnayi, Z. Cd (II) Removal from Aqueous Solutions by Adsorption on Henna and Henna with Chitosan Microparticles Using Response Surface Methodology. Iran. J. Chem. Chem. Eng. 2019, 38, 267–281. [Google Scholar]
  9. Kapoor, A.; Viraraghavan, T. Fungal Biosorption—An Alternative Treatment Option for Heavy Metal Bearing Wastewaters: A Review. Bioresour. Technol. 1995, 53, 195–206. [Google Scholar] [CrossRef]
  10. Jansen, E.; Michels, M.; van Til, M.; Doelman, P. Effects of Heavy Metals in Soil on Microbial Diversity and Activity as Shown by the Sensitivity-Resistance Index, an Ecologically Relevant Parameter. Biol. Fertil. Soils 1994, 17, 177–184. [Google Scholar] [CrossRef]
  11. Diaconu, M.; Pavel, L.V.; Hlihor, R.M.; Rosca, M.; Fertu, D.I.; Lenz, M.; Corvini, P.X.; Gavrilescu, M. Characterization of Heavy Metal Toxicity in Some Plants and Microorganisms—A Preliminary Approach for Environmental Bioremediation. N. Biotechnol. 2020, 56, 130–139. [Google Scholar] [CrossRef] [PubMed]
  12. Salem, H.M.; Abdel-Salam, A.; Abdel-Salam, M.A.; Seleiman, M.F. Phytoremediation of metal and metalloids from contaminated soil. In Plants Under Metal and Metalloid Stress: Responses, Tolerance and Remediation; Hasanuzzaman, M., Nahar, K., Fujita, M., Eds.; Springer: Singapore, 2018; pp. 249–262. ISBN 978-981-13-2242-6. [Google Scholar]
  13. Adeniji, A. Bioremediation of Arsenic, Chromium, Lead, and Mercury; National Network of Enviromental Management Studies Fellow; US Enviromental Protection Agency Office of Solid Waste and Emergency Response Technology Innovation Office: Washington, DC, USA, 2004.
  14. Perelo, L.W. Review: In Situ and Bioremediation of Organic Pollutants in Aquatic Sediments. J. Hazard. Mater. 2010, 177, 81–89. [Google Scholar] [CrossRef] [PubMed] [Green Version]
  15. Lal, B.; Khanna, S. Degradation of Crude Oil by Acinetobacter Calcoaceticus and Alcaligenes Odorans. J. Appl. Bacteriol. 1996, 81, 355–362. [Google Scholar] [CrossRef] [PubMed]
  16. Helmy, Q.; Laksmono, R.; Kardena, E. Bioremediation of Aged Petroleum Oil Contaminated Soil: From Laboratory Scale to Full Scale Application. Procedia Chem. 2015, 14, 326–333. [Google Scholar] [CrossRef] [Green Version]
  17. Rajhans, G.; Sen, S.K.; Barik, A.; Raut, S. Ligninolytic enzyme system of white-rot fungi: A natural approach to bioremediation and detoxification of azo dyes in textile wastewater. Environ. Eng. Manag. J. 2020, 19, 1983–2002. [Google Scholar]
  18. Chatterjee, S.; Kumari, S.; Rath, S.; Das, S. Prospects and scope of microbial bioremediation for the restoration of the contaminated sites. In Microbial Biodegradation and Bioremediation; Elsevier: Amsterdam, The Netherlands, 2022; pp. 3–31. [Google Scholar]
  19. Khan, S.; Aijun, L.; Zhang, S.; Hu, Q.; Zhu, Y.G. Accumulation of Polycyclic Aromatic Hydrocarbons and Heavy Metals in Lettuce Grown in the Soils Contaminated with Long-Term Wastewater Irrigation. J. Hazard. Mater. 2008, 152, 506–515. [Google Scholar] [CrossRef] [PubMed]
  20. Patel, A.K.; Singhania, R.R.; Albarico, F.P.J.B.; Pandey, A.; Chen, C.-W.; Dong, C.-D. Organic Wastes Bioremediation and Its Changing Prospects. Sci. Total Environ. 2022, 824, 153889. [Google Scholar] [CrossRef] [PubMed]
  21. Padhan, D.; Rout, P.P.; Kundu, R.; Adhikary, S.; Padhi, P.P. Bioremediation of Heavy Metals and Other Toxic Substances by Microorganisms. Soil Bioremediation an Approach Towar. Sustain. Technol. 2021, 2021, 285–329. [Google Scholar]
  22. Ke, C.-Y.; Qin, F.-L.; Yang, Z.-G.; Sha, J.; Sun, W.-J.; Hui, J.-F.; Zhang, Q.-Z.; Zhang, X.-L. Bioremediation of Oily Sludge by Solid Complex Bacterial Agent with a Combined Two-Step Process. Ecotoxicol. Environ. Saf. 2021, 208, 111673. [Google Scholar] [CrossRef]
  23. Salanitro, J.P.; Dorn, P.B.; Huesemann, M.H.; Moore, K.O.; Rhodes, I.A.; Rice Jackson, L.M.; Vipond, T.E.; Western, M.M.; Wisniewski, H.L. Crude Oil Hydrocarbon Bioromediation and Soil Ecotoxicity Assessment. Environ. Sci. Technol. 1997, 31, 1769–1776. [Google Scholar] [CrossRef]
  24. Brandl, H. Metal-Microbe-Interactions and Thier Biotechnological Applications for Mineral Waste Treatment. Recent Res. Dev. Mircobiol. 2002, 6, 571–584. [Google Scholar]
  25. Urionabarrenetxea, E.; Garcia-Velasco, N.; Anza, M.; Artetxe, U.; Lacalle, R.; Garbisu, C.; Becerril, T.; Soto, M. Application of in Situ Bioremediation Strategies in Soils Amended with Sewage Sludges. Sci. Total Environ. 2021, 766, 144099. [Google Scholar] [CrossRef]
  26. Kensa, V.M. Bioremediation-an Overview. I Control Pollut. 2011, 27, 161–168. [Google Scholar]
  27. Kumar, A.; Mallick, S.P.; Singh, D.; Gupta, N. Advances in bioremediation: Introduction, applications, and limitations. In Biological Approaches to Controlling Pollutants; Elsevier: Amsterdam, The Netherlands, 2022; pp. 1–14. [Google Scholar]
  28. Johncy-Rani, M.; Hemambika, B.; Hemapriya, J.; Rajeshkannan, V. Comparative Assessment of Heavy Metal Removal by Immobilized and Dead Bacterial Cells: A Biosorption Approach. Glob. J. Environ. Res. 2010, 4, 23–30. [Google Scholar]
  29. Samarth, D.P.; Chandekar, C.J.; Bhadekar, R.K. Biosorption of Heavy Metals from Aqueous Solution Using Bacillus Licheniformis. Int. J. Pure Appl. Sci. Technol. 2012, 10, 12. [Google Scholar]
  30. He, W.y.; Liao, W.; Yang, J.y.; Jeyakumar, P.; Anderson, C. Removal of Vanadium from Aquatic Environment Using Phosphoric Acid Modified Rice Straw. Bioremediat. J. 2020, 24, 80–89. [Google Scholar] [CrossRef]
  31. Peighami, R.; Rasekh, B.; Motamedian, E.; Yazdian, F.; Khodaverdi, H. Investigating the Ability of Sulfur Oxidizing Strains in Biodesulfurisation of Sulfide-Containing Streams, Screening the Most Capable Strain and Determining the Optimum Condition for Elemental Sulfur Recovery from Sulfide Using Response Surface Method. Fuel 2022, 309, 121985. [Google Scholar] [CrossRef]
  32. Wang, S.; Jaffé, P.R.; Li, G.; Wang, S.W.; Rabitz, H.A. Simulating Bioremediation of Uranium-Contaminated Aquifers; Uncertainty Assessment of Model Parameters. J. Contam. Hydrol. 2003, 64, 283–307. [Google Scholar] [CrossRef]
  33. Ghadiri, M.; Shirazian, S. Computational Simulation of Mass Transfer in Extraction of Alkali Metals by Means of Nanoporous Membrane Extractors. Chem. Eng. Process. Process Intensif. 2013, 69, 57–62. [Google Scholar] [CrossRef]
  34. Marjani, A.; Shirazian, S. Simulation of Heavy Metal Extraction in Membrane Contactors Using Computational Fluid Dynamics. Desalination 2011, 281, 422–428. [Google Scholar] [CrossRef]
  35. Multiphysics, C. Comsol Multiphysics User Guide; Version 4.3 A; COMSOL: Stockholm, Sweden, 2012; p. 39. [Google Scholar]
  36. Nanda, S. Reactors and Fundamentals of Reactors Design for Chemical Reaction. Ph.D. Thesis, Maharshi Dayanand University, Haryana, India, 2008. [Google Scholar]
  37. Faisal, A.A.H.; Abd Ali, Z.T. Remediation of Groundwater Contaminated with the Lead–Phenol Binary System by Granular Dead Anaerobic Sludge-Permeable Reactive Barrier. Environ. Technol. 2017, 38, 2534–2542. [Google Scholar] [CrossRef] [PubMed]
  38. Faisal, A.A.H.; Abd Ali, Z.T. Using Sewage Sludge as a Permeable Reactive Barrier for Remediation of Groundwater Contaminated with Lead and Phenol. Sep. Sci. Technol. 2017, 52, 732–742. [Google Scholar] [CrossRef]
  39. Mofradnia, S.R.; Abbassi, M.; Yazdian, F.; Rashedi, H.; Khosravi-Darani, K. Simulation of poly (Hydroaxybutyrate) from methane in vertical loop bioreactor. Carpathian J. Food Sci. Technol. 2021, 14, 28–41. [Google Scholar]
  40. Yazdian, F. Bioremediation of Vanadium Concentration by Methylotroph Bacteria; University of Tehran: Tehran, Iran, 2002. [Google Scholar]
Figure 1. (a) Two-dimensional structure of the model; (b) three-dimensional structure of the model.
Sustainability 14 08807 g001
Figure 2. (a) Concentration contour at 120 rpm, (b) concentration contour at 160 rpm, and (c) concentration contour at 200 rpm.
Sustainability 14 08807 g002
Figure 3. Velocity contour in 2D.
Sustainability 14 08807 g003
Figure 4. The velocity–distance curve in the 2D case.
Sustainability 14 08807 g004
Figure 5. Concentration contour in (a) 120 rpm, (b) 160 rpm, and (c) 200 rpm.
Sustainability 14 08807 g005
Figure 6. Velocity contour in (a) 120 rpm, (b) 160 rpm, and (c) 200 rpm.
Sustainability 14 08807 g006
Table 1. Mesh elements in three types of mesh.
Mesh SizeFineSmallCoarse
Mesh number963024,9184098
Table 2. The final concentration of vanadium in last time step.
Mesh ⮚
Velocity (rpm) ⮛
SmallFineCoarse
1200/86,6740/86,6450/86,674
1600/81,1960/81,2030/81,398
2000/81,0270/81,0960/81,161
Table 3. The comparison of elimination rate in 2D and 3D cases.
Velocity
(rpm)
Amount of Simulation Removal in 2D (%)Amount of Simulation Removal in 3D (%)
1201216
16016/522
20016/524
Publisher’s Note: MDPI stays neutral with regard to jurisdictional claims in published maps and institutional affiliations.

