
An Experimental Study on the Dynamic Evolution Characteristics of Soil Arching and the Rational Spacing of Anti-Slide Piles


1
Institute of Mountain Hazards and Environment, Chinese Academy of Sciences, Chengdu 610041, China
2
Key Laboratory of Mountain Hazards and Earth Surface Process, Chinese Academy of Sciences, Chengdu 610041, China
3
School of Civil Engineering, Henan Polytechnic University, Jiaozuo 454003, China
*
Author to whom correspondence should be addressed.
Sustainability 2022, 14(14), 8566; https://doi.org/10.3390/su14148566
Submission received: 9 May 2022
/
Revised: 20 June 2022
/
Accepted: 28 June 2022
/
Published: 13 July 2022
(This article belongs to the Special Issue Slope Stability Analysis and Landslide Disaster Prevention)
Abstract
:In order to analyse the dynamic evolution characteristics of soil arching during sliding processes, we conducted a series of model push-pile and direct shear tests. The tests’ results were used to design a relative displacement monitoring system and to introduce two dimensionless parameters (the push–compaction ratio (e) and the different degrees of push–compaction (t)) to investigate the degree of uneven soil deformation during the sliding processes. This innovative method was used to analyse the rational spacing between adjacent anti-slide piles. The results revealed that there was a push-to-compaction effect in sliding soil during the sliding process. Firstly, in terms of space, the gradual transfer characteristics of the landslide thrust and push-to-compaction effect, rather than a uniform deformation over the entire area, were revealed. In terms of time, the results demonstrated a law for the variation in push-to-compaction ratios: The expansion of e occurred earlier in the rear sliding body than in the front e, while the growth rate of front e was faster than that of e in the rear sliding body. The dynamic evolution process was divided into three stages: an elastic formation stage, a plastic development stage, and a failure stage. Secondly, during the sliding process, the shear strength parameters of the sliding soil did not have constant values but underwent a dynamic process of strengthening, and cohesion responded more efficiently than friction. Finally, the degree of mobilisation of the anti-sliding effect of the sliding soil can be used as a new means of quantitative analysis for rational spacing. The results indicated that the rational spacing between adjacent piles should be five times the width of the pile.
1. Introduction
Landslides are one of the most ubiquitous serious geohazards in the world and, particularly for long-term active landslides, frequently lead to a great loss of human life and property [1,2,3,4,5]. Consequently, the enormous challenges of maintaining the stability of landslides have inspired researchers to develop various stabilising structures [6,7]. Among the current reinforced concrete structures, it is preferable to use anti-slide piles to ensure safety from landslides. Most of the attention related to the pile spacing of anti-slide piles in recent decades has concerned the soil arching effect [8]. In further studies on landslides, a number of researchers have realised that the movement of soil on an unstable slope is an example of a complex system that is highly space–time-dynamic [9,10]. Therefore, engineers have to reconsider the soil–structure interaction in the dynamic sliding process of landslides, especially regarding the aspects of soil arching and pile spacing.
The soil arching effect resulting from anti-slide piles is a type of “wedge tightness” effect, formed when the soil around the piles is unevenly deformed, and its own shear strength is mobilised to resist and transmit the landslide thrust [11]. The research on the soil arching effect can generally be classified into three categories. The first category involves studying fundamental issues, such as soil arching formation mechanisms, evolution laws, pile–soil interactions, load-sharing laws, etc., through model tests, theoretical analyses, and numerical simulations [12,13,14,15,16,17,18]. The soil arching effect was first discovered by Kang et al. [12] with the trap-door test, which was further developed and validated by Liu et al. [19], Al-Naddaf [20], Pardo et al. [21], and Pulko et al. [22]. The second category of research is related to the establishment of a mathematical or numerical model based on the principle of soil arching for analysis of engineering application issues, such as rational pile spacing, the ultimate bearing capacity of anti-slide piles, and the stability of reinforced slopes [8,10,11,23,24]. The third category consists of research on the factors influencing soil arching, including studies of the influence of pile spacing, pile layout, pile diameter, pile type, soil strength parameters, seepage, load type, etc. [14,25,26,27,28,29].
In fact, the main objective condition for soil arch formation is the uneven deformation of the soil mass around piles. While most current research on soil arching is focused on stress or absolute deformation [27,30], little attention has been paid to the analysis of the formation and evolution mechanisms of soil arches through relative deformation. Moreover, the deformation and volume of sliding soil undergo a process of change, which inevitably causes the shear strength parameters of the sliding soil to change. However, the current research on soil arching and rational pile spacing is still based on the basic assumptions of constant physical and mechanical parameters for sliding soil. Indeed, quantitative research on the relationship between the dynamic changes in shear strength parameters and soil arching during sliding processes has rarely been carried out.
2. Laboratory Model Tests
2.1. Test Setup
For the model tests, we used a self-designed model test bench at the Institute of Mountain Hazards and Environment, Chinese Academy of Sciences (CAS). As shown in Figure 1, the internal net size of the model chute was 1.60 m (length) × 0.55 m (width) × 0.80 m (height), and the geometric similarity ratio was 1:20. The test bench was composed of an adjustable inclination chute, a baffle, a bearing plate, a jack-thrust loading device, and a data acquisition system.
2.2. Testing Material
In the tests, synthetic soil was used, containing barite particles, silty clay, mixed sand, washing powder, and talcum powder. Table 1 shows the amount of each material presented in the synthetic soil. Table 2 presents the shear strength parameters of the synthetic soil obtained from indoor physical mechanics tests. The sliding body was filled layer by layer with synthetic soil, and a polyethylene film was placed on the inner side of the chute to reduce the friction between the sliding body and the chute. A cantilever wooden pile, with a square cross-section (d = 60 mm and length l = 550 mm) was used for the model; lateral resistance was provided to the bottom of the pile by a fixing device to simulate the anchoring section of the anti-sliding pile, and the locking length was 50 mm.
2.3. Monitoring System
The test was performed using the CX-D10 two-way hydraulic jack with an ultimate thrust of 100 kN, the maximum stroke of 50 mm, and the rated pressure of the built-in pressure sensor of 63 MPa. The landslide thrust load borne on the anti-slide pile was monitored in real time using a micro-earth pressure gauge and the WS-3811N strain data acquisition system (Figure 2). A relative displacement monitoring system designed by a combination of a standard dial indicator and two steel bars was used to monitor the relative displacement between the pile–soil, the partitioned sliding body, and the bearing plate–soil. An average of two dial gauge readings were used to measure the relative displacement of the front sliding body behind the pile. The value of a, shown in Figure 1, was taken between 3d and 4d depending on the pile spacing [31]. The absolute displacement was measured using scales set on both sides of the chute. Photographs were taken simultaneously in horizontal and longitudinal directions to show the development of soil cracks and the destruction of soil arch-affected areas.
2.4. Loading Design
In order to simulate the thrust of a landslide, the sliding body was pushed into the model chute with the jack loading system. The displacement control loading method, which is more comparable to the actual sliding process, was employed to control the advancing process of the trailing edge of the landslide model by the dial indicator and scale 1 with a control accuracy of 0.01 mm and 0.1 mm, respectively (Figure 1). The thrust load was applied slowly and uniformly. Throughout the entire loading application process, the thrust value of the sliding body at different depths behind the pile was dynamically monitored. Every time the baffle between the jack loading system and the trailing edge of the sliding body was advanced 10 mm, The relative displacement monitoring data were read.
3. Results and Analysis
3.1. Evolution Characteristics of Soil Arching
Due to the presence of the embedded section, the lateral displacements of the anti-slide piles and the sliding body in landslides were not the same, resulting in uneven deformation of the sliding body around the piles. As a result of the uneven deformation, the sliding soil mobilised its shear resistance to act against the uneven deformation, exerting a “wedge tightness”, which formed the soil arching effect [11]. Consequently, the formation and evolution of the soil arching in anti-slide piles were linked to uneven deformation of the sliding body during the sliding process.
The uneven deformation of the sliding body can be quantitatively described by relative deformation and absolute deformation. As compared with absolute deformation, relative deformation is more useful for determining the movement state and studying the deformation within the sliding soil during a sliding process. Thus, this study analysed the sliding characteristics by monitoring the relative deformation of the different parts in the sliding body. As a result, uneven deformation can be described as a difference in relative deformation between sliding soil at different points, which can be used to investigate the evolution mechanism of the soil arch, thereby revealing how soil arch formation and evolution occur.
In order to ensure the repeatability of the analysis method and unrestricted application, and to eliminate accidental errors in the selection of the monitoring area in tests, this study introduced two dimensionless parameters: push–compaction ratio (e) and difference degree of push–compaction (t). Push–compaction ratio (e) is the ratio between the relative displacement (ξ) of sliding soil in a certain monitoring area and the total length (S) of the monitoring area (Equation (1)), shown in Figure 1a,c. There were different degrees of push–compaction (t) in different areas as a function of the absolute difference between the push–compaction ratios (ei,j). e and t could be expressed as
Therefore, the degree of relative deformation is defined as the push–compaction ratio (e), and the degree of uneven deformation is defined as the degree of push–compaction (t).
Figure 3 shows the variation in push–compaction (e) during a sliding process under the condition of L/d = 5, where e b, e m, e f, behind, and e f, between represent the values of the push–compaction ratios of the sliding soil in the back, middle, front behind piles, and front between piles, respectively. The value of e f, behind is the average of the values obtained by 3# and 5# monitoring systems.
It was observed that, when the lateral force started to be loaded by the jack loading system, the push–compaction ratio (e) of the sliding soil at every position trended to increase to varying degrees, and the difference between e f, behind and e f, between became more obvious as the absolute displacement increased, indicating the existence of push-to-compaction effect and uneven deformation. The soil’s shear resistance acted against the relative displacement. The lateral force was transferred from the soil to the piles, while the pile exerted a reaction force on the soil to further increase in e.
Based on the transparent soil technology, suggested by Liu et al. [19], three conditions for the existence of soil arching were proposed: (i) sufficient cohesion and friction between soil particles, (ii) conditions for supporting the feet of soil arching, and (iii) uneven displacement or relative displacement was generated inside the soil. This uneven displacement is shown in Figure 3b. By combining the physical properties of a material with a testing design, the necessary and sufficient conditions for the formation of soil arching were met.
The evolution characteristics of relative deformation were further explored in detail through the variation in the push–compaction ratio. At the beginning of the lateral force transmission (50 mm > δ ≥ 0), the value of e of each part of the sliding body was increased with the increase in δ (Figure 3a). The following results were in order of decreasing magnitude: e b > e m > e f, behind > e f, between. Furthermore, the overall growth rate of e f showed an increasing trend, while the growth rate of e b showed a decreasing trend, and e b, e m, and e f, behind were balanced at . Then, as δ continued to increase (100 mm > δ ≥ 50 mm), the lateral force was further transmitted to the front edge of the sliding body, and the value of e gradually evolved to the following results: e f, behind > e m = e b (Figure 3a,c).
Accordingly, in the sliding process, a gradual transfer of lateral force and the push-to-compaction effect of sliding soil, rather than a uniform deformation, were observed. In terms of time, the law of the variation in e was found: the expansion of e b occurred earlier than that of e f, while the growth rate of e f was faster than that of e b.
Figure 4a shows the variation in the push–compaction (t f) degrees in the front of the sliding body with absolute displacement (δ) under the condition of L/d = 5, where t f = | e f, behind − e f, between |. Figure 5 shows the variation in the lateral force (p) behind piles with absolute displacement (δ) under the condition of L/d = 5.
Withing the interval 30 mm > δ ≥ 0, with the increase in δ, the value of t f increased approximately linearly, and the curvature of the p–δ curve was kept constant throughout this period (Figure 5), indicating a stage of elastic deformation of sliding soil. In this process, the sliding soil was mainly uniformly deformed, and uneven deformation began to appear gradually. The different degrees of uneven deformation were not obvious (Figure 3b and Figure 4a), indicating that soil arching was in a stage of gestation and formation. This phenomenon is observed in Figure 4b and Figure 6a: local linear cracks began to appear in the soil around anti-slide piles and then extended backward quickly at an angle with the horizontal line.
As the value of δ continued to increase from 30 mm to 60 mm, both t f and p increased sharply and nonlinearly, and the slope of the curve was in a dynamic process of increase. While the value of δ increased from 60 mm to 100 mm, both t f and p entered a stable growth phase, the slope of the curve was in a dynamic process of decrease, and the value of p gradually reached its peak state (Figure 5), indicating a stage of plastic deformation of sliding soil. In this process, the different degrees of uneven deformation of sliding soil developed rapidly (Figure 3b and Figure 4a), indicating that soil arching was at a stage of formation and development when it resisted and transmitted large lateral forces. This phenomenon is shown in Figure 4c: The directions of cracks began to deflect significantly. In the tests when soil arching occurred, Lin et al. [17] found that the horizontal stress (σ x) of sliding soil reached a peak in the central section between the anti-slide piles. This situation resulted in some restraining effect on the absolute deformation of the sliding soil around soil arching in the direction of Y, leading to relative deformation. This explained to a certain extent why the value of e increased significantly in this stage.
When δ ≥ 100 mm, with the increase in δ, both p and e f, between decreased gradually, indicating a decay process of soil arching effect. Although the value of t f increased sharply, the relative deformation of the front sliding soil between piles decreased. This indicated that the soil aching effect began to fail gradually under the condition of increasing the absolute displacement after soil arching exerted its limited function. It should be noted that the sliding soil around piles began to spall in layers and was squeezed out (Figure 4d,e). This occurred because the approximate free boundary conditions formed by the continuous extrusion of the sliding soil between the piles were not able to resist lateral forces. Therefore, the tensile stresses developed when soil arching was occurring. The degree of uneven deformation gradually increased, so it began to develop in an unfavourable direction.
Through experimental observations and the analysis of monitoring data, obvious phase characteristics were found in the evolution process of soil arching of anti-slide piles. Based on the characteristics of deformation, lateral force, and collapse of sliding soil, the evolution process of soil arching was divided into three phases (Figure 5): an elastic formation stage, a plastic development stage, and a failure stage.
Additionally, the failure of soil arching exhibited three-dimensional characteristics. On the horizontal plane, several dense arc-shaped cracks first developed around anti-slide piles. With a continuous increase in δ, the extrusion of layered soil appeared alongside spalling, exhibiting a characteristic of layered failure of soil arching (Figure 4d,e). On the vertical plane, the soil in the middle part cracked and collapsed first to form a cavity. Next, the catenary cracked at the top and continued developing downward with signs of soil subsidence and spalling (Figure 6c,e). This phenomenon was consistent with the numerical simulation results obtained by Wang et al. [32].
This failure phenomenon can be explained from the perspective of soil mechanics. Wang et al.’s [32] numerical results and measurements of thrust behind the piles indicated that the thrust at the deep part was greater than that at the top. However, gravity increased the effective normal stress of the deeper soil. Considering the Mohr–Coulomb yielding criterion, the increase in effective normal stress can enhance the shear strength in the soil mass. It can be expressed as follows [33,34]:
where is the shear strength of soil, is the cohesion of soil, is the angle of shearing resistance, is the normal stress, and is the shear strength of the soil.
Thus, the soil arching in the bottom was more stable than that in the top and middle sections. As a result of the free boundary condition of the top surface, the sliding body bulged during the sliding process (Figure 6d), which did not facilitate the transmission of landslide thrust. The middle sliding body received a higher thrust than the top, and the enhancement effect of soil shear strength contributed by gravity was not significant. In the middle sliding body, this caused the soil arching to fail for the first time.
3.2. Strengthening Effect of Shear Strength Parameters
There are many factors affecting soil strength. Shear strength of soil can be correlated with other influencing factors by the following relationship [34,35]:
where, denotes the void ratio, denotes the composition, denotes the effective stress, denotes the stress history, denotes the temperature, and denote the strain and strain rate, respectively, and denotes the structure of the soil.
As a result of relative deformation, soil volume varies, and the void ratio changes [34]. Consequently, the shear strength of soil changes due to an increase or decrease in relative deformation during a sliding process. The dynamic changes in shear strength parameters (including cohesion (c) and friction (φ)) of sliding soil under different push-to-compaction conditions can be quantitatively described using direct shear tests (Figure 7).
Figure 8 shows the variation in c and φ under different push–compaction ratios (e) of the sliding soil and represents the undisturbed soil without landslide thrust, where e = 0. Both c and φ were positively correlated with e, but with the increase in e, c showed a more obvious increase than φ. While e reached from 0 to 0.30, the value of c and φ increased by 92.4% and 18.6%, respectively. These results suggested that cohesion was more sensitive to compaction ratio than to friction. Furthermore, during the sliding process, the shear strength parameters of the sliding soil did not have constant values but underwent a dynamic strengthening process. Previous analytical solutions and numerical studies, however, mostly relied on the assumption that the physical and mechanical parameters of sliding soil were constant [8,14,16,27], ignoring the dynamic changes and strengthening effects of the shear strength parameters during the sliding process. This was not conducive to a clear understanding of the mechanism of soil arching, which could lead to conservative results of calculations.
4. Discussion
4.1. Evolution Mechanism of Soil Arching
An analysis of a series of physical model tests was conducted to observe and analyse the evolution process of soil arching. Additionally, the direct shear tests quantitatively demonstrated the dynamic process in which the parameters of shear strength were strengthened. The evolution mechanism of arching by which the development direction of cracks was deflected during a sliding process, however, has rarely been studied. According to Zhao, et al. [36], the formation of soil arching was a result of soil mobilising its shear strength to resist uneven deformation. The existence of shear strength in sliding soil would certainly result in an angle between the direction in which cracks developed and the horizontal line at the front edge of sliding soil, but there was insufficient evidence to explain the change in angle.
Mohr–Coulomb failure theory suggests that failure along a plane in material occurs as a result of a critical combination of normal and shear stresses and not as a result of either normal or shear stresses alone [34]. Moreover, soil shear strength was affected by c and φ, which were in a dynamic process of strengthening by sliding. Therefore, by investigating the dynamic evolution characteristics of normal stress and shear strength parameters, soil arching formation and failure mechanisms can be investigated.
A landslide’s push–compaction effect and lateral thrust of landslides were transferred from the back of the sliding body to the front step by step, and shear strength parameters were positively correlated with the push–compaction ratio. At the beginning of the lateral force transmission from back to front, the increase in and parameters were also transmitted forward. Consequently, the results of in Equation (3) had a decreasing magnitude: > > > … > > … > (k, n N). From this point of view, the shear strength of sliding soil at different positions during a sliding process is not uniform, and the larger shear strength makes soil mass more resistant to failure. Therefore, after cracks appeared, development directions began to converge toward the centreline between the anti-slide piles, while cracks crossed the area with different shear strengths, forming gradually an arched structure (Figure 9).
With the continued process of absolute deformation, the push–compaction ratio of the sliding soil in different positions began to balance around δ = 50 mm and then entered a stable state. During this process, the difference between and strength parameters at different positions gradually decreased. Theoretically, this deformation causes a transition from an arched structure to a triangle structure, which is consistent with the soil arch model proposed by Zhao et al. [36].
4.2. Discussion of Rational Spacing between Adjacent Piles
In fact, the tightly spaced anti-slide piles would certainly be effective in preventing sliding. For the anti-sliding design to be more accurate and economical, a rational pile spacing was conductive to mobilising sliding body soil structures to the greatest extent to exert the anti-sliding effect. Therefore, the mobilisation degree of the anti-sliding effect of sliding soil itself can be used as a new method of quantitatively analysing the rational spacing between adjacent piles. The anti-sliding effect of sliding soil was achieved by forming a soil arching. The content of Section 3.1 indicates that the value of t, which was used to characterise the degree of uneven deformation of sliding soil, was consistent with the formation and evolution of soil arching and that the strength of sliding soil was positively correlated with the value of e. As a result, t u, measured during the first failure of the soil arch, was used to characterise the degree of mobilisation of the anti-sliding effect of sliding soil itself under different pile spacing conditions, and e u, measured during the first failure of soil arch, was used to characterise the strength contribution of different pile spacing conditions to the sliding soil, thus allowing the rational spacing between adjacent piles to be determined.
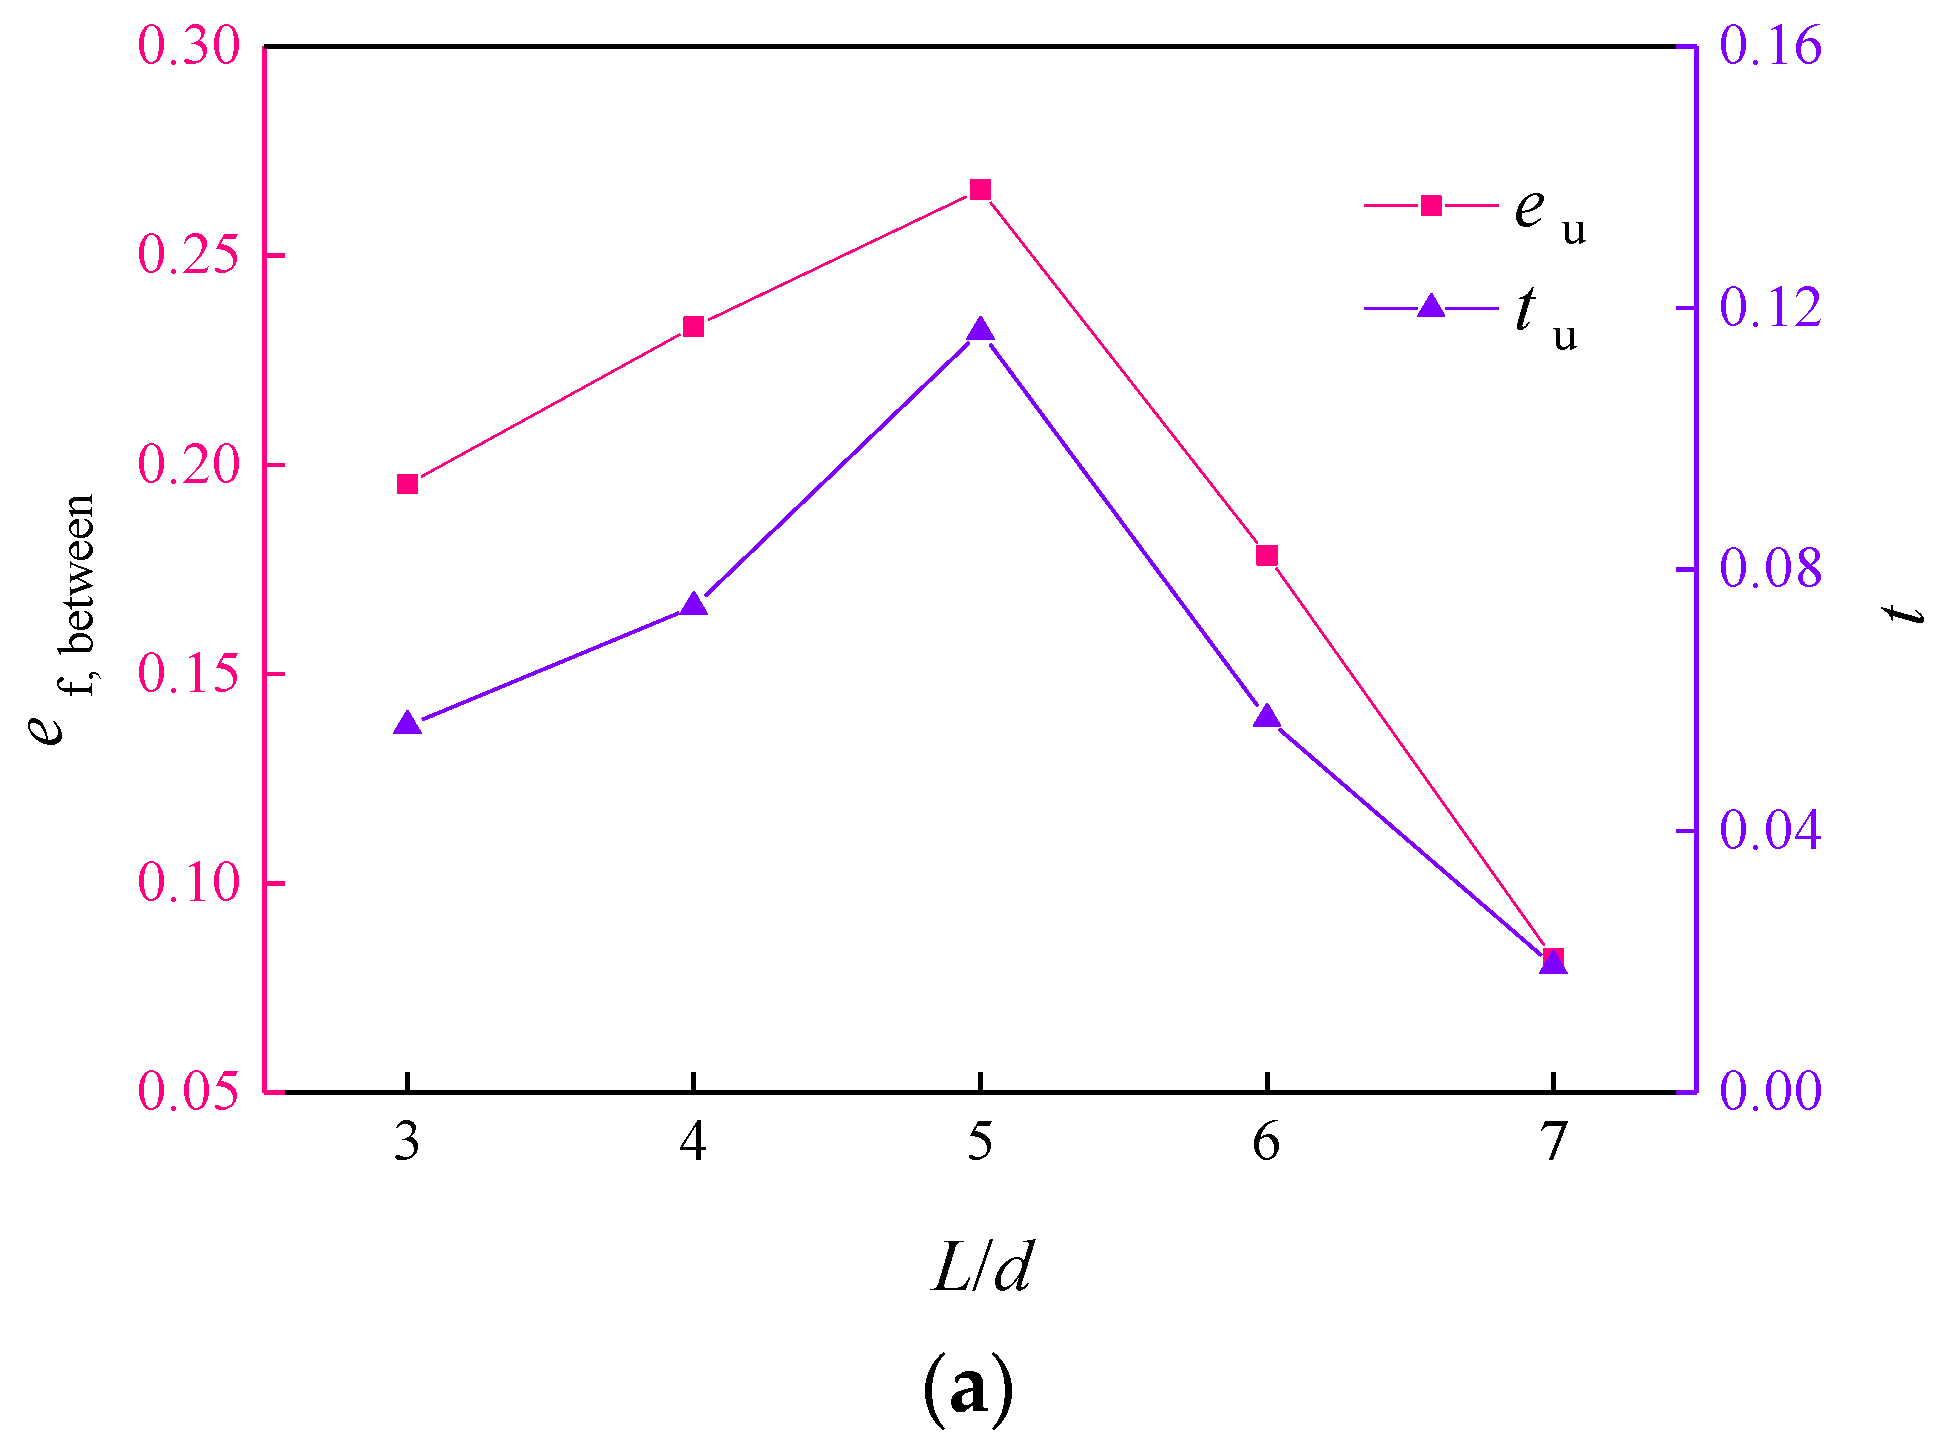
Figure 10 shows the relationship between pile spacing and various parameters. The curves of L/d against e f, between and t u when soil arch failed for the first time are shown in Figure 10a; both t u and e f, between had maximum values when L/d = 5, minimum values when L/d = 7, and similar values when L/d = 3 or 4. The results of t u showed that the uneven deformation of sliding soil reached its peak state under the condition of L/d = 5, indicating that the pile spacing condition of L/d = 5 was conducive to the formation of the most effective soil arching effect. Furthermore, the results of e f, between indicated that the sliding soil reached its maximum compaction and peak wedging state under the condition of L/d = 5.
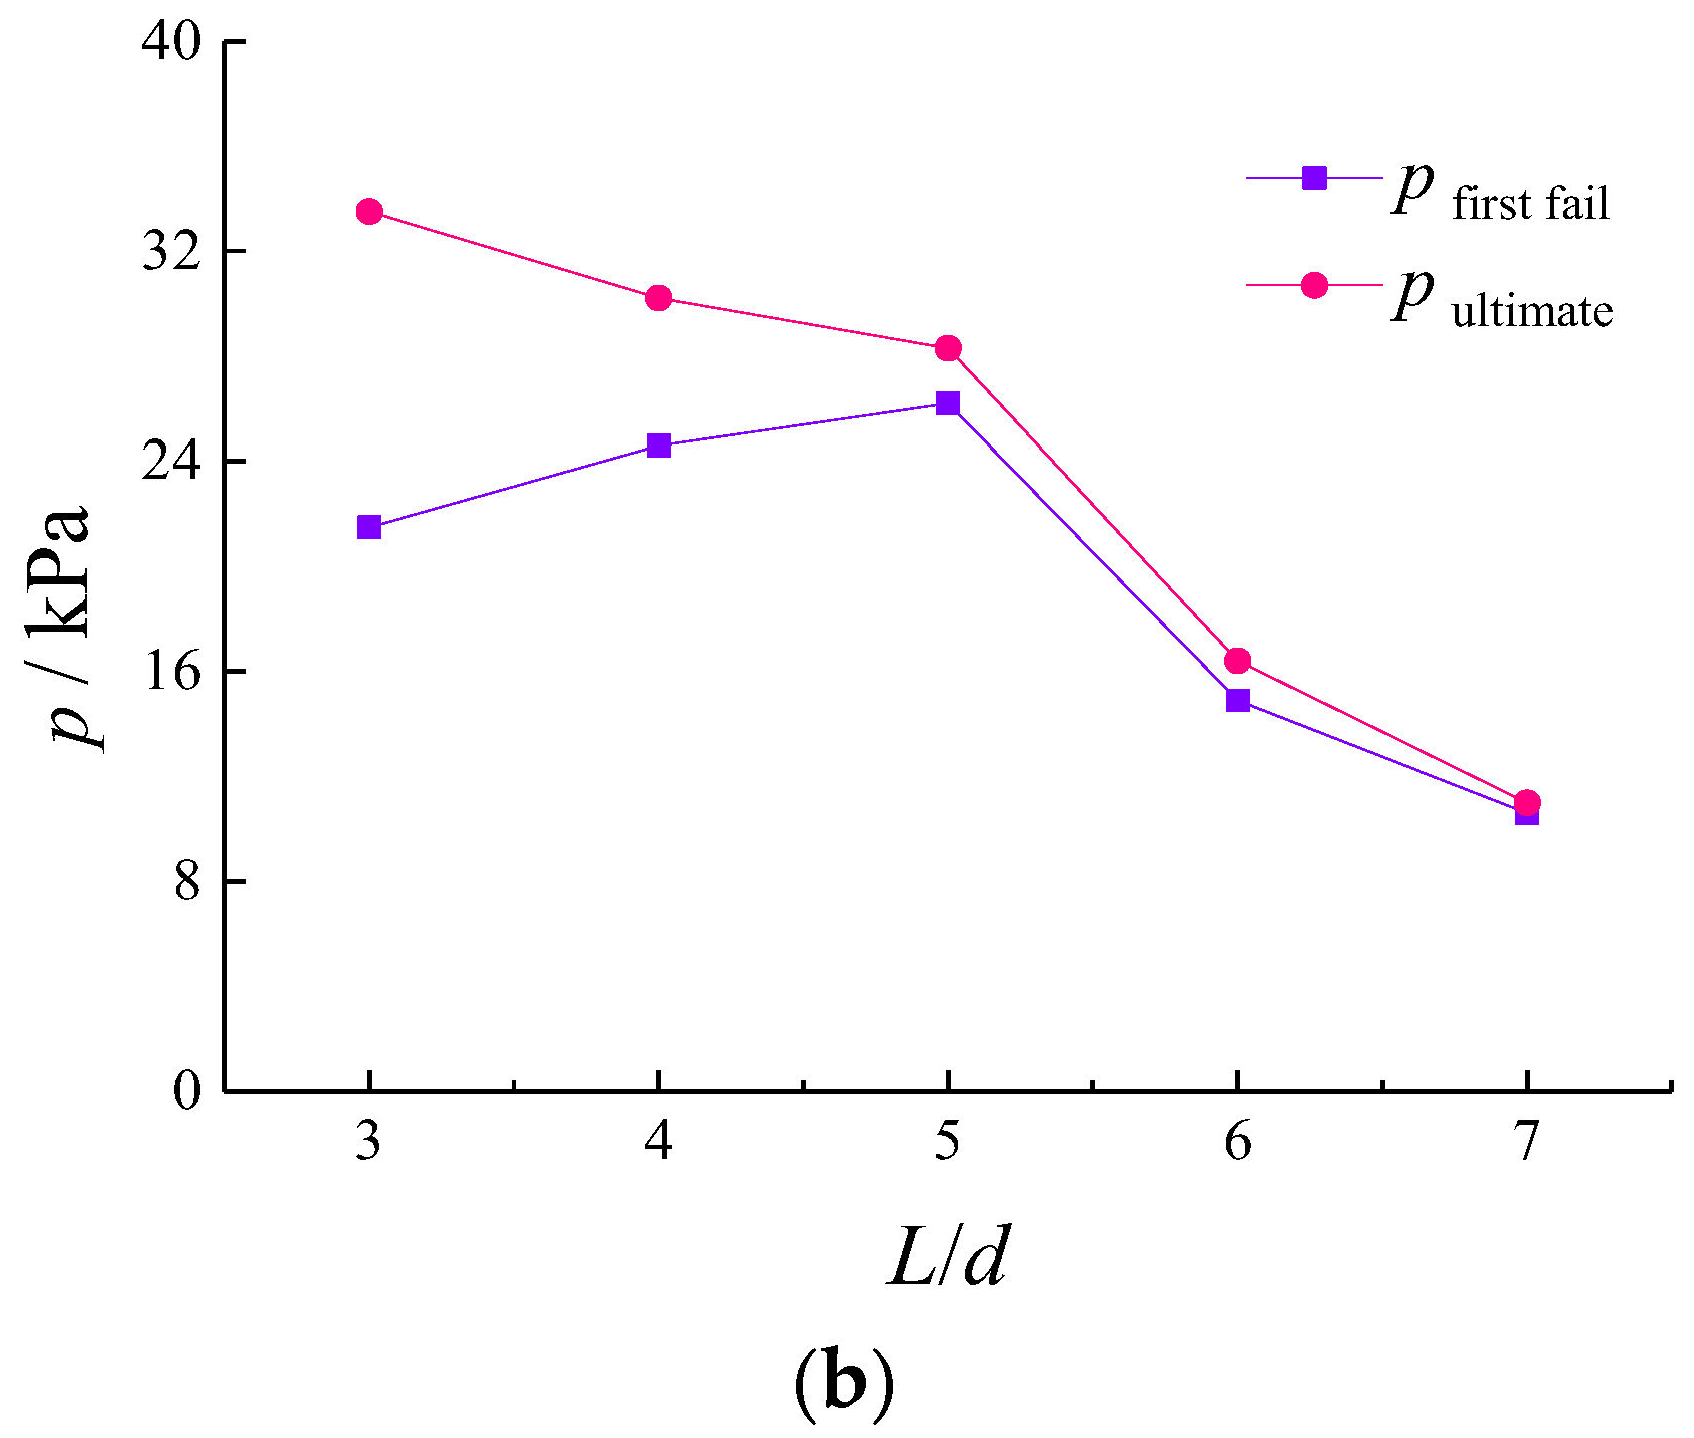
Figure 10b illustrates the variation in thrust behind piles under different pile spacings when the soil arch failed for the first time and the slope finally collapsed. As pile spacing increased, the value of p first fail increased slowly until it reached a maximum of 26.2 kPa at L/d = 5 and then rapidly decreased. In contrast, the value of p ultimate showed a nonlinear decreasing trend as pile spacing increased. The results showed that under the condition of L/d = 5, the ability of the firstly formed soil arch to resist and transmit landslide thrust reached its maximum. The physical tests that Sun et al. [25,26] conducted to determine the evolution characteristics of the soil arch of anti-pile proved that the soil arch was formed multiple times during the entire sliding process, combined with the strengthening effect of compaction. Thus, the difference between p first fail and p ultimate can be explained.
The mobilisation degree of the anti-sliding effect of the sliding soil itself can be used as a new method of analysing the rational pile spacing, and t u can be used as an effective parameter to characterise the degree of mobilisation of the anti-sliding effect of the sliding soil itself. The results revealed that the sliding soil reached its peak compaction and wedging when the pile spacing was five times the pile width, which is most conducive to the mobilisation of the anti-sliding effect and the enhancement of shear strength.
5. Conclusions
This study involved a series of laboratory model tests and basic mechanical tests. In addition, two dimensionless parameters were introduced, namely, the push–compaction ratio (e) and the degree of push–compaction (t), to ensure the repeatability of the analysis method and unrestricted application, as well as to eliminate accidental errors during the selection of the monitoring area. This study analysed the dynamic evolution characteristics of soil arching during sliding processes. Based on the results of the study, the following conclusions can be drawn:
There was a push-to-compaction effect in sliding soils during sliding processes. Additionally, in terms of space, gradual transfer characteristics of landslide thrusts and soil push-to-compaction effects, rather than uniform deformation, were observed. In terms of time, according to the law of sliding body’s push-to-compaction ratio, the expansion of e back occurred earlier than that of e front, while the growth rate of e front was faster than that of e back.
In order to understand the dynamic evolution process of soil arching, it was divided into three stages: elastic formation, plastic development, and failure. Furthermore, during the sliding process, the shear strength parameters of sliding soil did not have constant values but underwent a dynamic process of strengthening. This was because cohesion responded more efficiently than friction.
Three-dimensional characteristics were observed in the failure of the soil arching of the anti-slide pile. In the horizontal plane, evidence of layered arch failure was observed. In the vertical plane, it was observed that the soil in the middle section of the pile cracked and collapsed first, followed by the development of catenary cracks at the top, indicating soil subsidence and spalling.
Push–compaction and parameters strengthening first appeared in the rear sliding body, and they were transmitted to the front edge before the push–compaction ratio of the sliding soil reached its first equilibrium. Consequently, there could be an uneven variation in the shear strength of the sliding soils: The strength of the sliding soils at the rear of the piles was greater than the strength of the sliding soils at the front, and the strength of the sliding body behind the piles was greater than the strength between the piles. When soils failed, variation in strength caused cracks to converge toward the centreline between the piles, forming an arched structure.
The mobilisation degree of the anti-sliding effect of the sliding soil itself can be used as a new method of quantifying the rational pile spacing, and t u can be used as an effective parameter to characterise the degree of mobilisation of the anti-sliding effect of the sliding soil. Results of this study showed that the rational spacing between adjacent anti-sliding piles was five times the width of the piles.
6. Limitations and Recommendations
Although sliding soils behind anti-sliding piles underwent a dynamic strengthening process while sliding, further study of these characteristics and laws of strengthening is needed. Further study of strengthening laws’ contribution to the optimal design of anti-sliding piles in practical engineering is necessary.
Only the test results of rational spacing between adjacent piles were considered in this study. Further research should focus on the application of these results to practical engineering problems.
Author Contributions
Conceptualisation, W.Z. and S.Z.; methodology, W.Z. and S.Z.; software, S.Z.; validation, W.Z. and N.H.; formal analysis, N.H.; investigation, S.Z.; resources, W.Z.; data curation, W.Z. and S.Z.; writing—original draft preparation, W.Z. and S.Z.; writing—review and editing, N.H.; visualisation, N.H.; supervision, N.H. and W.Z.; project administration, N.H. and W.Z.; funding acquisition, N.H. and W.Z. All authors have read and agreed to the published version of the manuscript.
Funding
This work was supported by the National Key Research and Development Program of China (Grant No. 2020YFD1100701) and the National Natural Science Foundation of China (No. 41302284).
Conflicts of Interest
The authors declare no conflict of interest.
References
- Ashour, M.; Ardalan, H. Analysis of pile stabilized slopes based on soil–pile interaction. Comput. Geotech. 2012, 39, 85–97. [Google Scholar] [CrossRef]
- Bi, Z.; Gong, Q.; Guo, P.; Cheng, Q. Experimental study of the evolution of soil arching effect under cyclic loading based on trapdoor test and particle image velocimetry. Can. Geotech. J. 2020, 57, 903–920. [Google Scholar] [CrossRef]
- Cai, F.; Ugai, K. Numerical Analysis of the Stability of a Slope Reinforced with Piles. Soils Found. 2000, 40, 73–84. [Google Scholar] [CrossRef] [Green Version]
- Chen, L.T.; Poulos, H.G.; Hull, T.S. Model tests on pile groups subjected to lateral soil movement. Soils Found. 1997, 37, 1–12. [Google Scholar] [CrossRef] [Green Version]
- Chen, C.Y.; Martin, G.K. Soil–structure interaction for landslide stabilizing piles. Comput. Geotech. 2002, 29, 363–386. [Google Scholar] [CrossRef]
- Chevalier, B.; Combe, G.; Villard, P. Load transfers and arching effects in granular soil layer. In Proceedings of the 18ème Congrès Français de Mécanique, Grenoble, France, 27–31 August 2007. [Google Scholar]
- Das, B.M. Advanced Soil Mechanics, 4th ed.; CRC Press: Boca Raton, FL, USA, 2014; pp. 403–507. [Google Scholar]
- Handy, R.L. The arch in soil arching. J. Geotech. Eng. 1985, 111, 302–318. [Google Scholar] [CrossRef]
- He, G.-F.; Li, Z.-G.; Yuan, Y.; Li, X.-H.; Hu, L.-H.; Zhang, Y. Optimization analysis of the factors affecting the soil arching effect between landslide stabilizing piles. Nat. Resour. Model. 2018, 31, e12148. [Google Scholar] [CrossRef]
- He, Y.; Hazarika, H.; Yasufuku, N.; Teng, J.; Jiang, Z.; Han, Z. Estimation of lateral force acting on piles to stabilize landslides. Nat. Hazards 2015, 79, 1981–2003. [Google Scholar] [CrossRef]
- Huang, R.Q. Some catastrophic landslides since the twentieth century in the southwest of China. Landslides 2009, 6, 69–81. [Google Scholar] [CrossRef]
- Kang, G.-C.; Song, Y.-S.; Kim, T.-H. Behavior and stability of a large-scale cut slope considering reinforcement stages. Landslides 2009, 6, 263–272. [Google Scholar] [CrossRef]
- Li, C.D.; Tang, H.M.; Hu, X.L.; Wang, L.Q. Numerical modelling study of the load sharing law of anti-sliding piles based on the soil arching effect for Erliban landslide, China. KSCE J. Civ. Eng. 2013, 17, 1251–1262. [Google Scholar] [CrossRef]
- Li, C.D.; Wu, J.J.; Tang, H.M.; Wang, J.; Chen, F.; Liang, D.M. A novel optimal plane arrangement of stabilizing piles based on soil arching effect and stability limit for 3D colluvial landslides. Eng. Geol. 2015, 195, 236–247. [Google Scholar] [CrossRef]
- Li, G.X. Advanced Soil Mechanics, 2nd ed.; Tsinghua University Press: Beijing, China, 2016; pp. 137–212. (In Chinese) [Google Scholar]
- Liang, R.; Zeng, S.P. Numerical study of soil arching mechanism in drilled shafts for slope stabilization. Soils Found. 2002, 42, 83–92. [Google Scholar] [CrossRef] [Green Version]
- Lin, Z.P.; Liu, Z.Q.; Shang, Q.T. Research on soil arch of anti-slide pile structure with methods of separation and combination. Rock Soil Mech. 2012, 33, 3109–3114. (In Chinese) [Google Scholar] [CrossRef]
- Lirer, S. Landslide stabilizing piles: Experimental evidences and numerical interpretation. Eng. Geol. 2012, 149–150, 70–77. [Google Scholar] [CrossRef]
- Liu, J.; Iskander, M.G. Modelling capacity of transparent soil. Can. Geotech. J. 2010, 47, 451–460. [Google Scholar] [CrossRef]
- Al-Naddaf, M.; Han, J.; Xu, C.; Jawad, S.; Abdulrasool, G. Experimental investigation of soil arching mobilization and degradation under localized surface loading. J. Geotech. Geoenviron. Eng. 2019, 145, 1–17. [Google Scholar] [CrossRef]
- Mujah, D.; Hazarika, H.; Watanabe, N.; Ahmad, F. Soil arching effect in sand reinforced with micropiles under lateral load. Soil Mech. Found. Eng. 2016, 53, 152–157. [Google Scholar] [CrossRef]
- Pardo, G.S.; Sáez, E. Experimental and numerical study of arching soil effect in coarse sand. Comput. Geotech. 2014, 57, 75–84. [Google Scholar] [CrossRef]
- Pulko, B.; Majes, B.; Mikoš, M. Reinforced concrete shafts for the structural mitigation of large deep-seated landslides: An experience from the Macesnik and the Slano blato landslides (Slovenia). Landslides 2014, 11, 81–91. [Google Scholar] [CrossRef]
- Shen, Y.J.; Yang, M.; Cui, H.H.; Xiang, Z.L.; Li, Y.Z.; Wen, K. Distribution characteristics and influence factors of soil arching ring behind stabilizing piles. Appl. Mech. Mater. 2015, 744–746, 474–478. [Google Scholar] [CrossRef]
- Sun, H.Y.; Wong, L.N.Y.; Shang, Y.Q.; Shen, Y.J.; Qing, L. Evaluation of drainage tunnel effectiveness in landslide control. Landslides 2012, 7, 445–454. [Google Scholar] [CrossRef]
- Sun, S.W.; Ma, N.; Hu, J.B.; Zhu, B.Z. Evolution characteristics and mechanism analysis of soil arch of anti-slide pile. J. Railw. Eng. Soc. 2019, 254, 7–12. (In Chinese) [Google Scholar]
- Terzaghi, K. Stress distribution in dry and in saturated sand above a yielding trap-door. In Proceedings of the 1st Conference of Soil Mechanics and Foundation Engineering, Boston, MA, USA, 22–26 July 1936; Cambridge Press: Cambridge, UK; pp. 307–316. [Google Scholar]
- Terzaghi, K. Theoretical Soil Mechanics; John Wiley & Sons: New York, NY, USA, 1943; pp. 76–85. [Google Scholar]
- Vardoulakis, L.; Graf, B.; Gudehus, G. Trap-door problem with dry sand: A statical approach based upon model test kinematics. Int. J. Numer. Anal. Methods Geomech. 1981, 5, 57–78. [Google Scholar] [CrossRef]
- Wang, F.W.; Sassa, K. Landslide simulation by a geotechnical model combined with a model for apparent friction change. Phys. Chem. Earth 2010, 35, 149–161. [Google Scholar] [CrossRef]
- Wang, G.H.; Sassa, K. Pore-pressure generation and movement of rainfall-induced landslides: Effects of grain size and fine-particle content. Eng. Geol. 2003, 69, 109–125. [Google Scholar] [CrossRef]
- Wang, G.L.; Ran, L.B.; Zhang, L. Discrete element simulation and evolution pattern of three-dimension soil arching between anti-slide piles. J. Civ. Environ. Eng. 2019, 41, 1–8. (In Chinese) [Google Scholar] [CrossRef]
- Wei, X.-L.; Chen, N.-S.; Cheng, Q.-G.; He, N.; Deng, M.-F.; Tanoli, J.I. Long-term activity of earthquake-induced landslides: A case study from Qionghai Lake Basin, Southwest of China. J. Mt. Sci. 2014, 11, 607–624. [Google Scholar] [CrossRef]
- Wu, J.J.; Li, C.D.; Liu, Q.T.; Fan, F.S. Optimal isosceles trapezoid cross section of laterally loaded piles based on friction soil arching. KSCE J. Civ. Eng. 2017, 21, 2655–2664. [Google Scholar] [CrossRef]
- Xu, C.J.; Liang, L.J.; Chen, Q.Z.; Luo, W.J.; Chen, Y.F. Experimental study of soil arching effect under seepage condition. Acta Geotech. 2019, 14, 2031–2044. [Google Scholar] [CrossRef]
- Zhao, X.Y.; Li, K.P.; Xiao, D. A simplified method to analyze the load on composite retaining structures based on a novel soil arch model. Bull. Eng. Geol. Environ. 2020, 79, 3483–3496. [Google Scholar] [CrossRef]
Figure 1.
Layout of model test: (a) plan view; (b) side view; (c) relative displacement monitoring system (all units in cm).
Figure 1.
Layout of model test: (a) plan view; (b) side view; (c) relative displacement monitoring system (all units in cm).
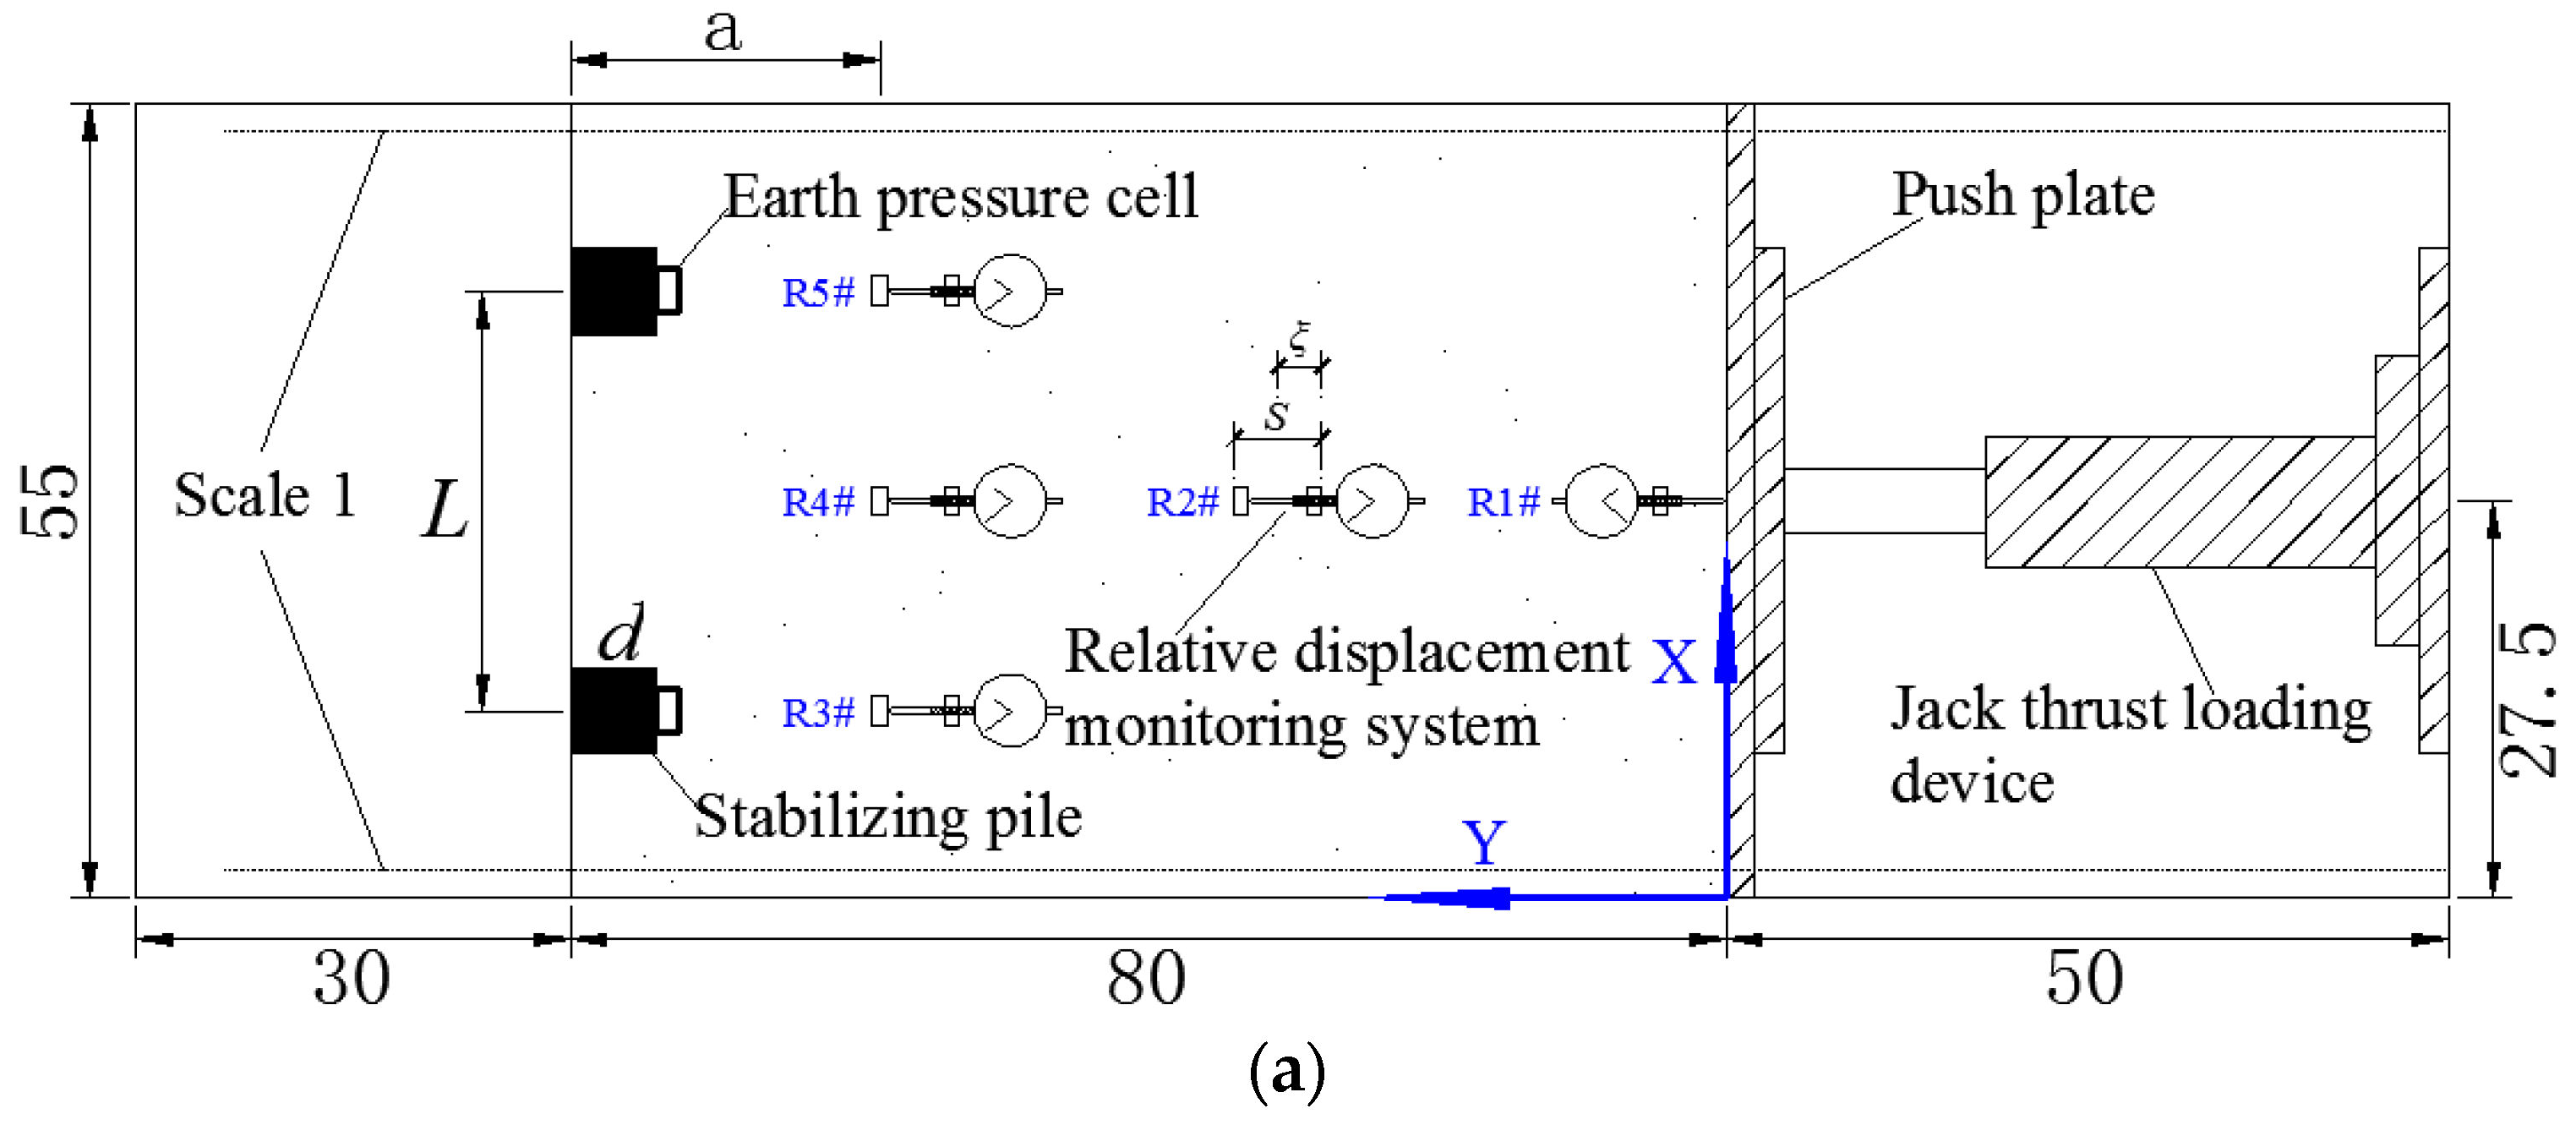
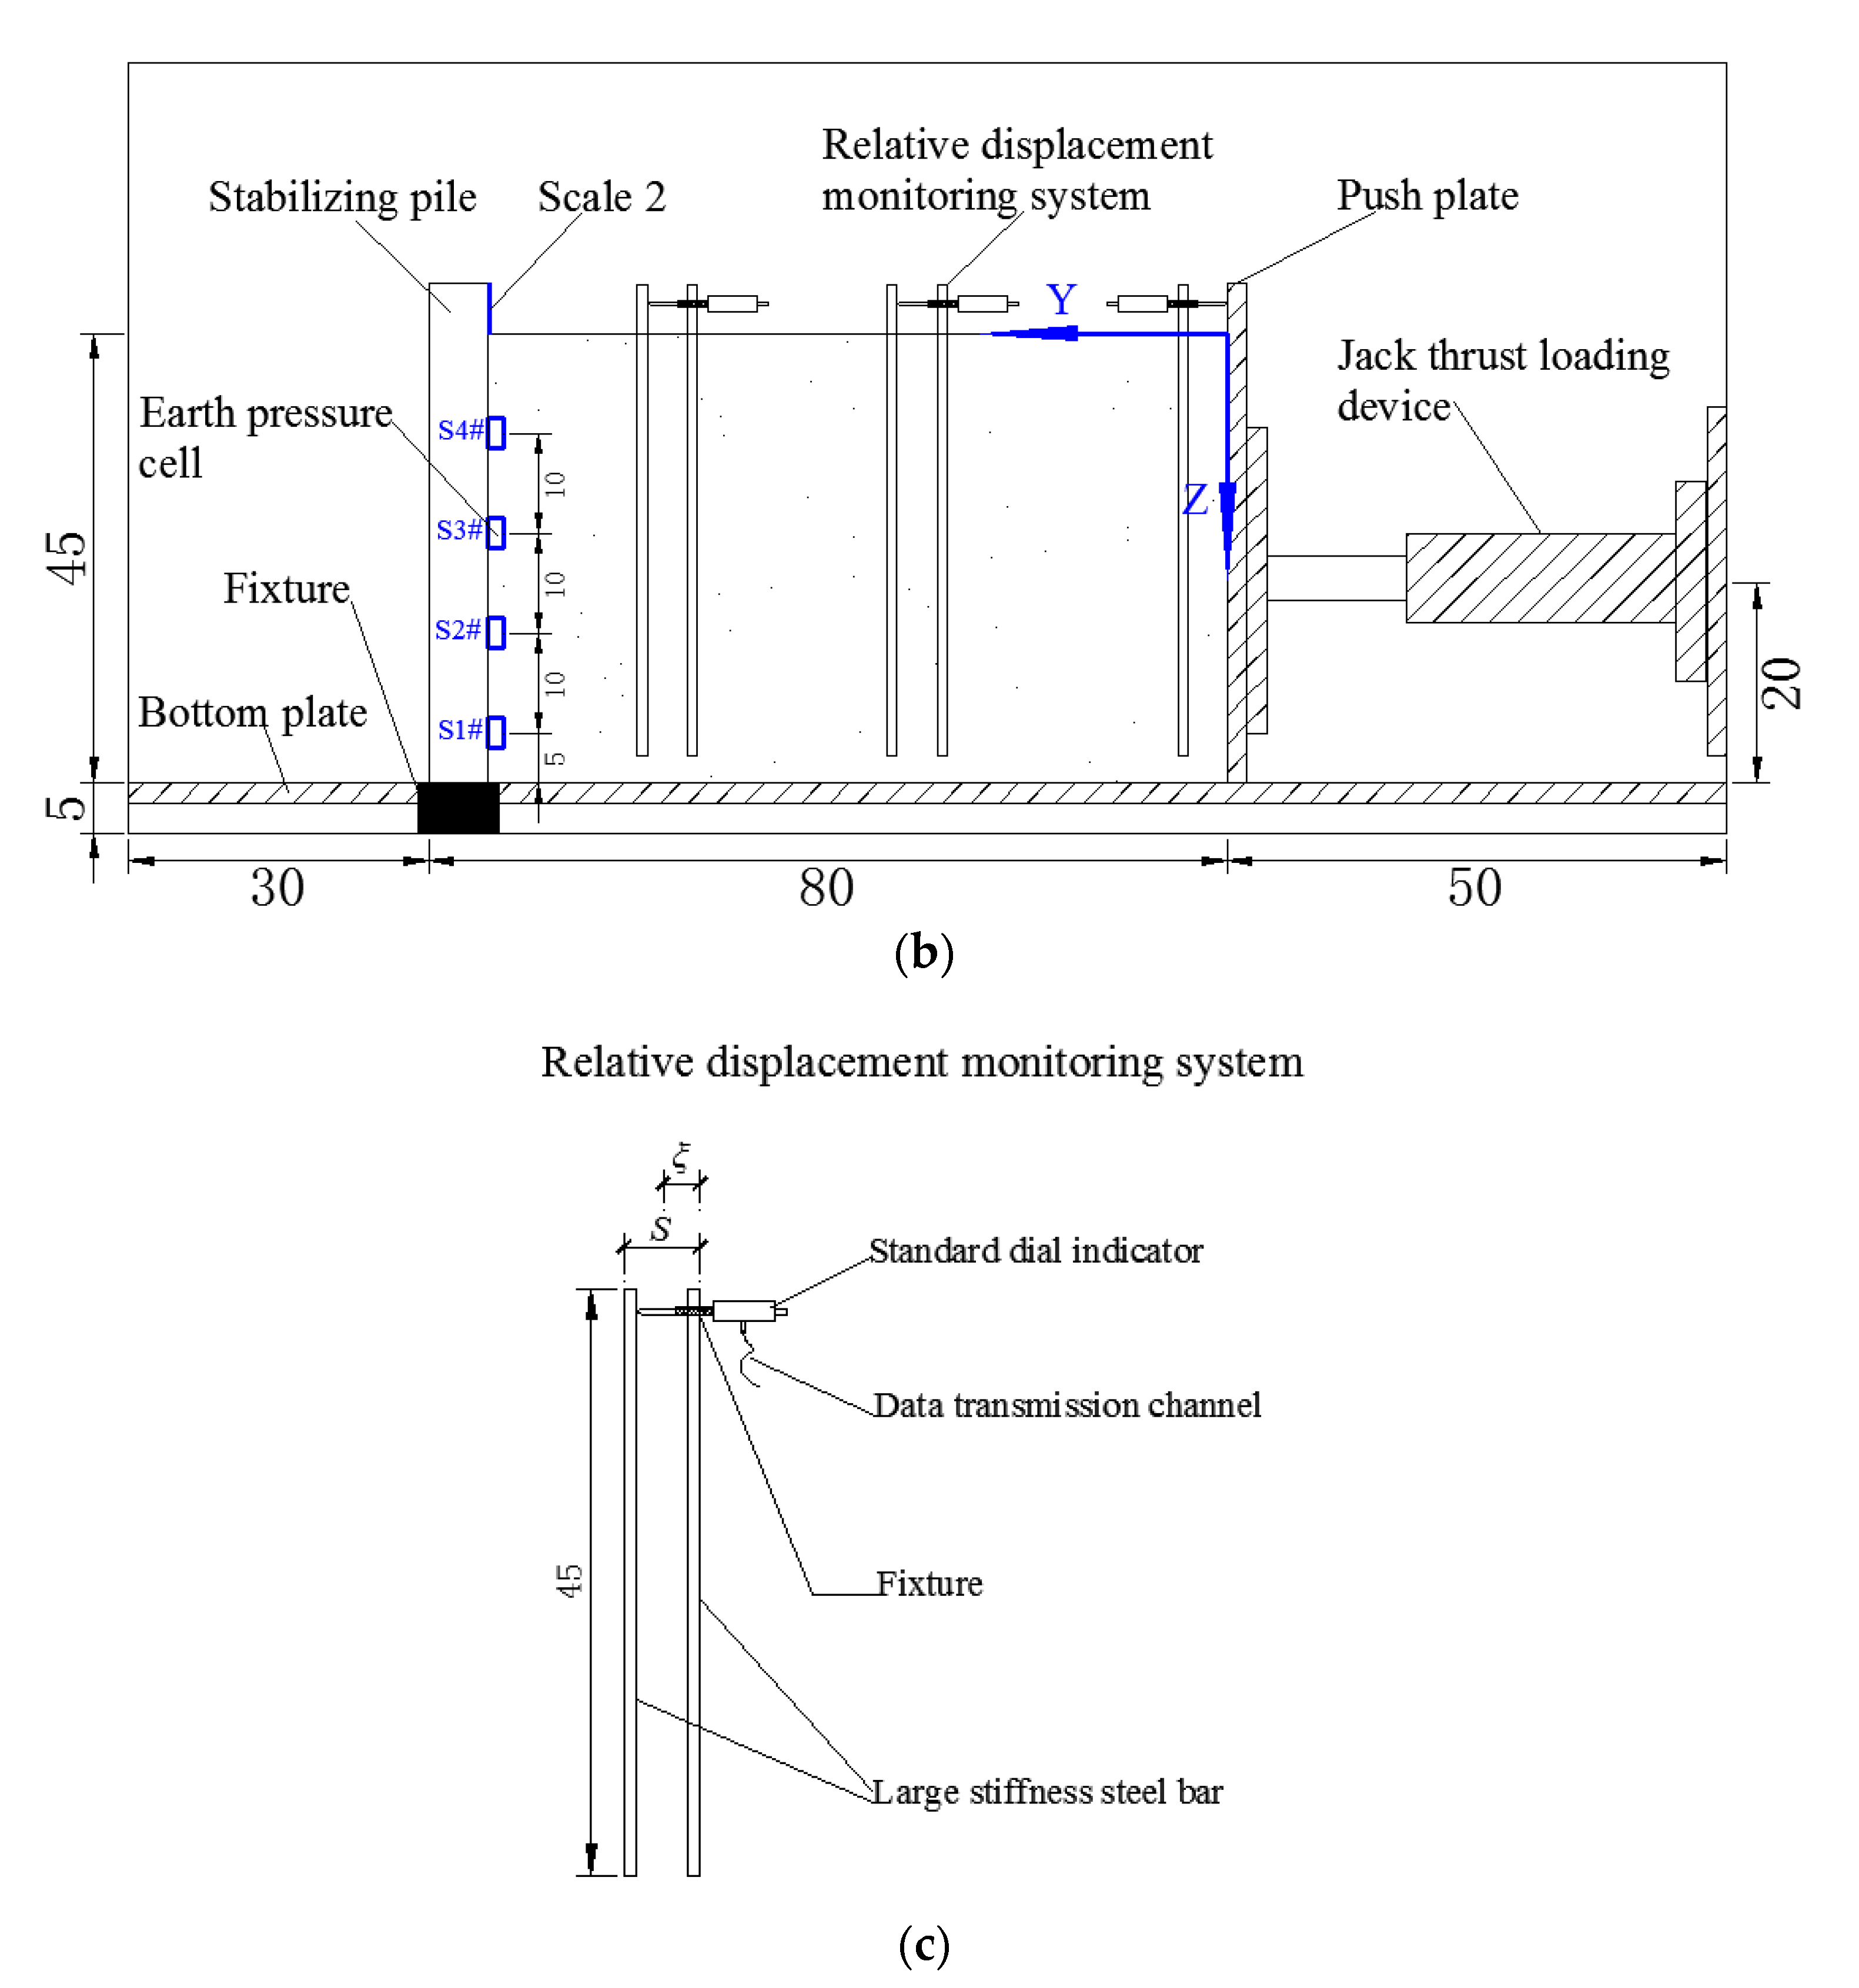
Figure 2.
The WS-3811N strain data acquisition system.

Figure 3.
Variation in push–compaction (e) during a sliding process under the condition of L/d = 5: (a) e − δ curve, (b) variation in e in the direction of X, and (c) variation in e in the direction of Y.
Figure 3.
Variation in push–compaction (e) during a sliding process under the condition of L/d = 5: (a) e − δ curve, (b) variation in e in the direction of X, and (c) variation in e in the direction of Y.
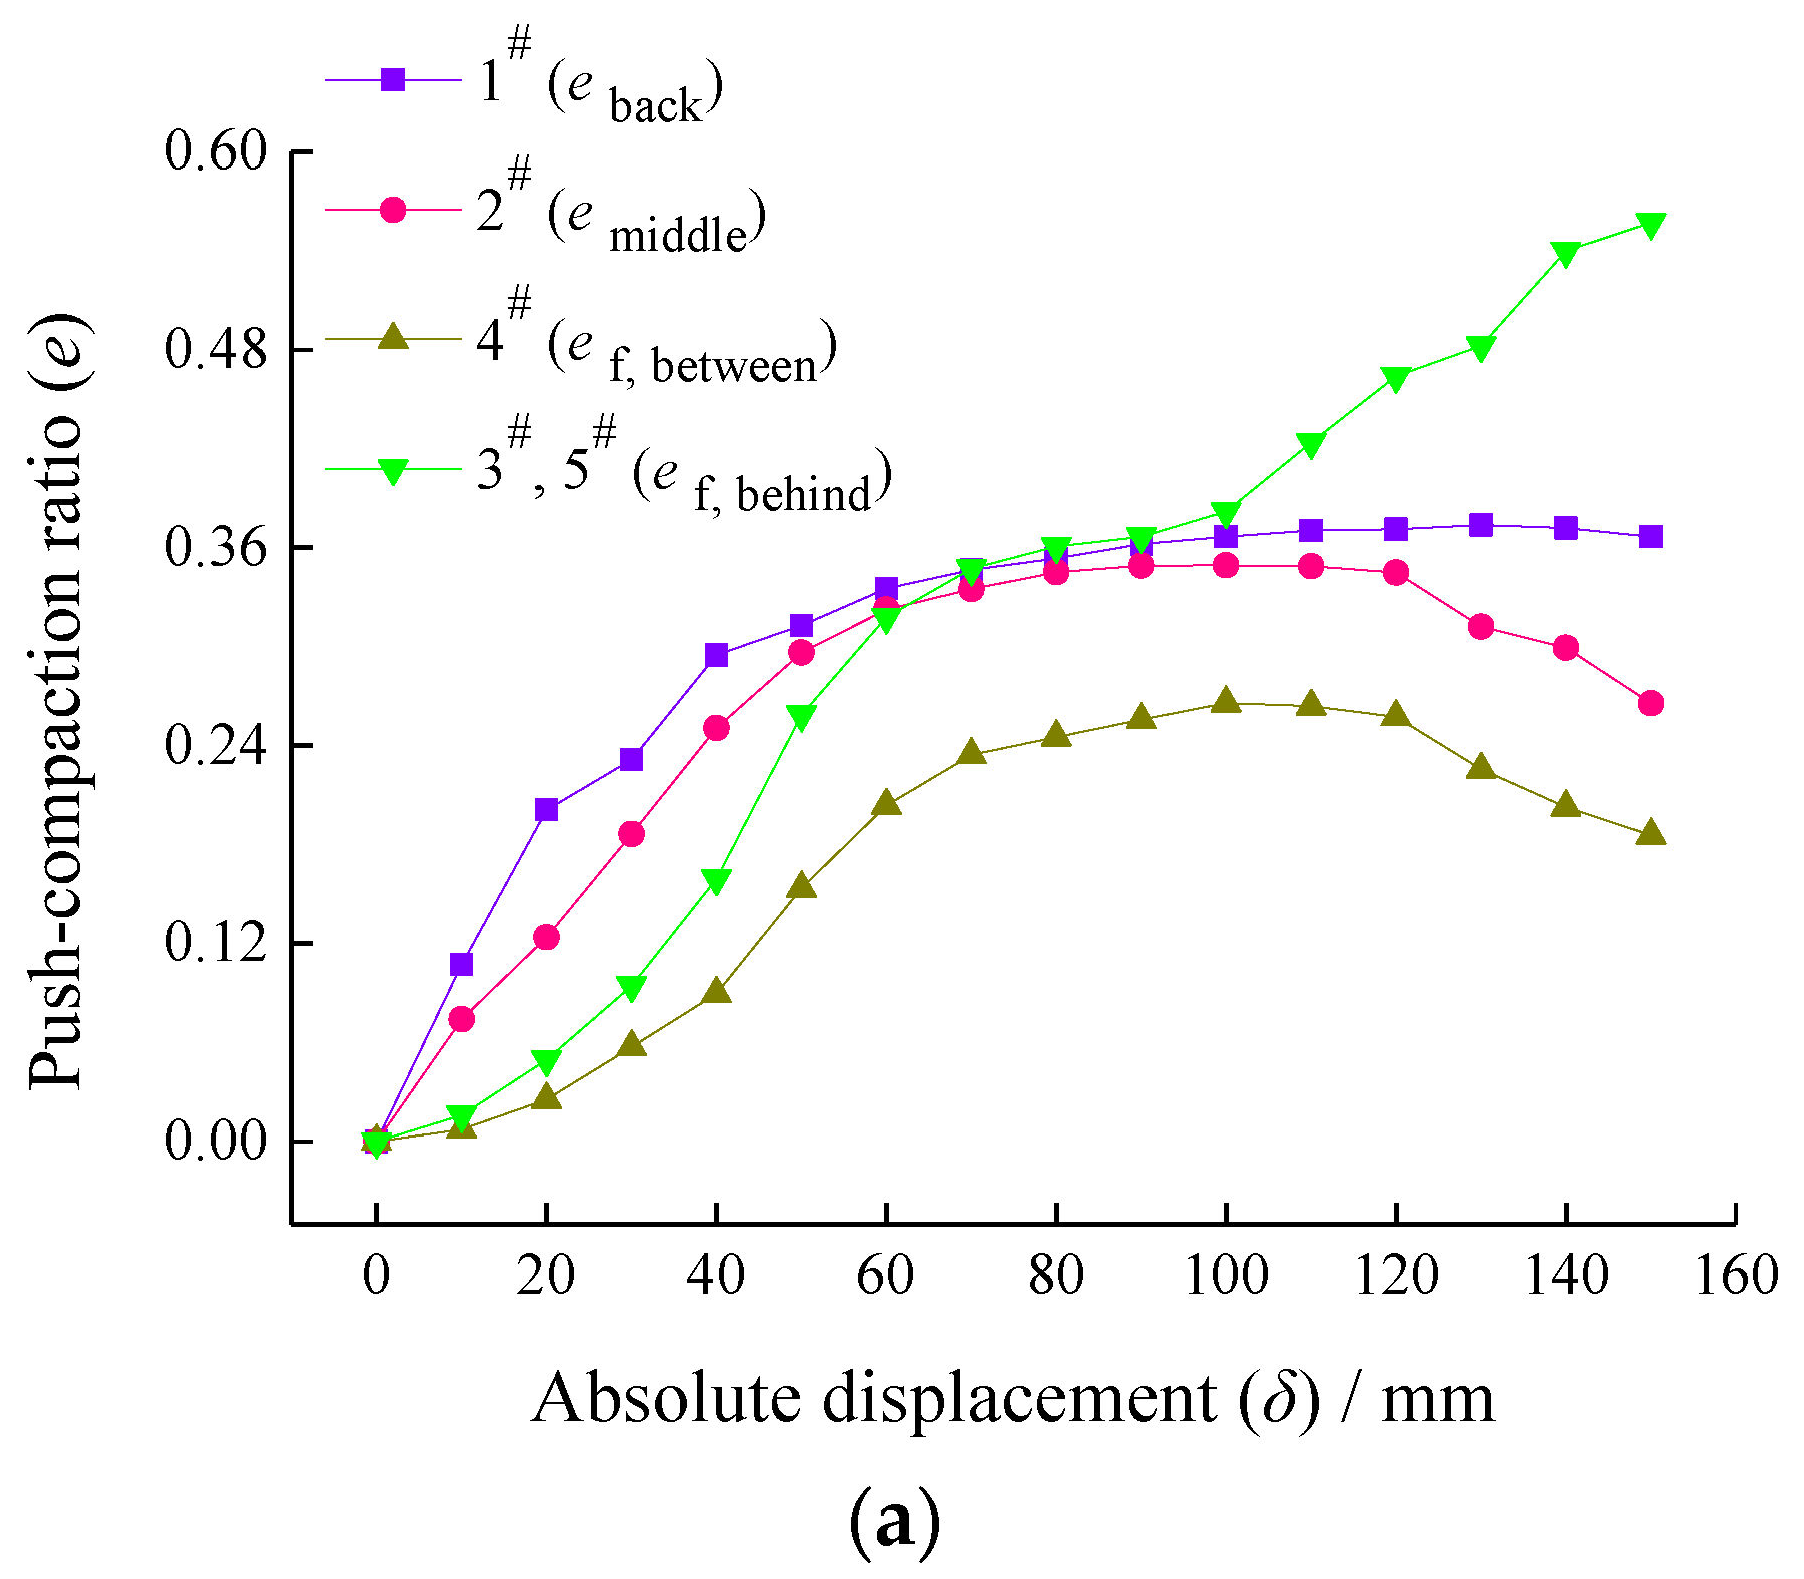
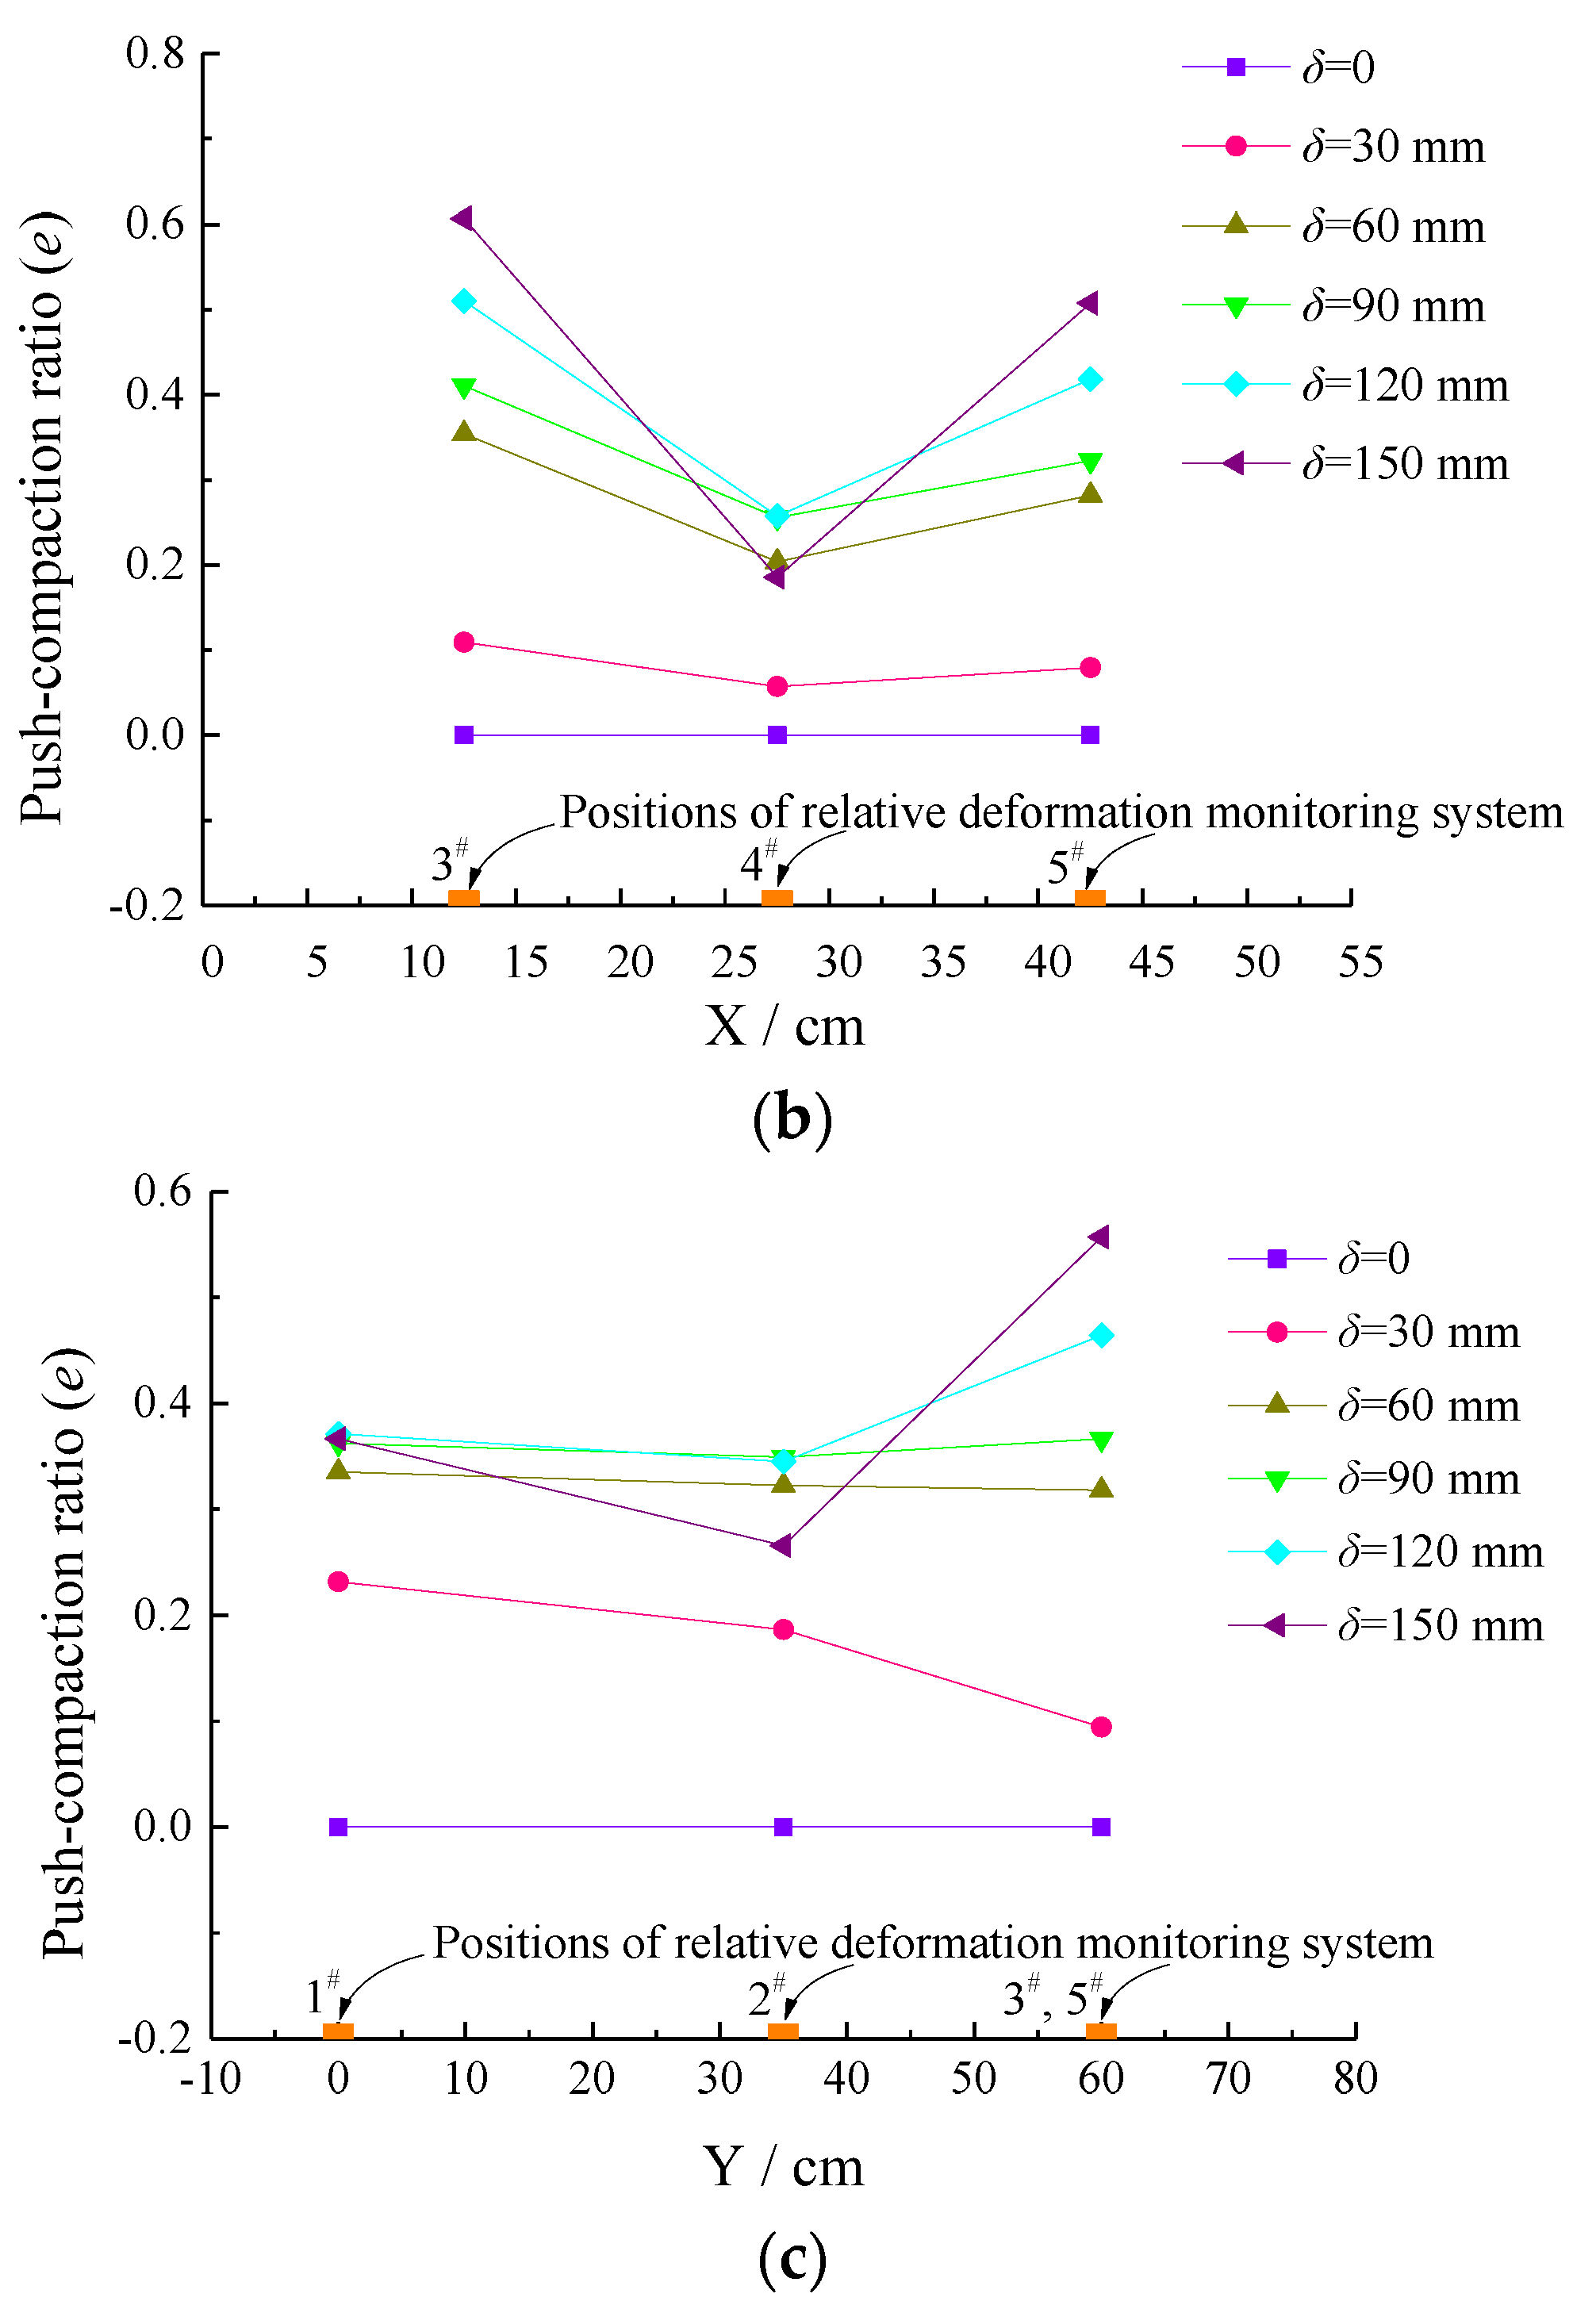
Figure 4.
Variation in t f and geometric features of the zone affected by the soil arch with δ under the condition of L/d = 5: (a) t f − δ curve, (b) local linear cracks at δ = 30 mm, (c) the directions of cracks deflect obviously at δ = 90 mm, (d) failure of layered soil arch at δ = 120 mm, and (e) spalling of layered soil arch at δ = 140 mm.
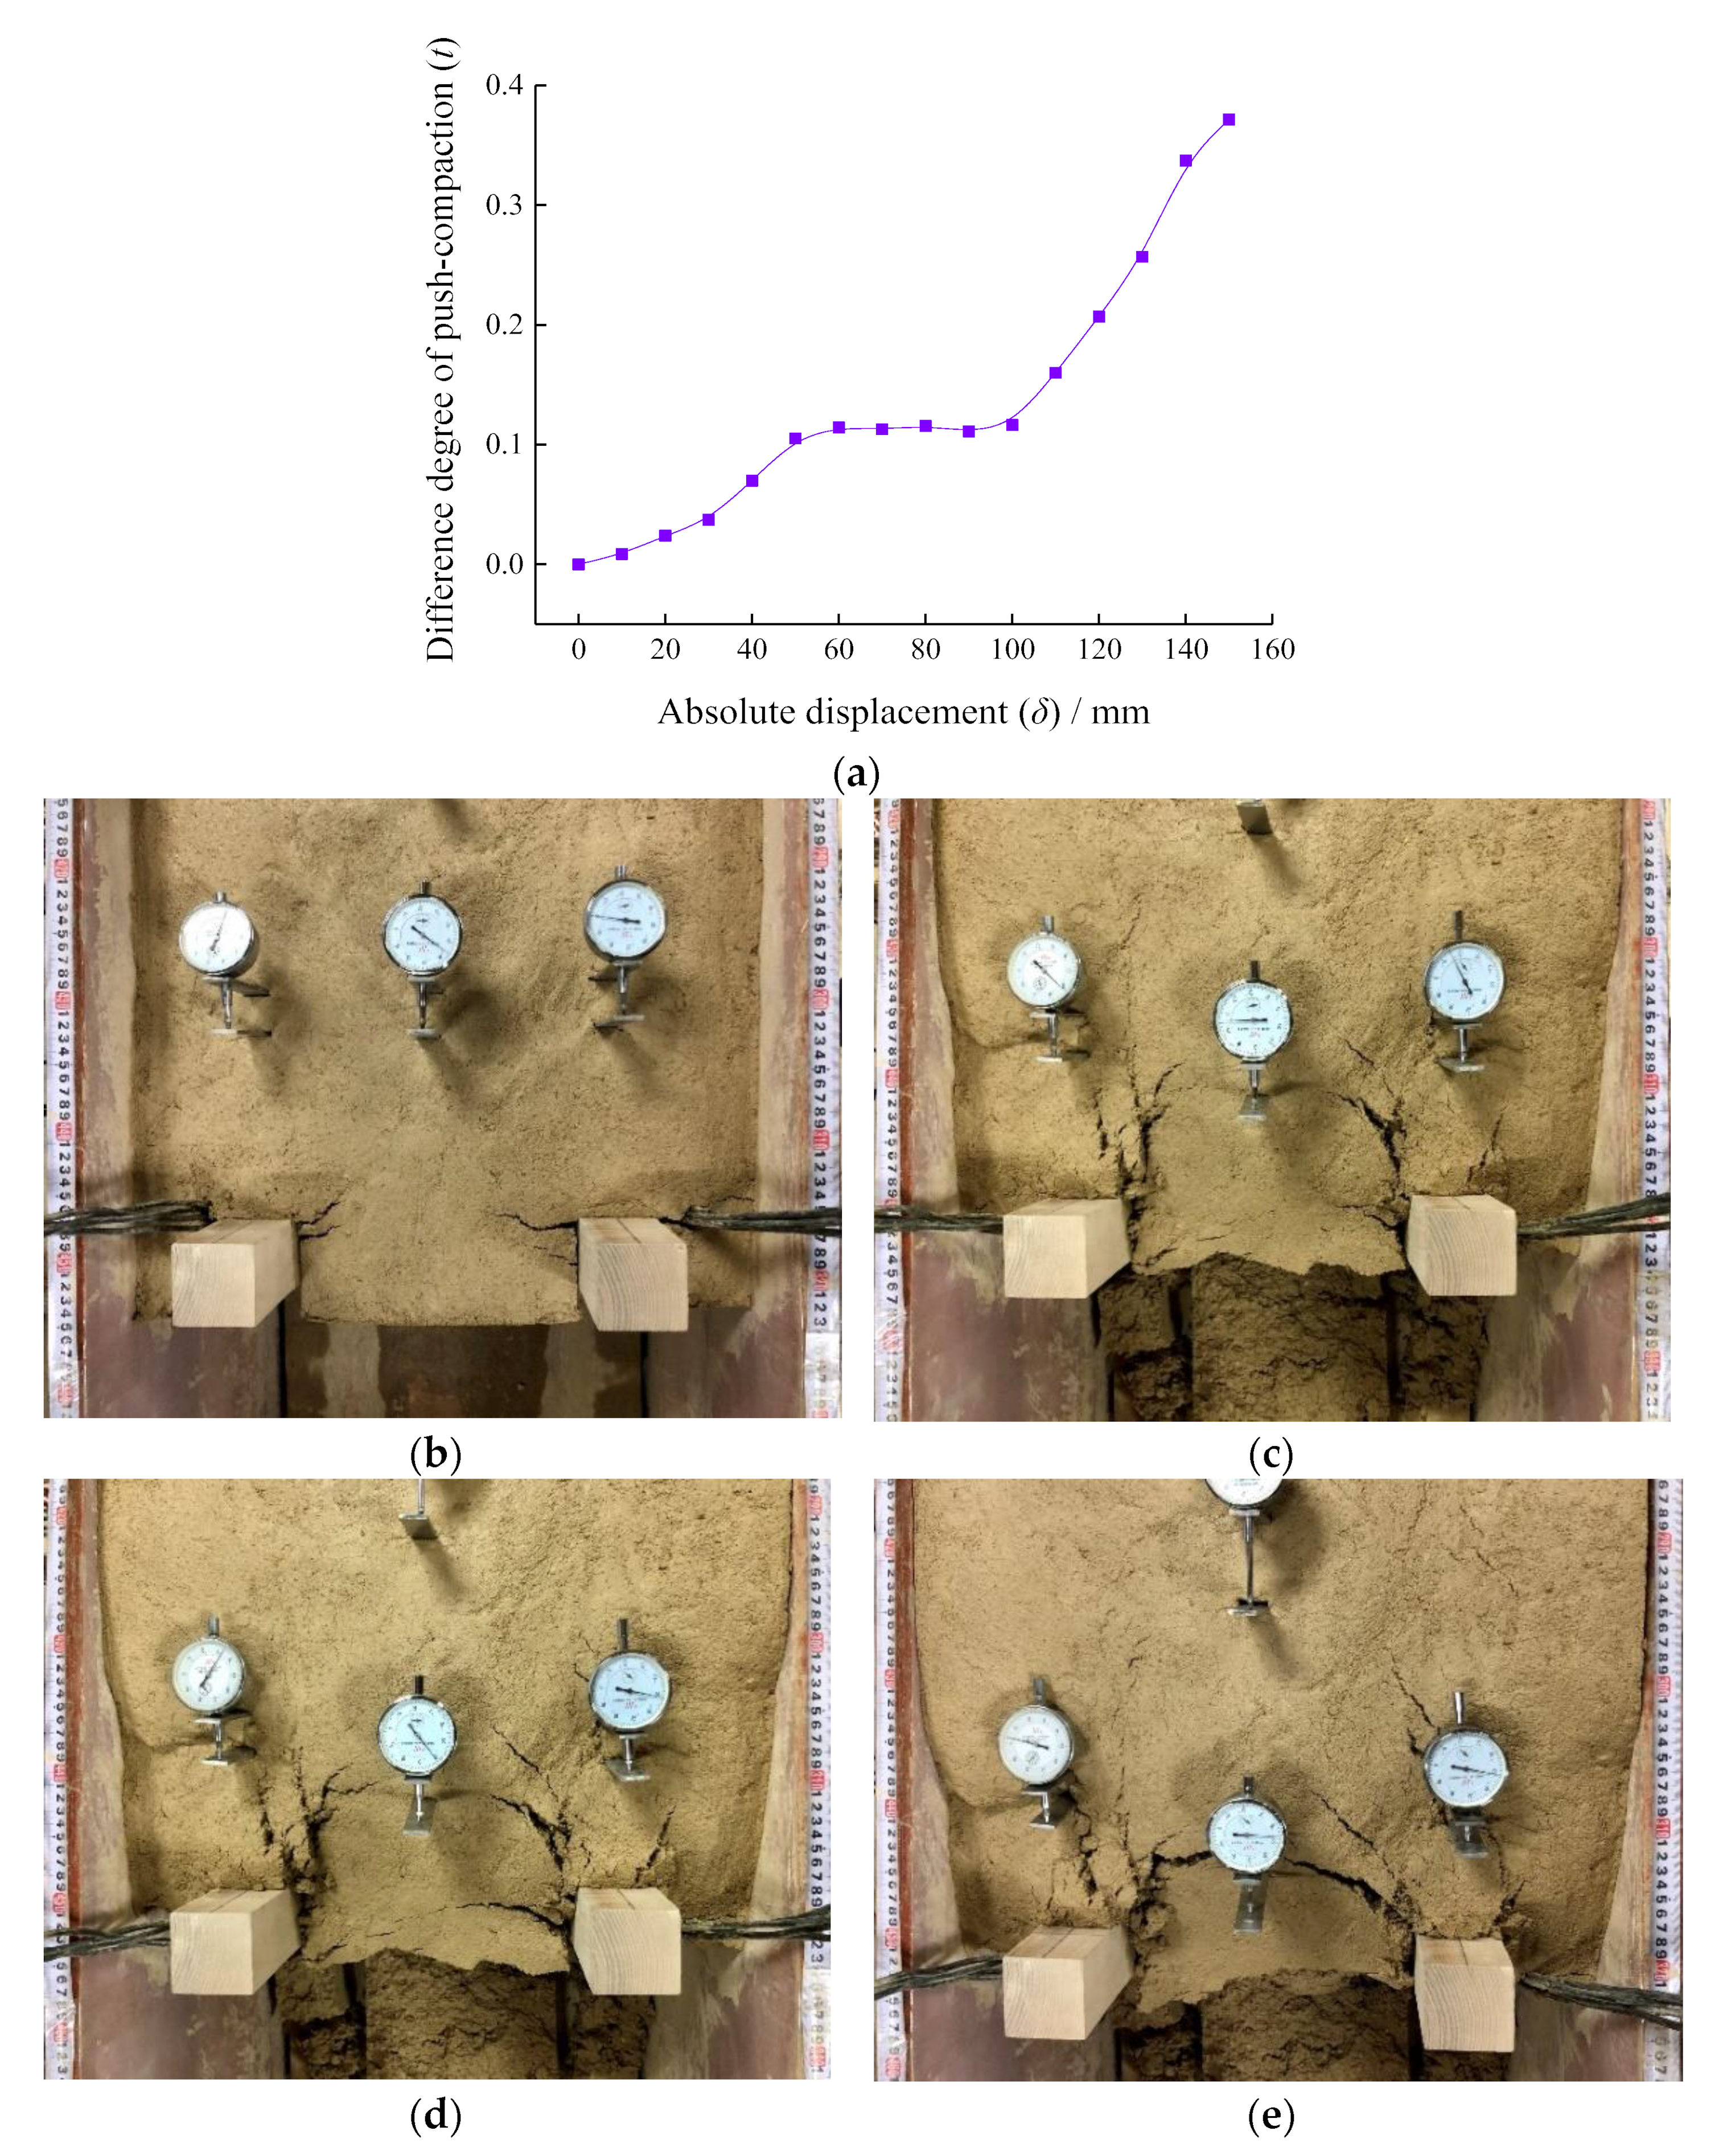
Figure 5.
Variation in the lateral pressure (p) behind piles with absolute displacement (δ) under the condition of L/d = 5.
Figure 5.
Variation in the lateral pressure (p) behind piles with absolute displacement (δ) under the condition of L/d = 5.
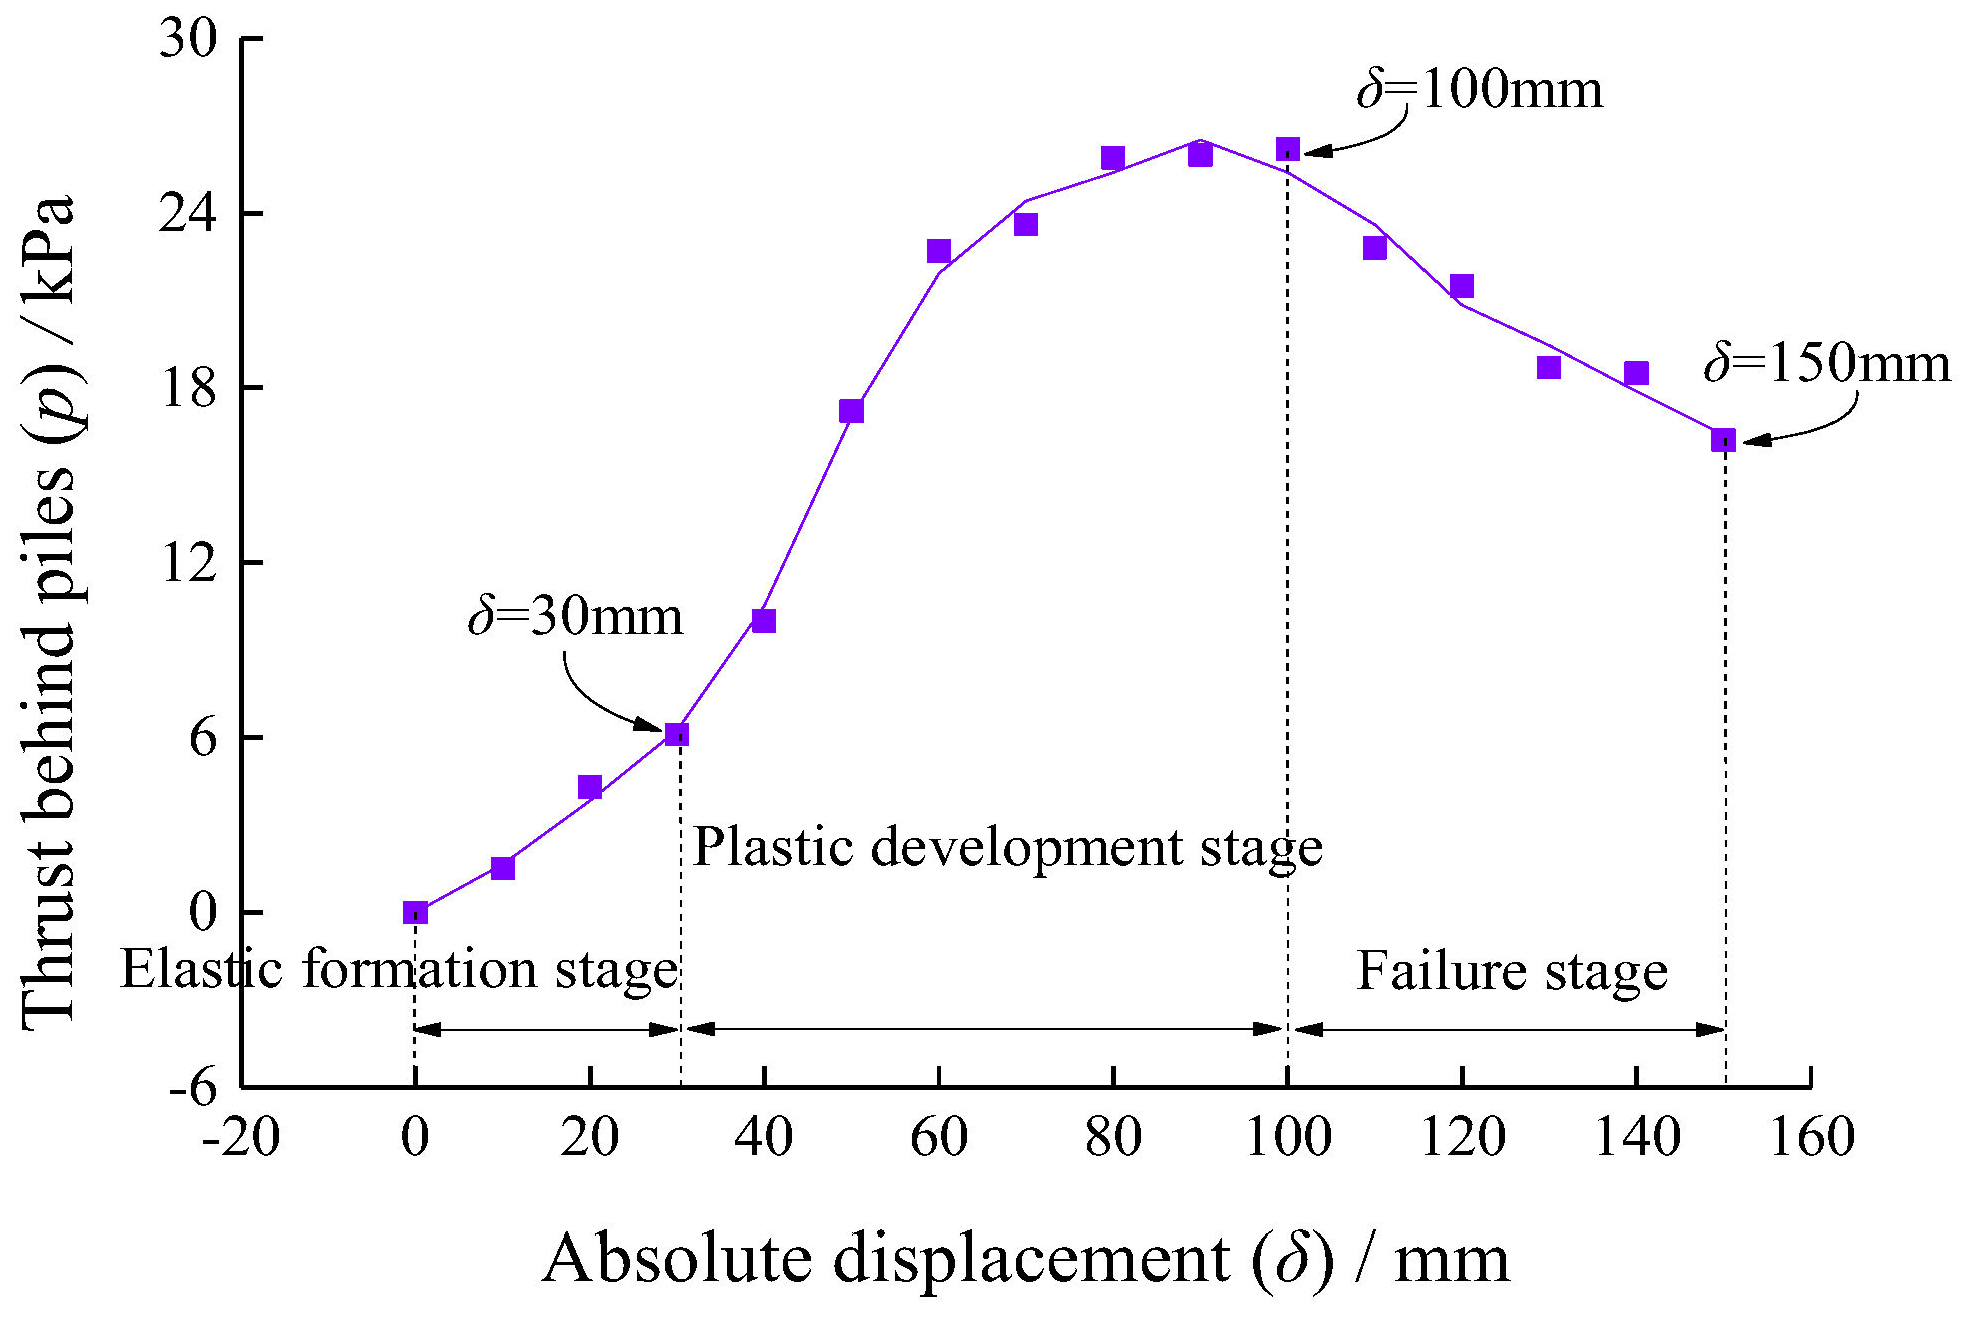
Figure 6.
Failure characteristics of the soil around anti-slide piles: (a) local linear cracks appeared and developed rapidly backward when δ = 30 mm under the condition of L/d = 7; (b) shear failure in the top of soil arching when δ = 120 mm under the condition of L/d = 4; (c) failure characteristics in a vertical plane when δ = 140 mm under the condition of L/d = 5; (d) swelling and bulging of the top sliding body when δ = 150 mm under the condition of L/d = 5; and (e) numerical simulation results of the failure characteristics of a soil arching of anti-slide piles (modified from Wang et al. [32]).
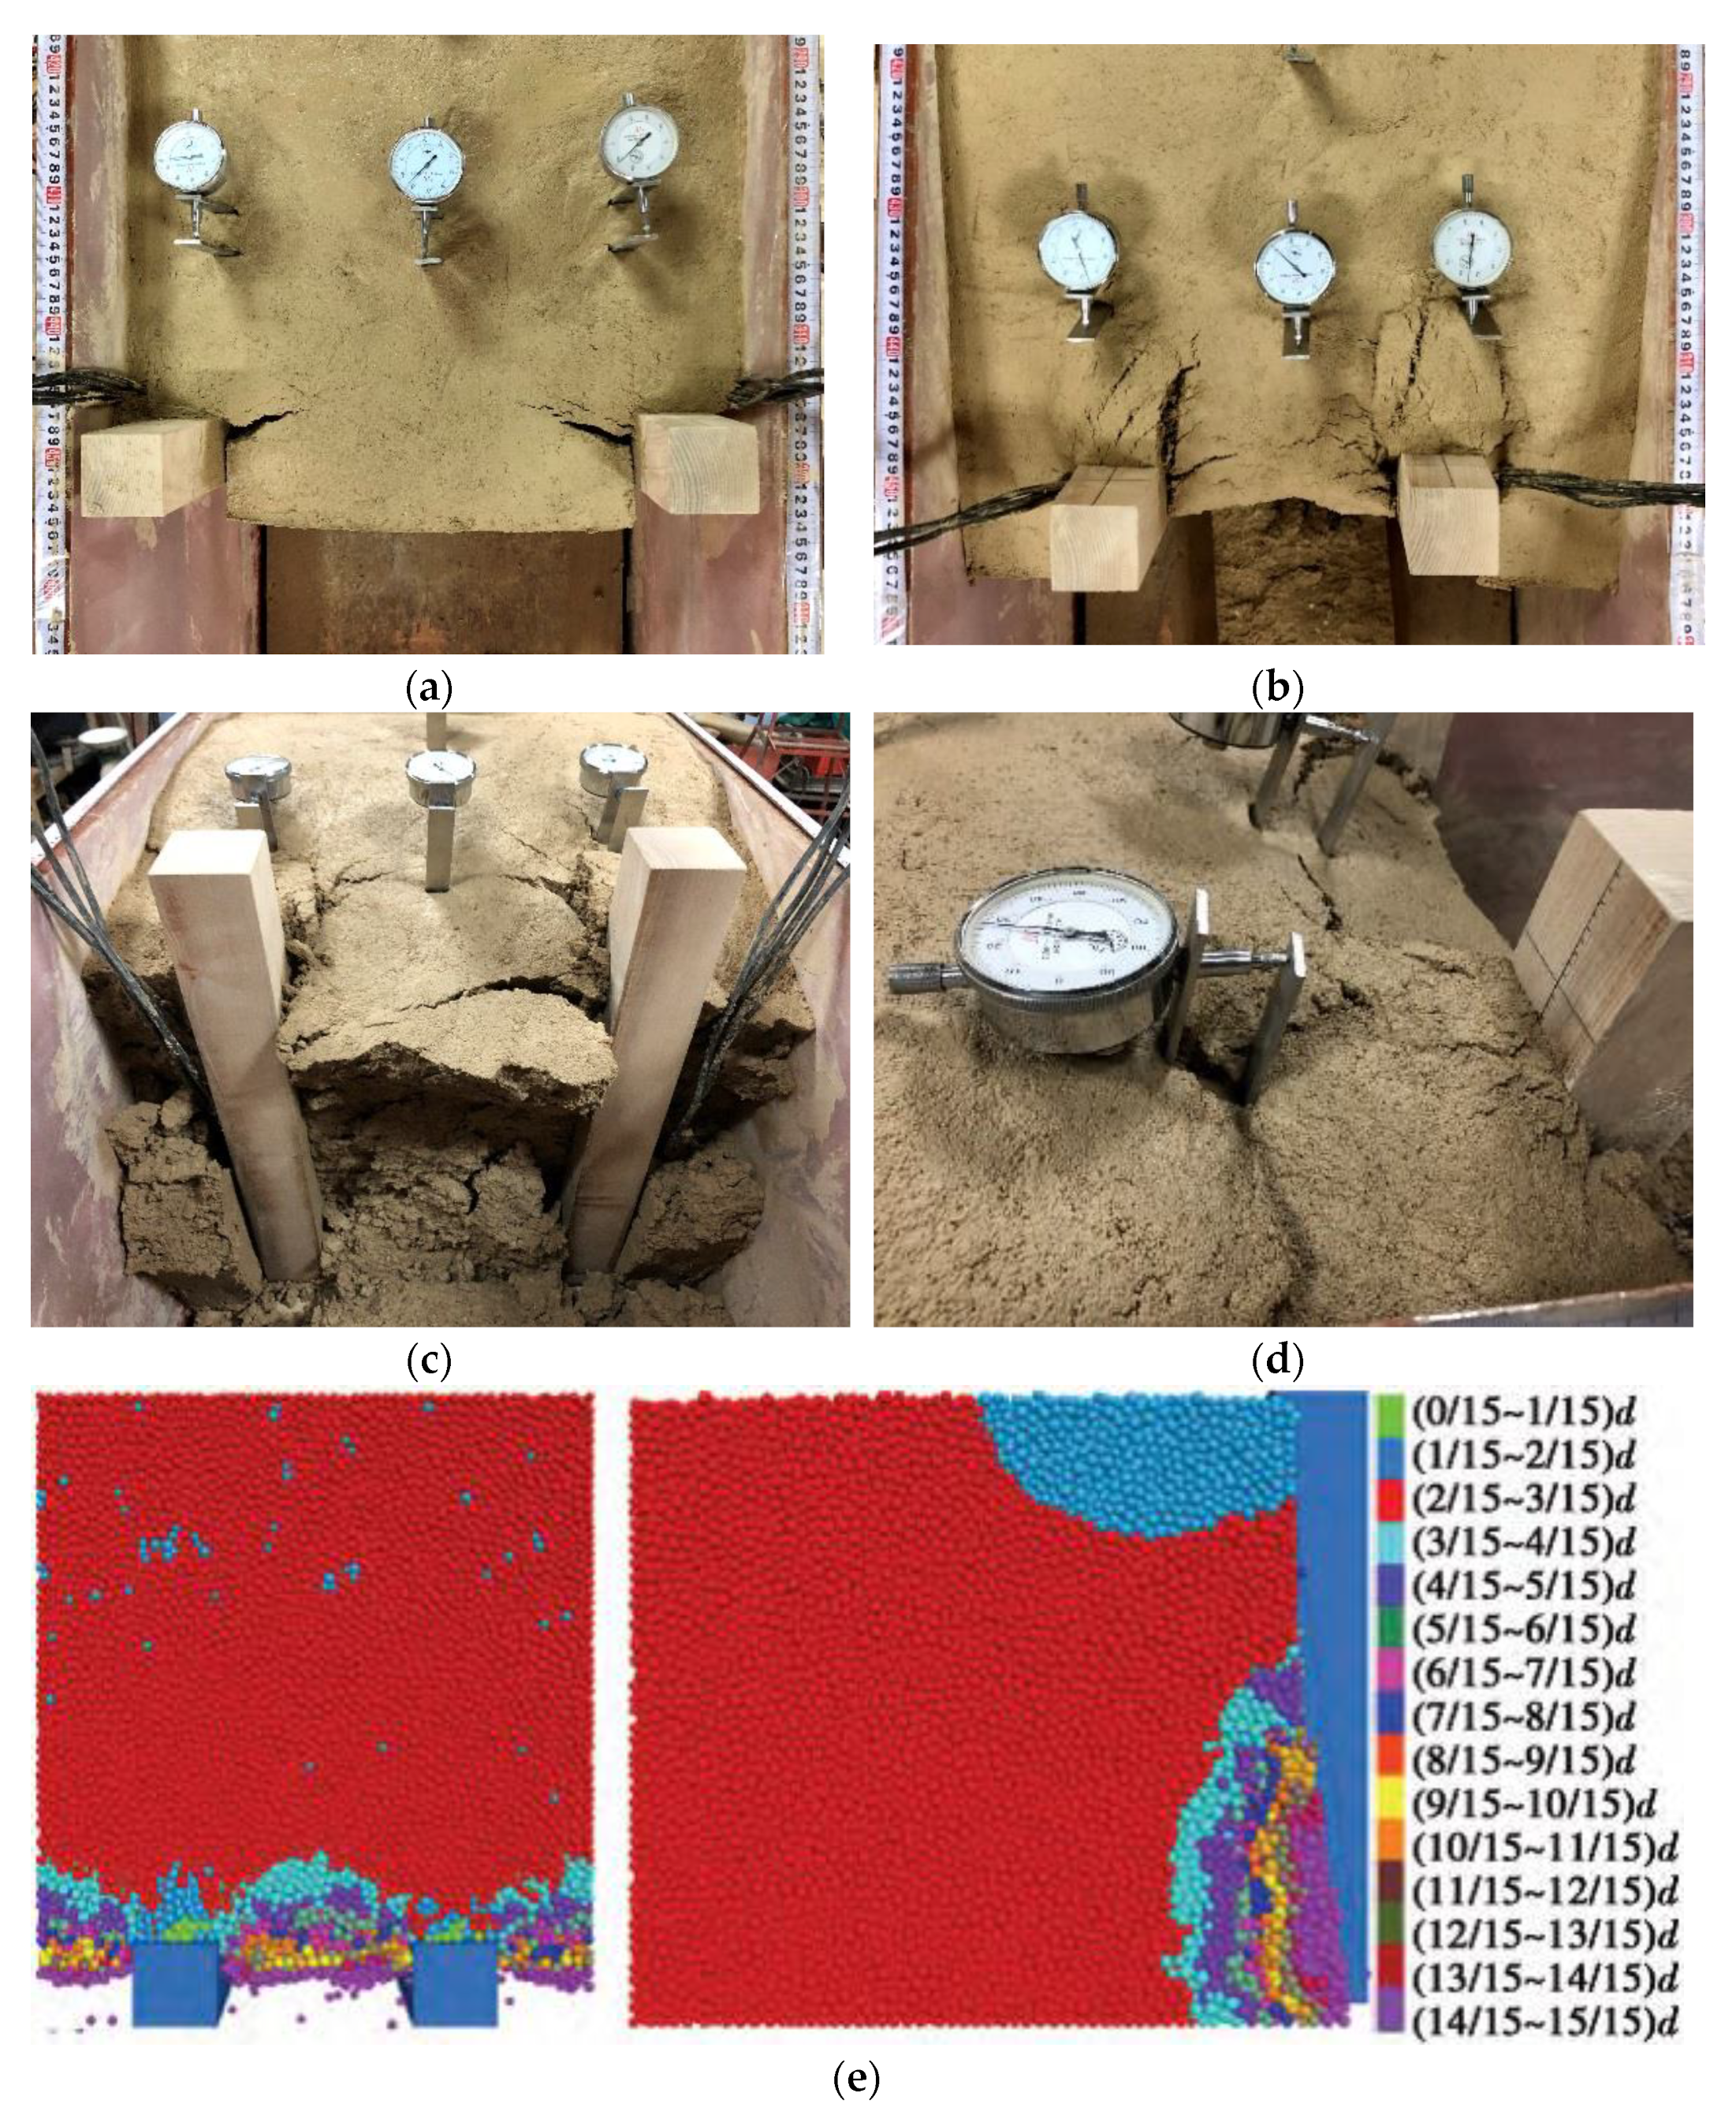
Figure 7.
ZJ quadruplex strain-controlled direct shear apparatus.
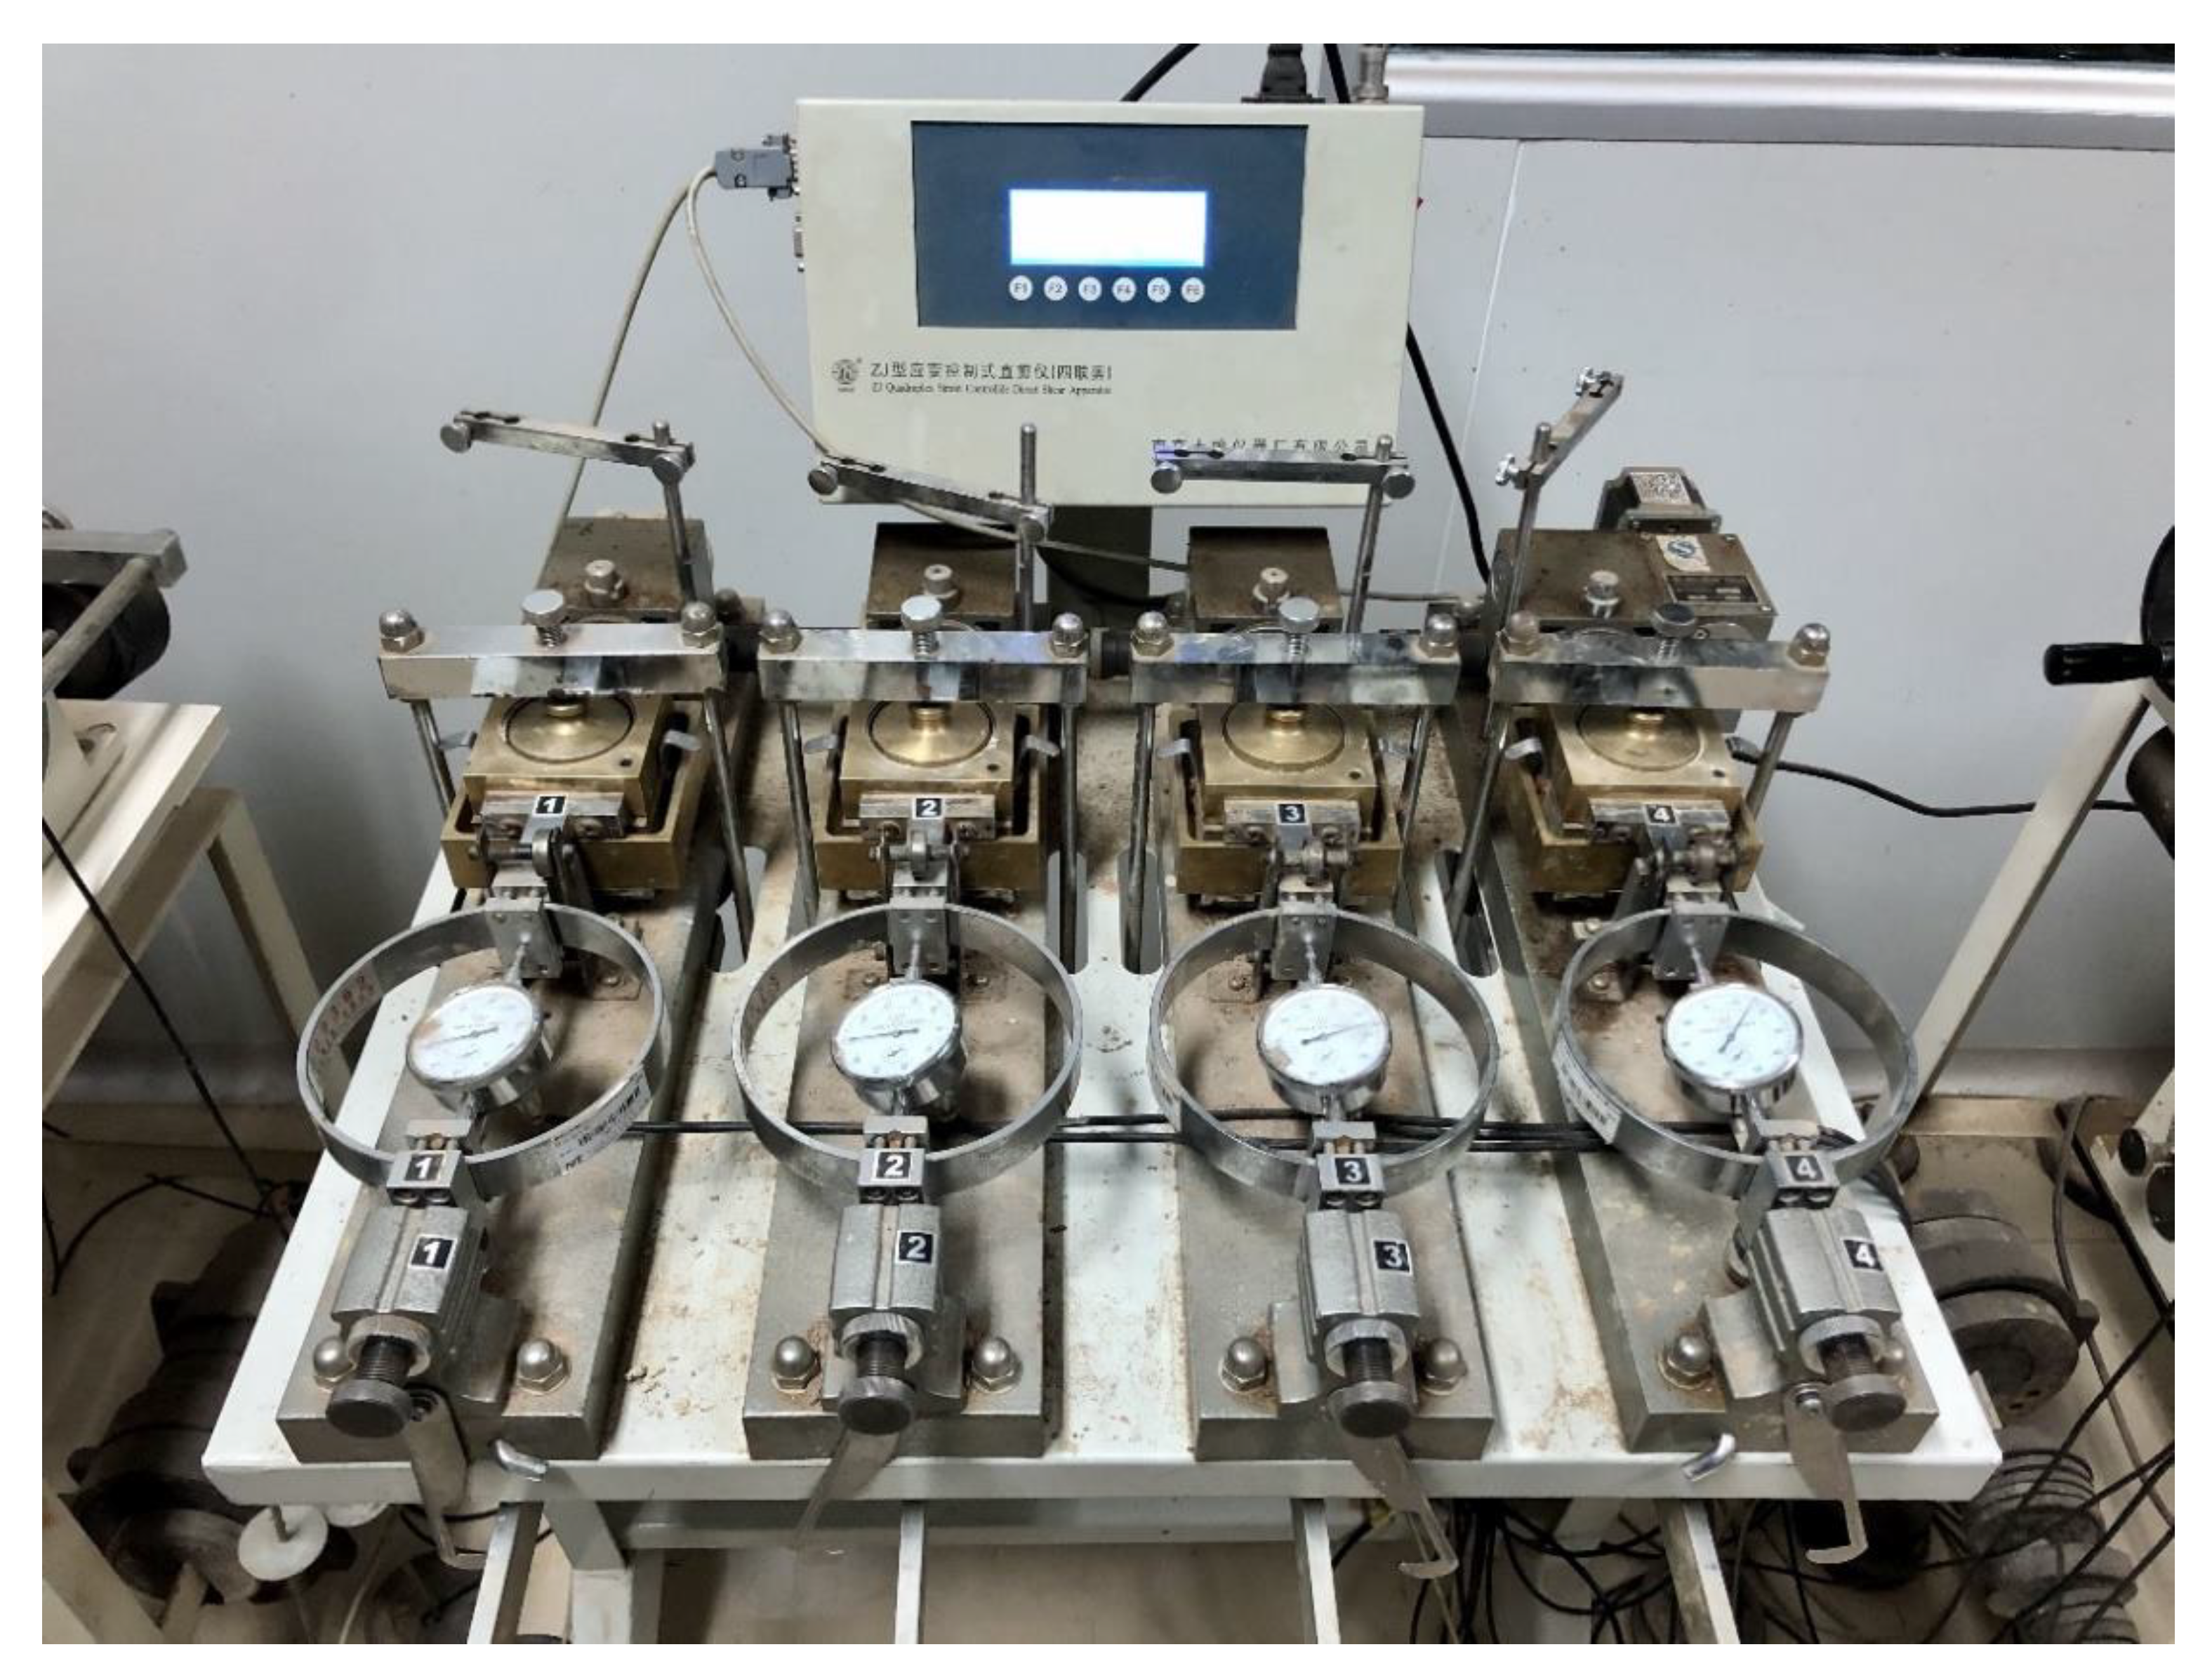
Figure 8.
The relationship between shear strength parameters of sliding soil and push–compaction ratio: (a) c–e curve and (b) φ–e curve.
Figure 8.
The relationship between shear strength parameters of sliding soil and push–compaction ratio: (a) c–e curve and (b) φ–e curve.

Figure 9.
Schematic diagram of sliding body deformation before the first push–compaction balance.
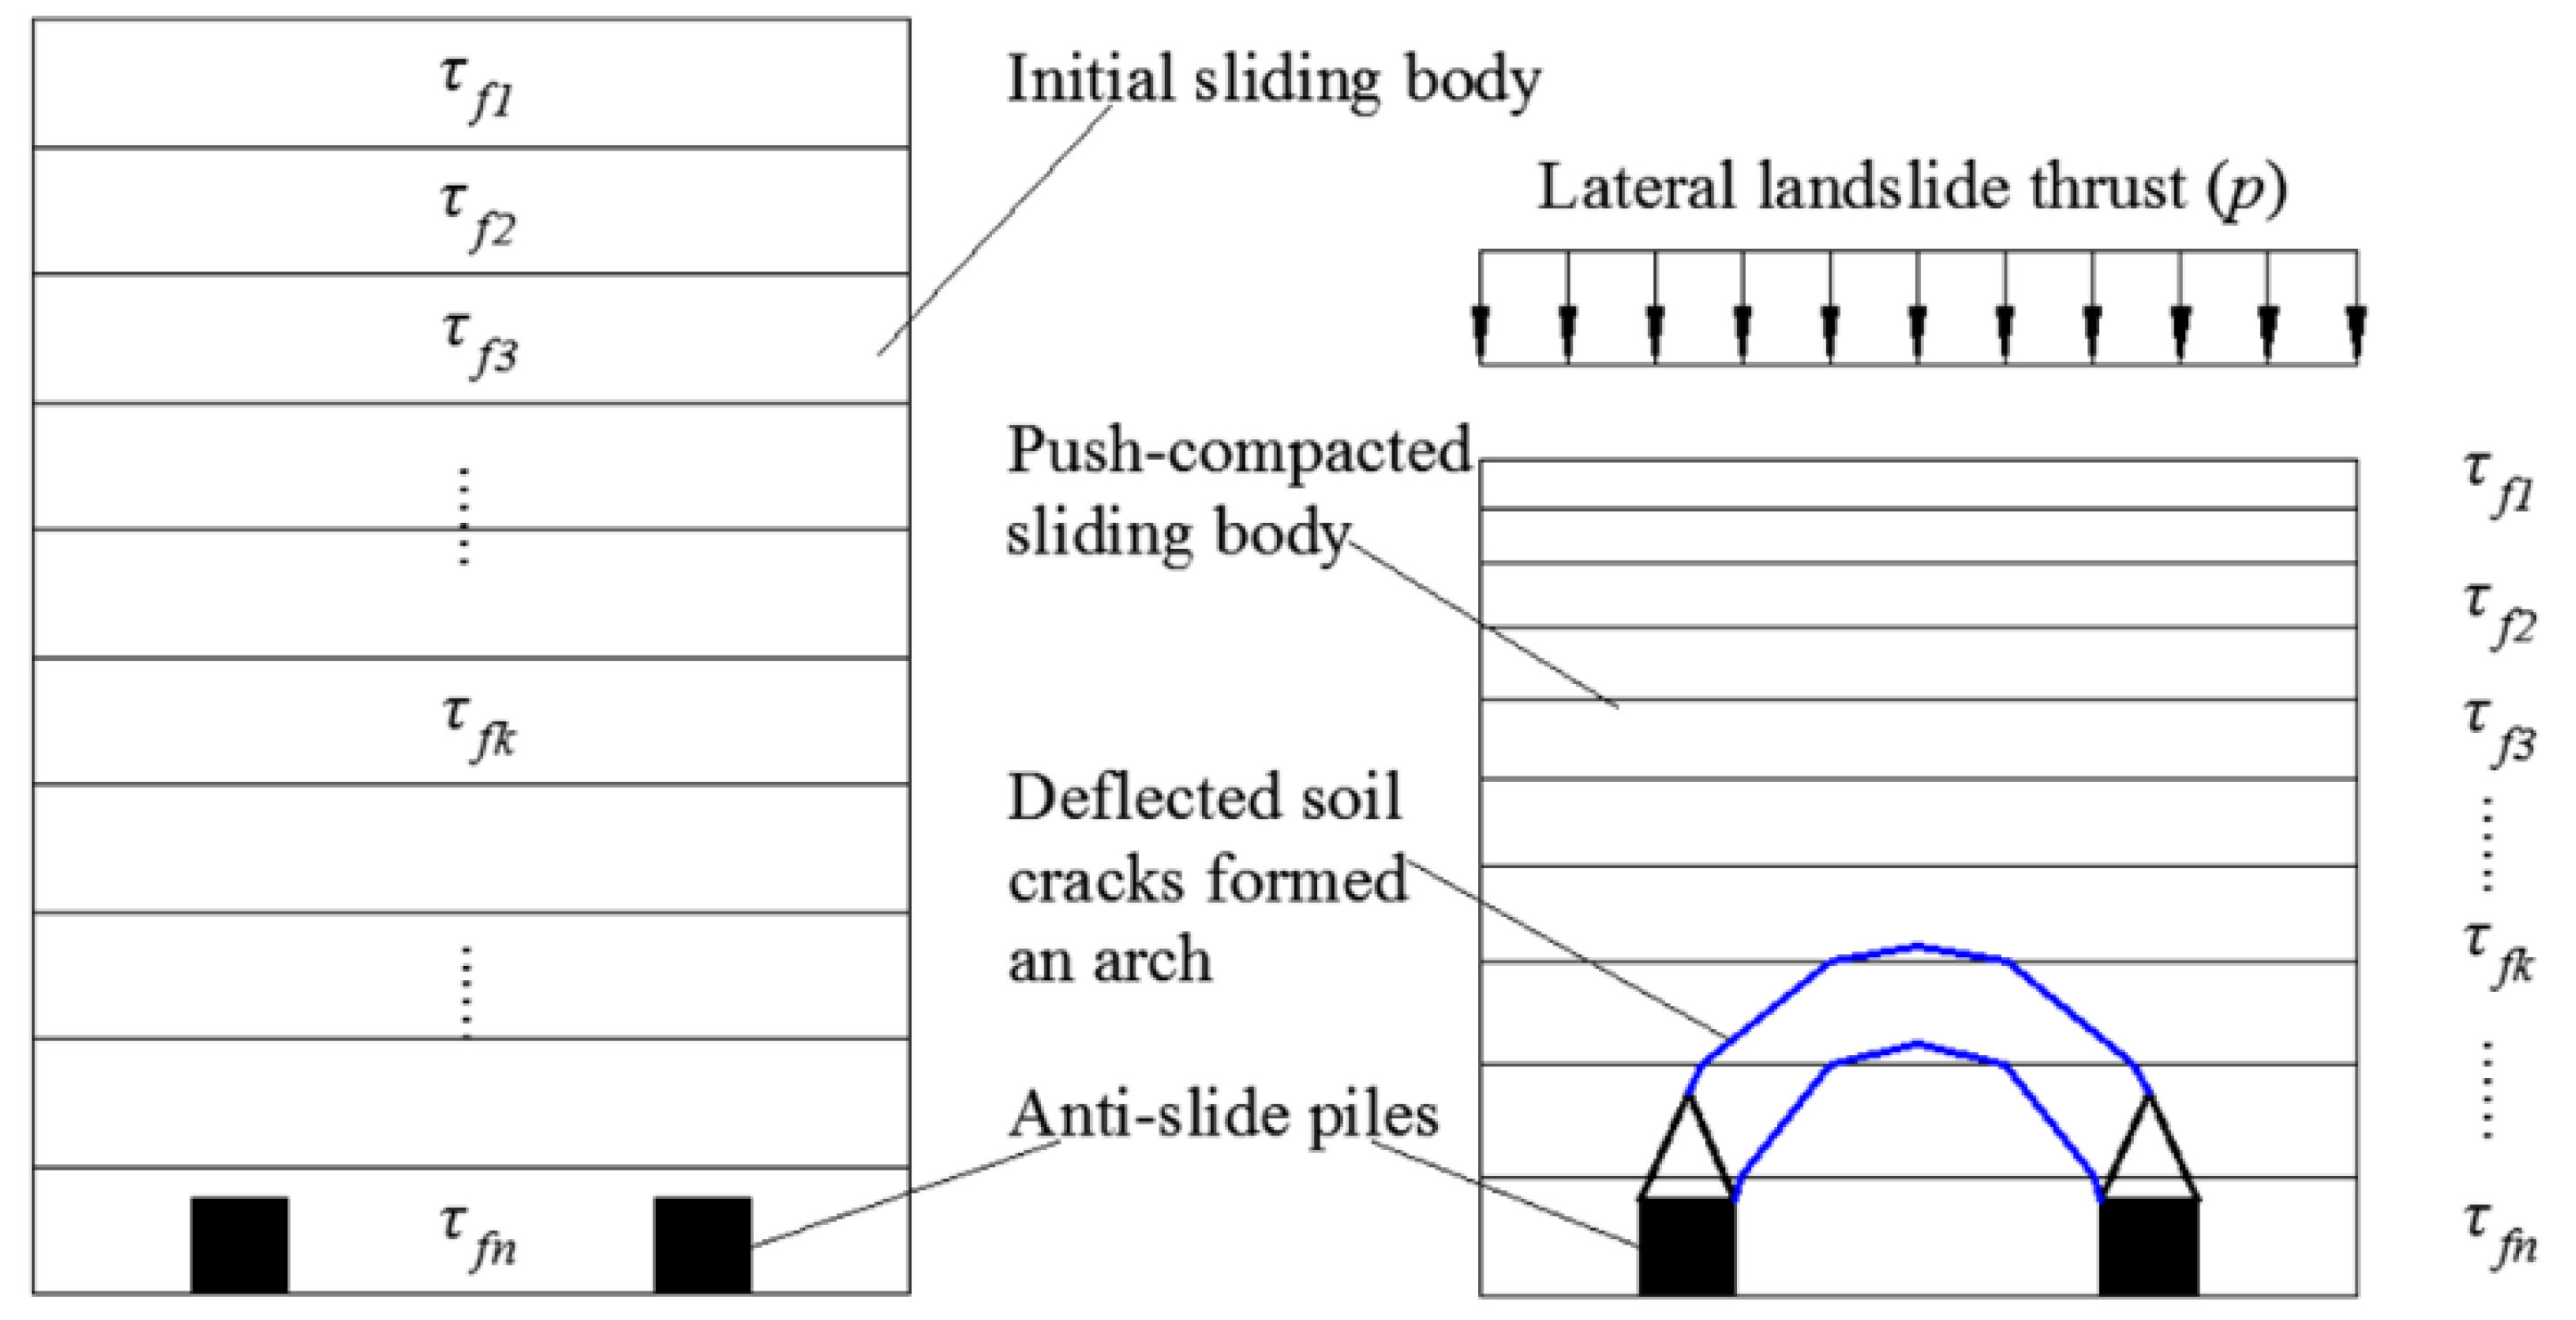
Figure 10.
Relationship between various parameters and pile spacing: (a) the changing curve of e f, between and t u with L/d when soil arch fails for the first time; (b) the variation in the thrust behind pile under different pile spacings when soil arch failed for the first time and the slope finally collapsed.

Table 1.
Proportions of synthetic soil material.
| Material | Proportion by Mass? (%) | |
|---|---|---|
| 1 | Barite grains | 17.34 |
| 2 | Silty clay | 58.40 |
| 3 | Mixed sand | 16.06 |
| 4 | Washing powder | 1.98 |
| 5 | Talcum powder | 6.22 |
Table 2.
Shear strength parameters of soil.
| Characteristic | Value | |
|---|---|---|
| 1 | Unit weight, γ (kN/m3) | 19.5 |
| 2 | Cohesion, c (kPa) | 11.44 |
| 3 | Friction angle, φ (°) | 32.89 |
| 4 | Poisson ratio, μ | 0.26 |
| 5 | Elastic modulus, E (kPa) | 31,058 |
Publisher’s Note: MDPI stays neutral with regard to jurisdictional claims in published maps and institutional affiliations. |
© 2022 by the authors. Licensee MDPI, Basel, Switzerland. This article is an open access article distributed under the terms and conditions of the Creative Commons Attribution (CC BY) license (https://creativecommons.org/licenses/by/4.0/).
Share and Cite
MDPI and ACS Style
Zhong, W.; Zhang, S.; He, N. An Experimental Study on the Dynamic Evolution Characteristics of Soil Arching and the Rational Spacing of Anti-Slide Piles. Sustainability 2022, 14, 8566. https://doi.org/10.3390/su14148566
AMA Style
Zhong W, Zhang S, He N. An Experimental Study on the Dynamic Evolution Characteristics of Soil Arching and the Rational Spacing of Anti-Slide Piles. Sustainability. 2022; 14(14):8566. https://doi.org/10.3390/su14148566
Chicago/Turabian StyleZhong, Wei, Shuai Zhang, and Na He. 2022. "An Experimental Study on the Dynamic Evolution Characteristics of Soil Arching and the Rational Spacing of Anti-Slide Piles" Sustainability 14, no. 14: 8566. https://doi.org/10.3390/su14148566
Note that from the first issue of 2016, this journal uses article numbers instead of page numbers. See further details here.