Article

Valorization of Coffee Silverskin through Subcritical Water Extraction: An Optimization Based on T-CQA Using Response Surface Methodology

by
Agita Rachmala Ginting
1,
Thavy Kit
1,
Withawat Mingvanish
1 and
Sudtida Pliankarom Thanasupsin
1,2,*
1
Department of Chemistry, Faculty of Science, King Mongkut’s University of Technology Thonburi, Bangkok 10140, Thailand
2
Chemistry for Green Society and Healthy Living Research Unit, Faculty of Science, King Mongkut’s University of Technology Thonburi, Bangkok 10140, Thailand
*
Author to whom correspondence should be addressed.
Sustainability 2022, 14(14), 8435; https://doi.org/10.3390/su14148435
Submission received: 8 June 2022 / Revised: 4 July 2022 / Accepted: 7 July 2022 / Published: 10 July 2022
(This article belongs to the Special Issue Biomass Resource Utilization)

Abstract

:
Coffee silverskin (CS) is the only byproduct of the roasting process for coffee beans and is rich in phenolic compounds with various bioactivities. This study proposes a valorization option for bioactive compounds (T-CQA) based on a subcritical water extraction (SWE) technique, which is known for its high efficiency and feasibility for use on an industrial scale. The use of water as a sole solvent requires a minimum number of cleaning steps and renders the extract safe for further applications, such as in either the cosmetic or food industry. Response surface methodology with a Box–Behnken design is effectively used to optimize and explain the individual and interactive process variables (i.e., extraction temperature, extraction time, and solid–liquid ratio) on the T-CQA content obtained from coffee silverskin by the SWE technique. The final model exhibits a precise prediction of the experimental data obtained for the maximum T-CQA content. Under the optimum conditions, the CS extract is found to contain a higher content of T-CQA and TPC than that reported previously. For antioxidant activity, up to 26.12 ± 3.27 mg Trolox equivalent/g CS is obtained.

1. Introduction

In early 2021, world coffee consumption was 166,346,000 × 60 kg bags. This amount increased from 2020 by 1.1% [1]. Thailand is a coffee-exporting country with a capacity of 13,174 tons (or 219,565 × 60 kg bags) in the crop year 2020/2021 [2]. The coffee-processing industry produces large quantities of waste and byproducts (e.g., coffee pulp and husk, coffee silverskin (CS), and spent coffee grounds (SCG)) [3]. The waste and byproducts require proper waste management before disposal in landfills [4,5]. Coffee roasting is a fast-growing industry in Thailand. Domestic consumption increased from 36,000 tons in 2008 to 84,000 tons in 2018 [6]. Coffee silverskin is the only byproduct of the coffee roasting process. It is composed of a thin layer of spermoderm or testa (silverskin) covering the endosperm (coffee beans) [7,8,9]. The CS is approximately 4.2% w/w of the green coffee beans [9,10]. Generally, coffee wastes (i.e., CS and SCG) are recycled in the form of energy due to their high carbon content, low moisture content, and ash content. Other final uses for these wastes are soil amendment and fertilizer [3,11]. However, CS is rich in phenolic compounds that account for various bioactivities, such as antioxidant, antiviral, antiaging, anticarcinogenic, and antimycotoxigenic activities [9,12,13,14,15,16,17,18,19]. Bioactive compounds in the CS water extract are composed of two major groups, i.e., alkaloids and polyphenols. Caffeine and chlorogenic acids (CGAs), especially caffeoylquinic acids (CQA), are the most abundant alkaloids and phenolic acids, respectively [20]. Chlorogenic acid (CGA) is the ester of caffeic acids and quinic acids. There are three main subgroups of CGA: caffeoylquinic acid, di-caffeoylquinic acid, and feruloylquinic acid [21]. The most abundant CGA isomers in coffee silverskin are 3-caffeoylquinic acid (3-CQA), 4-caffeoylquinic acid (4-CQA), and 5-caffeoylquinic acid (5-CQA) [14]. CGA is also known for its potential biological effects, i.e., anti-inflammatory, antibacterial, antiviral, and antitumor activities [12,15,22,23,24,25,26,27,28]. Coffee silverskin of robusta and arabica green coffee beans contains approximately 1–6% dry weight of CGA [9,12]. Based on this, valorization of CS to higher-value products or chemicals is crucial to achieving sustainable waste management and promoting the biobased economy. The trend toward utilizing agro-industrial byproducts as a source of natural antioxidants to replace synthetic chemicals for various industries, e.g., the pharmaceutical, cosmetics, and food industries, requires further investigation.
Concerning the extraction step, maceration is one of the conventional extraction methods used to recover wide arrays of bioactive compounds. However, the disadvantages of the maceration technique often include the high costs associated with the use of high solvent purity and a large amount of solvent, which limits its use for thermolabile component extraction and the requirement of a long extraction time, so this method is considered inefficient [29]. The significant drawbacks of the conventional method have encouraged researchers to find proper, efficient, and environmentally friendly methods to recover bioactive compounds. In recent years, many researchers have investigated various extraction methods to recuperate bioactive compounds from CS [11,17,30,31,32]. The hydrothermal method, both under supercritical and subcritical water extraction conditions, is known for its high efficiency and feasibility for use on an industrial scale [33]. Extraction of phenolic compounds by the hydrothermal method also reveals another benefit in the way that it uses water as a sole solvent. This makes the extract safe for further application and requires a minimum number of cleaning steps. The extraction of phenolic compounds from SCG and CS has been studied using mild hydrothermal pretreatment conditions [34]. Later, in 2019, the mild hydrothermal pretreatment of CS based on total phenolic content (TPC) was investigated [35]. However, optimization of the subcritical water extraction (SWE) of coffee silverskins based on chlorogenic acid content (T-CQA) has not yet been studied. Hence, this study aimed to determine the optimal operating conditions to achieve maximum chlorogenic acids from CS by using SWE. The antioxidant activities of CS crude extract obtained from the optimum conditions were also evaluated.

2. Materials and Methods

2.1. Materials

The CS samples used in this study were provided by a coffee roasting company, Samutr Songkaram, Thailand. Upon arrival, the moisture content of the CS samples was analyzed using a moisture analyzer balance (Sartorius MA35, Göttingen, Germany). The moisture content of the CS samples was 9.45 ± 0.52%. The samples were pulverized by using a house blender and sieved to sizes ranging from 150 to 500 µm. The pulverized samples were kept in plastic zip-locked bags and stored in a refrigerator at −20 °C prior to further experiments.

2.2. Chemicals and Reagents

The chemicals, including (±)6-hydroxy-2,5,7,8-tetra-methylchromane-2-carboxylic acid (Trolox, C14H18O4), 4-(dimethylamino) benzaldehyde (4-[(CH3)2N] C6H4CHO), 5-methylphenazinium methyl sulfate (C13H11N2·CH3SO4), and 7,8-dimethyl-10-[(2S,3S,4R)-2,3,4,5-tetrahydroxypentyl]benzo[g]pteridine-2,4-dione (riboflavin, C17H20N4O6), were purchased from Sigma Aldrich (Singapore). 1,1-diphenyl-2-picrylhydrazyl free radical (>97% DPPH assay, C18H12N5O6) and 5-O-(trans-3,4-dihydroxycinnamoyl)-D-quinic acid (neochlorogenic acid, C16H18O9) were purchased from Tokyo Chemical Industry (Tokyo, Japan). 3-(3,4-Dihydroxycinnamoyl quinic acid (chlorogenic acid, C16H18O9) was purchased from Alfa Aesar Thermo Fisher Scientific Chemicals (Waltham, MA, USA). The solvents used for the chromatographic measurement of the target compounds were of HPLC grade. All other chemicals were of analytical grade.

2.3. Extraction Procedure

The flow diagram indicating the extraction method, quantification of the bioactive compounds, and in vitro analysis of coffee silverskin is shown in Figure 1. The subcritical water extraction (SWE) was conducted using a 1 L batch reactor (Amar equipment high-pressure lab-scale autoclave, Mumbai, India). The SWEs were carried out at a temperature ranging from 120 to 240 °C, an extraction time from 10 to 60 min, and a solid-to-liquid ratio (S/L) from 1:10 to 1:40. After the extraction, the mixed liqueur was filtered through GF/C (Whatman®, Maidstone, UK, qualitative filter paper, Grade 1). The extract after the filtration step was used as a sample for the quantification of TPC and DPPH antioxidant activities. The residues were dried at 103 ± 2 °C for 3 h in an oven for further reaction mass efficiency analysis. During the concentrating step, the filtrate was evaporated by using a rotary evaporator (Bushi, Zug, Switzerland). Then, the extracts were frozen at −80 °C in a prefreezer (Daihan Scientific, Kangwon-do, South Korea) and freeze-dried at −80 °C with a freeze drier (Gold Sim Cellular Science, Miami, FL, USA) [35]. The dried crude extract was lyophilized and used as the sample for further analysis.

2.4. Experimental Design

The experimental designs ordinarily used in response surface methodology are Box–Behnken design (BBD), central composite design (CCD), central composite rotatable design (CCRD), and face central composite design (FCCD) [36]. Multiple linear regression has been analyzed, and a second-order polynomial model has been established according to the following equation [36,37,38]:
Y = β 0 + i = 1 3 β i X i   + i = 1 3 β i i X i 2 + i = 1 2 j = i + 1 3 β i j X i   X j
where Y is the predicted response variable; β0, βi, βii, and βij are the regression coefficients for the intercept, linear, quadratic, and interaction terms, respectively; and Xi and Xj are the independent variables.
BBD is an independent rotatable quadratic design with no embedded factorial or fractional factorial points [36,37]. It has been commonly used for the optimization of plant material extraction processes [39,40,41,42]. In this study, the effects of the three independent variables (i.e., extraction temperature of 120–240 °C, time of 10–60 min, and the solid–liquid ratio of 1:10–1:40 g/mL) on the response (Y) were investigated. Appropriate ranges for the extraction factors were established based on the literature reviews and the capacity of the autoclave reactor. Table 1 shows the input variables and their levels for the BBD. The optimal extraction conditions were decided based on the maximum of three selected responses (i.e., total phenolic content (TPC), antioxidant activity (AA), and chlorogenic acid content (T-CQA)) contained in the crude extract of coffee silverskin.

2.5. Statistical Analysis

Multiple regression analyses were evaluated for fitting the mathematical model using Minitab 16 (State College, PA, USA). Pareto analysis of the variance was also conducted to analyze and estimate the significant contribution of input variables to different outputs. The factors with a confidence level greater than 95% were considered significant. The experimental data were assessed with several descriptive statistical analyses, for example, p-value, F-value, R2, adjusted R2, and the lack of fit. A p-value < 0.05 was used to determine whether the observed difference was statistically significant.

2.6. Validation of the Optimized Conditions

The developed mathematical model equation was validated based on a triplicate assay under the optimal condition. To evaluate the accuracy and suitability of the developed model, the mean value for the experimental data was calculated and compared with the predicted values obtained from the model.

2.7. Measurement of the Total Phenolic Content

The total phenolic contents (TPCs) for the CS extracts were tested according to the protocol reported by Baba and Malik [43]. The solution of the crude extract was prepared to a concentration of 1 mg/mL. Then, 400 µL of each crude extract was diluted 5.5-fold with deionized water. Then, the diluted extract was mixed thoroughly with 1 mL of Folin–Ciocalteu reagent for 3 min to allow the reduction process to occur. Immediately after the color changes were observed, 4 mL of 20% (w/v) sodium carbonate was added, and the mixture was kept in darkness for 60 min. The absorbance values were measured at a wavelength of 650 nm (Lambda35 Ultraviolet-Visible Spectrometer, PerkinElmer, Waltham, MA, USA). A calibration curve was established with Gallic acid at concentrations of 10–60 mg/L (R = 0.9996). The TPC was expressed as mg of the Gallic acid equivalent (GAE) per g CS [43].

2.8. Measurement of Antioxidant Activity

Antioxidant capacity is widely used as a parameter to characterize the ability of a test solution to scavenge or neutralize a given free radical [44]. The DPPH assay is commonly used to estimate the radical scavenging capacity of plant extracts. It is generally used to provide a screening of the general activity of the antioxidants, as the free radical property of DDPH is lost when reacting with an antioxidant compound. In this study, the antioxidant content (AA) in the CS extracts was also measured with the DPPH radical scavenging assay reported by Almeida et al. [44]. Briefly, the solution of the crude extract was prepared to a concentration of 1 mg/mL. Then, 20 µL of each crude extract or control (Trolox) was added to a 3.8 mL aliquot of DPPH solution (2.6 mg/100 mL). The mixtures were incubated at room temperature (25 °C) in darkness for 30 min. The control was prepared as mentioned above without adding any crude samples. The decrease in the absorbance of the resulting solution was measured at a wavelength of 517 nm (Lambda35 Ultraviolet-Visible Spectrometer, PerkinElmer, Waltham, MA, USA). All tests were conducted in triplicate. The AA was expressed as mg of Trolox equivalents (TE) per g CS. The ability of the CS extract to scavenge DPPH radicals was calculated as follows [44]:
Scavenging   effect   ( % ) = [ ( A 0 A 1 A 0 ) × 100 ]
where A0 is the absorbance of DPPH only and A1 is the absorbance of DPPH with a tested sample or control (Trolox solution).

2.9. Quantitative Analysis of Total Chlorogenic Acid by HPLC-UV

In this study, 3-CQA, 4-CQA, and 5-CQA were measured. The summation of these three measurements was reported as total chlorogenic acid (T-CQA). Quantification of the T-CQA of the CS extract was conducted based on the report of Craig et al. [45] by using the high-performance liquid chromatography method (Varian ProStar 310 UV–VIS). A standard curve for 3-CQA, 4-CQA, and 5-CQA was constructed in triplicate with concentrations ranging from 0.05 to 100 µg/mL. The lyophilized CS extracts were dissolved in 50% methanol to a concentration of 10 mg/mL. The separation was performed with a C18-AR column (25 cm × 4.6 mm i.d, particle size 5 µm). The temperature was controlled at 25 °C. Mobile phase A was 0.1% (v/v) trifluoroacetic acid (TFA) in water, and mobile phase B was acetonitrile (ACN). The sample was eluted using a linear gradient of 0.1% (v/v) TFA (solvent A) and ACN (solvent B). The gradient was programmed as follows: 90:10 (solvent A: solvent B) for 18 min followed by 75:25 (solvent A: solvent B) for 1 min. The injection volume and the flow rate were 10 μL and 1.0 mL/min, respectively. The detector was set at a wavelength of 326 nm.

3. Results

In this work, an experimental BBD was performed to investigate the optimum levels for the independent variables. The dependent variables were X1 (temperature in °C), X2 (time, min), and X3 (solid-to-liquid ratio, unitless), which represent total phenolic content (TPC), antioxidant activity (AA), and total chlorogenic acid (T-CQA), respectively. First, a preliminary assessment of the model adequacy was carried out as presented in supplementary data Figure S1 (for TPC), Figure S2 (for AA), and Figure S3 (for T-CQA). It is recommended that a straight line of residuals should be obtained. This study revealed that all dependent variables (TPC, AA, and T-CQA) exhibit normal distributions. A long-tail distribution was detected for all four variables. No outliers were observed. The results for the residuals against fitted values and run orders revealed that they are independent of one another, have a random distribution, and have constant variance. These results, therefore, suggest that the data are appropriate and can be used to establish a model that can efficiently explain the effects of extraction conditions for obtaining TPC, AA, and T-CQA from coffee silverskin.

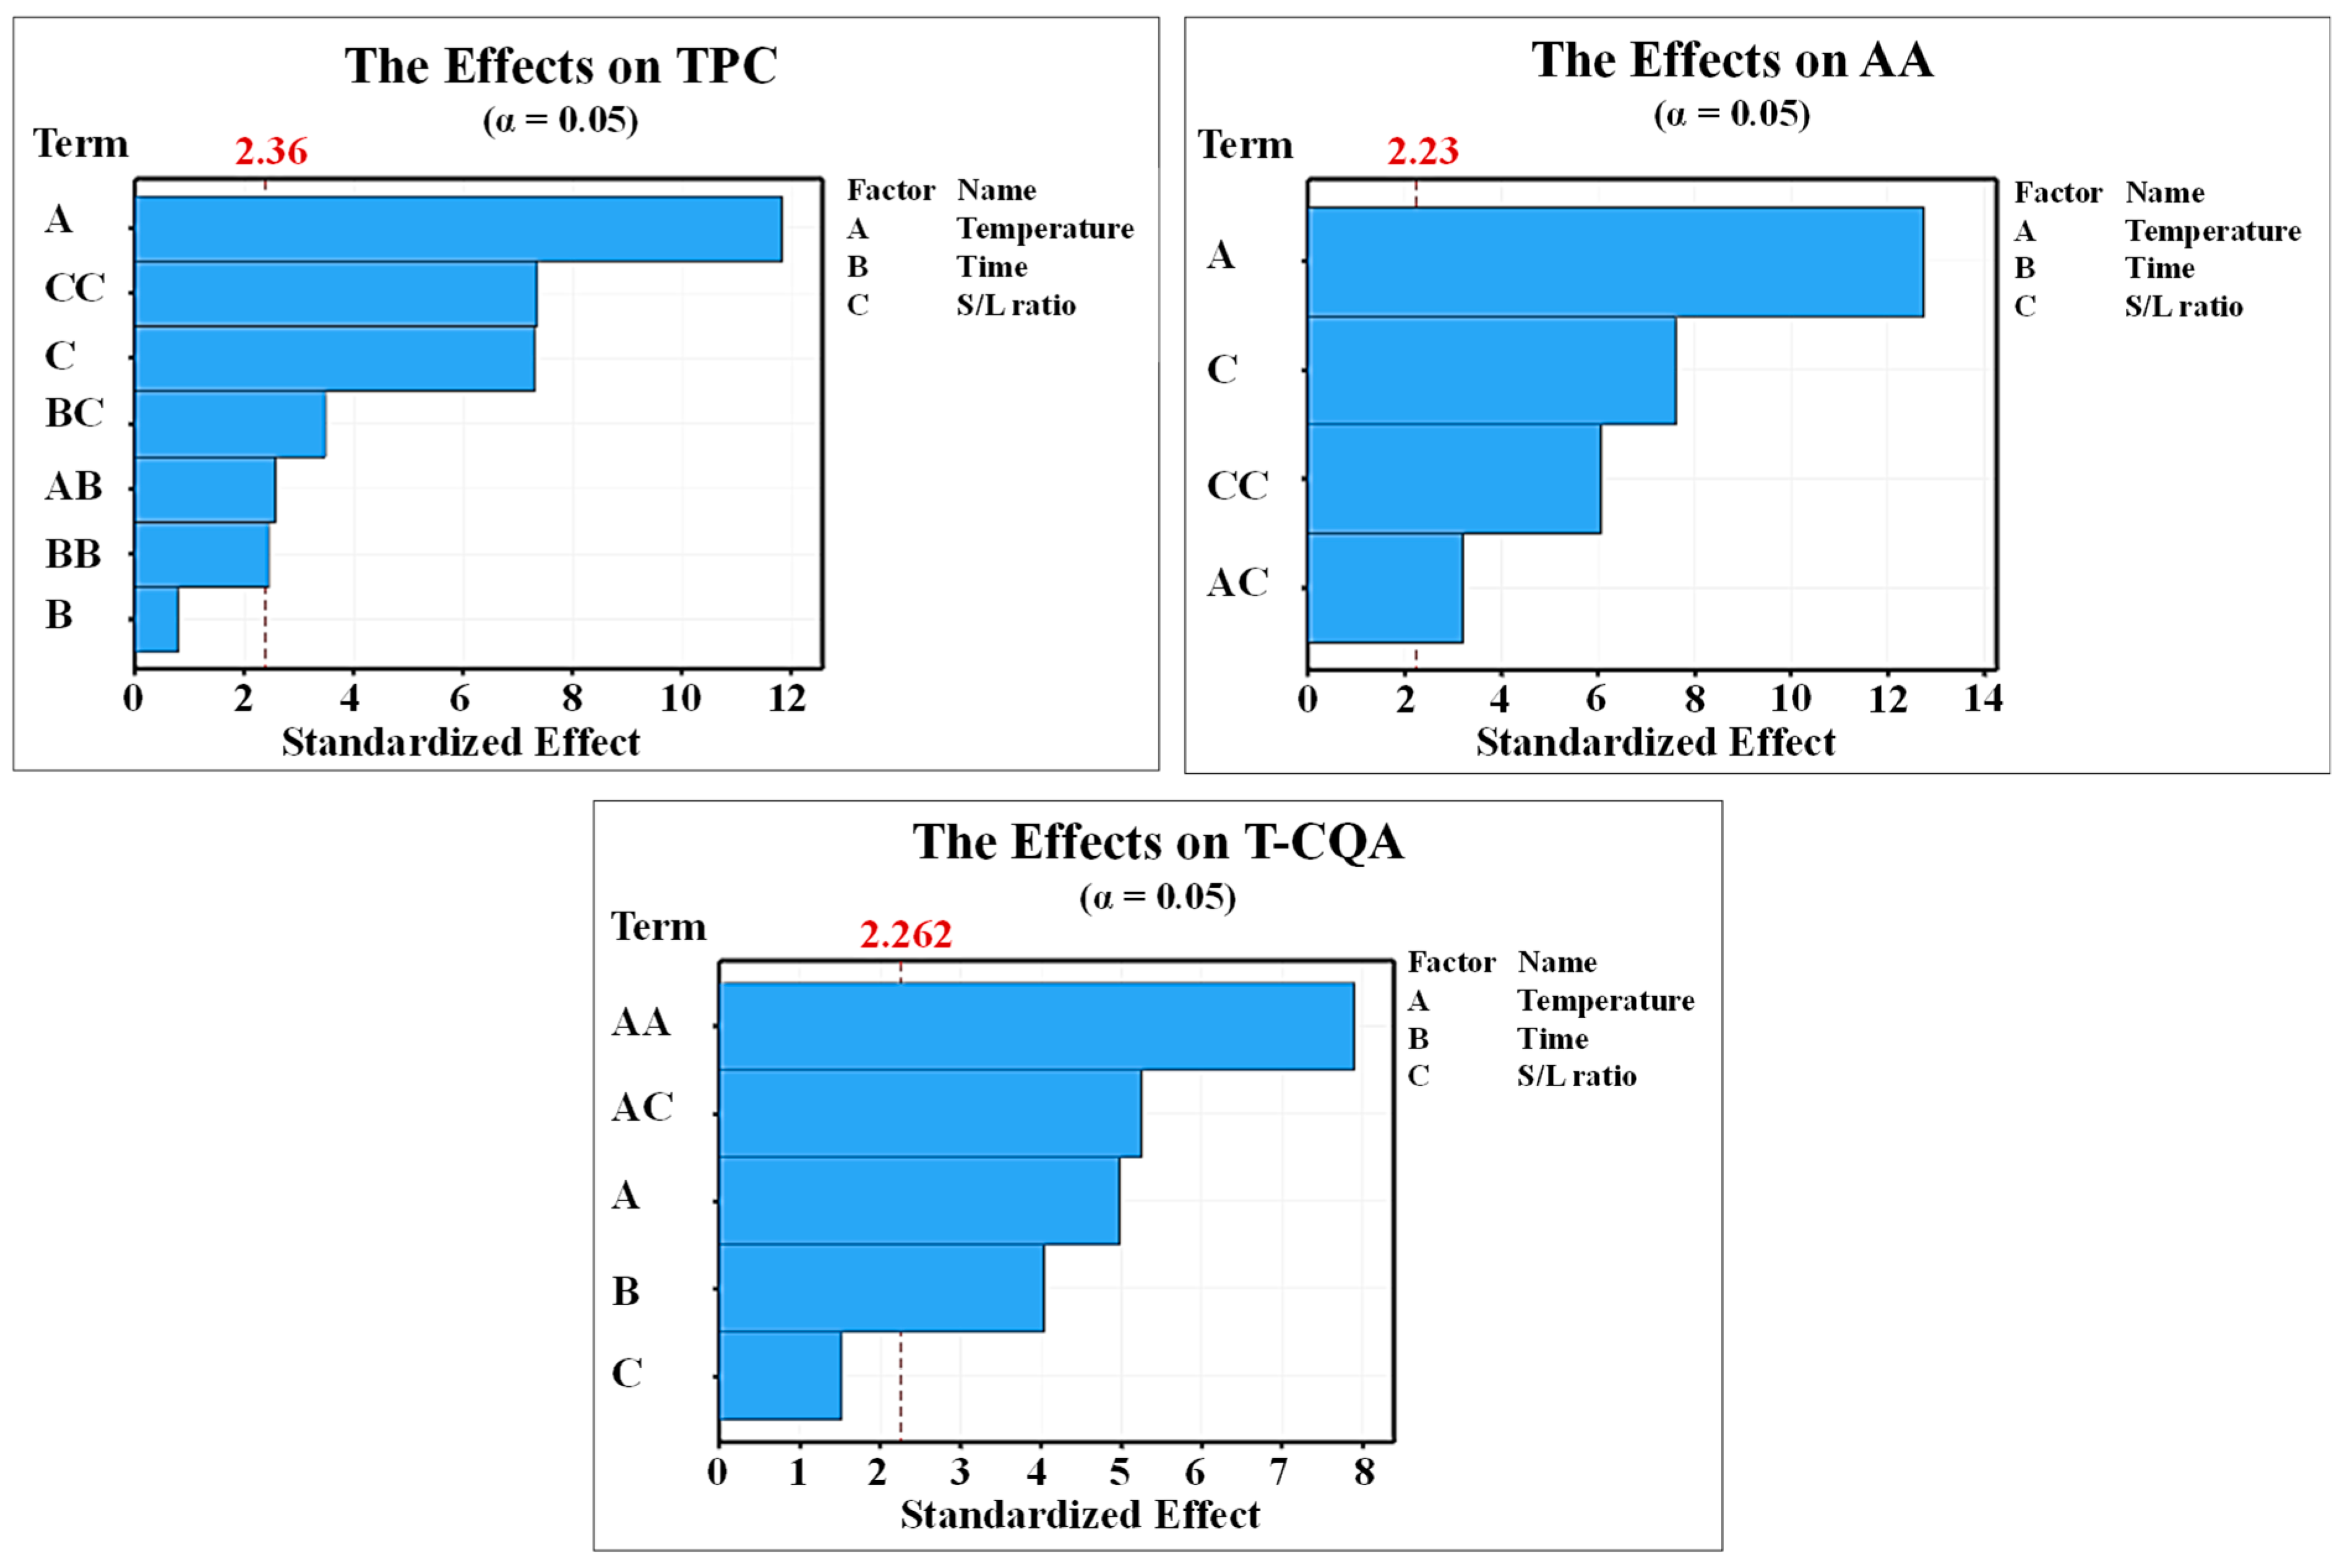
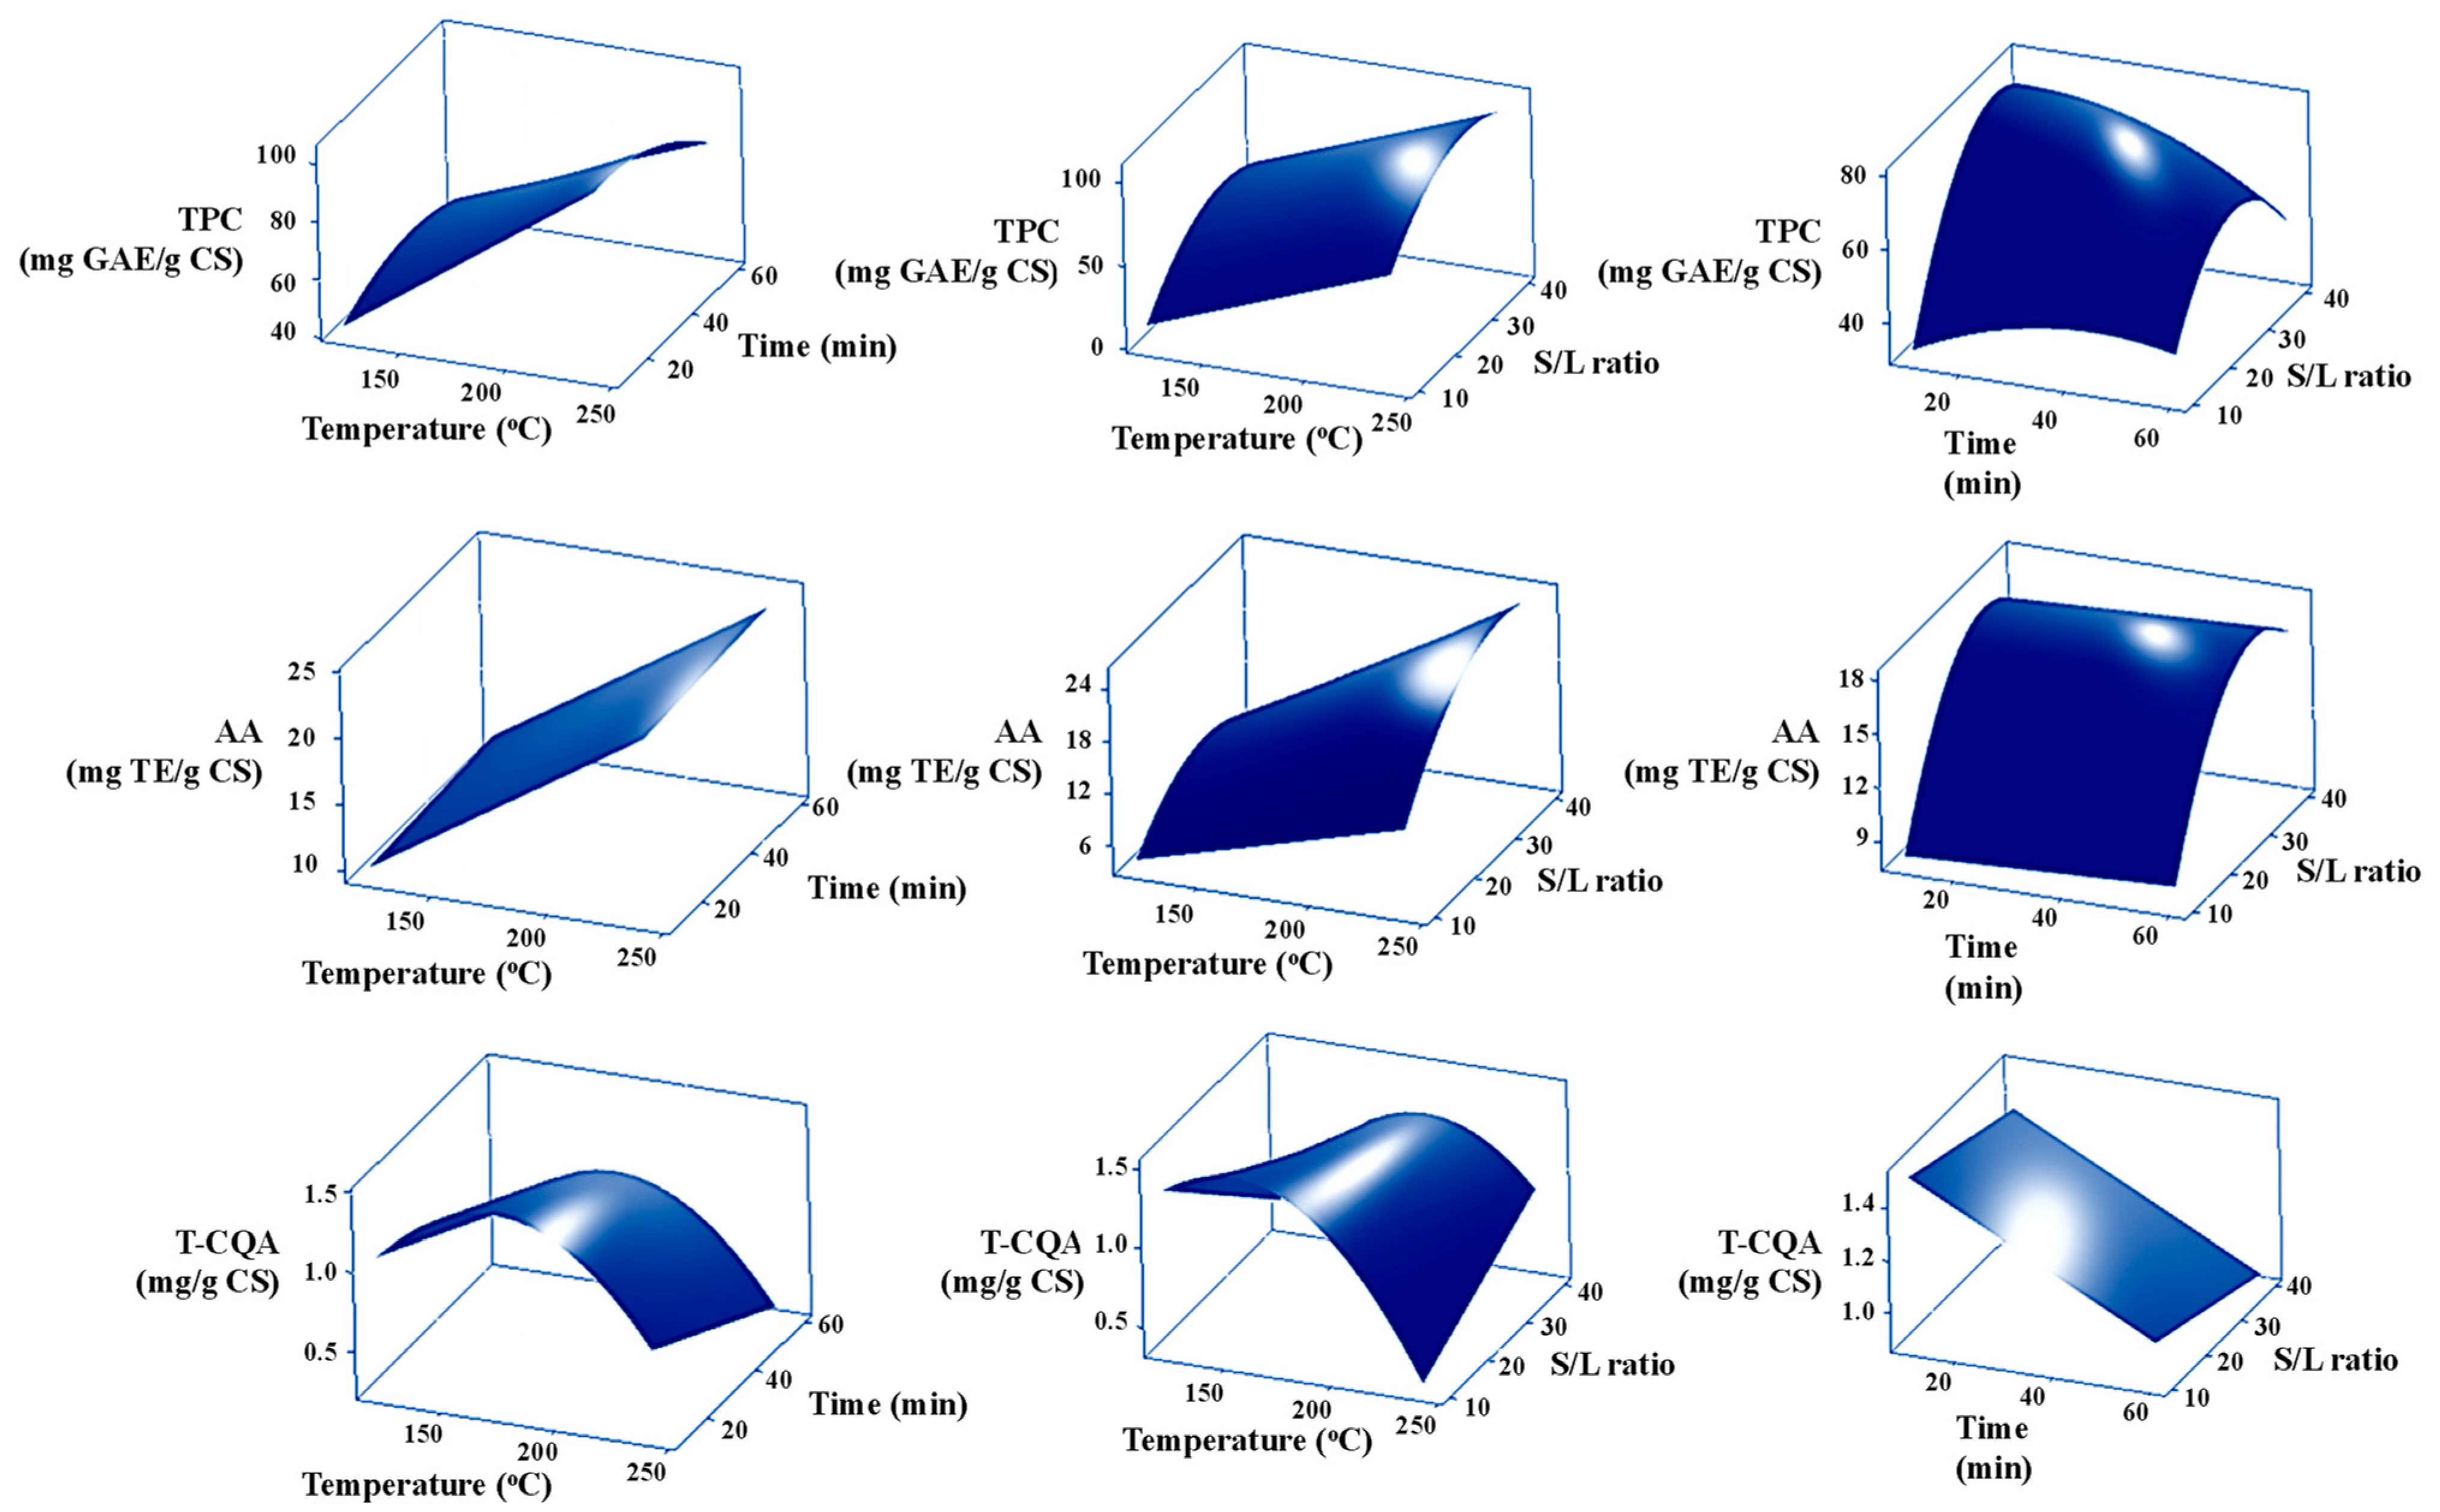
3.1. Effect of Extraction Conditions on the TPC

As shown in Table 2, the highest TPC (93.83 ± 6.11 mg GAE/g CS) was obtained under the following conditions: extraction temperature of 240 °C, extraction time of 10 min, and S/L ratio of 1:25. This value is three times higher than the value extracted using a maceration technique with ethanol and water mixtures [16,18] and is relatively higher than the values reported earlier The lowest TPC (19.01 ± 3.54 mg GAE/g CS) was obtained from the following conditions: 120 °C, 10 min, and 1:25 (S/L ratio). Based on the same extraction technique and extraction conditions (180 °C, 10 min), the TPC in the extract of our study was two times higher than the value reported earlier [18].
The p-values for each factor in the polynomial regression equations of dependent variables from the CS extracts in the final model are presented in Table 3. It was found that the significant factors affecting TPC in the CS extract are the extraction temperature (X1), S/L ratio (X3), the square terms of time (X22) and S/L ratio (X32), and the interaction of temperature and time (X1X2) and time and S/L ratio (X2X3). The TPC is significantly enhanced when the extraction temperature is raised from 120 to 240 °C at the same extraction time and S/L ratio (runs 1 and 11, 3 and 9, 6 and 13, and 7 and 15). Considering the extraction time, the results reveal an insignificant effect on the TPC (p = 0.412) when using the same temperature and S/L ratio (runs 1 and 6, 4 and 14, 10 and 12, and 11 and 13). Regardless of the extraction temperature and time, TPC is enhanced when the S/L ratio is increased from 1:10 to 1:40 (runs 3 and 15, 4 and 10, 7 and 9, and 12 and 14). This reveals that the S/L ratio significantly affects the TPC in the CS extracts (p = 0.001). The magnitude of the influence of each factor was also studied. Figure 2 shows significant terms and their interactions that significantly affect the responses (i.e., TPC, AA, and T-CQA). The vertical line defines the t-value at a 95% confidence interval. The terms that pass through the line indicate that they significantly affect the response in the CS extracts, while the terms below the line are considered insignificant factors. The results confirm that the extraction temperature (A) has the highest standardized effect on the TPC. In contrast, the individual effect of extraction time is insignificant on the TPC. The descending order for the influencing factors on the TPC is given as follows: extraction temperature (A) > square term of the S/L ratio (CC) > S/L ratio (C) > interaction between extraction time and S/L ratio (BC) > interaction between extraction temperature and time (AB) > square term of the extraction time (BB).

3.2. Effect of Extraction Conditions on the AA

From Table 2, the highest AA (26.12 ± 3.27 mg TE/g CS) is obtained at the maximum extraction temperature of 240 °C, the minimum time of 10 min, and the S/L ratio of 1:25. This value is relatively higher than the values reported earlier The lowest AA (4.15 ± 0.43 mg TE/g CS) is obtained at the minimum temperature of 120 °C, time of 35 min, and S/L of 1:40. Based on the same extraction technique and extraction conditions (180 °C, 10 min), the AA in the extract of our study is relatively higher than the value reported earlier [18].
The antioxidant content (AA) is significantly enhanced when the extraction temperature is increased from 120 to 240 °C (runs 1 and 11, 3 and 9, 6 and 13, and 7 and 15). Apart from the extraction temperatures, AA is also increased when the S/L ratio is increased from 1:10 to 1:40. From Table 3, the significant factors affecting AA in the CS extract are extraction temperature, S/L ratio, the square term of the S/L ratio (X32), and the interaction of temperature and S/L ratio (X1X3). The magnitude of the influence of each factor is shown in Figure 2. The factors that significantly influence the amount of antioxidant content (AA) follow the order of extraction temperature (A) > S/L ratio (C) > square term of the S/L ratio (CC) > the interaction between extraction temperatures and S/L ratios (AC). In addition, it was noted that the extraction time (10 to 60 min) does not affect the AA content in the CS extract.

3.3. Effect of Extraction Conditions on the T-CQA

In this study, the total chlorogenic content was quantified based on three isomers of caffeoylquinic acid: 3, 4, and 5 caffeoylquinic acids. The total chlorogenic content (T-CQA) in the extract of the subcritical water extraction (SWE) process ranges from 0.48 ± 0.15 (240 °C, 35 min, and S/L ratio 1:10) to 2.33 ± 0.32 mg T-CQA/g CS (180 °C, 10 min, and S/L ratio of 1:40). Similar to the obtained TPC and AA, based on the same extraction technique and extraction conditions (180 °C, 10 min), the T-CQA in the extract of our study is relatively higher than the value reported earlier [18]. The T-CQA is increased when the extraction temperature is increased from 120 to 180 °C. However, a relatively low T-CQA is observed when extracting at a temperature of 240 °C, as shown in Table 2. From Table 3, the significant factors affecting T-CQA in the CS extract are extraction temperature (X1), time (X2), the square term of the temperature (X12), and the interaction of temperature and S/L ratio (X1X3). When operating under the same temperature and extraction time (runs 3 and 15, 4 and 10, 7 and 9, and 12 and 14), T-CQA does not vary greatly when using the S/L ratio of 1:10 to 1:40. This confirms that the S/L ratio alone insignificantly affects (p = 0.6724) the T-CQA in the CS extract. The results also reveal that the use of a prolonged extraction time at each temperature (120, 180, and 240 °C) results in a decrease in the T-CQA content. The T-CQA is significantly different (runs 1 and 6, 4 and 14, 10 and 12, and 11 and 13) with distinct values for the extraction times at the same temperature and S/L ratio. Apart from temperature, T-CQA is not significantly different when the S/L ratio is increased from 1:10 to 1:40 when using the same extraction temperature and time (runs 3 and 15, 4 and 10, 7 and 9, and 12 and 14). This confirms that the S/L ratio alone insignificantly affects the T-CQA (p = 0.67). However, the interactions between the extraction temperature and the S/L ratio (X1X3) significantly affect the T-CQA content (p = 0.001). These variables can positively affect the modifying solubility and equilibrium constants, which subsequently enhance caffeoylquinic acid content [33]. A sufficiently high temperature and S/L ratio can enhance the desorption of solutes (i.e., T-CQA) from the CS matrix, diffusion of subcritical water into the CS matrix, dissolution of the T-CQA into the subcritical water, and elution of the extract from the CS matrix. In addition, a prolonged extraction time at each temperature (120, 180, and 240 °C) leads to a decrease in the T-CQA content. This is probably due to the oxidation and degradation of T-CQA. The T-CQA content is significantly different (runs 1 and 6, 4 and 14, 10 and 12, and 11 and 13) for different extraction times when operating at the same extraction temperature and S/L ratio. As shown in Figure 2, the Pareto chart reveals that the factors influencing the amount of T-CQA follow the order of AA (Temperature*Temperature) > AC (Temperature*S/L ratio) > A (Temperature) > B (Time).

3.4. Regression Modeling of the SWE Conditions on TPC, AA, and T-CQA

The goodness of fit was evaluated by determining the coefficients (R2), adjusted R2 (R2(adj)), and predicted R2 (R2(pred)). As presented in Table 3, the values of R2(pred) for the TPC, AA, and T-CQA are in agreement with R2(adj). For a value higher than 75%, the regression model can predict the designated response very well [36,38,39,40,42]. A multiple regression analysis was implemented to determine the coefficients and equations, which can be used to estimate the responses (i.e., TPC, AA, and T-CQA). As shown in Table 4, the R2 for TPC, AA, and T-CQA was 89.64%, 96.41%, and 93.70%, respectively. Both the R2 and adjusted R2 values were greater than 80%. This confirms that the model exhibits precise prediction for the designated responses [40,41,42].
The lack of fit is the parameter used for confirming the validity of the models. If the lack of fit has a p-value > 0.05, the model can precisely fit the experimental data [36,38,39,40,41,42]. As shown in Table 4, all the developed quadratic polynomial models are consistent and precise for predicting the designated responses (i.e., TPC, AA, and T-CQA).

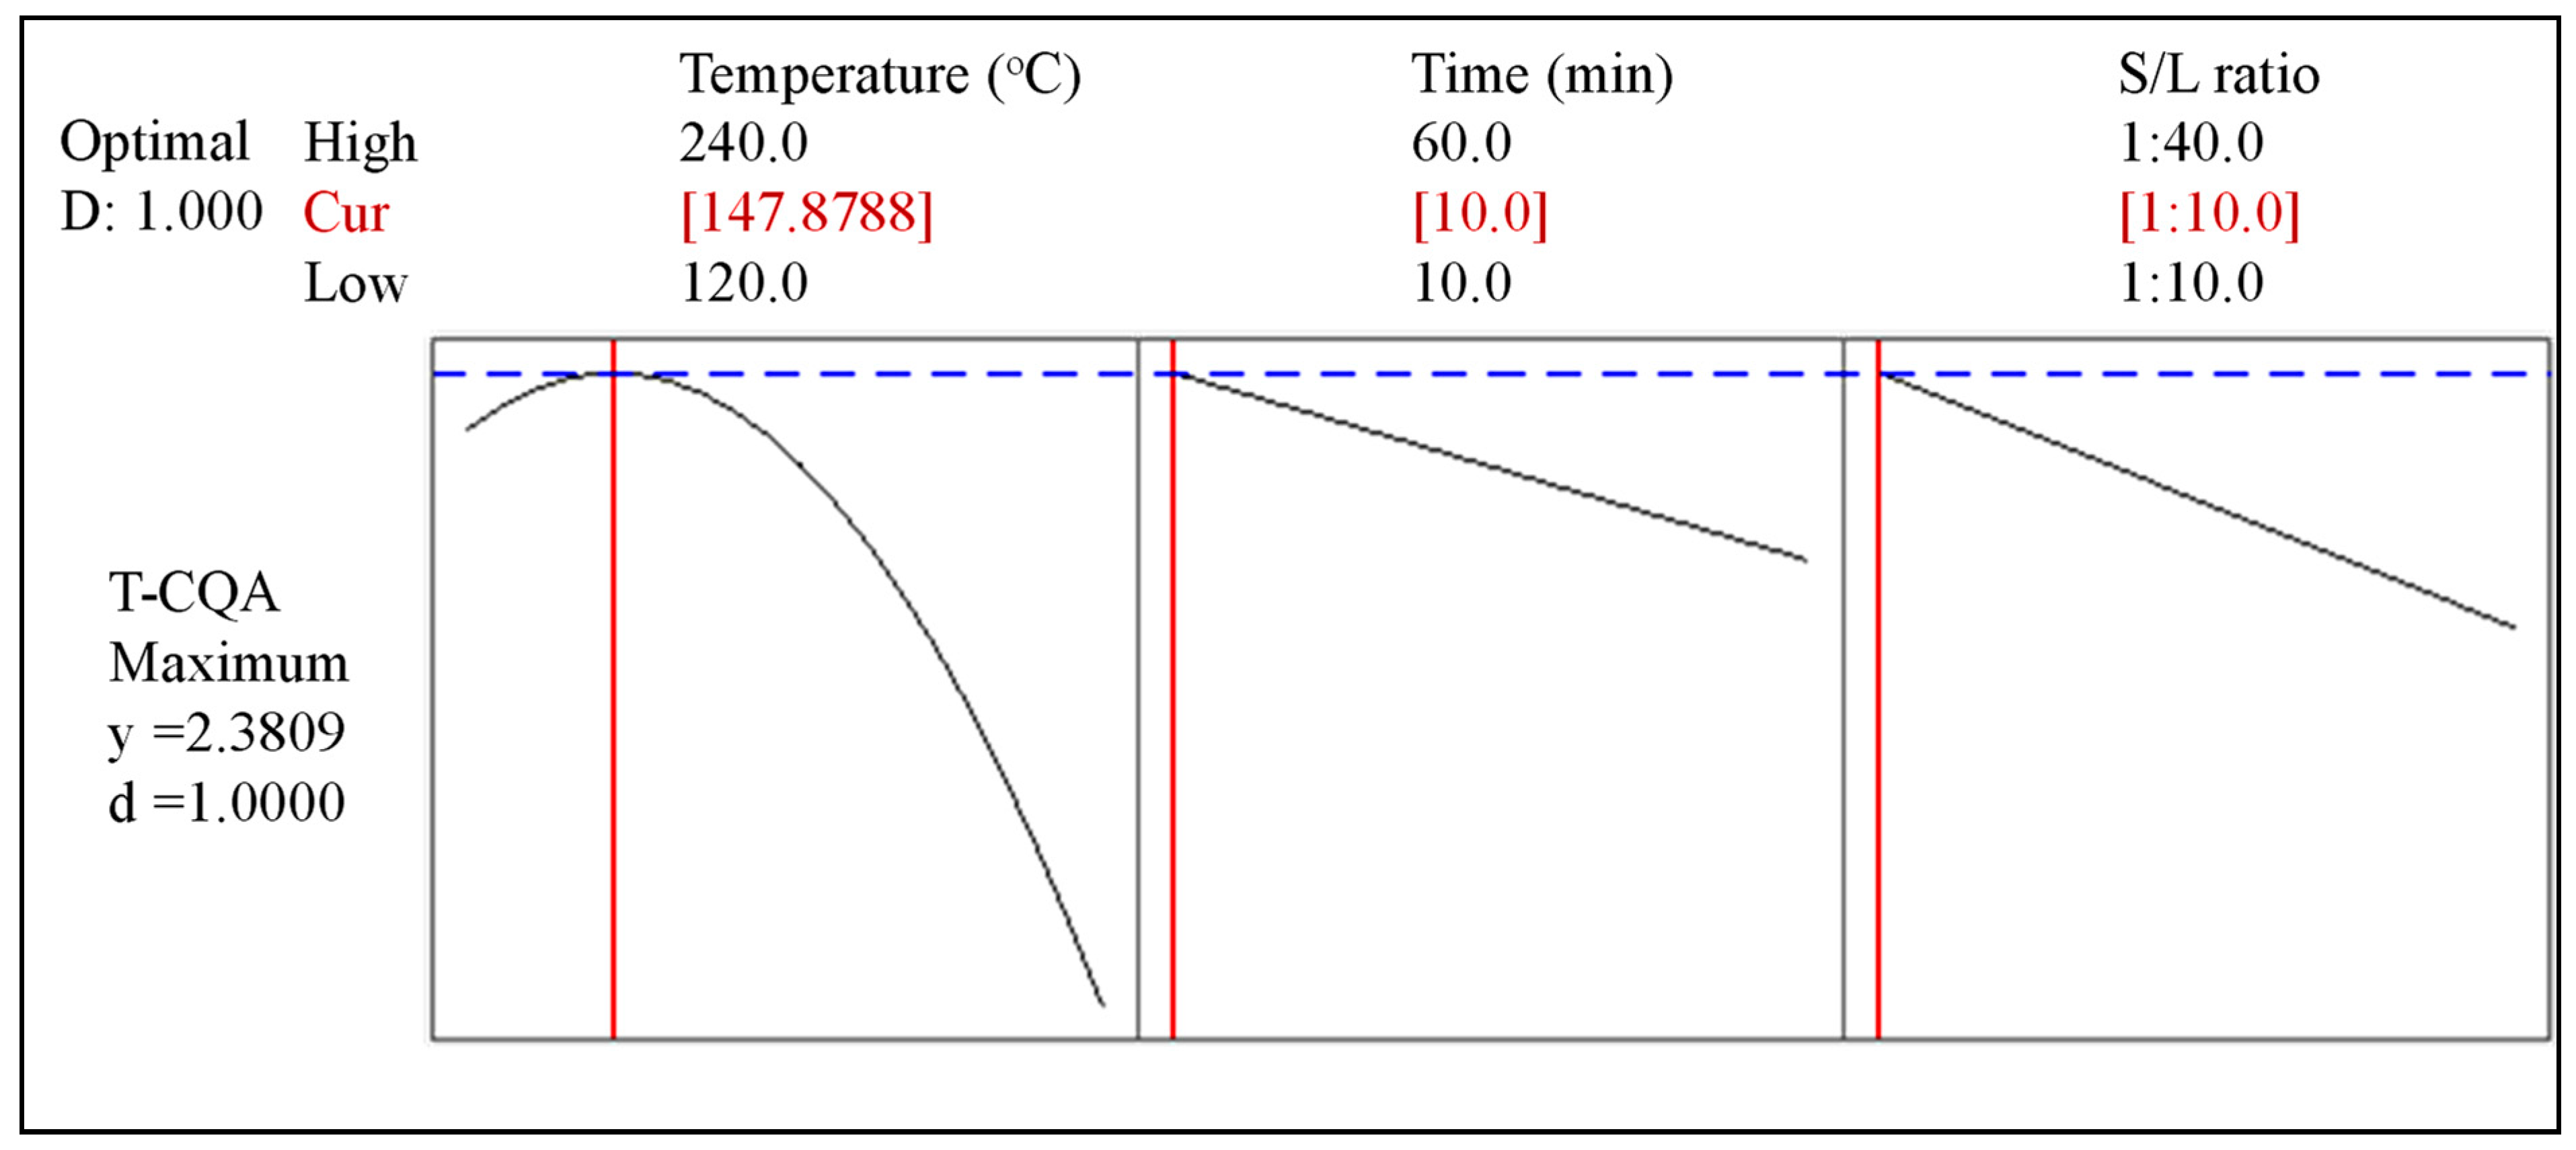
3.5. Optimal Extraction Conditions and Model Validation

The three-dimensional surface response graphs shown in Figure 3 show the optimum values and interactions between variables. Considering the TPC, the surface plot shows quadratic effects and exhibits curvature changes with the extraction time and solid-to-liquid ratio (S/L). Within the range of this study (120–240 °C), the TPC increases with increasing extraction temperature. However, prolonging the extraction time above 30 min at 240 °C and using the S/L ratio of 1:35 leads to a decrease in the TPC. The optimal extraction temperature, extraction time, and S/L ratio are determined to be 240 °C, 10–30 min, and 1:25 to 1:35, respectively. This implies that the majority of phenolic compounds are likely to be nonpolar compounds because the dielectric constant of water decreases with increasing temperature. These conditions favor the solubility of nonionic and nonpolar compounds [33]. For AA, the surface plot in Figure 3 shows quadratic effects and exhibits curvature changes in the S/L ratio and temperature.
Similar to the TPC, the AA is increased with increasing extraction temperature (from 120 to 240 °C) and extraction time (from 10 to 60 min). This finding corresponds to a previous report [16,18,33], which revealed that the highest antioxidant activities of CS extract from SWE are obtained at a relatively high temperature of 270 °C [16,18,33]. Increasing the S/L ratio enhances the AA of the extract; however, the use of the S/L ratio of up to 1:40 leads to a decrease in the AA. The optimum extraction temperature, time, and S/L ratio are in the range of 240 °C, 25–60 min, and 1:30 to 1:35, respectively. This also implies that the majority of antioxidants are likely to be nonpolar compounds. In addition, the major factors influencing the obtained TPC and AA in this study are the extraction temperature and the S/L ratio.
For T-CQA, the surface plot shows quadratic effects and exhibits curvature changes in temperature. Increasing extraction temperatures lead to an increase in T-CQA. However, a decrease in T-CQA is observed when operating at a temperature higher than 180 °C. Increasing the S/L ratio enhances the T-CQA; however, using the S/L ratio above 1:20 at 170 °C leads to a decrease in the T-CQA. Interestingly, it was noted that an extraction time above 15 min at 170 °C results in a lower T-CQA.
To maximize the T-CQA response, the ideal combination of input independent variables was determined by the response optimizer of Minitab. As presented in Figure 4, the optimal extraction conditions are defined as 147.9 °C, 10 min, and S/L ratio of 1:10. The predicted T-CQA is 2.38 mg T-CQA/g CS with a composite desirability of 1.00, where composite desirability is the weighted geometric mean of the individual desirability for the responses. Validation of the model prediction was conducted under the optimized conditions in triplicate. The average value obtained from the experimental results was 2.70 ± 0.23 mg T-CQA/g CS. Chromatograms of 3-, 4-, and 5-CQA in the CS extract obtained from the optimum condition are provided in supplementary data Figure S4. The 3-CQA, 4-CQA, and 5-CQA were found to almost equally have the same concentration. As shown in Table 5, the experimental values of the T-CQA correspond well with the predicted values. No significant differences between the experimental and predicted values were observed (p = 0.78). Therefore, the model can be used to accurately predict the responses.
A comparison of our results with the relevant literature is shown in Table 6. The T-CQA obtained under the optimum conditions is higher than in the previous report using the same extraction method [18]. It was reported that subcritical water can extract and leach out 5-CQA from the CS at a temperature running from 25 to 180 °C. In addition, the disappearance of 5-CQA in the CS extract can be used as an indication of the decomposition caused by heat treatment (210–270 °C) [16]. This study reveals a fine-tuning extraction temperature of 148 °C to achieve a maximum T-CQA (3-CQA, 4-CQA, and 5-CQA) from the CS. Under the optimum condition, the T-CQA value of our study is lower than the value reported by Bresciani et al. (4.32 mg/g CS), using 1% aqueous formic acid at 70 °C for 1 h [14]. The reason for this might relate to the temperature used during the roasting process. For our study, the coffee silverskin samples were of dark roasted lots. However, when testing the optimum condition with a sample of medium roasted lots the T-CQA of 8.07 ± 1.14 mg/g CS was obtained.
From Table 5, the mean TPC value of the extract at the optimum condition was determined to be 51.86 mg GAE/g CS (or 5.19 g GAE/100 g CS), which is higher than the value reported earlier [13,46,47]. The mean value for the antioxidant content (AA) using the DPPH assay and the extraction yield was determined to be 13.72 mg TE/g CS and 27.25%, respectively. Interestingly, both the TPC and AA of our study are higher than the values reported previously using the organic solvent extraction method, as presented in Table 6. This suggests that subcritical water extraction provides an efficient penetration of water into the CS matrix and a leaching out of the phenolic compounds, resulting in high TPC and AA content. The TPC and AA values obtained at 147.9 °C (in Table 5) are lower than the highest values obtained under 240 °C (in Table 2). This confirms that for the subcritical water extraction (SWE) technique a high extraction temperature contributes to high TPC and AA content in the CS extract [16,18,33]. It was reported that the TPC of the CS extracts increases with increasing extraction temperature from 25 to 240 °C. This supports our finding regarding the highest TPC obtained at the temperature of 240 °C (Table 2). In addition, it has been reported that at the temperature range of 180–270 °C a high antioxidant activity (AA) of the CS extract can be found resulting from the phenolic contents in the extract and the peptides produced by hydrolysis of the protein inherent in the CS [16,18].

4. Discussion

Response surface methodology is commonly used for experimental procedures. This method can be used to effectively investigate a suitable estimation for the relationship between independent input and dependent output variables. The effects of each variable and their interactions are evaluated based on the area where the most appropriate response occurs. In general, experimental design techniques are used for the optimization of bioprocess development to enhance product yields, conformity of the process output or the target compounds, increase process consistency, and reduce processing time and cost [36,37]. Compared to a normal factorial technique, BBD is efficient in producing higher-order response surfaces with a minimum number of required runs [38]. SWE efficiently extracts bioactive compounds from CS. The key mechanisms involved in the subcritical water extraction (SWE) process involve (1) the penetration of water (as a solvent) into the sample matrix at high temperatures and pressures and (2) leaching out of the target compound [16,33]. The extraction temperature is likely to be one of the crucial factors affecting extraction efficiency. High TPC, AA, and T-CQA in the extracts are obtained at a relatively high temperature. In our study, the optimum extraction temperature for attaining the maximum TPC and AA was 240 °C, while a relatively lower temperature of 147.9 °C was required for obtaining the maximum T-CQA. This might be related to the fact that a high extraction temperature can enhance hydrolysis or degradation of lignin and lignan into smaller and more soluble phenolic compounds, which can be detected by the Folin–Ciocalteu reagent [16,18,48]. In addition, the extraction efficiency is enhanced when using high temperatures. This can be explained by the fact that high temperatures can facilitate the disruption of the inclusive interactions between the target compound and the sample matrix interactions, such as van der Waals forces, H-bonding, and dipole–dipole interactions [33]. As a consequence, the change in H-bonding strength is reflected by the dielectric constant. At lower temperatures, H-bonds are stronger, resulting in a higher dielectric constant value, whereas increasing temperature results in an increase in thermal agitation. This results in a decrease in the H-bond strength and dielectric constant. The decrease in the polarity of water normally leads to an increase in the solubility of organic molecules in the extract. This supports our assumption that the maximum TPC and AA obtained at 240 °C are likely comprised of nonpolar organic molecules. In addition, the surface tension of the water, solutes, and CS matrix decreased with increasing temperature. This can subsequently enhance solvent wetting and expansion of the CS sample. Higher temperatures allow for better penetration of water in the CS matrix as the viscosity of the water decreases, thus enhancing extraction [33,47,49]. Our study reveals that using an extraction temperature of 240 °C favors the extraction of relatively nonpolar organic molecules, while using extraction temperatures ranging from 120 to lower than 180 °C favors the extraction of mid-polar compounds (i.e., T-CQA).
However, using very high temperatures can result in the degradation of certain phenolic compounds [47,48,50]. The use of a high extraction temperature can result in the formation of new bioactive compounds via Maillard caramelization reactions [33]. This supports our findings at temperatures of 180 and 240 °C. The browning products were generated, and the caramelized extracts were observed. Increasing the extraction temperature above 200 °C can lead to the degradation of many thermolabile compounds [33,47,50,51]. Based on the report published in 2014, phenolic compounds degrade faster at temperatures of 200 and 250 °C [16,48]. As a result, the use of subcritical water treatment at such temperatures leads to a relatively high TPC. This result can be explained by the fact that the degraded products contain a phenol structure, which is very stable in subcritical water. Examples of phenolic compounds in the extract obtained at such temperatures are caffeic acid, chlorogenic acid, vanillic acid, and catechin [48]. For caffeoylquinic acids (CQAs), decomposition of 3-o-caffeoylquinic acid (3-CQA) has been observed under hydrothermal conditions ranging from 160 to 240 °C and for reaction times ranging from 5 to 45 min [51]. At temperatures above 210 °C, decomposition of 5-caffeoylquinic acid (5-CQA) due to progressive destruction and transformation of chlorogenic acid has been reported [16,18]. This can explain our findings that the maximum T-CQA is obtained at the optimized conditions of 147.9 °C, 10 min, and S/L ratio of 1:10. When operating at 240 °C, a low T-CQA is observed. The extraction conditions affect the total antioxidant activity (AA) in the extract. It is noted that the amount of antioxidants in the CS extract is related to the total phenolic content, and the free radical scavenging ability can be associated with phenolic compounds [52,53]. Using high extraction temperatures can lead to the oxidation and degradation of chlorogenic acids, resulting in relatively low T-CQA content in the CS extracts. Operating under high temperatures during extraction can lead to a substantial decrease in the polarity, which can be determined from the measurement of the value of the dielectric constant. Above 100 °C, the dielectric constant of water decreases, which leads to water behaving more like an organic solvent. For example, at 214 and 295 °C, water is comparable to methanol and acetone, respectively. This condition does not favor the solubility of nonionic and nonpolar compounds. Due to the instability of chlorogenic acid itself, it is suggested that the extraction should not be performed at a high temperature for an extended period of time [33]. This can explain the optimal condition for the maximum T-CQA, which is obtained at 147.9 °C with a relatively short time of 10 min. In addition, the extraction time is one of the key factors influencing the extraction kinetics. Here, a sufficient reaction time should be provided to enable (1) desorption of target compounds from the CS matrix, (2) diffusion of subcritical water into the CS matrix, (3) dissolution of the target compounds into the subcritical water, and (4) elution of the extract from the CS matrix [33,54,55]. Generally, SWE is a very fast extraction technique. For example, efficient extraction of nonpolar organic substances, such as essential oils, requires a relatively long reaction time (i.e., within 30 min). For flavonoids, maximum yields for flavones (i.e., hesperidin and narirutin) from citrus peels were achieved at 160 °C for an extraction time as short as 10 min [33,56]. This supports our findings that the extraction time significantly affects the TPC and T-CQA but does not specifically affect the AA in the CS extract. The S/L ratio positively affects the breakdown of phenolic compounds. The higher the ratio of liquid (e.g., water) used as a solvent, the more capable it is for enhancing the solubility. Referring to the mass transfer principles, the driving force during mass transfer relates to the concentration gradient between the solid and bulk of the liquid [57]. Sufficient liquid should be provided to enable desorption, diffusion, and dissolution mechanisms, as mentioned above. However, the use of a very high S/L ratio can result in a loss of bioactive compounds during the water elimination or drying step.

5. Conclusions

The coffee roasting industry produces large volumes of byproducts that require proper waste management before disposal in landfills. Coffee silverskin (CS), the only byproduct of the coffee roasting process, is rich in phenolic compounds with various bioactivities. This study proposed a valorization option for bioactive compounds (T-CQA) based on a subcritical water extraction technique. It was demonstrated that a batch-high-pressure autoclave reactor can be tailored to valorize coffee silverskin to high-value bioactive compounds, making the use of CS on an industrial scale feasible. Using water as a sole solvent requires a minimum number of cleaning steps that render the extract safe in broad applications, such as in either the cosmetic or food industry.
Box–Behnken design can be used to effectively optimize and explain the single and interactive effects of process variables (i.e., extraction temperature, extraction time, and S/L ratio) on the T-CQA obtained from coffee silverskin by the SWE technique. The developed model is satisfactory and exhibits accurate prediction of the experimental data obtained for the maximum T-CQA. To our knowledge, this is the first study that has fine-tuned the extraction condition based on T-CQA (3-CQA, 4-CQA, and 5-CQA) content. The optimum conditions are highlighted, and the T-CQA and TPC content obtained in this study are higher than those obtained in a previous report. Further investigations on bioactive compounds obtained from the optimal conditions, based on TPC, AA, and T-CQA, may provide useful comparative information in the future.

Supplementary Materials

The following supporting information can be downloaded at: https://www.mdpi.com/article/10.3390/su14148435/s1, Figure S1: Model adequacy diagnostic plots for total phenolic contents (TPC); Figure S2: Model adequacy diagnostic plots for total antioxidant (AA); Figure S3: Model adequacy diagnostic plots for total chlorogenic acids (T-CQA); Figure S4: An example of chroma-tograms of 3, 4, and 5-CQA in the CS extract obtained from the optimum condition [147.9 °C, 10 min, and 1:10 (s/L ratio)].

Author Contributions

Methodology, A.R.G. and T.K.; Writing—original draft preparation, A.R.G.; writing—review and editing, S.P.T.; supervision, S.P.T. and W.M.; funding acquisition, S.P.T. All authors have read and agreed to the published version of the manuscript.

Funding

This research project is supported by the Thailand Science Research and Innovation (TSRI), Basic Research Fund: The fiscal year 2021 under project number 64A306000046.

Institutional Review Board Statement

Not applicable.

Informed Consent Statement

Not applicable.

Data Availability Statement

Not applicable.

Acknowledgments

The authors are grateful to Vannapa Lukhnawat for her great support of the chromatographic analysis and Pongsak Imprasithichai for supplying the CS samples.

Conflicts of Interest

The authors declare no conflict of interest.

References

  1. International Coffee Organization. 2021. Available online: https://www.ico.org/prices/new-consumption-table.pdf (accessed on 7 June 2022).
  2. International Coffee Organization. 2021. Available online: https://www.ico.org/prices/m1-exports.pdf (accessed on 28 November 2021).
  3. Mussatto, S.I.; Machado, E.M.S.; Martins, S.; Teixeira, J.A. Production, Composition, and Application of Coffee and Its Industrial Residues. Food Bioprocess Technol. 2011, 4, 661–672. [Google Scholar] [CrossRef] [Green Version]
  4. Jiménez-Zamora, A.; Pastoriza, S.; Rufián Henares, J. Revalorization of coffee by-products. Prebiotic, antimicrobial and antioxidant properties. LWT-Food Sci. Technol. 2015, 61, 12–18. [Google Scholar] [CrossRef]
  5. Janissen, B.; Huynh, T. Chemical composition and value-adding applications of coffee industry by-products: A review. Resour. Conserv. Recycl. 2017, 128, 110–117. [Google Scholar] [CrossRef]
  6. Manakitsomboon, H. Total Consumption of Coffee in Thailand from 1990 to 2019. 2020. Available online: https://www.statista.com/statistics/314998/thailand-total-coffee-consumption/ (accessed on 28 November 2021).
  7. Blinová, L.; Sirotiak, M.; Bartošová, A.; Soldán, M. Review: Utilization of waste from coffee production. Res. Pap. 2017, 25, 91–102. [Google Scholar] [CrossRef] [Green Version]
  8. Costa, A.S.G.; Alves, R.C.; Vinha, A.F.; Costa, E.; Costa, C.S.G.; Nunes, M.A.; Almeida, A.A.; Santos-Silva, A.; Oliveira, M.B.P.P. Nutritional, chemical and antioxidant/pro-oxidant profiles of silverskin, a coffee roasting by-product. Food Chem. 2018, 267, 28–35. [Google Scholar] [CrossRef] [PubMed]
  9. Iriondo-dehond, A.; Iriondo-dehond, M.; Del Castillo, M.D. Applications of Compounds from Coffee Processing By-Products. Biomolecules 2020, 10, 1219. [Google Scholar] [CrossRef] [PubMed]
  10. Ballesteros, L.F.; Teixeira, J.A.; Mussatto, S.I. Chemical, Functional, and Structural Properties of Spent Coffee Grounds and Coffee Silverskin. Food Bioprocess Technol. 2014, 7, 3493–3503. [Google Scholar] [CrossRef] [Green Version]
  11. Costa, A.S.G.; Alves, R.C.; Vinha, A.F.; Barreira, S.V.P.; Nunes, M.A.; Cunha, L.M.; Oliveira, M.B.P.P. Optimization of antioxidants extraction from coffee silverskin, a roasting by-product, having in view a sustainable process. Ind. Crops Prod. 2014, 53, 350–357. [Google Scholar] [CrossRef]
  12. Bessada, S.M.F.F.; Alves, R.C.; Oliveira, M.B.P.P.P. Coffee silverskin: A review on potential cosmetic applications. Cosmetics 2018, 5, 5. [Google Scholar] [CrossRef] [Green Version]
  13. Alves, R.C.; Rodrigues, F.; Antónia Nunes, M.; Vinha, A.F.; Oliveira, M.B.P.P. Oliveira, State of the art in coffee processing by-products. In Handbook of Coffee Processing By-Products; Elsevier Inc.: Amsterdam, The Netherlands, 2017; ISBN 9780128112915. [Google Scholar]
  14. Bresciani, L.; Calani, L.; Bruni, R.; Brighenti, F.; Del Rio, D. Phenolic composition, caffeine content and antioxidant capacity of coffee silverskin. Food Res. Int. 2014, 61, 196–201. [Google Scholar] [CrossRef]
  15. Mesías, M.; Navarro, M.; Martínez-Saez, N.; Ullate, M.; del Castillo, M.D.; Morales, F.J. Antiglycative and carbonyl trapping properties of the water soluble fraction of coffee silverskin. Food Res. Int. 2014, 62, 1120–1126. [Google Scholar] [CrossRef] [Green Version]
  16. Narita, Y.; Inouye, K. Review on utilization and composition of coffee silverskin. Food Res. Int. 2014, 61, 16–22. [Google Scholar] [CrossRef] [Green Version]
  17. Ballesteros, L.F.; Teixeira, J.A.; Mussatto, S.I. Selection of the Solvent and Extraction Conditions for Maximum Recovery of Antioxidant Phenolic Compounds from Coffee Silverskin. Food Bioprocess Technol. 2014, 7, 1322–1332. [Google Scholar] [CrossRef] [Green Version]
  18. Narita, Y.; Inouye, K. High antioxidant activity of coffee silverskin extracts obtained by the treatment of coffee silverskin with subcritical water. Food Chem. 2012, 135, 943–949. [Google Scholar] [CrossRef] [PubMed] [Green Version]
  19. Borrelli, R.C.; Esposito, F.; Napolitano, A.; Ritieni, A.; Fogliano, V. Characterization of a New Potential Functional Ingredient: Coffee Silverskin. J. Agric. Food Chem. 2004, 52, 1338–1343. [Google Scholar] [CrossRef] [PubMed]
  20. Nzekoue, F.K.; Angeloni, S.; Navarini, L.; Angeloni, C.; Freschi, M.; Hrelia, S.; Vitali, L.A.; Sagratini, G.; Vittori, S.; Caprioli, G. Coffee silverskin extracts: Quantification of 30 bioactive compounds by a new HPLC-MS/MS method and evaluation of their antioxidant and antibacterial activities. Food Res. Int. 2020, 133, 109–128. [Google Scholar] [CrossRef] [PubMed]
  21. Cheng, B.; Furtado, A.; Smyth, H.E.; Henry, R.J. Influence of genotype and environment on coffee quality. Trends Food Sci. Technol. 2016, 57, 20–30. [Google Scholar] [CrossRef] [Green Version]
  22. Iriondo-Dehond, A.; Rios, M.B.; Herrera, T.; Rodriguez-Bertos, A.; Nuñez, F.; Andres, M.I.S.; Sanchez-Fortun, S.; Del Castillo, M.D. Coffee silverskin extract: Nutritional value, safety and effect on key biological functions. Nutrients 2019, 11, 2693. [Google Scholar] [CrossRef] [PubMed] [Green Version]
  23. Tajik, N.; Tajik, M.; Mack, I.; Enck, P. The potential effects of chlorogenic acid, the main phenolic components in coffee, on health: A comprehensive review of the literature. Eur. J. Nutr. 2017, 56, 2215–2244. [Google Scholar] [CrossRef] [PubMed]
  24. Silva, T.; Oliveira, C.; Borges, F. Caffeic acid derivatives, analogs and applications: A patent review (2009–2013). Expert Opin. Ther. Pat. 2014, 24, 1257–1270. [Google Scholar] [CrossRef] [PubMed]
  25. Iriondo-DeHond, A.; Martorell, P.; Genovés, S.; Ramón, D.; Stamatakis, K.; Fresno, M.; Molina, A.; Del Castillo, M.D. Coffee silverskin extract protects against accelerated aging caused by oxidative agents. Molecules 2016, 21, 721. [Google Scholar] [CrossRef] [Green Version]
  26. Fernandez-Gomez, B.; Lezama, A.; Amigo-Benavent, M.; Ullate, M.; Herrero, M.; Martín, M.Á.; Mesa, M.D.; del Castillo, M.D. Insights on the health benefits of the bioactive compounds of coffee silverskin extract. J. Funct. Foods 2016, 25, 197–207. [Google Scholar] [CrossRef] [Green Version]
  27. Castillo, M.; Fernandez-Gomez, B.; Martinez-Saez, N.; Iriondo-DeHond, A.; Martirosyan, D.; Mesa, M. Coffee Silverskin Extract for Aging and Chronic Diseases. In Functional Foods for Chronic Diseases; Createspace: Scotts Valley, CA, USA, 2016; pp. 386–409. ISBN 978-1536919431. [Google Scholar]
  28. Magnani, C.; Isaac, V.L.B.; Correa, M.A.; Salgado, H.R.N. Caffeic acid: A review of its potential use in medications and cosmetics. Anal. Methods 2014, 6, 3203–3210. [Google Scholar] [CrossRef]
  29. Zhang, Q.-W.; Lin, L.-G.; Ye, W.-C. Techniques for extraction and isolation of natural products: A comprehensive review. Chin. Med. 2018, 13, 20. [Google Scholar] [CrossRef] [Green Version]
  30. Wen, L.; Zhang, Z.; Rai, D.; Sun, D.-W.; Tiwari, B. Ultrasound-assisted extraction (UAE) of bioactive compounds from coffee silverskin: Impact on phenolic content, antioxidant activity, and morphological characteristics. J. Food Process Eng. 2019, 42, e13191. [Google Scholar] [CrossRef]
  31. Barbosa-Pereira, L.; Guglielmetti, A.; Zeppa, G. Pulsed Electric Field Assisted Extraction of Bioactive Compounds from Cocoa Bean Shell and Coffee Silverskin. Food Bioprocess Technol. 2018, 11, 818–835. [Google Scholar] [CrossRef]
  32. Guglielmetti, A.; D’ignoti, V.; Ghirardello, D.; Belviso, S.; Zeppa, G. Optimization of ultrasound and microwave-assisted extraction of caffeoylquinic acids and caffeine from coffee silverskin using response surface methodology. Ital. J. Food Sci. 2017, 29, 409–423. [Google Scholar] [CrossRef]
  33. Özel, M.Z.; Göğüş, F. Subcritical Water as a Green Solvent for Plant Extraction. In Alternative Solvents for Natural Products Extraction; Chemat, F., Vian, M.A., Eds.; Springer: Berlin/Heidelberg, Germany, 2014; pp. 73–89. ISBN 9783662436288. [Google Scholar]
  34. Conde, T.; Mussatto, S.I. Isolation of polyphenols from spent coffee grounds and silverskin by mild hydrothermal pretreatment. Prep. Biochem. Biotechnol. 2016, 46, 406–409. [Google Scholar] [CrossRef] [Green Version]
  35. Procentese, A.; Raganati, F.; Olivieri, G.; Russo, M.E.; Marzocchella, A. Combined antioxidant-biofuel production from coffee silverskin. Appl. Microbiol. Biotechnol. 2019, 103, 1021–1029. [Google Scholar] [CrossRef] [PubMed]
  36. Maran, J.P.; Manikandan, S.; Thirugnanasambandham, K.; Nivetha, C.V.; Dinesh, R. Box–Behnken design based statistical modeling for ultrasound-assisted extraction of corn silk polysaccharide. Carbohydr. Polym. 2013, 92, 604–611. [Google Scholar] [CrossRef] [PubMed]
  37. Soraya, I.; Sulaiman, C.; Basri, M.; Reza, H.; Masoumi, F.; Chee, W.J.; Ashari, S.E. Effects of temperature, time, and solvent ratio on the extraction of phenolic compounds and the anti-radical activity of Clinacanthus nutans Lindau leaves by response surface methodology. Chem. Cent. J. 2017, 11, 54. [Google Scholar] [CrossRef]
  38. Mathews, P.G. Design of Experiments with MINITAB.; American Society for Quality (ASQ): Milwaukee, WI, USA, 2005; ISBN 9781628703368. [Google Scholar]
  39. Demirel, C.; Kabutey, A.; Herák, D.; Sedlaček, A.; Mizera, Č.; Dajbych, O. Using Box–Behnken Design Coupled with Response Surface Methodology for Optimizing Rapeseed Oil Expression Parameters under Heating and Freezing Conditions. Processes 2022, 10, 490. [Google Scholar] [CrossRef]
  40. Cha, J.; Kim, C.T.; Cho, Y.J. Optimizing extraction conditions for functional compounds from ginger (Zingiber officinale Roscoe) using response surface methodology. Food Sci. Biotechnol. 2020, 29, 379–385. [Google Scholar] [CrossRef] [PubMed]
  41. Pittol, V.; Ortega, G.G.; Doneda, E.; Bianchi, S.E.; Santos, M.C.; Koetz, M.; Henriques, A.T.; Bassani, V.L. Box-Behnken Design for Extraction Optimization Followed by High Performance Countercurrent Chromatography: Production of a Flavonoid-enriched Fraction from Achyrocline Satureioides. Planta Med. 2020, 86, 151–159. [Google Scholar] [CrossRef] [PubMed]
  42. Skrypnik, L.; Novikova, A. Response Surface Modeling and Optimization of Polyphenols Extraction from Apple Pomace Based on Nonionic Emulsifiers. Agronomy 2020, 10, 92. [Google Scholar] [CrossRef] [Green Version]
  43. Baba, S.A.; Malik, S.A. Determination of total phenolic and flavonoid content, antimicrobial and antioxidant activity of a root extract of Arisaema jacquemontii Blume. J. Taibah Univ. Sci. 2015, 9, 449–454. [Google Scholar] [CrossRef] [Green Version]
  44. Almeida, M.M.B.; de Sousa, P.H.M.; Arriaga, Â.M.C.; do Prado, G.M.; de Magalhães, C.E.C.; Maia, G.A.; de Lemos, T.L.G. Bioactive compounds and antioxidant activity of fresh exotic fruits from northeastern Brazil. Food Res. Int. 2011, 44, 2155–2159. [Google Scholar] [CrossRef] [Green Version]
  45. Craig, A.P.; Fields, C.; Liang, N.; Kitts, D.; Erickson, A. Performance review of a fast HPLC-UV method for the quantification of chlorogenic acids in green coffee bean extracts. Talanta 2016, 154, 481–485. [Google Scholar] [CrossRef] [Green Version]
  46. Murthy, P.S.; Naidu, M.M. Recovery of Phenolic Antioxidants and Functional Compounds from Coffee Industry By-Products. Food Bioprocess Technol. 2012, 5, 897–903. [Google Scholar] [CrossRef]
  47. Toschi, T.G.; Cardenia, V.; Bonaga, G.; Mandrioli, M.; Rodriguez-Estrada, M.T. Coffee silverskin: Characterization, possible uses, and safety aspects. J. Agric. Food Chem. 2014, 62, 10836–10844. [Google Scholar] [CrossRef]
  48. Khuwijitjaru, P.; Plernjit, J.; Suaylam, B.; Samuhaseneetoo, S.; Pongsawatmanit, R.; Adachi, S. Degradation kinetics of some phenolic compounds in subcritical water and radical scavenging activity of their degradation products. Can. J. Chem. Eng. 2014, 92, 810–815. [Google Scholar] [CrossRef]
  49. Khajeh, M. Optimization of process variables for essential oil components from Satureja hortensis by supercritical fluid extraction using Box-Behnken experimental design. J. Supercrit. Fluids 2011, 55, 944–948. [Google Scholar] [CrossRef]
  50. Mayanga-Torres, P.C.; Lachos-Perez, D.; Rezende, C.A.; Prado, J.M.; Ma, Z.; Tompsett, G.T.; Timko, M.T.; Forster-Carneiro, T. Valorization of coffee industry residues by subcritical water hydrolysis: Recovery of sugars and phenolic compounds. J. Supercrit. Fluids 2017, 120, 75–85. [Google Scholar] [CrossRef]
  51. Sato, T.; Takahata, T.; Honma, T.; Watanabe, M.; Wagatsuma, M.; Matsuda, S.; Smith, R.L.; Itoh, N. Hydrothermal Extraction of Antioxidant Compounds from Green Coffee Beans and Decomposition Kinetics of 3-O-Caffeoylquinic Acid. Ind. Eng. Chem. Res. 2018, 57, 7624–7632. [Google Scholar] [CrossRef]
  52. Lachos-Perez, D.; Brown, A.B.; Mudhoo, A.; Martinez, J.; Timko, M.T.; Rostagno, M.A.; Forster-Carneiro, T. Applications of subcritical and supercritical water conditions for extraction, hydrolysis, gasification, and carbonization of biomass: A critical review. Biofuel Res. J. 2017, 4, 611–626. [Google Scholar] [CrossRef]
  53. Pereira, D.M.; Valentão, P.; Pereira, J.A.; Andrade, P.B. Phenolics: From chemistry to biology. Molecules 2009, 14, 2202–2211. [Google Scholar] [CrossRef]
  54. Clarke, C.J.; Tu, W.-C.; Levers, O.; Bröhl, A.; Hallett, J.P. Green and Sustainable Solvents in Chemical Processes. Chem. Rev. 2018, 118, 747–800. [Google Scholar] [CrossRef]
  55. Carr, A.G.; Mammucari, R.; Foster, N.R. A review of subcritical water as a solvent and its utilisation for the processing of hydrophobic organic compounds. Chem. Eng. J. 2011, 172, 1–17. [Google Scholar] [CrossRef]
  56. Ko, M.J.; Cheigh, C.I.; Chung, M.S. Relationship analysis between flavonoids structure and subcritical water extraction (SWE). Food Chem. 2014, 143, 147–155. [Google Scholar] [CrossRef]
  57. Pinelo, M.; Rubilar, M.; Jerez, M.; Sineiro, J.; Núñez, M.J. Effect of solvent, temperature, and solvent-to-solid ratio on the total phenolic content and antiradical activity of extracts from different components of grape pomace. J. Agric. Food Chem. 2005, 53, 2111–2117. [Google Scholar] [CrossRef]
Figure 1. Experimental procedure.
Sustainability 14 08435 g001
Figure 2. Pareto chart for the standardized effects on TPC, AA, and T-CQA obtained from 2k factorial designs.
Sustainability 14 08435 g002
Figure 3. Response surface plots for the effects of the mutual interactions of independent variables on the TPC, AA, and T-CQA.
Sustainability 14 08435 g003
Figure 4. Optimal parameters for maximum T-CQA extraction from the CS extract.
Sustainability 14 08435 g004
Table 1. Coded and uncoded variable levels for the BBD.
SymbolFactorCoded and Uncoded Level
−10+1
X1Temperature (°C)120180240
X2Time (minutes)103560
X3Solid-to-liquid ratio (g/mL)102540
Table 2. BBD matrix with independent variables and observed values for the dependent variables (n = 3).
Run OrderBlockIndependent VariablesDependent Variables
X1X2X3Y1Y2Y3
CodedUncodedCodedUncodedCodedUncoded
111240−11001:2593.83 ± 6.1126.12 ± 3.270.99 ± 0.26
21018003501:2570.05 ± 5.0617.54 ± 2.281.66 ± 0.19
31−1120035−11:1023.70 ± 2.105.71 ± 1.902.01 ± 0.23
410180−11011:4065.06± 4.5814.89 ± 0.852.33 ± 0.32
51018003501:2569.96 ± 3.2517.44 ± 1.661.81 ± 0.21
61124016001:2575.03 ± 3.8221.52 ± 2.150.50 ± 0.13
71124003511:4091.97 ± 4.1524.94 ± 3.870.99 ± 0.27
81018003501:2572.81 ± 3.2517.42 ± 2.481.62 ± 0.19
911240035−11:1089.29 ± 4.6719.742 ± 2.870.48 ± 0.15
1010180−110−11:1042.65 ± 3.009.98 ± 1.392.04 ± 0.32
111−1120−11001:2519.01 ± 3.544.98 ± 1.281.66 ± 0.21
1210180160−11:1077.69 ± 9.2418.44 ± 2.261.69 ± 0.19
131−112016001:2524.00 ± 2.366.65 ± 1.931.25 ± 0.33
141018016011:4076.24 ± 3.3819.20 ± 2.091.49 ± 0.21
151−112003511:4019.09 ± 2.294.15 ± 0.430.61 ± 0.41
X1 = Extraction temperature (°C), X2 = Extraction time (min), X3 = S/L ratio, Y1 = TPC (mg GAE/g CS), Y2 = AA (mg TE/g CS), and Y3 = T-CQA (mg/g CS).
Table 3. p-Values for the significant terms in the polynomial regression equations and the coefficients in the final model.
Parametersp-Values for Each Parameter in the Polynomial Regression Equations
TPCAAT-CQA
Model0.0000.0000.000
Linear0.0000.0000.001
Temperature (X1)0.0000.0000.001
Time (X2)0.457-0.003
S/L Ratio (X3)0.0000.0000.160
Square0.0000.0000.000
Temperature × Temperature (X12)--0.000
Time × Time (X22)0.044--
S/L Ratio × S/L Ratio (X32)0.0000.000-
2-Way Interaction0.0100.0090.001
Temperature × Time (X1X2)0.036--
Temperature × S/L Ratio (X1X3)-0.009 0.001
Time × S/L Ratio (X2X3)0.010--
Lack of Fit0.1690.097 0.213
Model Summary
R2 (adjusted)87.91%94.97%90.21%
R2 (predicted)84.94%90.07%78.07%
R289.64%96.41%93.70%
Table 4. Polynomial regression equations for TPC, TA, and T-CQA of the CS extract.
ResponsesPolynomial Regression EquationsR2R2 (Adjusted)Lack of Fit
TPCY1 = −126.7 + 0.5457 X1 + 1.989 X2 + 6.063 X3 − 0.01056 X22 − 0.0884 X32 − 0.00448 X1X2 − 0.02419 X2X389.64%87.91%0.169
AAY2 = −10.28 + 0.0441 X1 + 0.805 X3 − 0.02022 X32 + 0.002586 X1X396.41%94.97%0.097
T-CQAY3 = −1.019 + 0.05592 X1 − 0.01043 X2 − 0.1023 X3− 0.000207 X12 + 0.000532 X1X393.70%90.21%0.213
Table 5. Predicted and actual response values for T-CQA, and the experimental values of the TPC, AA, and extraction yield obtained from the optimized extraction parameters.
T-CQA (mg CQA/g CS)TPC (mg GAE/g CS)AA (mg TE/g CS)Yield (%)
Predicted valueExperimental valueExperimental valueExperimental valueExperimental value
2.382.70 ± 0.2351.86 ± 5.9813.72 ± 2.0427.25 ± 1.57
Table 6. Comparison of the results of this study with the relevant literature.
Raw MaterialExtraction Method/ConditionsTPCAntioxidant Activity T-CQA (Based on 3-, 4-, and 5-CQA)References
(Based on DPPH Assay)
Coffee silverskinSubcritical water51.86 mg GAE/g CS13.722.70 mg/g CSThis study
Ratio 1: 10 (w/v)
Time 10 min
Coffee silverskinSolid–liquid extraction22 mg GAE/g CS11.5 mg TE/g CS1.5 mg 5-CQA/g CS[18]
Subcritical water
Ratio 1:50 (w/v)
Temperature 80 °C
Time 60 min
Coffee silverskinSolid–liquid extraction (Soxhlet)13.25.33 mg/g CS[46]
60% Isopropanol
Ratio 1:10 (w/v)
Temperature 27 °C
Time 20 min
Coffee silverskinSolid–liquid extraction16.1n.a.4.3 mg/g CS[14]
(Maceration)
1% formic acid
Ratio 1:10 (w/v)
Time 90 min
Coffee silverskinSolid–liquid extraction12.814.49n.a.[17]
(Waterbath)
60% Ethanol
Ratio 1:35 (w/v)
Temperature 60–65 °C
Time 30 min
Coffee silverskinSolid–liquid extraction22.213.9n.a.[35]
Mild hydrothermal pretreatment
Ratio 1:30 (w/v)
Temperature 120 °C
Time 20 min
Publisher’s Note: MDPI stays neutral with regard to jurisdictional claims in published maps and institutional affiliations.

