
Evaluating the Sustainable Traffic Flow Operational Features of U-turn Design with Advance Left Turn


Abstract
:1. Introduction
2. Methods
3. Model Development
- Direct left turns are prohibited at intersections.
- The intersection arm is long enough. Roads with a median can be set in the middle of the road section U-turn openings.
- The median, right turn lane and exit lane can meet the widening requirements of the dedicated lane, and the width of the dedicated lane can be appropriately compressed when there is insufficient space.
- According to the “Urban Road Engineering Design Specification” (CJJ37-2012), the main road is set up with 6 lanes in both directions, the design speed is 40–60 km/h, and the intersection is widened to 8 lanes in both directions; the secondary road is set up with 4 lanes in both directions, the design speed is 30–50 km/h, and the intersection is widened to 6 lanes in both directions; the turning speed is 0.5–0.7 times the design speed, the lane width is set at 3.5 m [12].
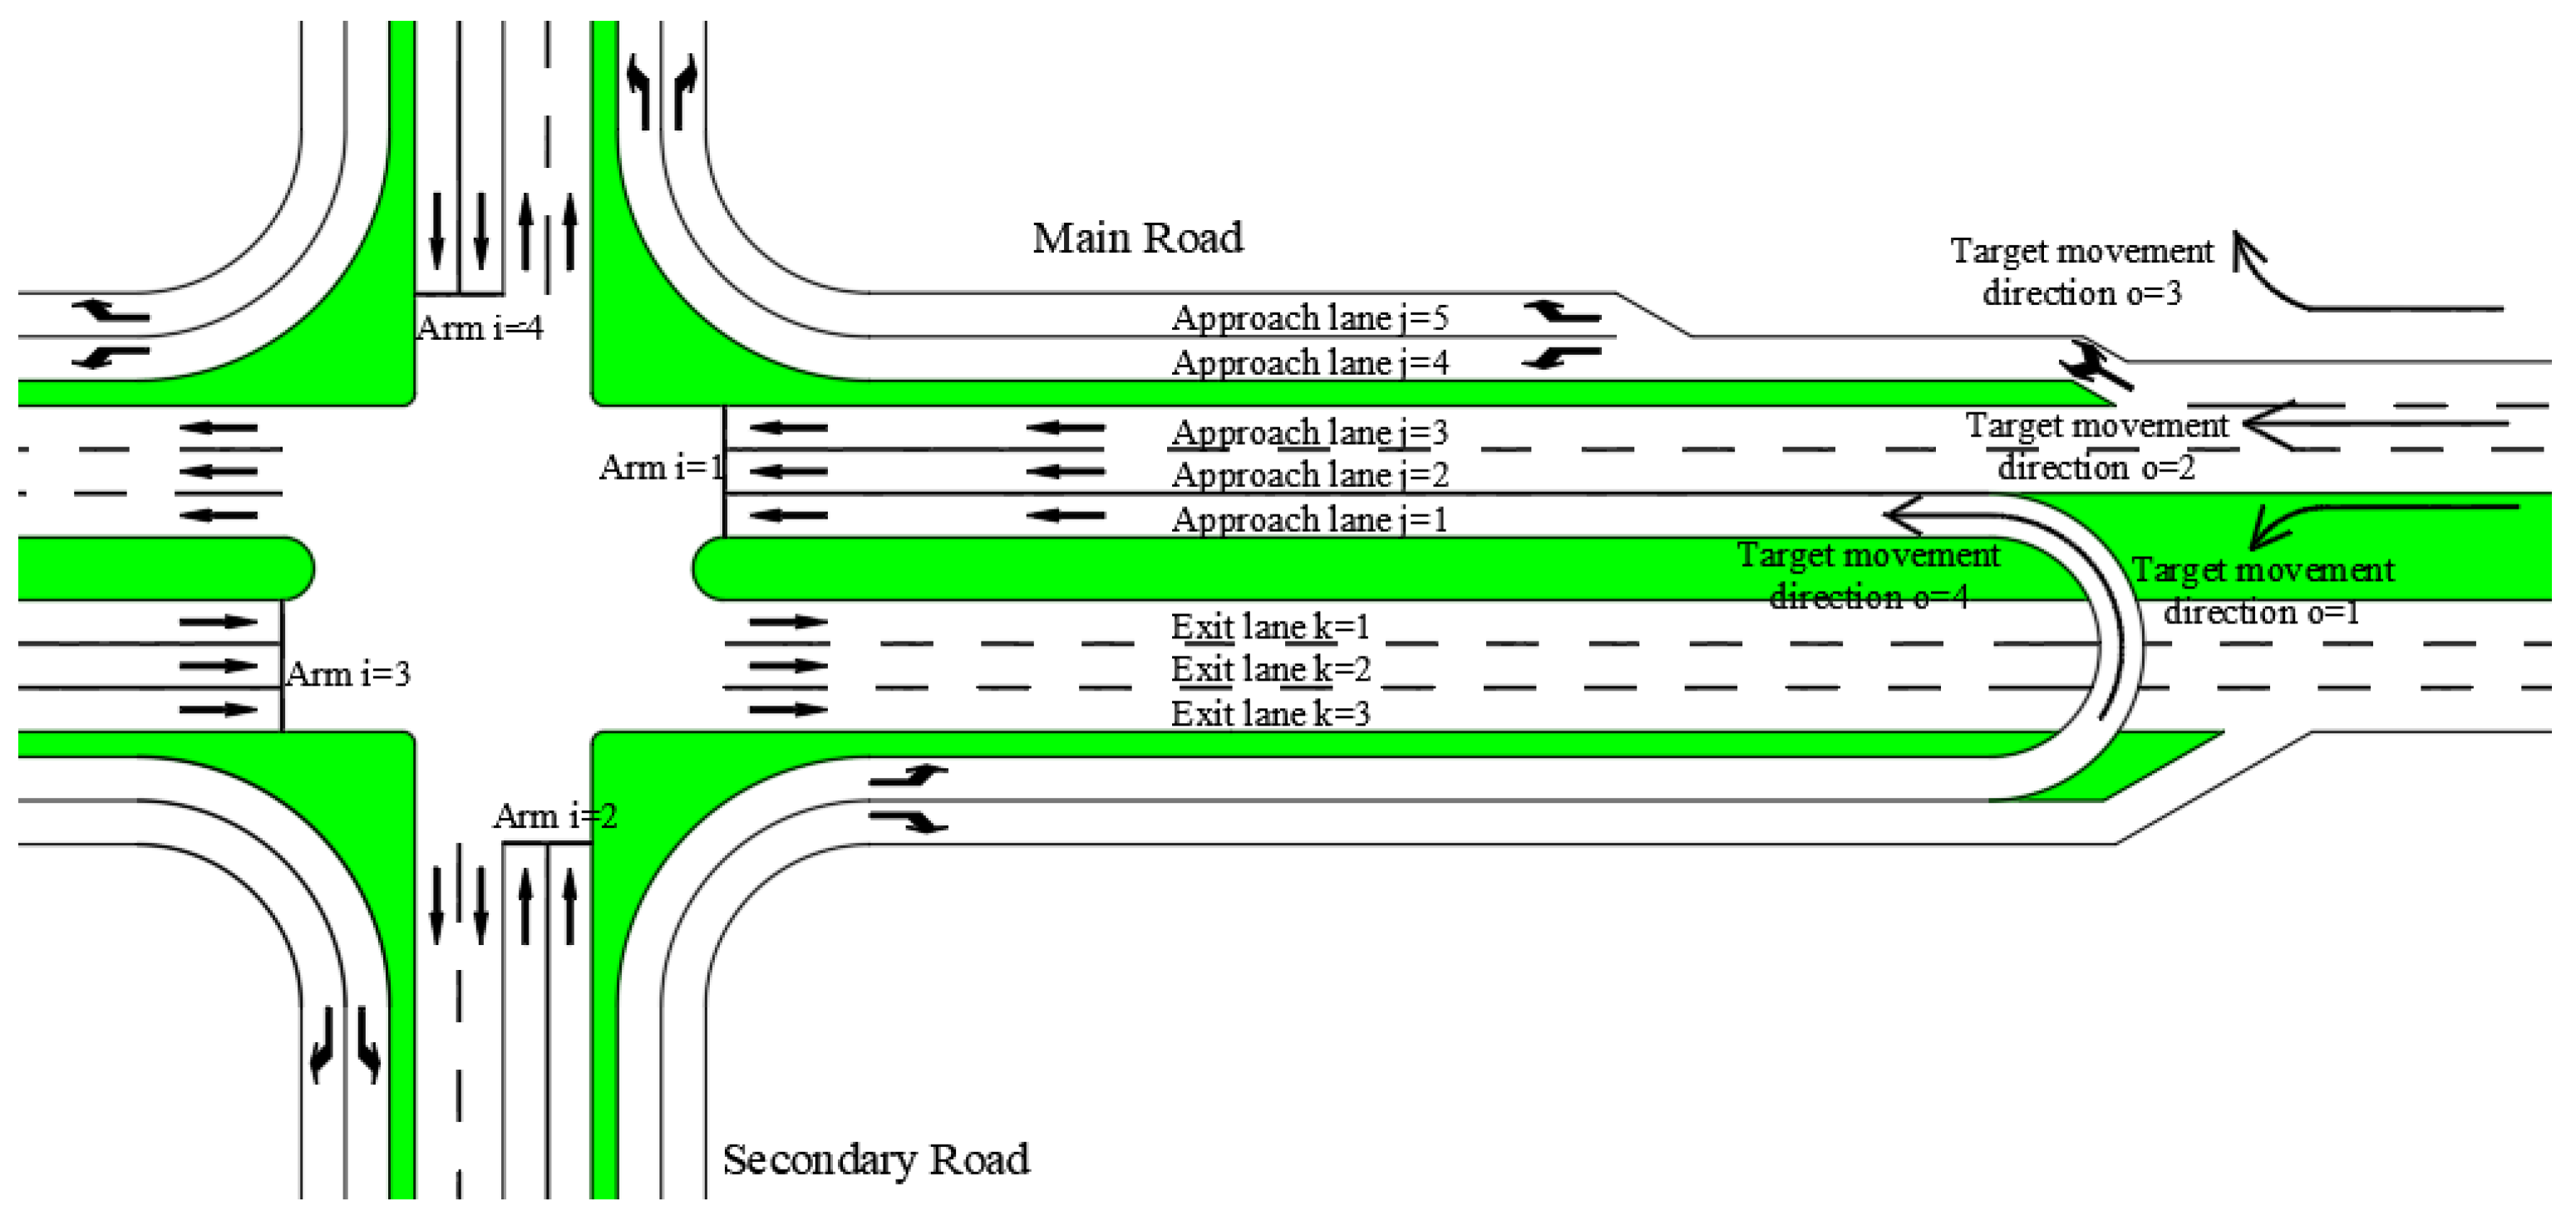
3.1. Traffic Variables
3.2. Traffic Signal Settings
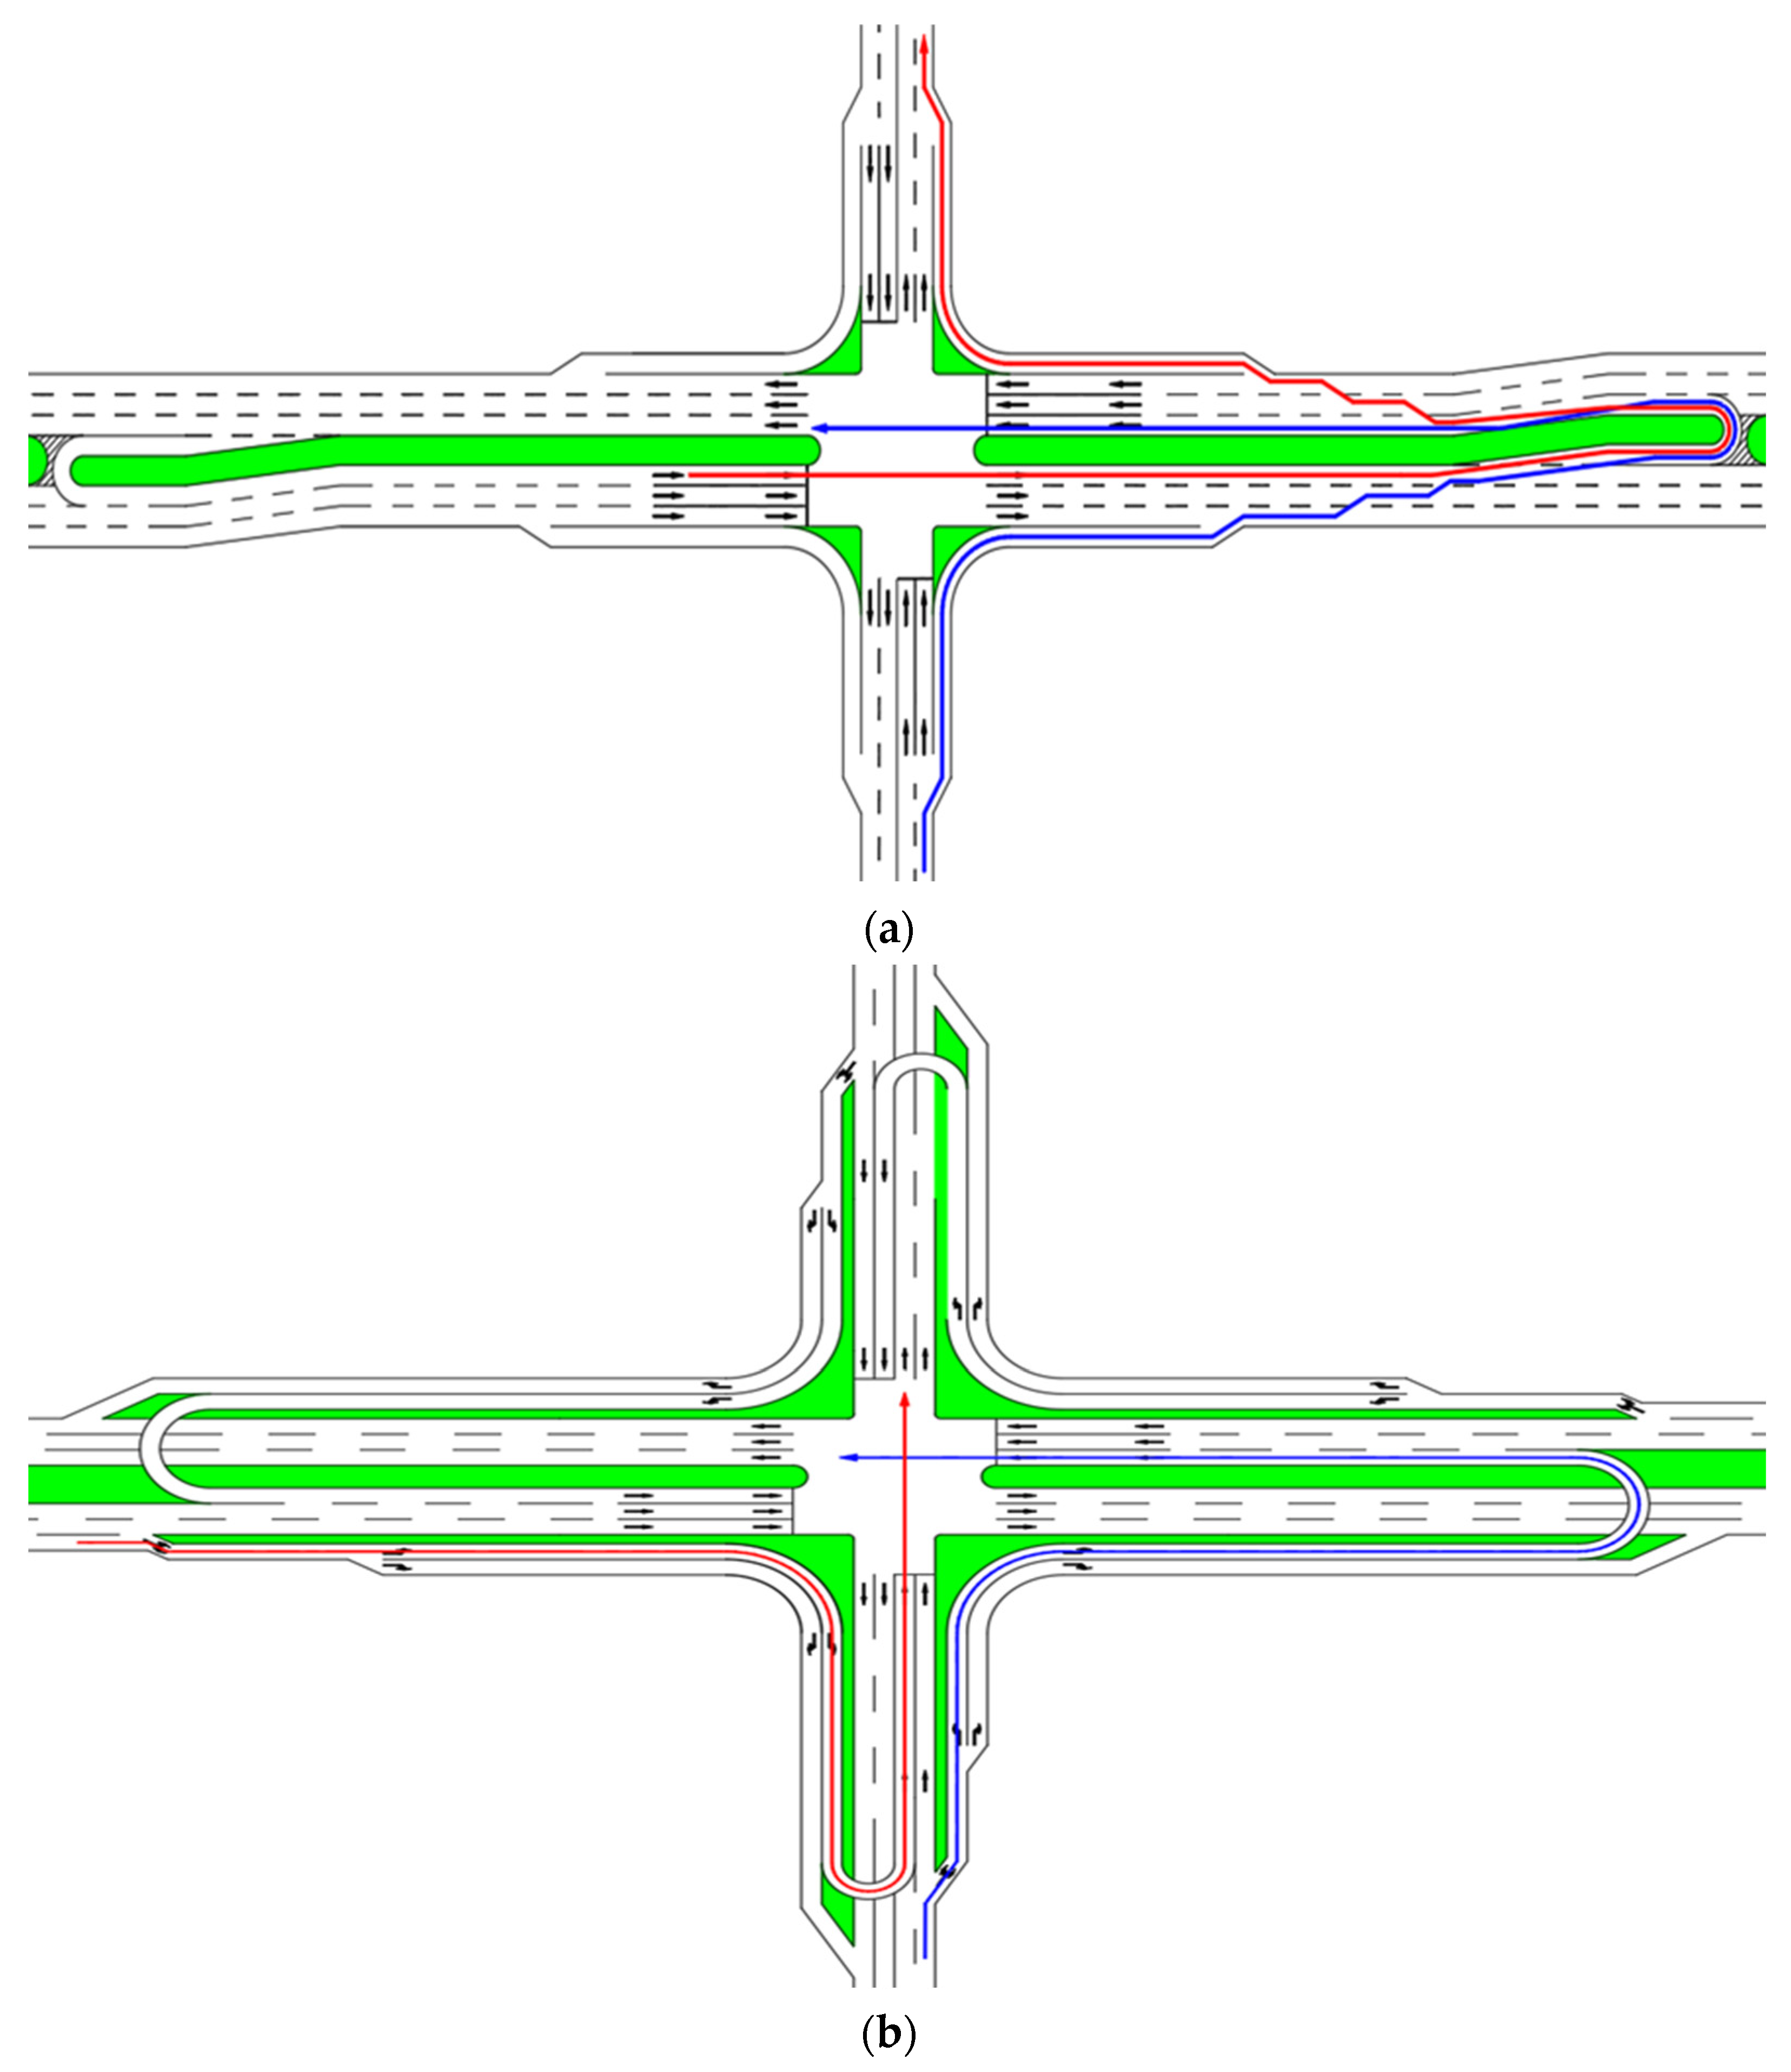
3.3. Geometry
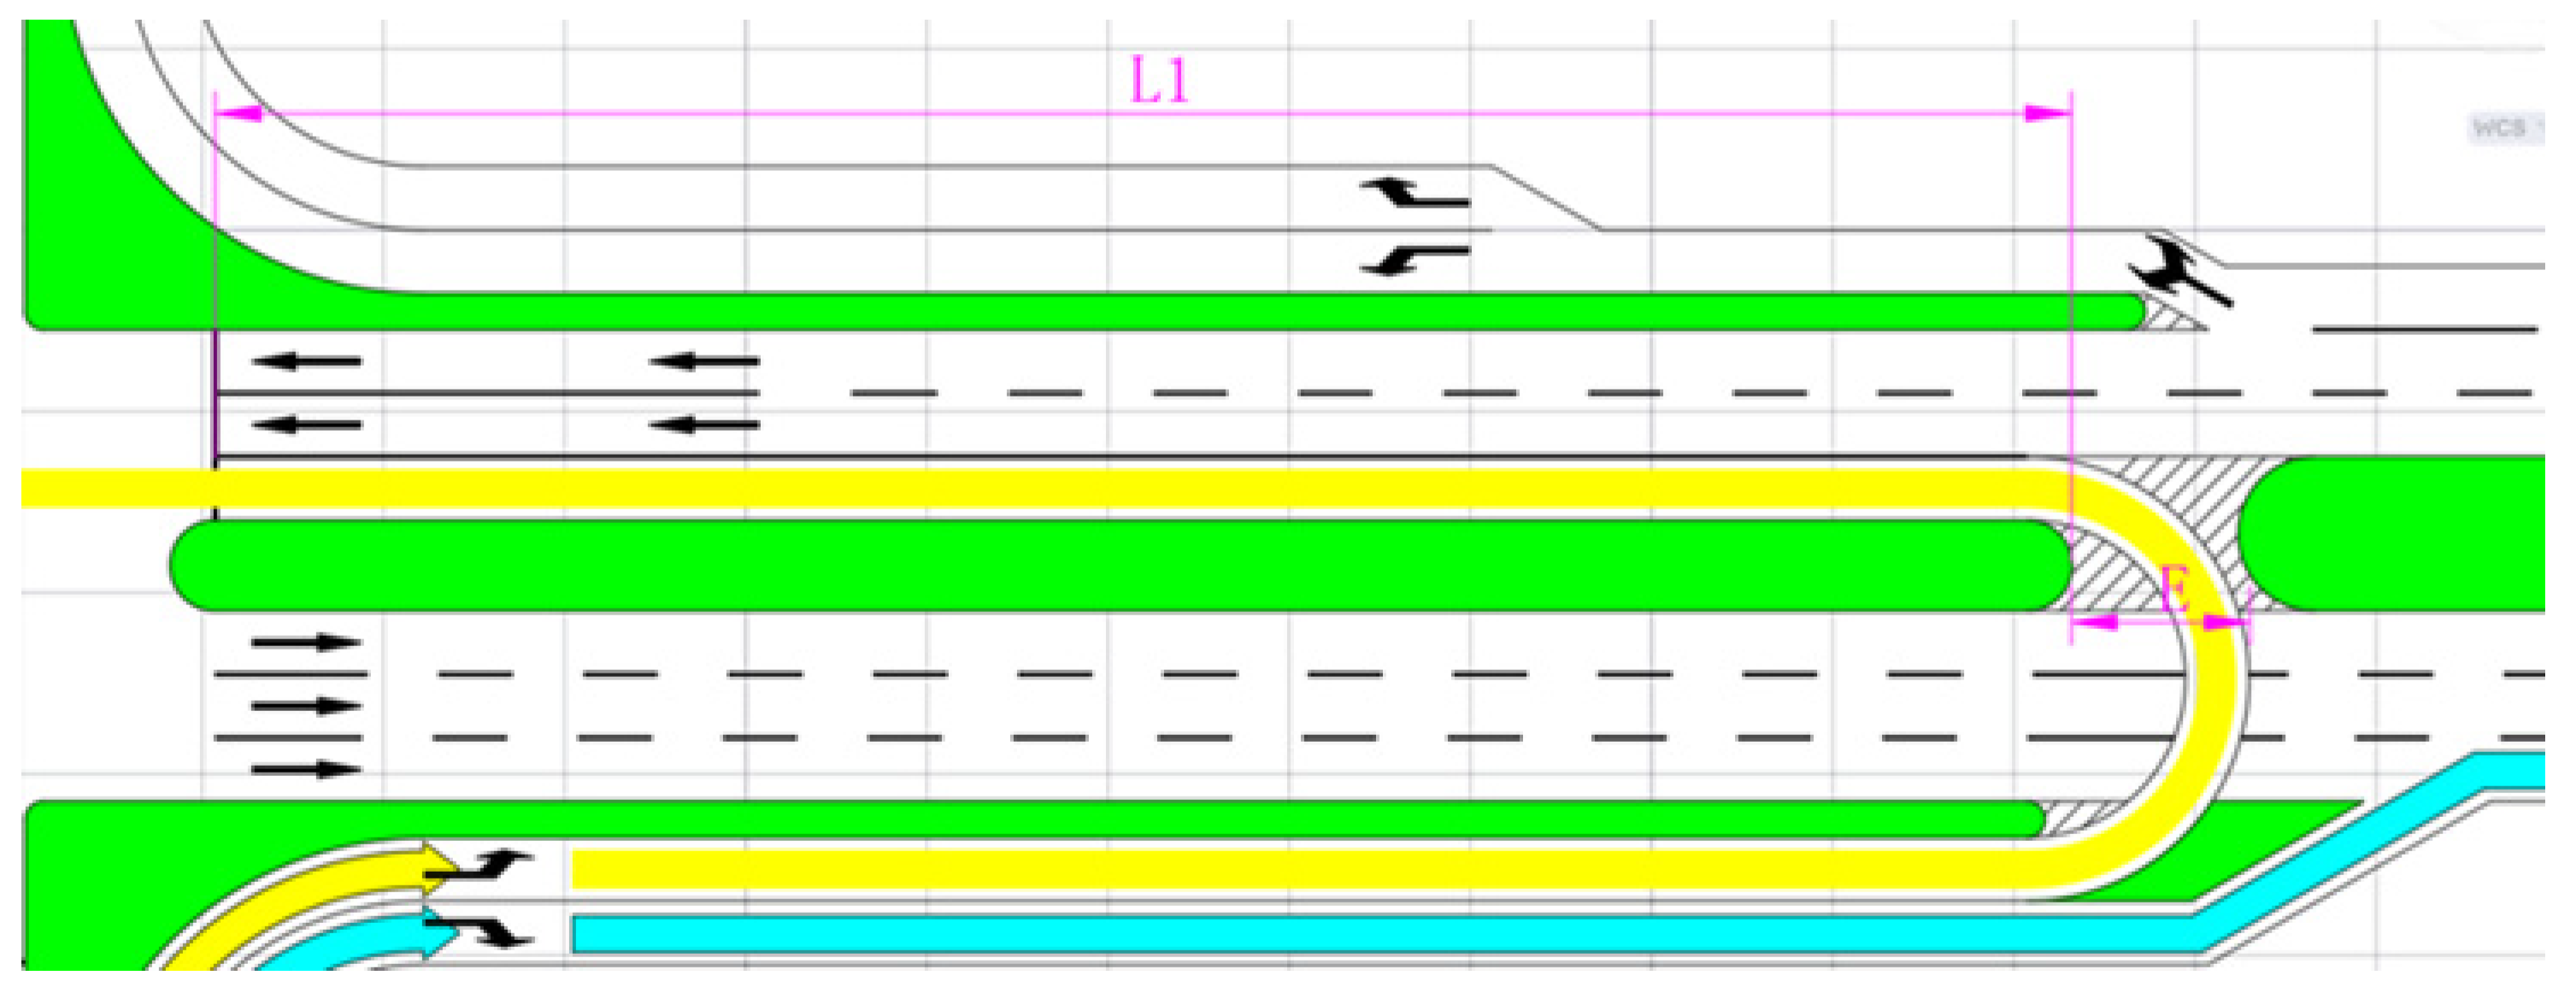
3.3.1. U-turn Openings and Intersection Spacing
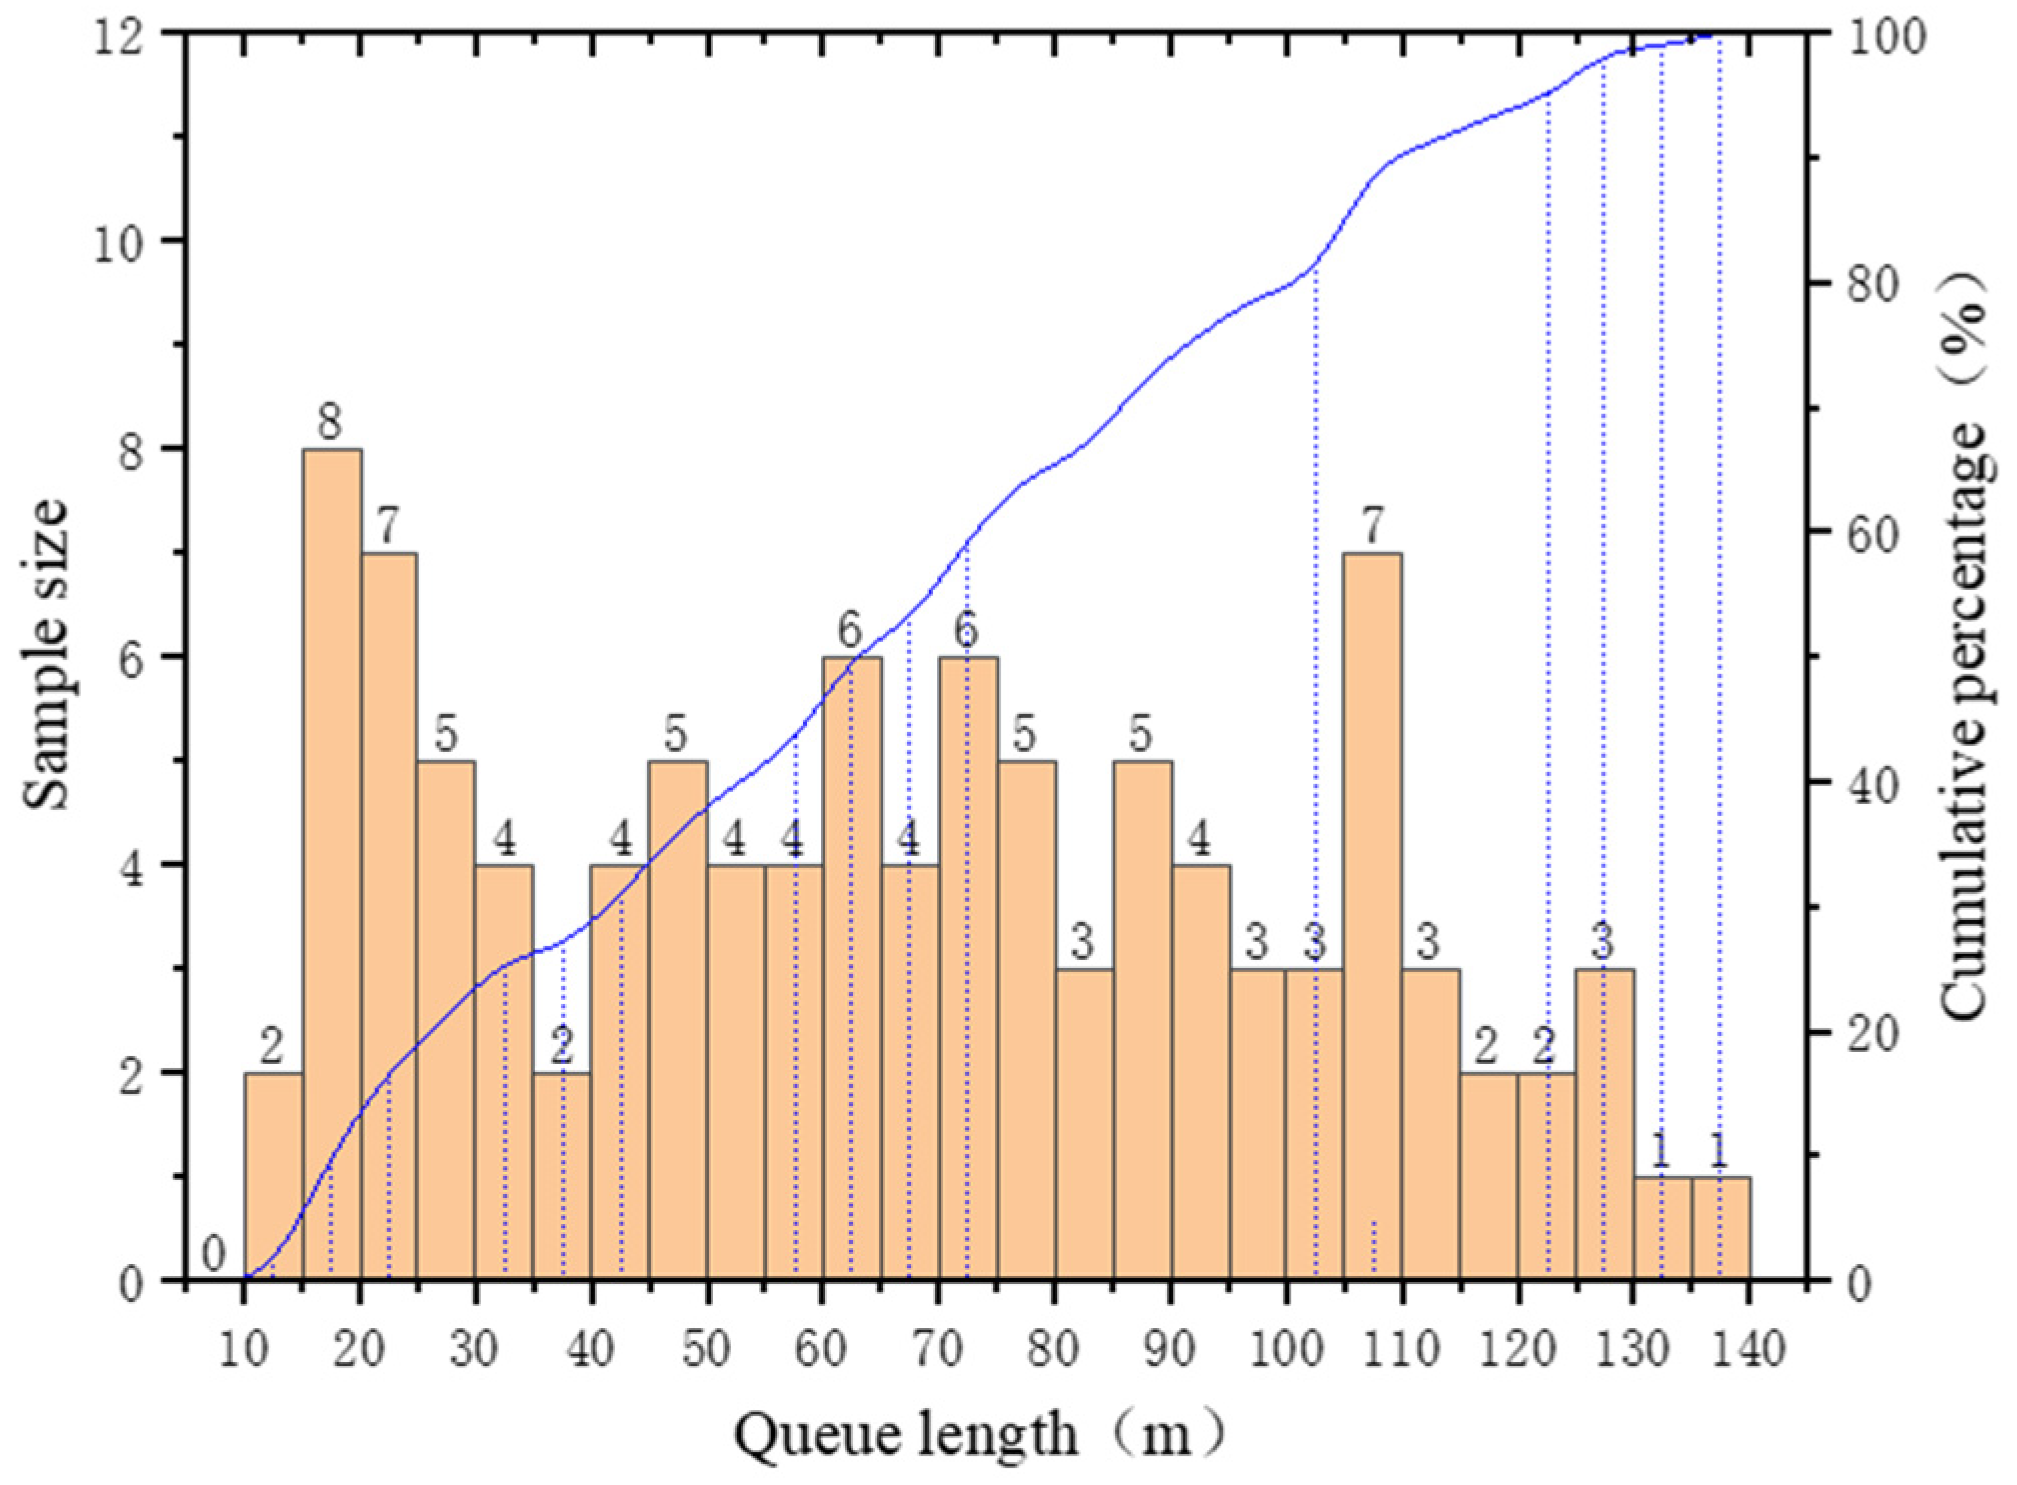
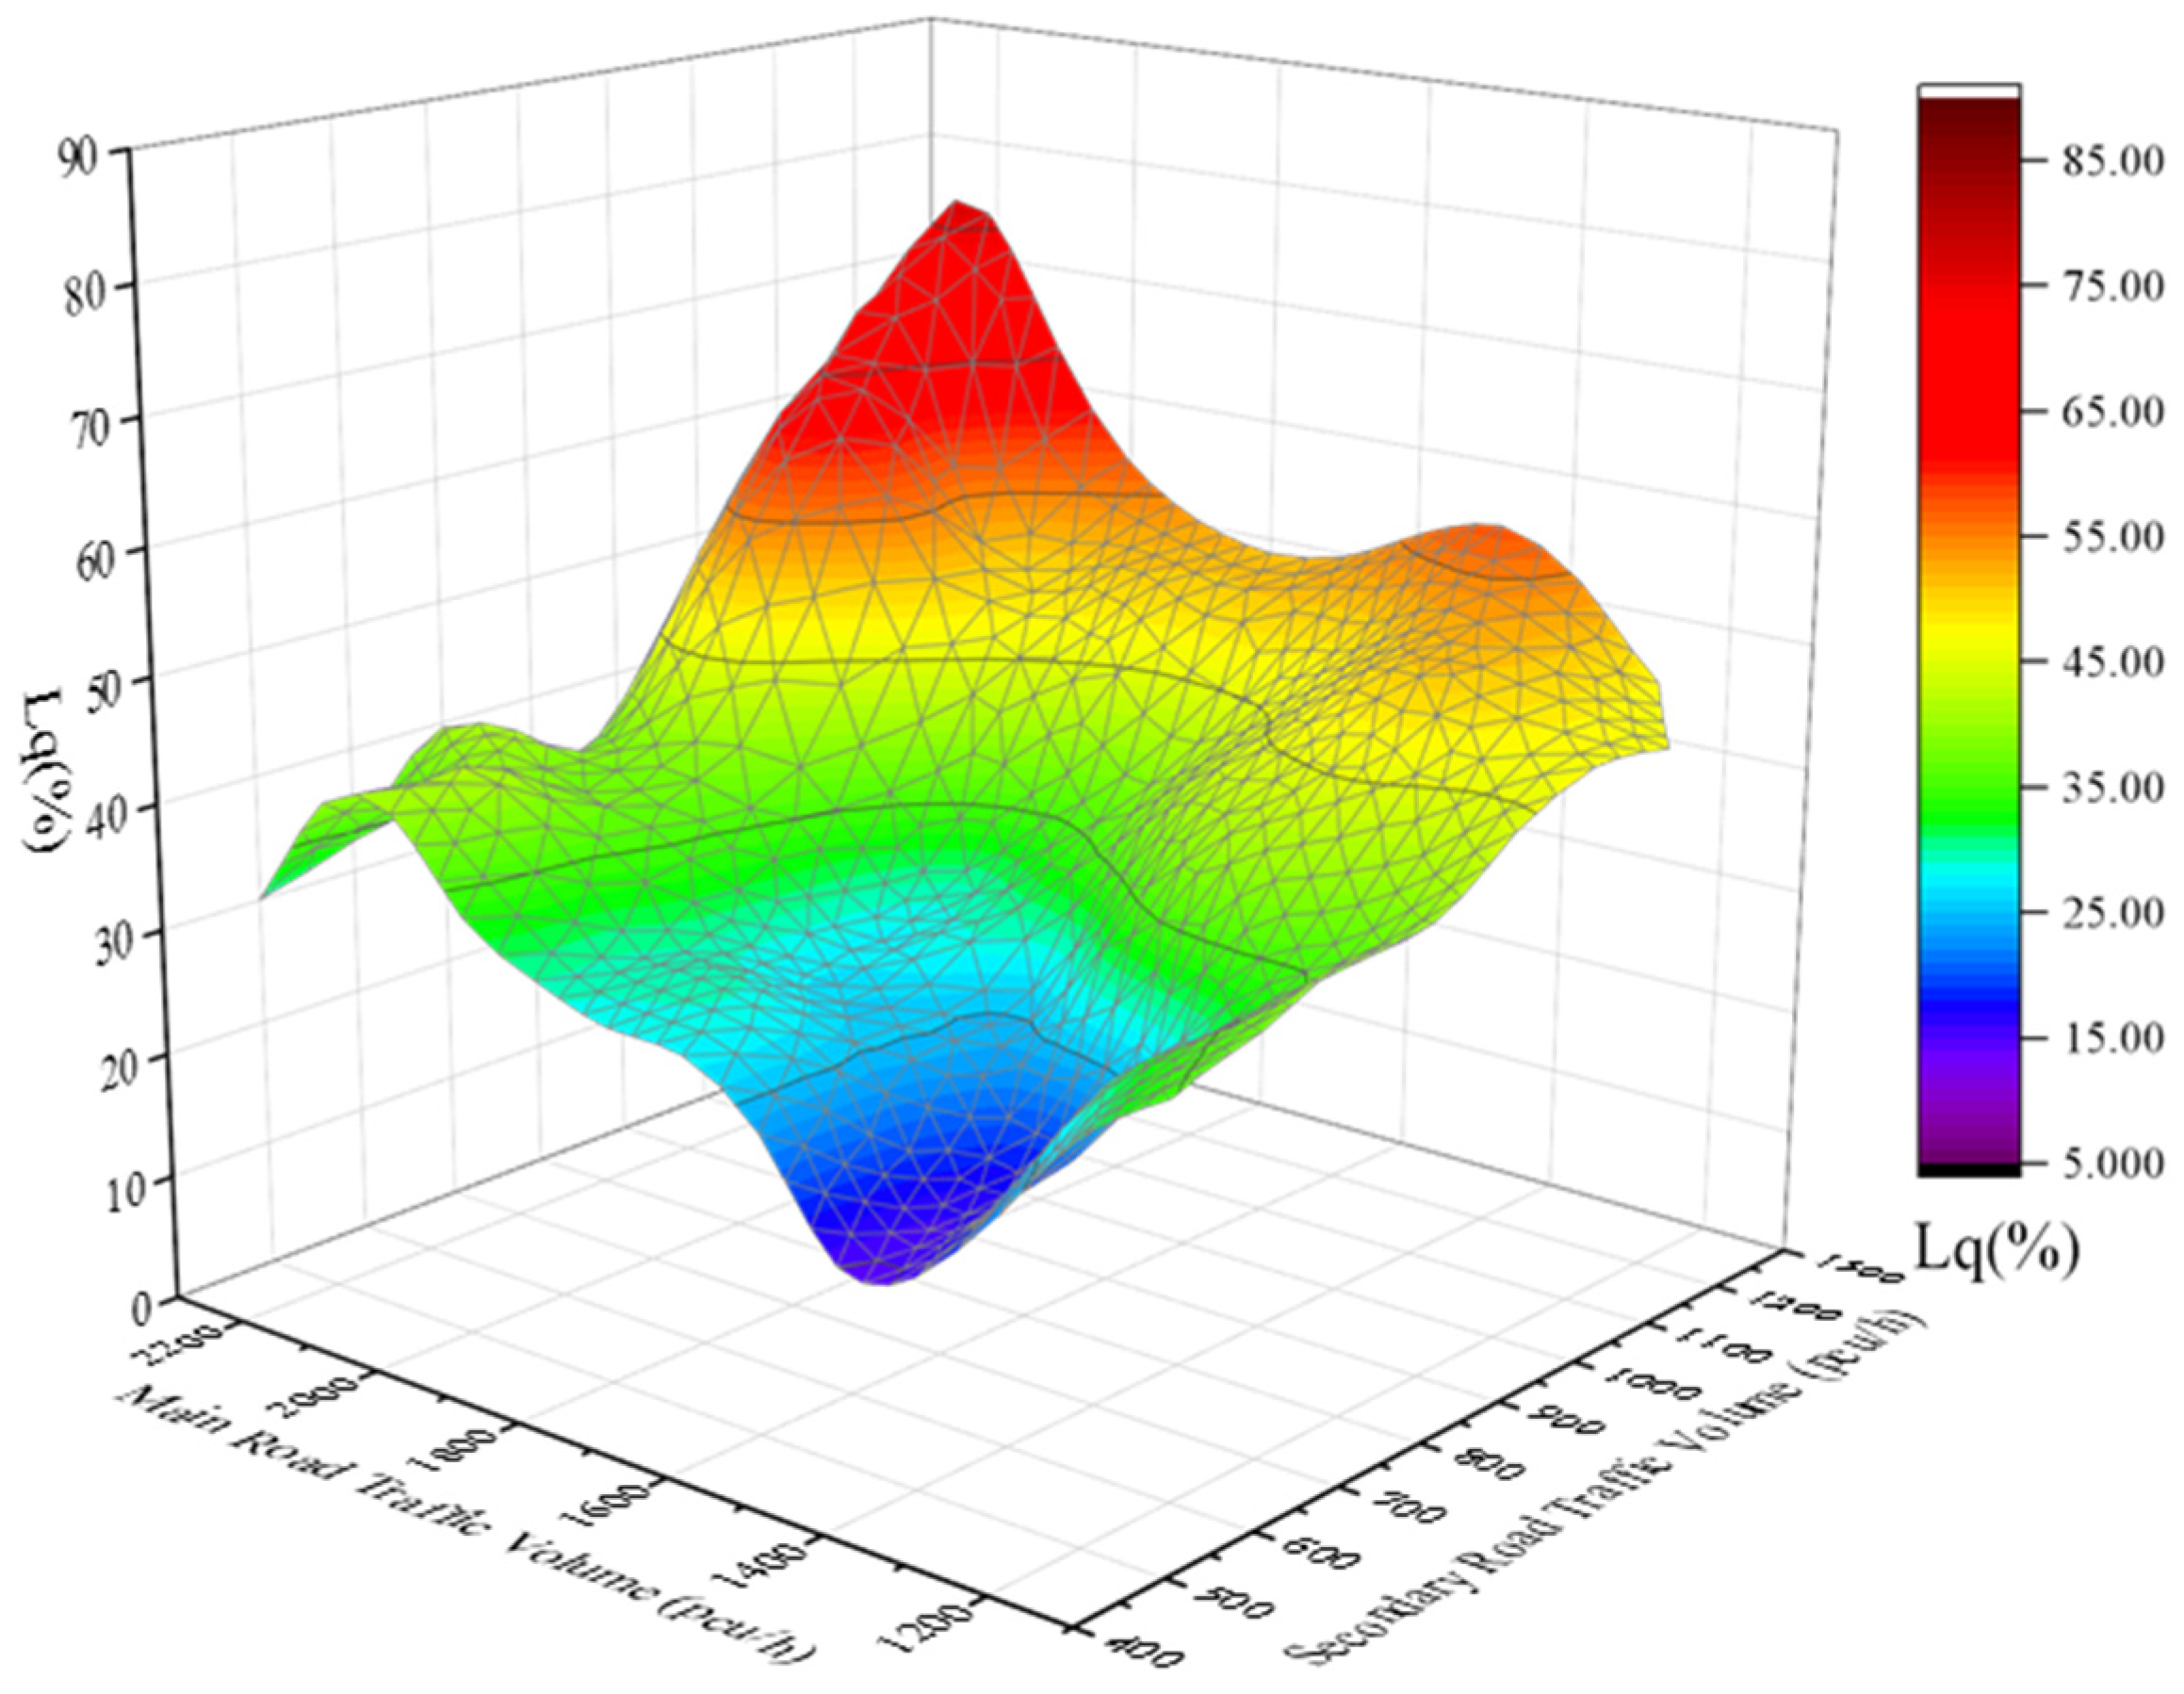
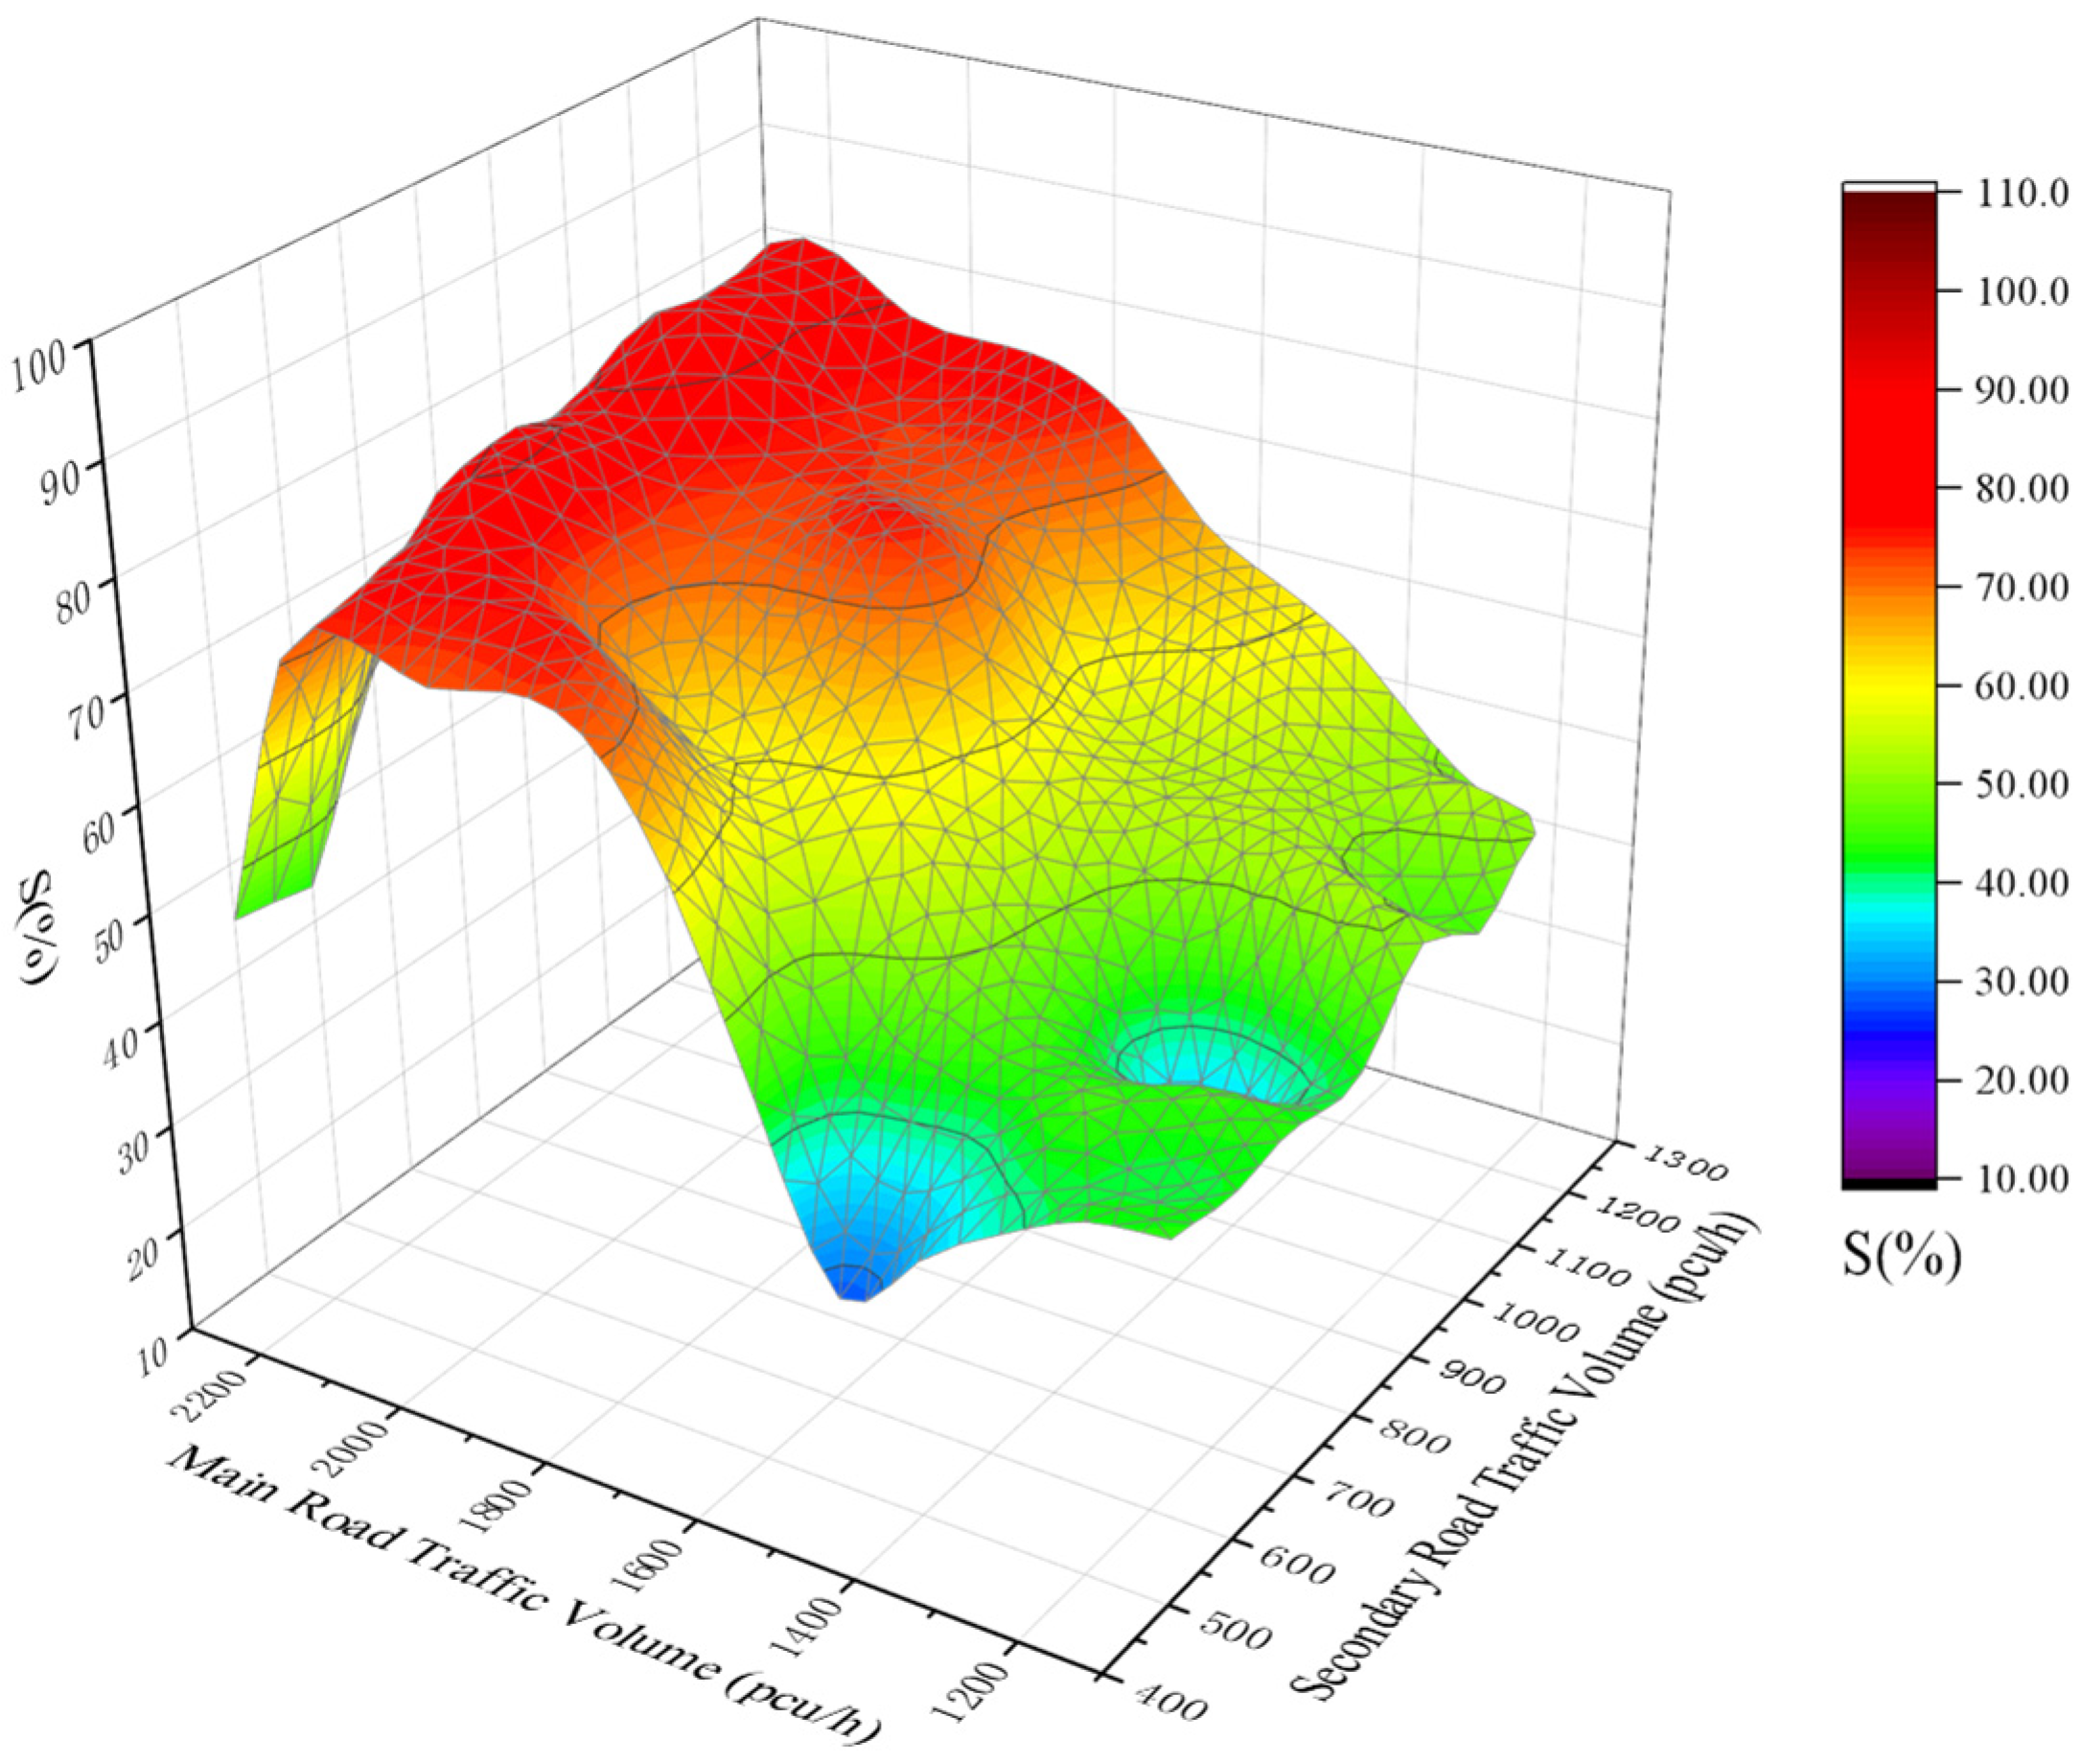
- Selection of L1 initial values. First, a simulation model was built for the conventional intersection, varying the traffic volume on the main and secondary roads, measuring the queue length of the approach lane in turn and conducting statistical analysis; the results are as follows.
- 2.
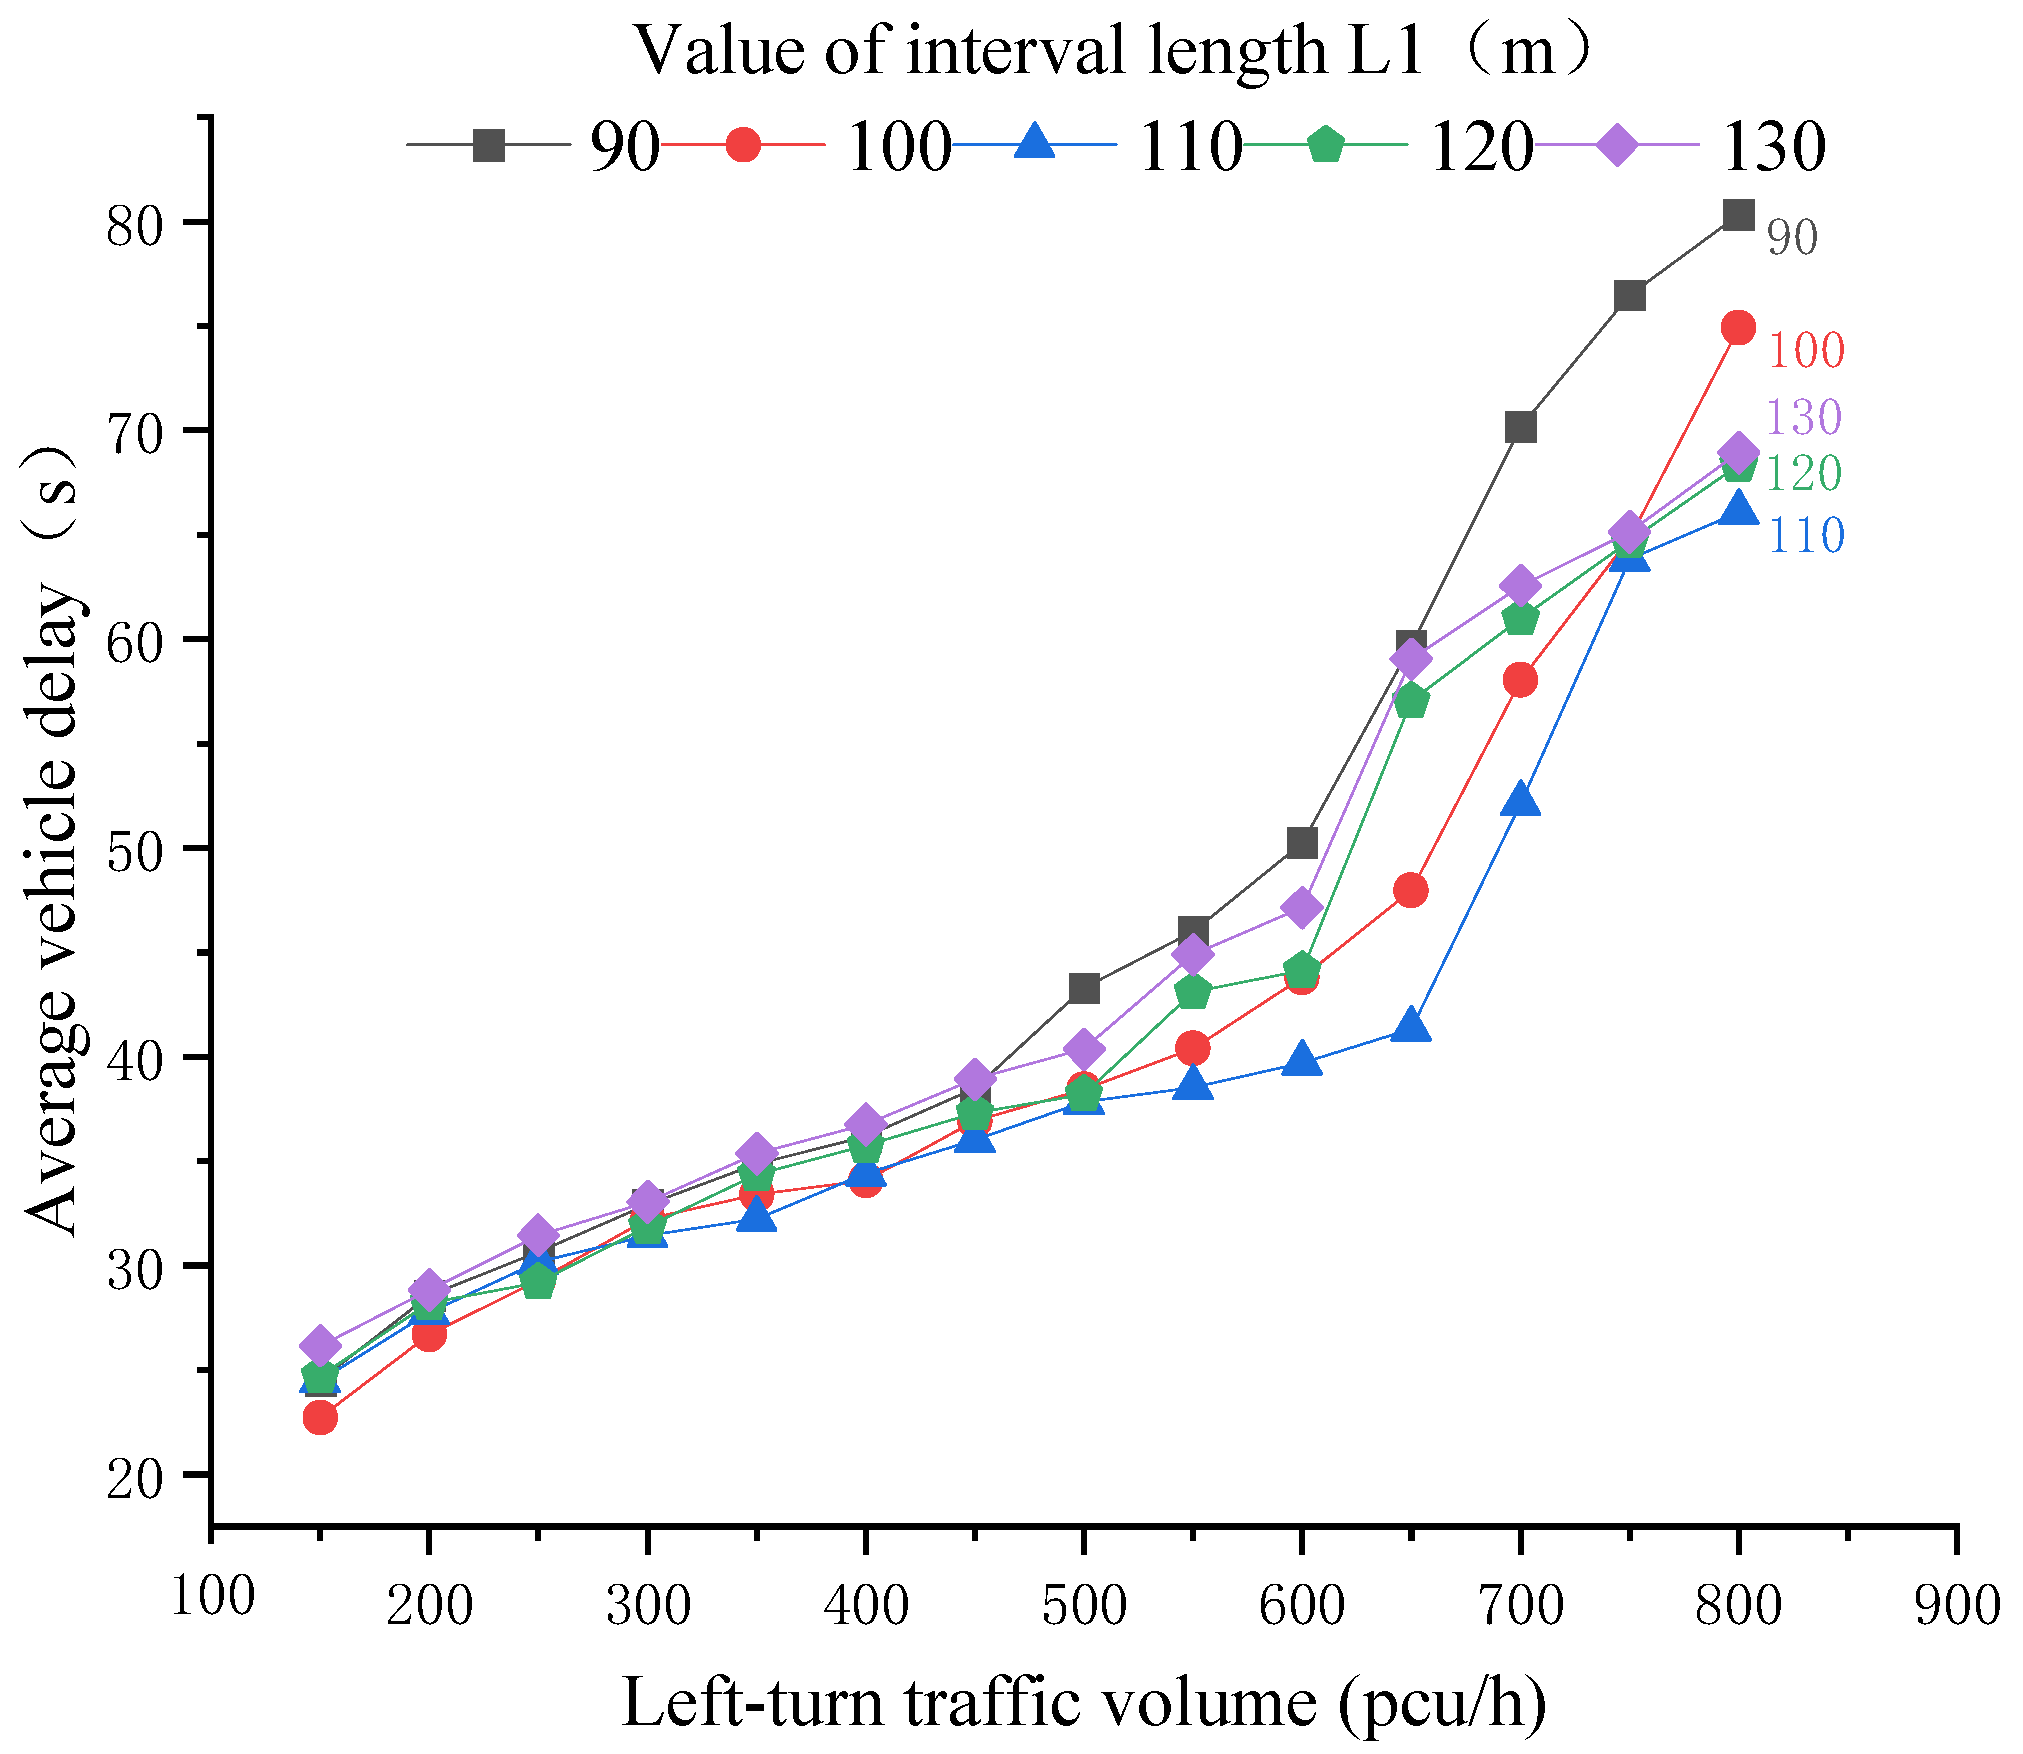
- Small range adjustments of L1 values to determine the final value. Taking a single approach lane of UALT as the object, fixing the length of L1 and varying the left-turn traffic volume to detect its delay, the delay results under different lengths are obtained, and are shown in Figure 5. The results are shown below. The results show that when the spacing is fixed, the delay shows an increasing trend with the increase of traffic volume. When the left-turn traffic volume is less than 300 pcu/h, the delay gap is small for all L1 values; when the left-turn traffic volume is greater than 300 pcu/h, the delay corresponding to L1, taken as 110 m, is the smallest.
3.3.2. Length of Central Median Opening
4. Development of Simulation Model
- 5.
- The southbound and northbound intersection arms do not have a median; the width of the side median is 1.5 m; the width of the median of the eastward and westward crossing arms is 5 m and the width of the side medians is 1.5 m. All lane widths are 3.5 m;
- 6.
- According to [16], the distance from the intersection stop line at the opening of the MUIT’s median is set at 350 m and the length of the opening is 9.4 m;
- 7.
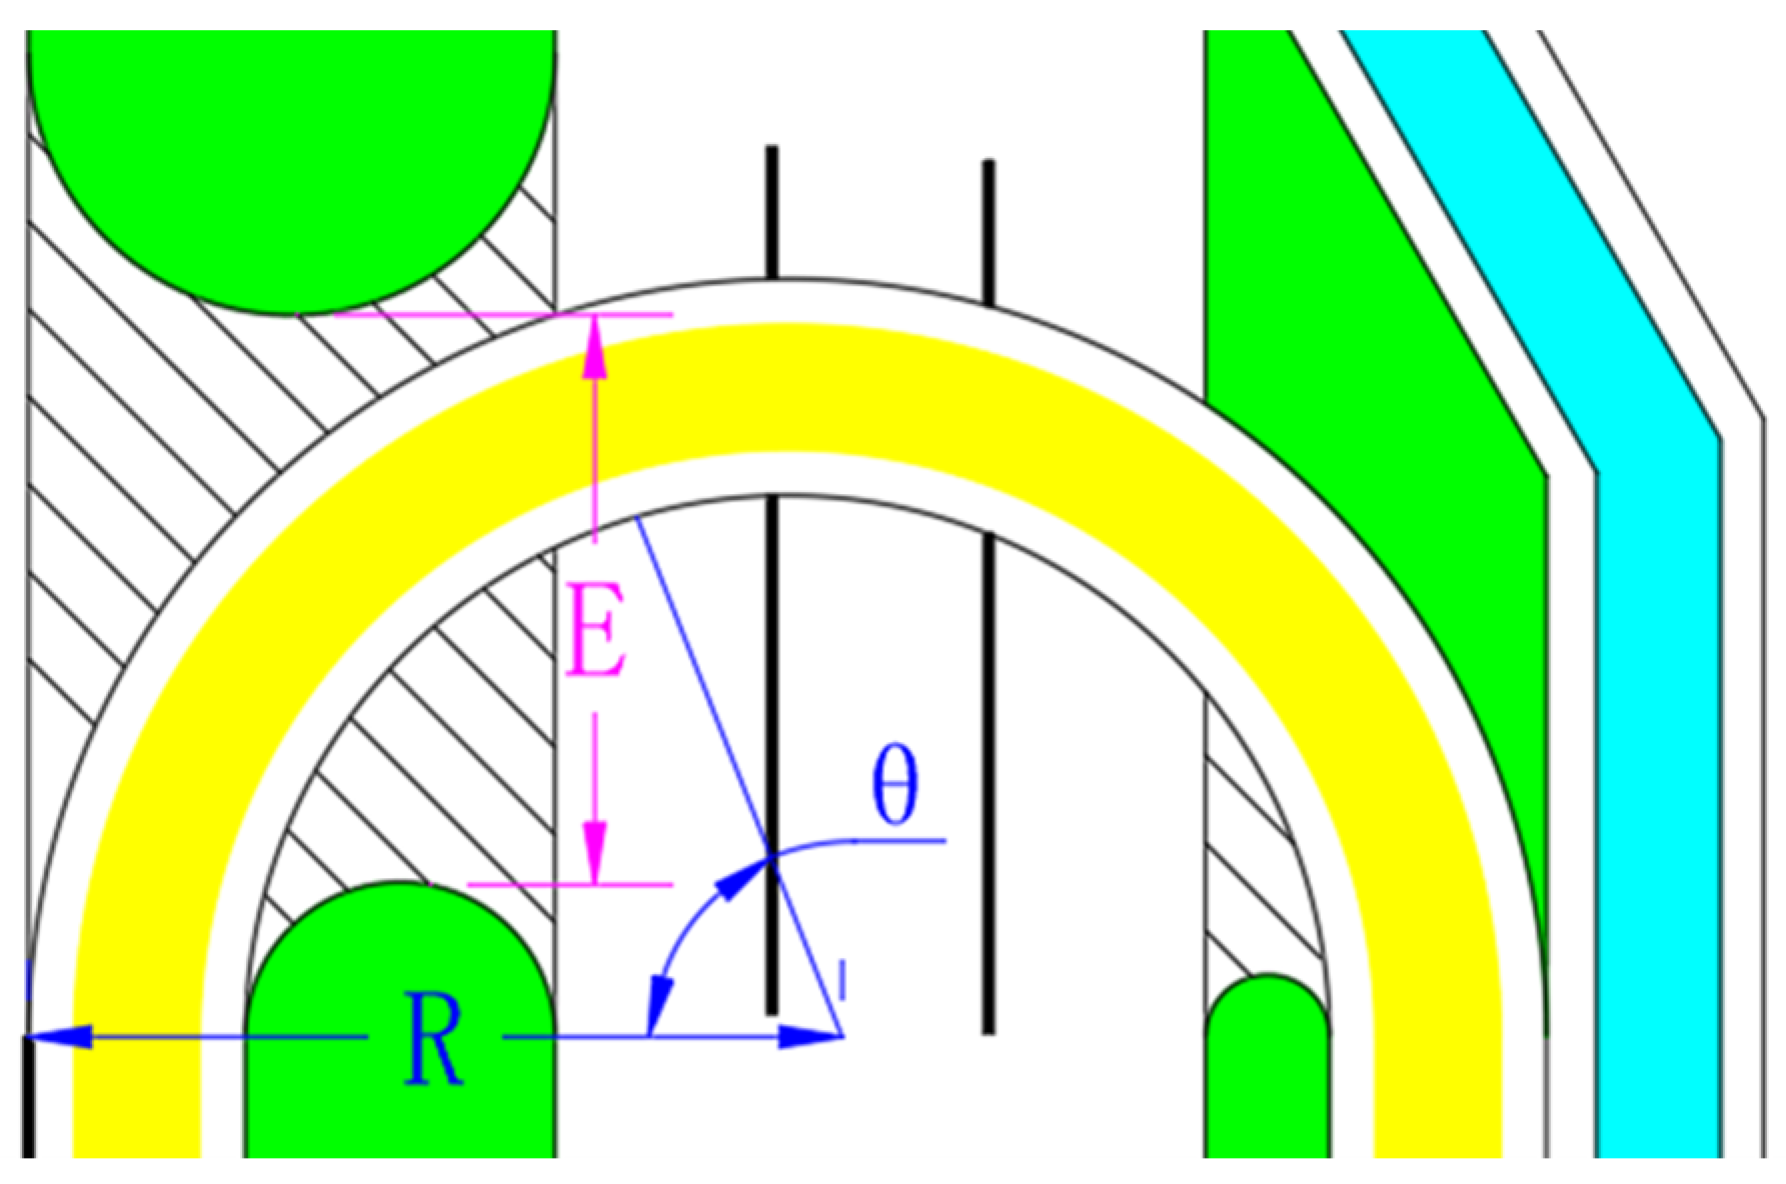
- UALT’s U-turn opening at the intersection is set to 110 m, the road width and putting other parameters into Equations (14) and (15), with θ equal to 60°, the calculation can be set to an opening length of 8.1m;
- 8.
- According to [17], the maximum traffic volume of urban roads with a design speed of 80 and 50 km/h corresponding to service level four is 2150 and 1250 pcu/h, respectively;
- 9.
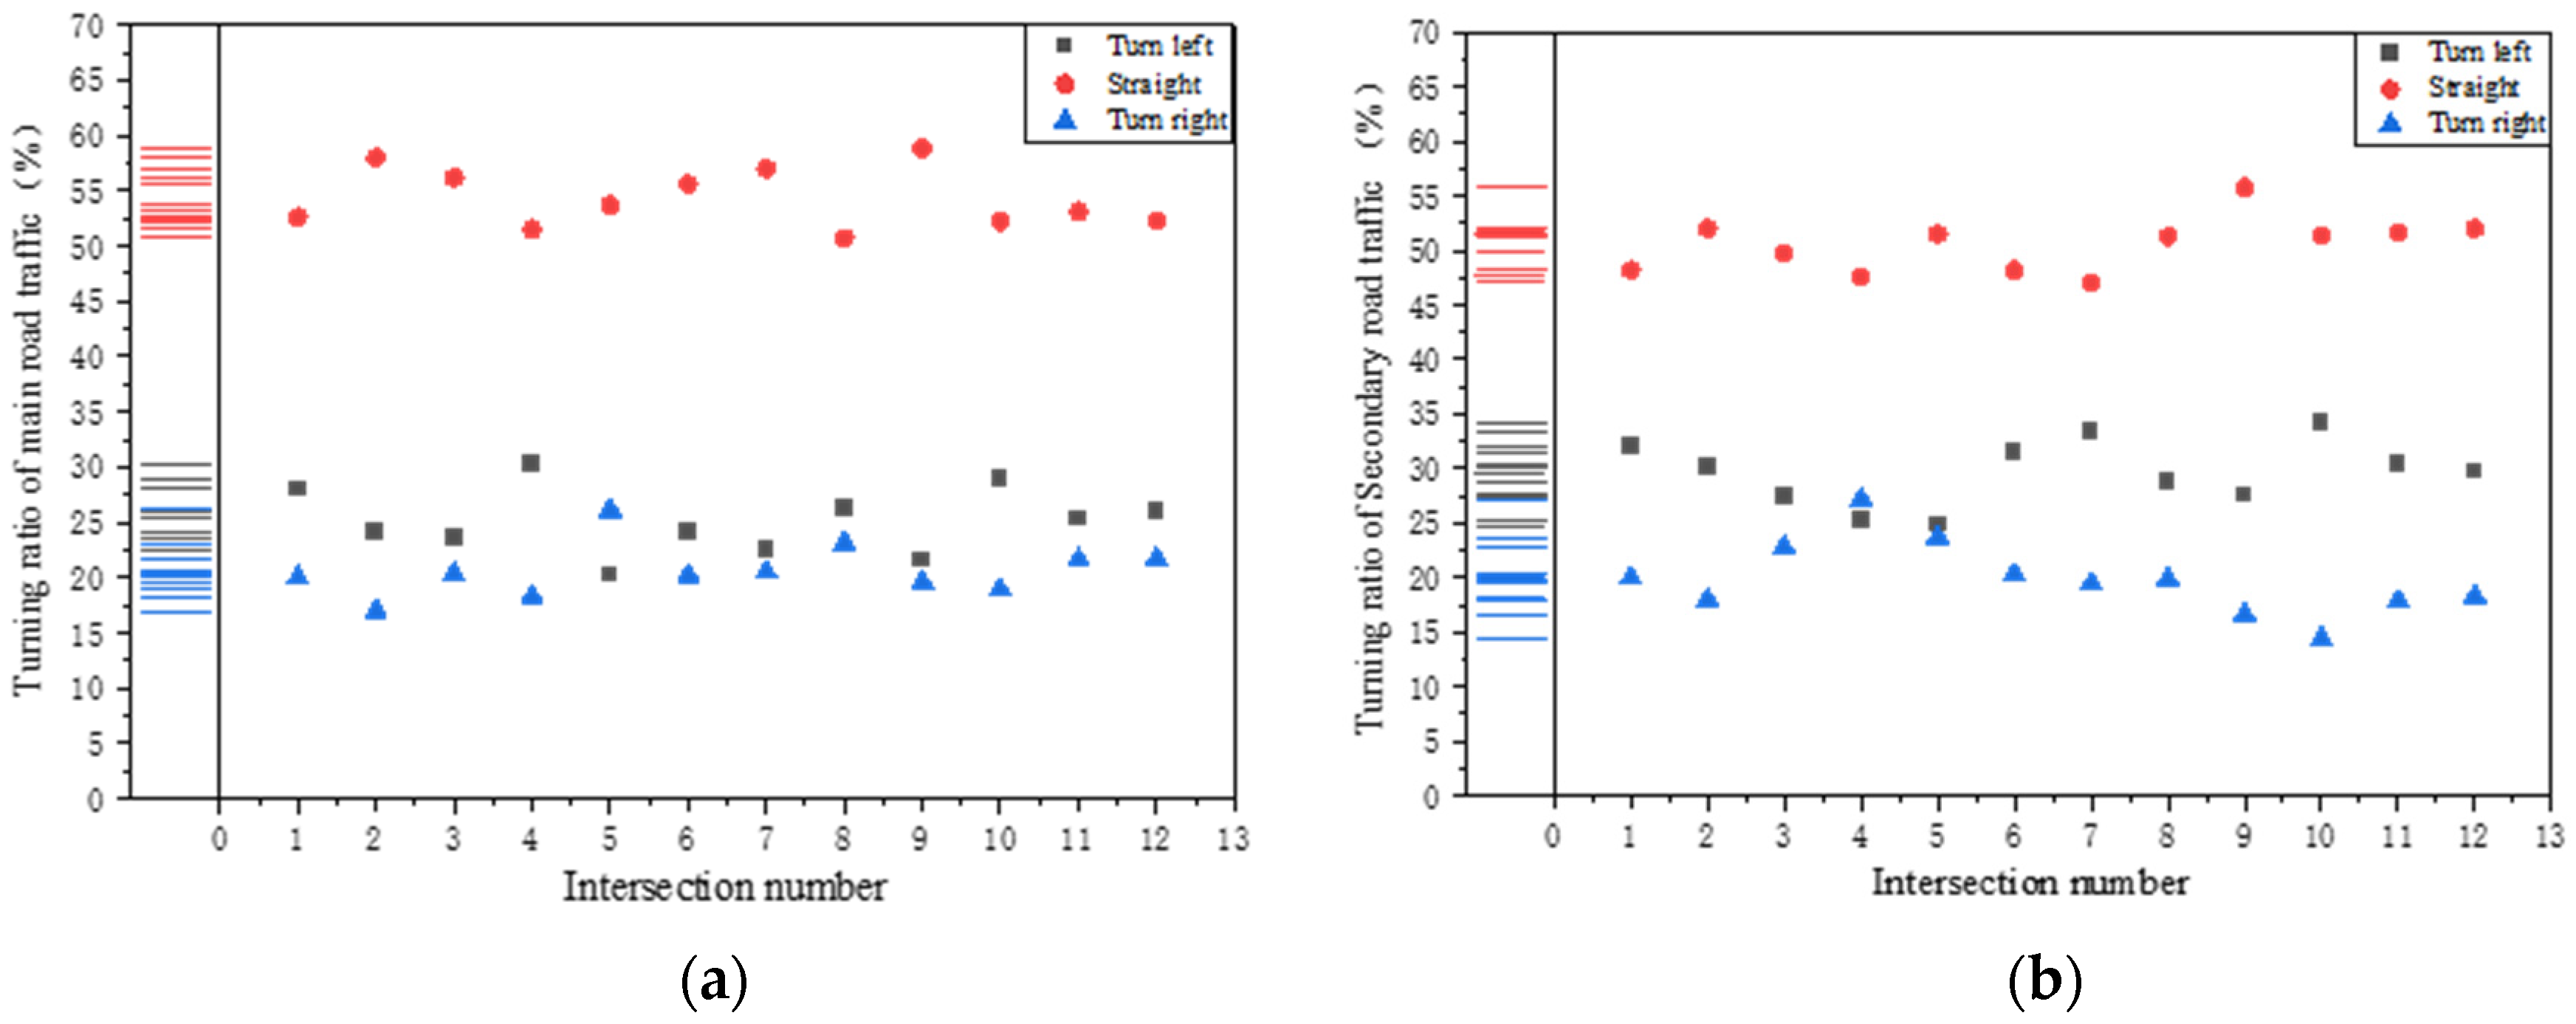
- The results from a field survey of 12 intersections in Zhengzhou follow Figure 7. It can be seen that the proportion of vehicles turning at intersections is more concentrated, and most of the time, the proportion of left turns on secondary roads is slightly higher than on primary roads. The parameters are shown in Table 1.
5. Results
5.1. Operational Features with UALT and CI
5.1.1. Delays
5.1.2. Queue Lengths
5.1.3. Number of Stops
5.2. Operational Features with UALT and MUIT
5.2.1. Delays
5.2.2. Queue Lengths
5.2.3. Number of Stops
6. Project Examples
6.1. Data Collection
6.2. Simulation Analysis
7. Conclusions
Author Contributions
Funding
Institutional Review Board Statement
Informed Consent Statement
Data Availability Statement
Acknowledgments
Conflicts of Interest
References
- El Esawey, M.; Sayed, T. Analysis of unconventional arterial intersection designs (UAIDs): State-of-the-art methodologies and future research directions. Transp. A Transp. Sci. 2013, 9, 860–895. [Google Scholar] [CrossRef]
- Zhong, Z.J.; Nejad, M.M.; Lee, I.I.; Earl, E. Unconventional arterial intersection designs under connected and automated vehicle environment: A survey. arXiv 2018, arXiv:181103074. [Google Scholar]
- An, S.; Song, L.; Wang, J.; Wang, Y.Q.; Hu, X.W. Status and prospects of unconventional intersection design. J. Transp. Eng. 2020, 20, 1–20. [Google Scholar]
- Qin, P. Research on Setting and Profit of Hook-turn Intersection. Transp. Technol. 2016, 1, 153–156, 157. [Google Scholar]
- Xiang, Y.; Li, Z.; Wang, W.; Chen, J.; Wang, H.; Li, Y. Evaluating the operational features of an unconventional dual-bay U-turn design for intersections. PLoS ONE 2016, 11, e0158914. [Google Scholar] [CrossRef] [PubMed] [Green Version]
- Pan, B.H.; Shan, H.M.; Hu, W. Study on the operational efficiency of a new unconventional U-turn intersection. J. Shenzhen Univ. (Sci. Technol. Ed.) 2020, 37, 305–313. [Google Scholar]
- Ju, J.P.; Chen, M.M. Traffic optimization design and simulation of T-intersection based on shifted left turn. Traffic Eng. 2020, 20, 75–80. [Google Scholar]
- Zhao, J.; Xu, H.; Gao, X.; Wang, T. Optimal design method for left-turning non-motorized vehicles at continuous flow intersections. Transp. Syst. Eng. Inf. 2018, 18, 178–186. [Google Scholar]
- Zhang, W.H.; Chen, J.S.; Dong, R.J. Study on the geometric parameter setting and traffic efficiency of road level intersection secondary road far lead. J. Civ. Eng. 2017, 50, 121–128. [Google Scholar]
- Zhao, Y.R. Study on the Technical Indicators Related to U-turn Planar Intersections. Bachelor’s Thesis, Chang’an University, Xi’an, China, 2019. [Google Scholar]
- Zhou, Y.P.; Zhang, Y.Y. Analysis of U-Turn intersection capacity and management insights. Shanghai Manag. Sci. 2016, 38, 96–100. [Google Scholar]
- CJJ37-2012; Design Specification for Urban Road Engineering. Design Specification for Urban Road Engineering: Pune, India, 2012.
- Shaik, R.A.; Graham, J.R. Efficiency of dual left-turn lane intersections in Charlotte: A study using TRAF-NETSIM. ITE J. 1996, 66, 6. [Google Scholar]
- Farahani, R.Z.; Miandoabchi, E.; Szeto, W.Y.; Rashidi, H. A review of urban transportation network design problems. Eur. J. Oper. Res. 2013, 229, 281–302. [Google Scholar] [CrossRef] [Green Version]
- Yan, Z.R. Study on the Opening Spacing of the Center Divider for Far-Left Turnaround. Bachelor’s Thesis, Chang’an University, Xi’an, China, 2014. [Google Scholar]
- Carey, M.; McCartney, M. Behaviour of a whole-link travel time model used in dynamic traffic assignment. Transp. Res. Part B 2002, 36, 83–95. [Google Scholar] [CrossRef]
- Xu, L.; Yang, X.K.; Ai, S.B.; Jin, B.F. A study on the classification of service level of urban roads in Beijing. Traffic Transp. (Acad. Ed.) 2008, 1, 43–45. [Google Scholar]

| Item | Value | |
|---|---|---|
| Car/Truck(bus) ratio | 0.97:0.03 (main road) | 0.98:0.02 (secondary road) |
| Traffic turning ratio (Turn left: go straight: Turn right) | 0.25:0.55:0.2 (main road) | 0.3:0.5:0.2 (secondary road) |
| Main Road Volume Range | 1100~2300 pcu/h | |
| Secondary road volume range | 500~1200 pcu/h | |
| Direction | Number of Approach Lane | Median Width(m) | Traffic Volume (pcu/h) | ||||
|---|---|---|---|---|---|---|---|
| Left Turn | Straight | Right Turn | Left Turn | Straight | Right Turn | ||
| = 1 (East) | 1 | 2 | 2 | 10 | 302 | 508 | 187 |
| = 2 (South) | 1 | 3 | 1 | 5 | 492 | 1063 | 371 |
| = 3 (West) | 1 | 2 | 1 | 10 | 234 | 577 | 269 |
| = 4 (North) | 1 | 3 | 1 | 5 | 556 | 1172 | 405 |
| Site | Green Time | Yellow Time |
|---|---|---|
| Straight ahead (N–S) | 45 | 3 |
| Turn left (N–S) | 35 | 3 |
| Straight ahead (E–W) | 28 | 3 |
| Turn left (E–W) | 20 | 3 |
| Site | Green Time | Yellow Time |
|---|---|---|
| Straight ahead (N–S) | 45 | 3 |
| Straight ahead (E–W) | 35 | 3 |
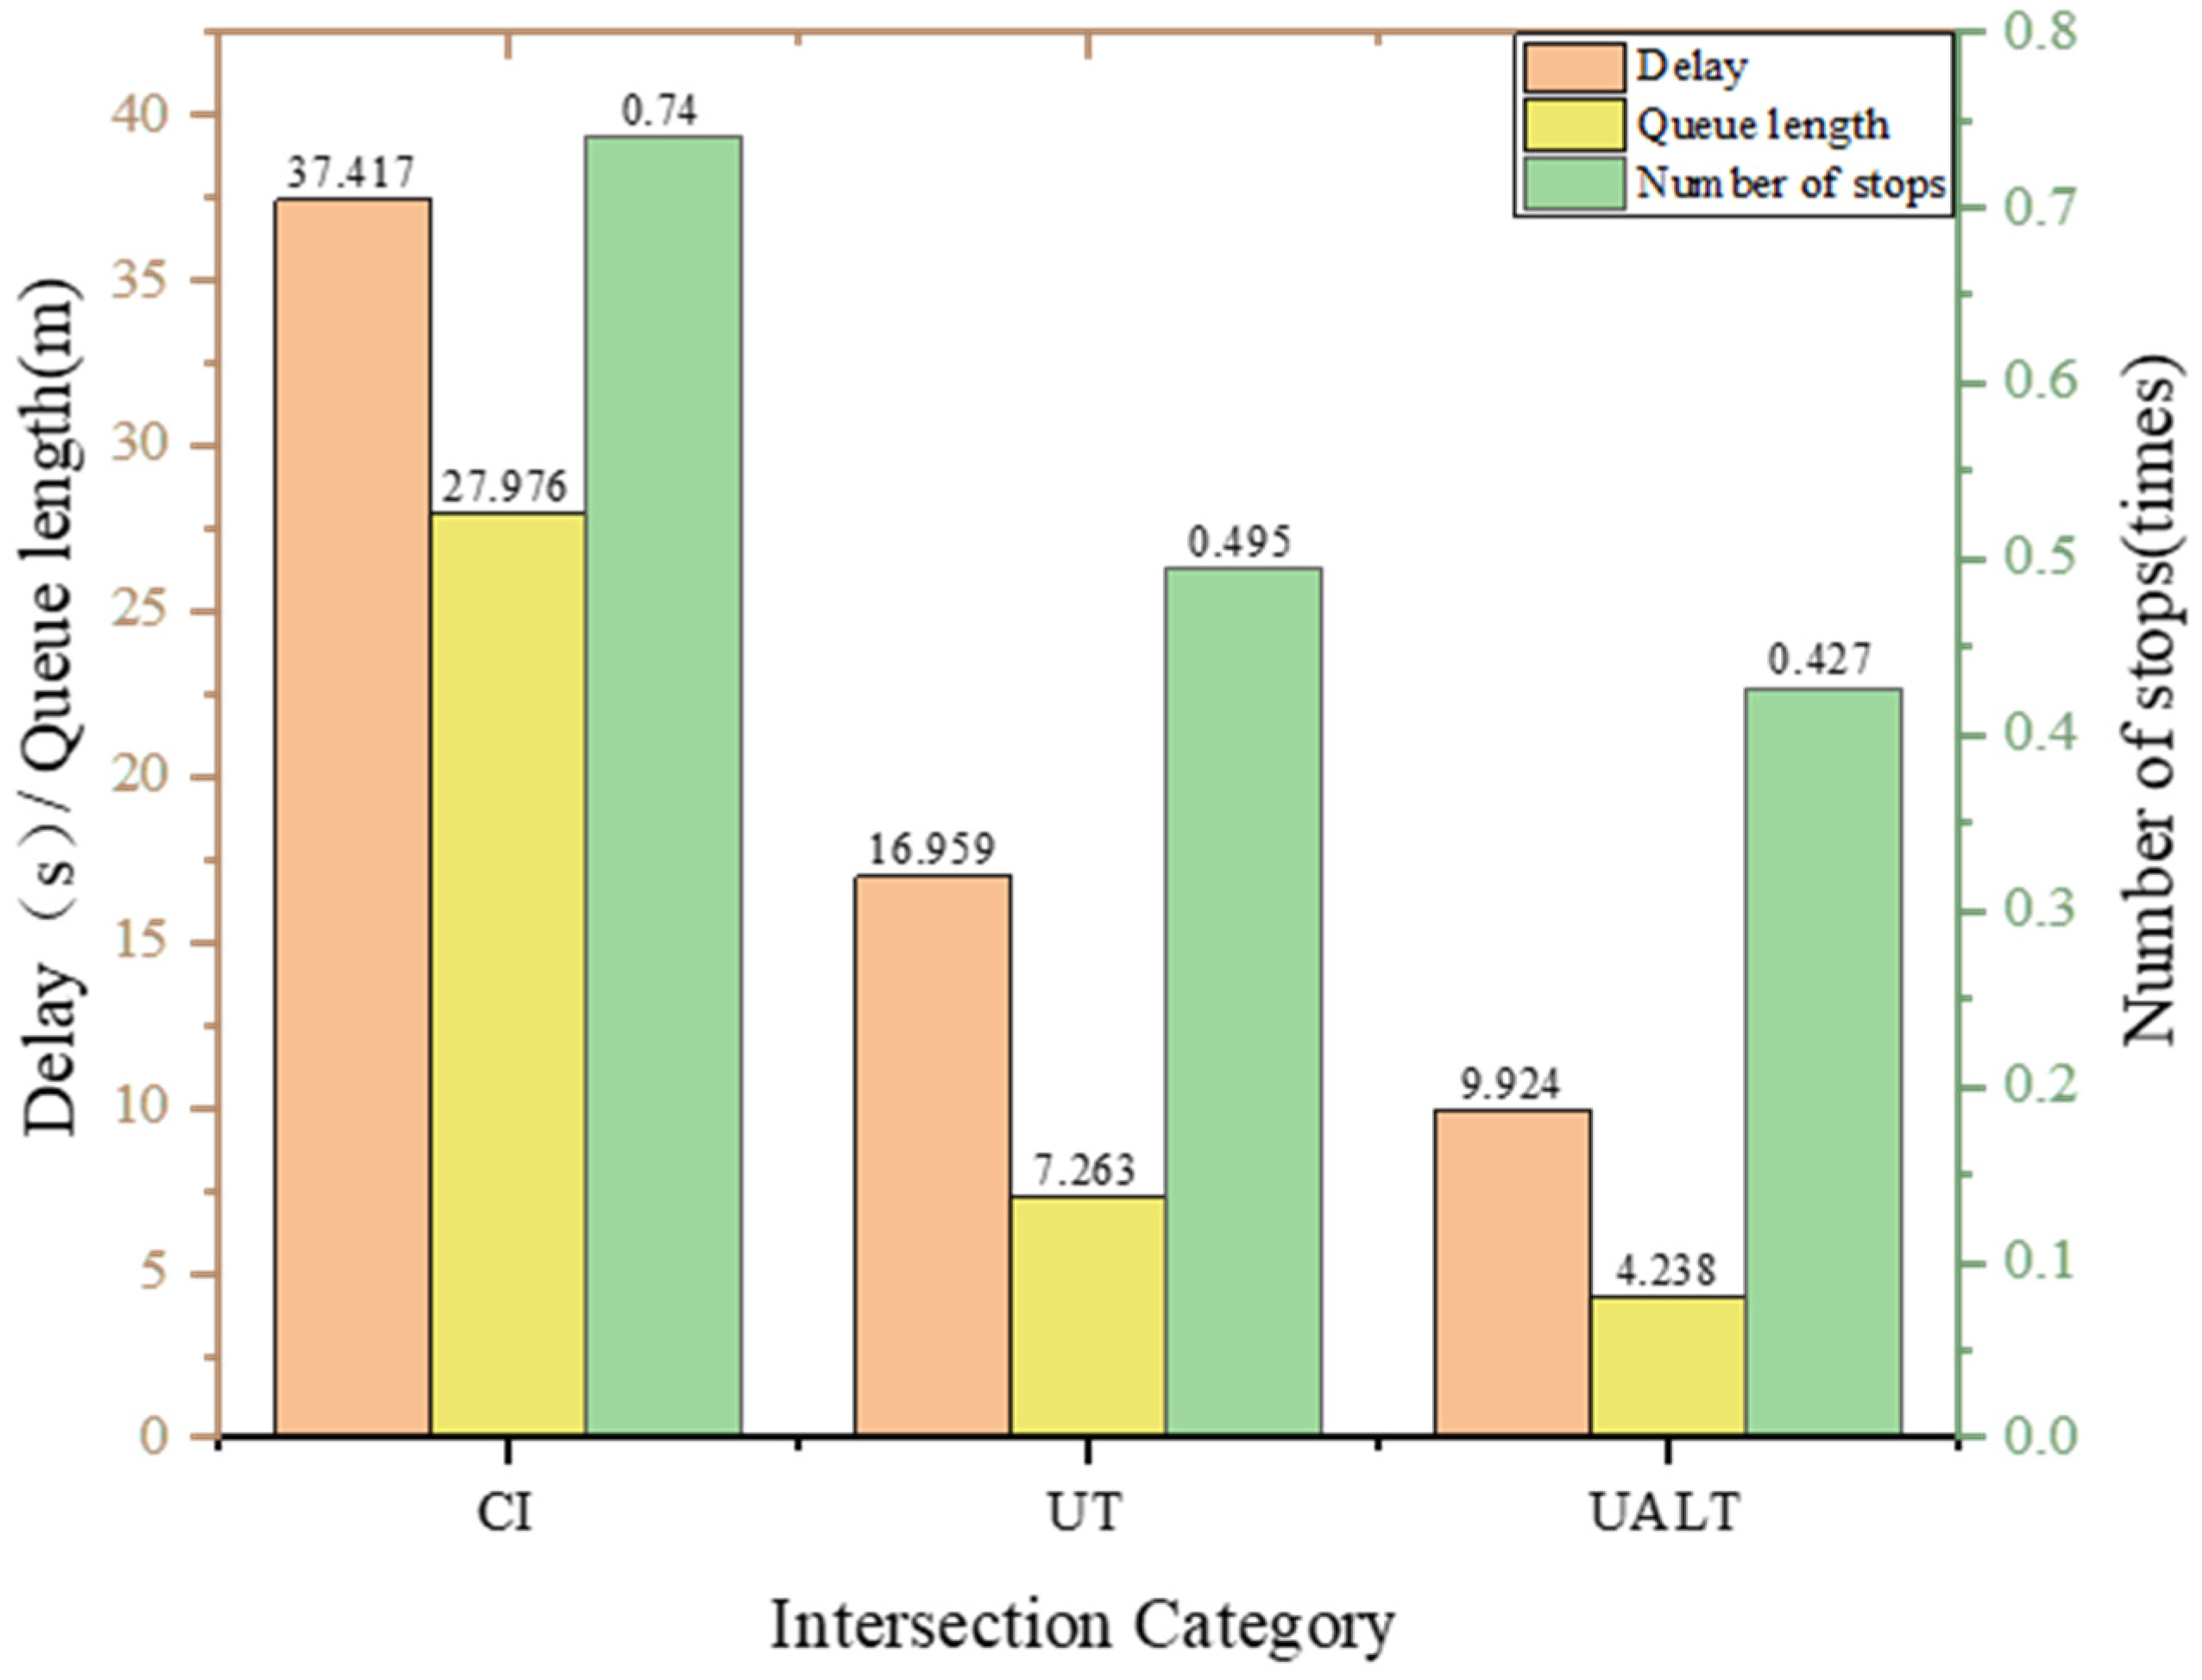
| Intersection Type | Delay (s) | Queue Length (m) | Number of Stops (Times) | |||
|---|---|---|---|---|---|---|
| Average | Standard Deviation | Average | Standard Deviation | Average | Standard Deviation | |
| CI | 37.417 | 10.844 | 27.976 | 11.596 | 0.74 | 0.262 |
| MUIT | 16.959 | 3.558 | 7.263 | 1.628 | 0.495 | 0.159 |
| UALT | 9.924 | 3.188 | 4.238 | 1.194 | 0.427 | 0.151 |
Publisher’s Note: MDPI stays neutral with regard to jurisdictional claims in published maps and institutional affiliations. |
© 2022 by the authors. Licensee MDPI, Basel, Switzerland. This article is an open access article distributed under the terms and conditions of the Creative Commons Attribution (CC BY) license (https://creativecommons.org/licenses/by/4.0/).
Share and Cite
Hu, S.; Jia, Z.; Yang, A.; Xue, K.; He, G. Evaluating the Sustainable Traffic Flow Operational Features of U-turn Design with Advance Left Turn. Sustainability 2022, 14, 6931. https://doi.org/10.3390/su14116931
Hu S, Jia Z, Yang A, Xue K, He G. Evaluating the Sustainable Traffic Flow Operational Features of U-turn Design with Advance Left Turn. Sustainability. 2022; 14(11):6931. https://doi.org/10.3390/su14116931
Chicago/Turabian StyleHu, Shengneng, Zhen Jia, Anping Yang, Kui Xue, and Guoqi He. 2022. "Evaluating the Sustainable Traffic Flow Operational Features of U-turn Design with Advance Left Turn" Sustainability 14, no. 11: 6931. https://doi.org/10.3390/su14116931