
Audit Evaluation and Driving Force Analysis of Marine Economic Development Quality


1
School of Government Auditing, Nanjing Audit University, Nanjing 211815, China
2
College of Forestry, Fujian Agriculture and Forestry University, Fuzhou 350002, China
3
College of Ocean Science and Engineering, Nanjing Normal University, Nanjing 210023, China
*
Author to whom correspondence should be addressed.
Sustainability 2022, 14(11), 6822; https://doi.org/10.3390/su14116822
Submission received: 28 April 2022
/
Revised: 26 May 2022
/
Accepted: 31 May 2022
/
Published: 2 June 2022
(This article belongs to the Collection Reviews, Advances and Applications in Environmental Sustainability)
Abstract
:High quality development of the marine economy is the main focus of China’s future. This paper combined principal component analysis (PCA) method, coupling coordination degree (CCD) model, and data envelopment analysis (DEA) model to evaluate the quality of marine economic development, and analyze the drivers in Jiangsu Province, China, from 2008 to 2016. The results show that the investment in marine economic development has gradually declined, while the output has been increasing. It gradually presents a state of intensive development with low input and high output. The coupling coordination level of high-quality development of the marine economy in 2009–2014 and 2016 was above the good coordination level. The quality of marine economic development continued to grow, with an average increase of 25.1%, of which the technological progress change index played a decisive role, mainly through improving total factor productivity. Marine economic development is becoming more diversified. Total industrial wastewater discharge, the added value of marine and related industries, and the number of marine-related employees are the main influencing factors.
1. Introduction
At present, China’s marine economy has shifted from a high-speed growth stage to a high-quality development stage [1]. We are in a period of tackling key problems in transforming the mode of development, optimizing the economic structure, and transforming the driving force of growth. The extensive growth mode of the marine economy has led to challenges such as increased consumption of marine resources, increased waste discharge, intensified marine environmental pollution, and degradation of the coastal ecosystem. The 14th 5-year plan clearly highlights the need to develop the marine economy and build marine power. It is necessary to effectively carry out a high-quality development evaluation of the marine economy and reveal its driving mechanism, which has important guiding significance for implementing the new development concept. The main objective of this research is to accurately grasp the dynamic evolution characteristics and influencing factors of the quality of marine economic development. This will be demonstrated by, on the one hand, effectively identifying the problems in the operation of the marine economy, improving the production efficiency of the marine economy, and preventing the predatory growth of the marine economy, as well as, on the other hand, promoting the sustainable development of the marine economy and ensuring the rational utilization of marine resources, along with the harmony and stability of the marine ecological environment. Therefore, improving the total factor productivity of China’s marine economy is of great significance for promoting the sustainable development of the marine economy. The key to improving the quality of marine economic development lies in improving total factor productivity, paying attention to the structural adjustment and optimization of resource and environmental economy, and realizing the comprehensive and balanced development of the ocean [2]. Improving the total factor productivity and driving high-quality development has become one of the main challenges facing the development of the marine economy. It is of great significance to conduct an audit evaluation and analysis of the quality and driving factors of marine economic development from the perspective of total factor productivity. It can not only help us to deeply understand the internal mechanism of total factor productivity, but also the basis for improving the quality and efficiency of marine economic development.
High-quality development is a higher level, more efficient, more equitable, and more sustainable development. We should pay attention not only to the growth of quantity, but also to the improvement of quality. For developing countries, Mlachila [3] believes that the growth rate is higher, and longer-lasting social friendly growth is of higher quality. Labor productivity and total factor productivity are important standards for audit evaluation of high-quality development [4]. Relevant studies at home and abroad pay more attention to the development quality of coastal cities [5], the economic quality of marine fisheries [6], the development quality of marine protected areas [7], and the high-quality development of regional economy [8]. Focusing on the quality of marine economic development, scholars have mainly carried out research from the perspectives of marine industrial linkage and spatial agglomeration [9], marine economic vulnerability [10], marine regional development and comprehensive economic management [11,12], marine scientific and technological innovation and marine economic development [13], marine circular economy development, and marine ecological security construction [14,15]. In addition, a unified and standard audit evaluation index system for the quality of marine economic development has not yet been formed both at home and abroad [16]. Relevant research needs to be further explored, and the index system can be constructed from the perspectives of GDP, new kinetic energy, total factor productivity, and resource adequacy [17]. Due to the limitations of the index system and research methods, it cannot effectively reveal the dynamic characteristics of the quality of marine economic development, and there is less exploration on the driving factors affecting the quality of marine economic development [18,19]. The commonly used research methods and models mainly include the entropy method [20] and the improved Topsis method [21,22], a super-efficiency Slacks-Based Measure model and Bayesian model averaging method [23], principal component analysis and regression analysis [24], set pair analysis and the kernel density estimation model [25], the Delphi method, the AHP method, and the linear combination model [26,27], the linear weighted model, the coupling coordination degree model and Kernel density estimation [28], the SFA basic model, the coefficient of variation, the Gini coefficient and entropy method [29], the fuzzy matter element model [30], the DEA model [4,31] etc.
We should speed up the improvement of the top-level design of the audit evaluation index system for the high-quality development of the marine economy. From the aspects of marine social economy, marine resources, and marine ecological environment, this paper selects the input index and output index of marine economic development, respectively, and has constructed the audit evaluation index system of marine economic development quality. In order to accurately grasp the quality of marine economic development, and the coupling coordination degree between input–output efficiency, this paper combined and applied the PCA method, the CCD model, and the Malmquist model. Firstly, the PCA method was used to screen the indicators, eliminate the repeated information that may be contained in the index system, and avoid the subjective influence of index selection. The principal component scores of input variables and output variables were calculated by weighting, and analyzed the main driving factors. Secondly, the coupling and coordination relationship between the inpu–toutput efficiency of the marine economy was measured and analyzed by CCD model. Finally, PCA–Malmquist method was used to reveal the dynamic change trend of marine economic development quality in Jiangsu Province. This research provides important empirical references and decision-making bases for the audit and evaluation of the quality of marine economic development, and is of great significance to aid the deep understanding the quality of marine economic development.
2. Data and Methods
2.1. Data Sources
Jiangsu province is located on the coast of the Yellow Sea and the west coast of the Pacific Ocean (Figure 1), with a longitude 116°18′ E–121°57′ E and a dimension 30°45′ N–35°20′ N. The coastal zone covers an area of around 3.5 × 10⁴ km2; the sea area is 3.75 km2, and the length of the coastline is 888.9 km. In recent years, the overall development of the marine industry in Jiangsu province has maintained a steady growth. In 2017, the GDP of the marine industry was CNY 721.7 billion, the added value of the marine industry was CNY 411.98 billion, and the added value of major marine industry was CNY 276.48 billion. This paper selects the input and output indicators of marine economic development in Jiangsu Province, China, from 2008 to 2016. On the basis of calculating the principal component scores of input variables and output variables, according to the Malmquist index and total factor decomposition results, the audit evaluation analyzes the dynamic changes and main influencing factors of marine economic development quality, and puts forward feasible suggestions. Relevant data come from the marine statistical yearbook, marine economic development report, monitoring data of environmental protection departments, and pollutant discharge declaration data.
2.2. Index System and Standardization
The marine economy is a complex system which involves many factors. It is necessary to conduct a comprehensive audit and evaluation of the development quality of the regional marine economy from a multi-dimensional perspective. Based on the research results of the marine economic development index system both at home and abroad [32,33], combined with the actual situation of Jiangsu Province, this paper selects 10 input indexes and 9 output indexes from the aspects of marine social economy, marine resources profit and loss, and marine ecological environment, and constructed the audit evaluation index system of marine economic development quality in Jiangsu Province (Table 1). Based on the index data from 2008 to 2016, an original index data matrix X = (xij)9×19 was constructed, which represents 9 evaluation programs, each with 19 evaluation indicators. The range standardized transformation method was used to dimensionless process the judgment matrix to obtain a standardized matrix Y = (yij)9×19.
2.3. Methods
Many scholars use the DEA model from the perspective of marine economic quality and efficiency. For example, Dong Z [30] evaluated the efficiency of marine economic and technological innovation in Zhejiang Province, China. Zhao X and Guo KY [34] used the improved GRA–DEA hybrid model to evaluate marine economic efficiency. Wen MM [35] established a differential equation model, and comprehensively evaluated the dynamic and coordinated development of the marine economic ecological complex system through data envelopment analysis (DEA). Sun CZ [36] constructed a ring structure of a complex marine system, and calculated the efficiency of the chain structure using a network data envelopment analysis (DEA) model. Ren wh [37] included bad output into the total factor productivity measurement, and used the Malmquist–Luenberger index model to evaluate the green efficiency of China’s marine economy under environmental constraints. Wang X and Xu XH [8] used the optimized Malmquist–Luenberger index to calculate total factor productivity and the Dagum Gini coefficient method to calculate the changes in economic quality and efficiency. Wei XY [38] calculated the green total factor productivity (GTFP) of the marine economy based on the super-efficiency slack-based measure model and global Malmquist index model. Most studies focus on the analysis of overall efficiency, technical efficiency, and scale benefit when conducting an audit evaluation and analysis of marine economic development quality based on data envelopment analysis [39]. Few studies use the Malmquist index to analyze efficiency changes and interpret the role of the total factor production coefficient in efficiency evaluation [40]. Therefore, compared with the existing research, this paper combined and applied the PCA–CCD–Malmquist model, which overcomes the problem that the traditional DEA model has no feasible solution, as well as the issue of the efficiency evaluation distortion of development quality caused by ignoring the input and output relaxation variables. This paper explores the internal essence of marine economic development quality from the perspective of total factor productivity.
2.3.1. Principal Component Analysis
PCA is a statistical analysis method that can effectively reduce the dimension of variables. It divides multiple variables into fewer comprehensive indicators, analyzes all kinds of information existing in each variable, and makes the comprehensive indicators free of duplicate information as far as possible. The specific steps are as follows:
The principal component load and the scores of each principal component are calculated, and the principal component comprehensive index is calculated by using the principal component function:
Fij = a1 × zx1 + a2 × zx2 + … + ai × zxi (i = 1, 2, …, t; j = 1, 2, …, n);
In the formula, kij is the main component load, which reflects the correlation between the main component and the original variable. Fij is the i-th principal component score of the original variable, that is, the index value after weighted processing. xij is the initial variable. zxi is the standardized data. P is the comprehensive index of marine economic development. t is the number of main components. Aij is the variance contribution rate of the i-th principal component.
2.3.2. Coupling Coordination Degree Model
Based on the comprehensive score f(x) of input principal component and the comprehensive score g(y) of output principal component of marine economic development, the input–output coupling coordination degree model of marine economic development is constructed:
In the formula, H is the coupling coordination degree, C is the coupling degree, P is a comprehensive coordination evaluation index, and α and β are to be determined. Since the importance of defining the input of marine economic development is consistent, the α = β = 0.5 is defined. The larger the results, the higher the degree of coupling and coordination between the systems.
The coupling coordination degree reflects the coupling degree of the input–output of marine economic development, as well as the development level of both. In order to accurately evaluate the coupling and coordination relationship between the input and output of marine economic development, this paper divides the audit evaluation criteria of coupling and coordination levels and types (Table 2).
2.3.3. Data Envelopment Analysis Model
DEA uses CCR, BBC, FG, ST, and other data planning method models to set multiple inputs and generate decision-making unit outputs, in order to judge whether each decision-making unit (DMU) is effective [41]. Suppose there are n decision-making units DMUj (1 ≤ j ≤ n), and each DMU has m input variables and s output variables. xij = (x1j, x2j, …, xmj)T > 0 represents the ith input vector of the j-th DMU. yij = (y1j, y2j, …, ysj)T > 0 indicates the output vector of the j-th DMU to type i.
The Charnes–Cooper model is used to convert the above fractional programming model into a linear programming model to form the following CCR model:
In the formula, λj is the combined weight of n DMU. and are the input and output vectors under weight combination. S+ and S− are slack variables, S+ = (S+1, S+2, …, S+s)T, S− = (S−1, S−2, …, S−m)T.
On the basis of CCR, the BBC model considers the impact of scale efficiency. The optimal solution of the BBC model represents the state of economies of scale. When ∑λ* = 1, it means that the decision-making unit is in a state of constant return to scale. When ∑λ* < 1, it means that the decision-making unit is in a state of increasing scale. When ∑λ* > 1, it means that the decision-making unit is in a state of decreasing scale.
3. Results and Analysis
3.1. The Driving Force of Marine Economic Development
Principal component analysis was performed on the standardized data of the input index and output index, respectively, and the characteristic root and variance contribution rate of the correlation coefficient matrix were obtained (Table 3). Since the eigenvalues of the first three components in the input index are greater than 1, and the cumulative contribution rate reaches 89.138% ≥ 85%, three principal components are extracted. The eigenvalues of the first three components in the output index are greater than 1, and the cumulative contribution rate reaches 92.245% ≥ 85%, and three principal components are also extracted.
By calculating the principal component loadings and eigenvectors of input indicators and output indicators (Table 4), the main influencing factors of the quality of marine economic development are analyzed from the aspects of input and output. The study found that total industrial wastewater discharge, phytoplankton diversity index, and wetland areas are the key influencing factors of the principal component of the input index. The proportion of marine GDP in the overall GDP of coastal areas, the added value of marine and related industries, and the number of marine-related employees are the key influencing factors of the principal component of the output indicator.
According to the principal component scores of the input index and the principal component scores of the output index (Table 5), the main influencing factors of the quality of marine economic development were evaluated and analyzed from the two aspects of input and output. The study found that the influence of the main influencing factors on the quality of marine economic development gradually decreased, indicating that the development of marine economy tends to be diversified.
3.2. Comprehensive Score of Principal Components of Marine Economic Development Quality
The comprehensive scores of the principal components of the input and output variables of marine economic development only represent the relative differences of the marine economic development in each year under the index system constructed in this paper. The higher the score, the better the development of the marine economy. The positive value indicates that the quality of marine economic development is above average, and the negative value indicates below average. According to the composite scores of principal components of input and output indicators in each year (Figure 2), it was found that only the composite scores of principal components of input indicators in 2016 were negative (−0.267), the result of which was lower than the average input level. The composite scores of principal components of other annual input indicators were all positive and higher than the average value of input. Input decreased from 1.04 in 2008 to 0.922 in 2011, and then fell back to 0.224 in 2015. At the same time, only the composite score of the principal components of the output indicator in 2008 was negative (−0.108), the result of which was lower than the average output level. The composite scores of principal components of other annual output indicators were all positive, higher than the average output. Output rose from 0.267 in 2009 to 1.126 in 2016.
According to the comprehensive scores of the principal components of the input and output indicators (Table 6), it was found that the comprehensive scores of the principal components of the input indicators in each year generally showed a downward trend, and the sort of these indicators are 2009, 2010, 2008, 2011, 2012, 2013, 2014, 2015, and 2016. This shows that the investment in the development of marine economy generally demonstrates a downward trend. The overall score of the principal components of the output indicator showed an upward trend, and the ranking was from 2008 to 2016. This shows that the output level of marine economic development is gradually increasing.
3.3. The Coupling Coordination Degree
It was found that the coupling coordination level of high-quality development of marine economy from 2010 to 2013 was of an excellent coordination level. In 2015 and 2008, they were of an intermediate coordination level and a primary coordination level, respectively. The remaining years were at a good coordination level (Table 7).
3.4. Malmquist Index
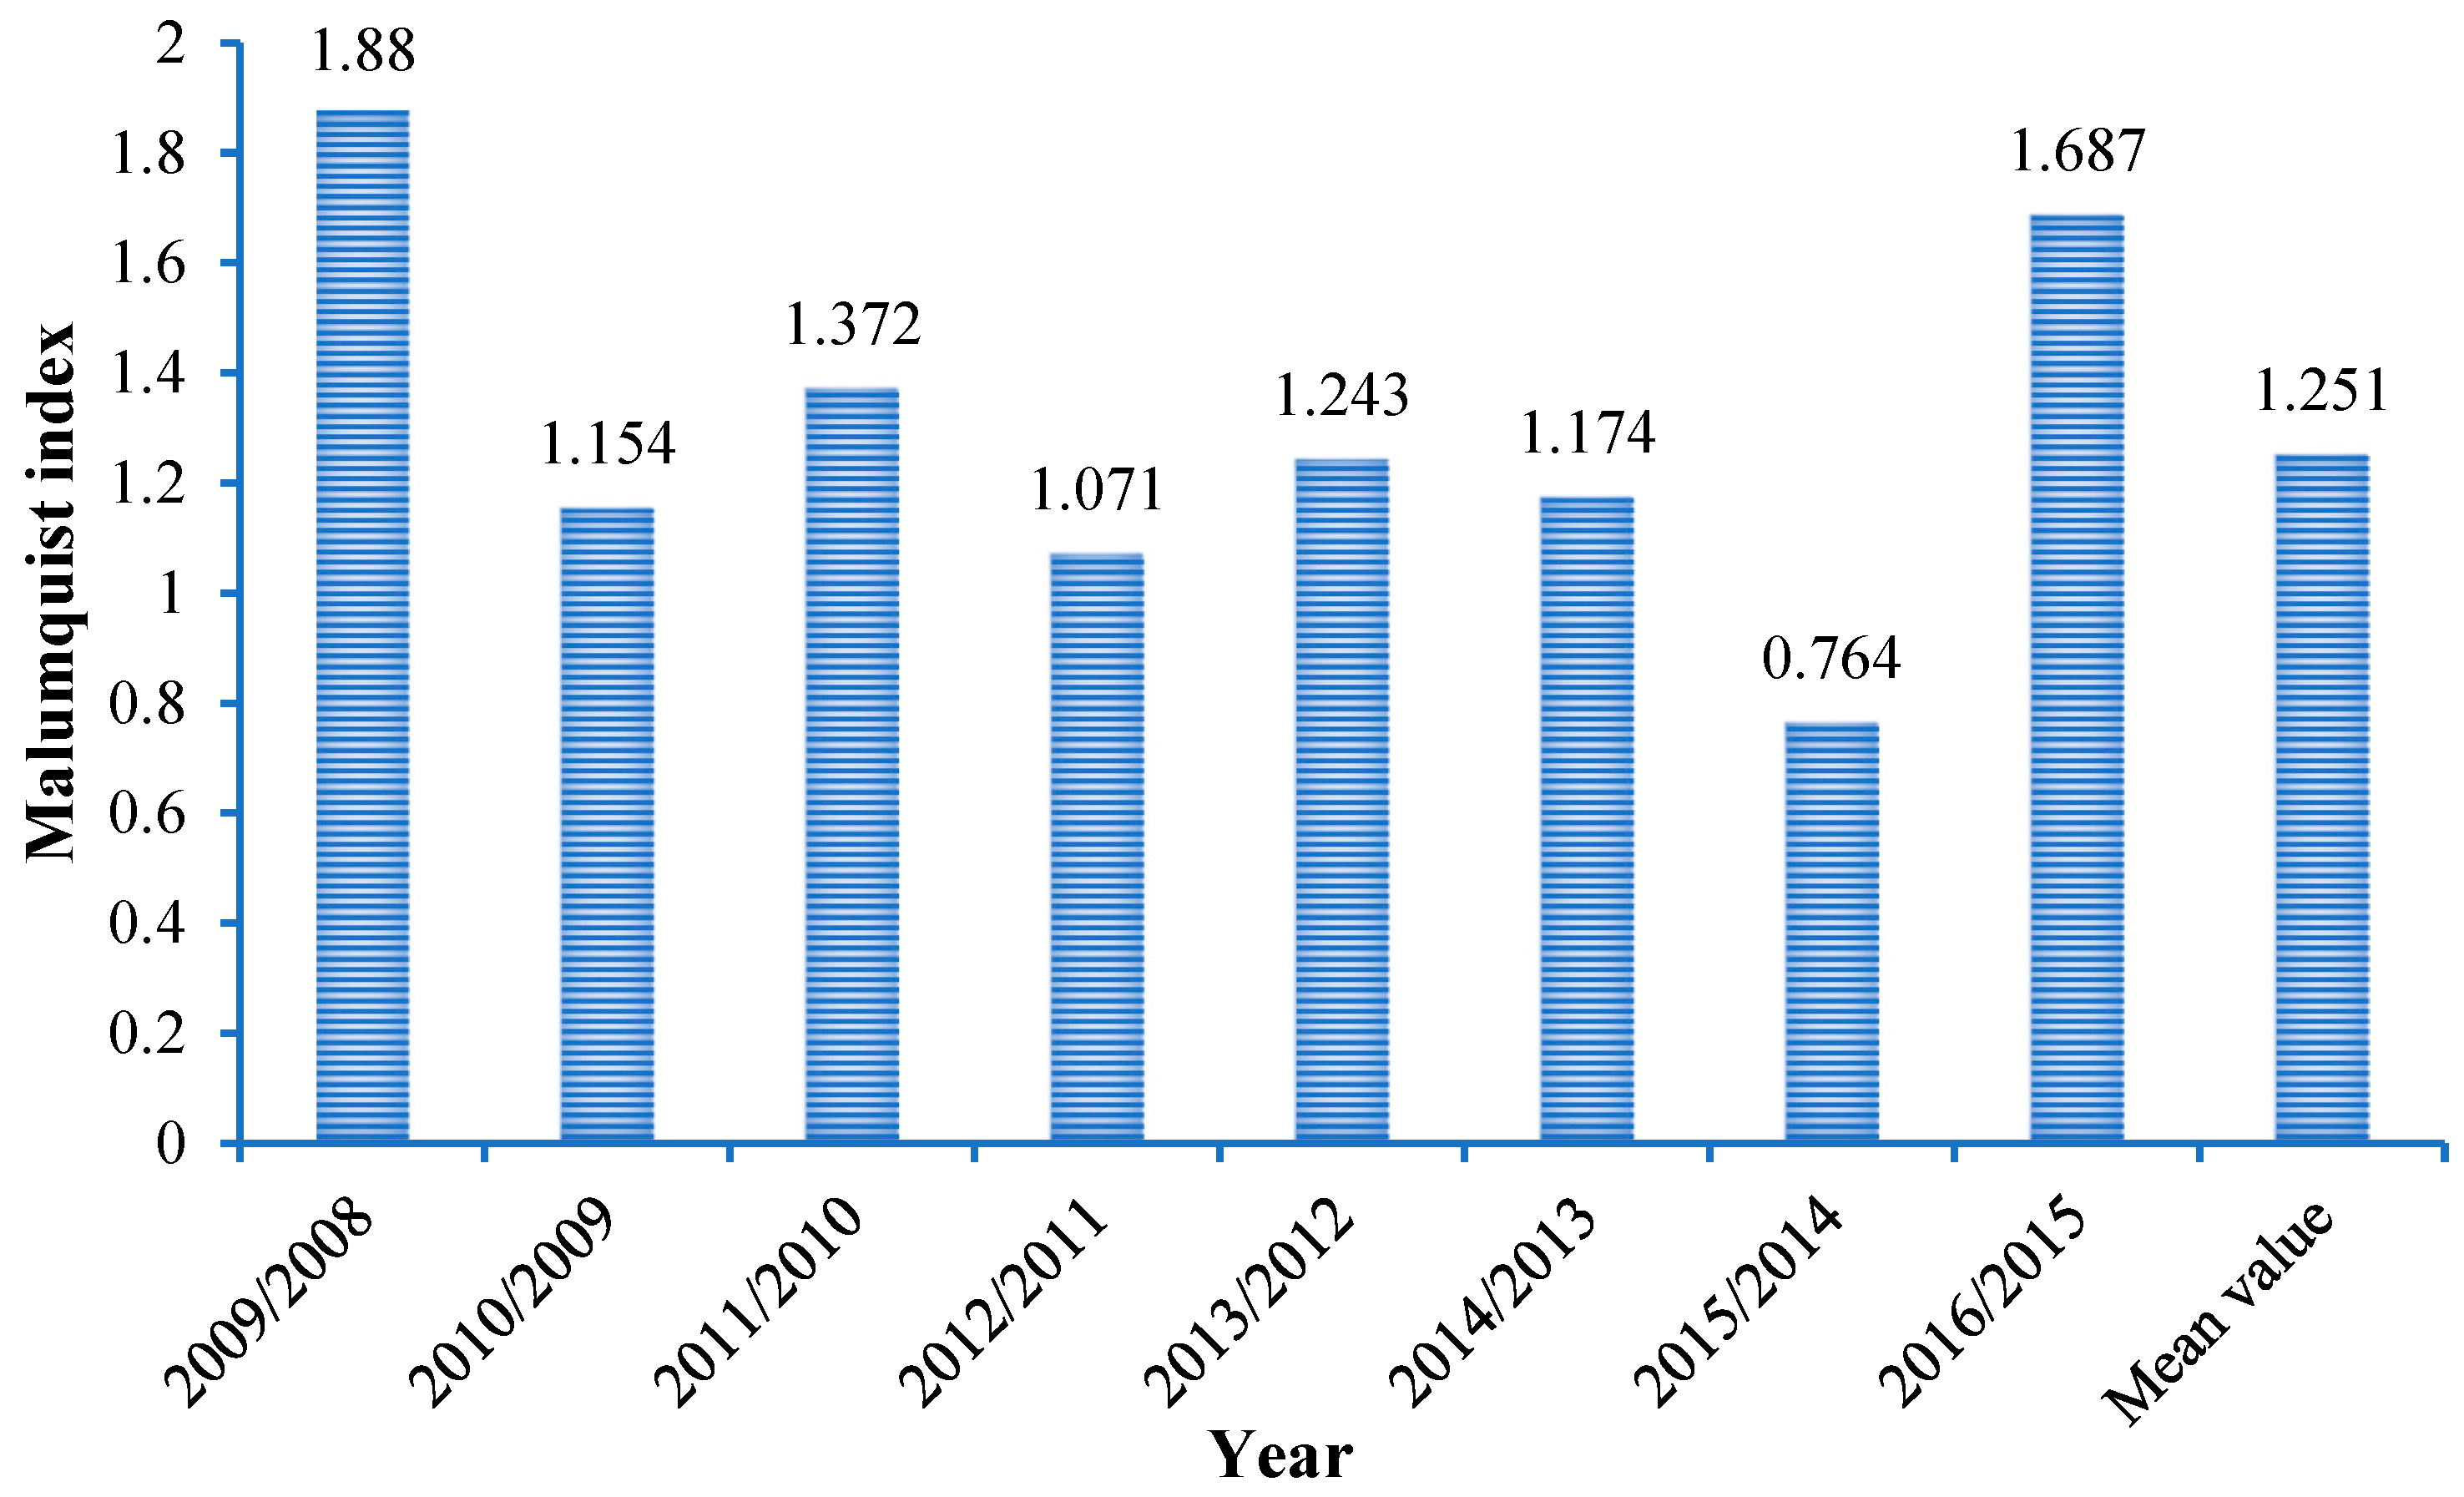
The comprehensive score of the principal components of the input index was used as input, and the comprehensive score of the principal components of the output index was used as the output. Using input-orientated Malmquist DEA for calculation, the total factor productivity and the decomposition of total factor productivity were analyzed according to the distance function. Since the DEA model requires that its input and output values must be positive values, this paper shifts all of the obtained principal component comprehensive scores up by 1 unit at the same time to ensure that there are no negative values, and then incorporates them into the DEA model for calculation. Finally, the Malmquist index of the quality of marine economic development in Jiangsu Province from 2008 to 2016 was obtained (Figure 3). A value of M greater than 1 indicates that the quality of marine economic development is continuously improving. A value of M lower than 1 indicates that the quality of marine economic development is not continuously improving.
Audit evaluation analysis was conducted from the perspective of total factor productivity change index (Tfpch). It was found that the technical efficiency change index (Effch), pure technical efficiency change index (Pech), and scale efficiency change index (Sech) in each year were all 1, and the average annual growth was 0. It means that the pure technical efficiency and scale efficiency had no effect on the growth of technical efficiency, and the status of the three remained unchanged. The annual technological progress change index (Techch) was consistent with the change trend of total factor productivity (Tfpch). It indicated that the change index of total factor productivity was determined by the change index of technological progress. Technological progress means that more output could be obtained with less input, which has promoted the improvement of the quality of Jiangsu’s marine economic development.
Audit evaluation and analysis was also conducted from the perspective of annual total factor productivity change index. It was found that the total factor productivity change index of the ratio was higher than 1 over 8 years, indicating that the quality of marine economic development was improving, accounting for around 87.5%. Among them, the Tfpch in 2009/2008 was the highest, reaching 1.88, ranking first. The Tfpch in 2016/2015 was 1.687, ranking second. In 2011/2010, it was 1.372, ranking third. In 2013/2012, it was 1.243, ranking fourth. In 2014/2013, it was 1.174, ranking fifth. In 2010/2009, it was 1.154, ranking sixth. In 2012/2011, it was 1.071, ranking seventh. Only the Tfpch in 2015/2014 was 0.764 < 1, which was in a state of negative growth.
Audit evaluation and analysis was also conducted from the perspective of the mean value of the total factor productivity change index. It was found that the average value of the technological progress change index and the total factor yield change index of marine economic development from 2008 to 2016 was 1.251 > 1. This indicated that the quality of marine economic development has continued to grow, with an average annual increase of 25.1%. Technical efficiency, pure technical efficiency, and scale efficiency were all 1, and currently remain unchanged. Therefore, the increase in the change index of total factor productivity has mainly been caused by the increase in the change index of technological progress, and technical efficiency plays a role in promoting total factor growth. The trend of technological progress index changes also indicated that Jiangsu’s marine development efficiency level presents an intensive growth mode.
4. Discussion
The audit evaluation of the quality of marine economic development and the analysis of driving factors is of great significance for improving the efficiency of marine economic development, as well as promoting the rational development and utilization of the ocean. It can provide a scientific basis for the formulation, optimization, and adjustment of marine resource development strategies, in addition to marine economic development planning [42]. It will help marine development and management departments to enhance risk control and cost savings, and to improve the efficiency of marine economic management. It is helpful to grasp and accurately understand the quality of marine economic development in a timely manner, provide decision support for the high-quality development of the marine economy, and promote rational marine and sustainable development.
The PCA is a method of reducing the dimension of data variables, which can reduce multivariate variables into fewer partial variables without causing a large loss of information. On the one hand, the original numerous indicators with a certain degree of correlation are recombined into a small number of uncorrelated comprehensive indicators to replace the original indicators, so that they can not only reflect the information represented by the original variables to the greatest extent, but it also is guaranteed that the information between the new indicators does not overlap. On the other hand, the evaluation results and main influencing factors can also be drawn, and methods and approaches to improve and enhance the level of marine economic development can also be proposed. The CCD model can analyze the interaction relationship between the systems and the coordination status, reflecting the degree of mutual dependence and restriction between the systems and the relationship of coordinated development. The DEA model is a non-parametric statistical estimation method that projects DMU onto the DEA front with the help of mathematical linear programming, and evaluates their relative effectiveness by comparing the extent to which DMU deviates from the DEA front [43]. Since the evaluation results of DEA are sensitive to the selection of input and output variable indicators, it is not conducive to taking into account more dimensions of input and output when the sample is limited. Therefore, it is not appropriate to set too many indicators in the calculation of the indicator system, and the principal component analysis method can be incorporated to eliminate the variable indicators with some overlapping information in the evaluation indicator system.
This paper combined the PCA, CCD, and Malmquist models. It makes up for the deficiency of the traditional evaluation method, and does not need to calculate the weight of the evaluation index. It avoids the selection of key indicators and personal preferences in traditional evaluation methods. Furthermore, according to the principal component analysis of input and output variable indicators, the key influencing factors of marine economic development can be fully considered. The selection of variable indicators can be further expanded, so that objective and real results can be given. The Malmquist index does not need to give weights to the evaluation indicators, that is, it does not need to calculate the indicator weights. It is mainly used to explore the efficiency dynamics between stages, and to measure the dynamic trend of productivity through the distance function [44]. The Malmquist index can be decomposed into Effch and Techch. Its economic implication is to reflect changes in technical efficiency by comparing the distances of decision-making units in different periods relative to the production frontier, that is, the ratio of the distance between the actual output level in different periods and the respective optimal output level. Techch reflects technological progress by comparing the movement of the production frontier in different periods, that is, the ratio of the optimal output level of the same input in different periods [45,46]. Effch is further decomposed into Pech and Sech, Effch. Thus, the Malmquist exponent can be decomposed as: . When M > 1, that is, from t to t + 1, Tfpch shows an increasing trend. When M < 1, that is, from t to t + 1, Tfpch shows a downward trend. When M = 1, that is, from t to t + 1, Tfpch is stable.
By comparing the Malmquist index, it can reflect the dynamic changes of the overall efficiency in each year, and reveal the pros and cons of the quality of marine economic development, according to the total factor productivity and composition decomposition of marine economic development. The audit evaluated the total factor productivity level and dynamic change trend of the quality of marine economic development in Jiangsu Province, China, from 2008 to 2016. According to the respective importance of Effch, Techch, Pech, and Sech, and the connection with Tfpch, the main reasons and development laws affecting the development of marine economy were analyzed. Since the underlying data of the DEA model cannot be negative, the principal components of the input and output variables were scored. This paper calculated and compared the Malmquist exponents after shifting up by 1 unit and 0.7 units, respectively (Table 8). It was found that the two evaluation results of the development of marine economy were essentially the same, with the same trend and the same order in each year. In 2015/2014, both were less than 1, which was a negative growth state of marine economic development. In each year, Effch, Pech, and Sech are equal to 1, and remain unchanged. Techch is equal to Tfpch, that is, technological progress, and changes have a decisive impact on total factor growth. Techch is equal to Tfpch, indicating that Techch changes have a decisive impact on Tfpch growth. The changing trend of Techch also marks that the development level of Jiangsu’s marine economy is moving towards an intensive growth mode.
Overall, there is much room for improvement in the quality and efficiency of marine economic development in Jiangsu Province. It is necessary to continuously strengthen technological innovation and introduction, promote the progress of technological efficiency and pure technological efficiency, and ensure the utilization rate of technological investment. It is also necessary to encourage innovative scientific research projects and projects, improve innovation capabilities, and achieve innovative achievements and technological progress, in order to improve development efficiency and output quality on the basis of certain inputs, and then promote the improvement of the total factor production level of marine economic development in Jiangsu Province. This involves expanding the scale of development and improving the scale efficiency change index by increasing the overall development scale and optimizing the development structure, while increasing the scale efficiency.
5. Conclusions and Policy Recommendation
In this paper, the marine input index and marine output index were screened, respectively, and an audit evaluation index system for the quality of marine economic development was constructed. Using the combination of PCA and DEA models, the overlapping information was eliminated, and the Malmquist index was calculated based on the results of the principal component score and the principal component contribution rate. The quality audit evaluation and driving force analysis of marine economic development were carried out, and optimization countermeasures and suggestions were put forward.
First, the development of the marine economy tends to be diversified, and the influence of the main influencing factors on the development of the marine economy is gradually decreasing. Among them, total industrial wastewater discharge, phytoplankton diversity index, and wetland areas are the key driving factors of marine economic development investment. The proportion of marine GDP in the overall GDP of coastal areas, the added value of marine and related industries, and the number of marine-related employees are the key drivers of marine economic development output.
Second, on the one hand, it was found that the coupling coordination level of high-quality development of the marine economy from 2010 to 2013 was of an excellent coordination level. In 2015 and 2008, they were of an intermediate coordination level and a primary coordination, level respectively. The remaining years were at a good coordination level. On the other hand, it was found that the investment in marine economic development was gradually optimized, and the output of marine economic development is increasing day by day. This fully shows that the development of the marine economy is gradually showing an intensive and benign development state with low input and high output.
Third, the overall average of the Malmquist index from 2008 to 2016 was 1.251 > 1. The development of the marine economy is in a state of continuous growth, with an average increase of 25.1%. Among them, Techch played a decisive role. Only 2015/2014 was in a state of negative growth, and the other evaluation years were in a state of continuous growth. The key way in which to promote the quality of marine economic development is through the improvement of Tfpch. The marine management department should strengthen the improvement of technical efficiency, adhere to the road of science and technology intensification, and maintain the steady growth of technological progress and innovation, thereby giving play to the promoting role of technical efficiency and technological progress in improving the efficiency of marine economic development.
Fourth, due to the restrictive factors in the acquisition of marine economic data, it is difficult to achieve a comprehensive evaluation index system for the high-quality development of the marine economy. Therefore, it is particularly important to select and build a comprehensive, systematic, scientific, and standardized marine high-quality development evaluation index system. In future research, we need to carry out research on the theory, method, and practice of marine economic development from different regional scales and different perspectives. It is necessary to deeply explore the connotation, temporal and spatial distribution, and dynamic evolution characteristics of a high-quality marine economy. We need to continue to improve the relevant theoretical system and research framework for the high-quality development of the marine economy systematically sorting out the screening and reduction of index system, determining evaluation standards, calculating index weight, selection of evaluation model, verifying evaluation results, analyzing key influencing factors and obstacles, predicting future trends, analysis, and optimization paths, among other important links.
Finally, the countermeasures and suggestions to promote the high-quality development of China’s marine economy mainly include adhering to focusing on the whole elements and process of marine economic development; adhering to innovation driven and structural optimization, promoting the full utilization and effective allocation of marine production factors, and improving the efficiency of resource utilization; adhering to the overall planning and coordinated development of land and sea, promoting the integrated utilization of land and sea resources, constantly improving the marine ecological environment, and improving the quality of marine economic development; adhering to the concept of modern marine economic development, improving basic service capacity, and accelerating marine scientific and technological innovation; improving relevant safeguard measures and innovating comprehensive management and operation mechanism; and adhering to the concept of green development. We will improve the accounting of the gross product of marine ecosystems, accelerate the construction of the marine environmental protection systems, and strengthen the comprehensive prevention and control of marine and land pollution, by improving the risk prevention and control system of major coastal environmental risk sources and sensitive points, as well as marine environment monitoring, monitoring, early warning, disaster prevention, and reduction system.
Author Contributions
S.G. proposed the research framework and wrote the paper; H.S. established the model; R.W. analyzed the data. All authors have read and agreed to the published version of the manuscript.
Funding
This work was supported by the Jiangsu Social Science Fund (Grant No. 19GLC013), and the National Audit Research Institute Fund of Nanjing Audit University (Grant No. 20xsjb06).
Institutional Review Board Statement
Not applicable.
Informed Consent Statement
Not applicable.
Data Availability Statement
Not applicable.
Conflicts of Interest
The authors declare no conflict of interest.
References
- Zhao, H.L. The Key of High Quality Development: Innovation Driven, Green Development and People’s Welfare. Chin. J. Environ. Manag. 2018, 10, 5–9. (In Chinese) [Google Scholar]
- Wang, J.T. Study on Transformation of China’s Marine Development Direction and Policy in the Thirteenth Five-Year Planning Period. Ecol. Econ. 2016, 32, 21–24. (In Chinese) [Google Scholar]
- Mlachila, M.; Tapsoba, R.; Tapsoba, S. A Quality of Growth Index for Developing Countries: A Proposal; Springer: Amsterdam, The Netherlands, 2017; Volume 134, pp. 675–710. [Google Scholar]
- Yan, Y.; Tsydypova, A.; Zhang, Y. Evaluation of Marine Economic Efficiency of China’s Coastal Provinces Based on DEA Model. J. Coast. Res. 2020, 112, 315–318. [Google Scholar] [CrossRef]
- Meng, X.; Di, Q.B.; Ji, J.W. Measurement on the Level of the Urban Ecological Performance and Analysis of Influential Factors in Beijing-Tianjin-Hebei Urban Agglomeration. Econ. Geogr. 2020, 40, 181–186 + 225. (In Chinese) [Google Scholar]
- Xu, J.J. Research on the efficiency of Marine aquaculture production in China’s coastal provinces based on the DEA-Malmquist index. J. Guizhou Prov. Party Sch. 2020, 1, 57–68. (In Chinese) [Google Scholar]
- Zhang, X. Marine Protected Areas and the National Marine Development Strategy. J. Nanjing Tech. Univ. 2017, 16, 100–105. (In Chinese) [Google Scholar]
- Wang, X.; Xu, X.H. Spatial-Temporal Evolution and Regional Disparity of Economic High-Quality Development in the Yangtze River Economic Belt. Econ. Geogr. 2020, 40, 5–15. (In Chinese) [Google Scholar]
- Xiao, W.W.; Zhao, B.X.; Wang, L.L. Marine industrial cluster structure and its coupling relationship with urban development: A case pf Shandong province. Pol. Marit. Res. 2016, 23, 115–122. [Google Scholar]
- Gao, S.; Sun, H.H.; Ma, M.S.; Lu, Y.Y.; Liu, W. Vulnerability assessment of marine economic system based on comprehensive index and catastrophe progression model. Ecosyst. Health Sustain. 2020, 6, 1834459. [Google Scholar] [CrossRef]
- Tian, J.; Xia, Q.; Wang, P. Comprehensive Management and Coordination Mechanism of Marine Economy. Math. Probl. Eng. 2021, 2021, 6616412. [Google Scholar] [CrossRef]
- Morrissey, K.; O’Donoghue, C. The Irish marine economy and regional development. Mar. Policy 2012, 36, 358–364. [Google Scholar] [CrossRef]
- Yang, L.J.; Wang, P.; Cao, L.L.; Liu, Y.J.; Chen, L. Studies on Charges for Sea Area Utilization Management and Its Effect on the Sustainable Development of Marine Economy in Guangdong Province, China. Sustainability 2016, 8, 116. [Google Scholar] [CrossRef] [Green Version]
- Wu, F.; Gao, Q.; Liu, T. Efficiency measurement of marine scientific and technological Innovation for marine economic Growth. Stat. Decis. 2019, 35, 119–122. [Google Scholar]
- Lu, Y. Circular economy development mode of coastal and marine areas in China and its evaluation index research—The example of Qingdao. Int. J. Bioautomation 2014, 18, 121–130. [Google Scholar]
- Xiang, Y.B.; Peng, X.F.; Zhang, Y. Status of marine economic development and comprehensive evaluation of the strength in the yangtze river delta. Trop. Geogr. 2010, 30, 644–649. (In Chinese) [Google Scholar]
- Liu, H.; Ma, L.; Li, G.P. Dynamic pattern and its factors of urban economic efficiency in China. Geogr. Res. 2020, 39, 880–891. (In Chinese) [Google Scholar]
- Zhang, Z.; Sun, J.Z.; Yang, X.; Liu, S.X.; Hu, Y. The Response Measures of Marine Economy to Regional Economic Development. Ecol. Econ. 2019, 35, 48–54. (In Chinese) [Google Scholar]
- Zhou, B. Efficiency Decomposition of Driving Force for Regional Economy High Quality Development and the Convergence Test of TFP Change. Rev. Econ. Manag. 2020, 36, 133–148. [Google Scholar]
- Zhao, M.; Xiao, J.H. Evaluation of green development level of Marine economy in Guangdong province based on entropy method. J. Phys. Conf. Ser. 2021, 1774, 12012. [Google Scholar] [CrossRef]
- Yan, X.D.; Shi, X.R.; Fang, X. The internal dynamics and regional differences of China’s marine economic evolution based on comprehensive evaluation. Alex. Eng. J. 2022, 61, 7571–7583. [Google Scholar] [CrossRef]
- Li, X.M.; Zhou, S.W.; Yin, K.D.; Liu, H.C. Measurement of the high-quality development level of China’s marine economy. Mar. Econ. Manag. 2021, 4, 23–41. [Google Scholar] [CrossRef]
- Wang, Y.Y.; Xue, C.H.; Li, H.M.; Yu, K.Z. Efficiency Measurement and Determinant Factors of Marine Economy in China: Based on the Belt and Road Perspective. Discret. Dyn. Nat. Soc. 2021, 2021, 5546200. [Google Scholar] [CrossRef]
- Bai, F.; Lai, X.; Xiao, C. The Model of Comprehensive Evaluation and Empirical Research on Sustainable Development of Marine Economy. Sci. Technol. Manag. Res. 2015, 35, 59–62. (In Chinese) [Google Scholar]
- Liang, H.; Amp, L.U.; Amp, R.C. An Analysis on the Comprehensive Measurements and Spatio-temporal Evolution of China’s Green Development of Marine Economy. Ocean Dev. Manag. 2019, 36, 73–83. (In Chinese) [Google Scholar]
- Zheng, L.; Cai, D.H.; Yang, N. Empirical Research on the Comprehensive Evaluation System of Marine Economy Based on Sustainable Development—The case of Bohai Sea Area. Mar. Econ. 2015, 5, 21–31. (In Chinese) [Google Scholar]
- Huang, G.H.; Zeng, J.T.; Gao, X.Y.; Liu, C.Y.; Tian, G.X. Sustainable Development of Marine Economy in Jiaodong Peninsula. Rev. Fac. De Agron. Univ. Zulia 2019, 36, 679–689. [Google Scholar]
- Liu, B.; Long, R.Y.; Zhu, C.G.; Sun, X.X.; Pan, K.Y. Comprehensive Measurement of the Index System for Marine Economy High-Quality Development in Jiangsu Province. Econ. Geogr. 2020, 40, 104–113. (In Chinese) [Google Scholar]
- Wu, D.J. Impact of green total factor productivity in marine economy based on entropy method. Pol. Marit. Res. 2018, 25, 141–146. [Google Scholar] [CrossRef] [Green Version]
- Wang, Z.Y.; Guo, T.; Fan, Y.X. Measurement of High-quality Development Level of China’s Marine Economy. Mar. Econ. 2020, 10, 13–24. (In Chinese) [Google Scholar]
- Dong, Z. A Study on the Transformation and Upgrading of Zhejiang Marine Economic Industrial Structure Based on the Analysis and Evaluation of Scientific and Technological Innovation. J. Coastal Research 2019, 98, 231. [Google Scholar] [CrossRef]
- Wang, L.Y.; Yang, Y.; Gao, X.X. Difference of Operational Efficiency of Regional Technology Markets in China—Based on DEA-BCC and DEA-Malmquist Model. Sci. Technol. Econ. 2020, 33, 36–40. (In Chinese) [Google Scholar]
- Wang, Z.Y.; Zhang, Z.; Han, Z.L.; Sun, C.Z.; Lin, Y.R. Response measures of the marine economy to regional economic development. Resour. Sci. 2016, 38, 1832–1845. (In Chinese) [Google Scholar]
- Zhao, X.; Guo, K.Y. Efficiency Analysis and Evaluation of Marine Economy in Coastal Areas Based on the GRA-DEA Mixed Model. Mar. Econ. 2012, 2, 5–10. (In Chinese) [Google Scholar]
- Wen, M.M.; Liu, C.; Mamonov, K.A.; Du, J. Measurement of Coordinated and Coupled Development and Evaluation of Sustainable Development for Marine Economic-Ecological Complex System. Discret. Dyn. Nat. Soc. 2021, 2021, 2043635. [Google Scholar] [CrossRef]
- Sun, C.Z.; Wang, S.; Zou, W.; Wang, Z.Y. Estimating the efficiency of complex marine systems in China’s coastal regions using a network data envelopment analysis model. Ocean Coast. Manag. 2017, 139, 77–91. [Google Scholar] [CrossRef]
- Ren, W.H.; Ji, J.Y.; Chen, L.; Zhang, Y. Evaluation of China’s marine economic efficiency under environmental constraints–an empirical analysis of China’s eleven coastal regions. J. Clean. Prod. 2018, 184, 806–814. [Google Scholar] [CrossRef]
- Wei, X.Y.; Hu, Q.G.; Shen, W.T.; Ma, J.T. Influence of the Evolution of Marine Industry Structure on the Green Total Factor Productivity of Marine Economy. Water 2021, 13, 1108. [Google Scholar] [CrossRef]
- Yin, K.D.; Li, J.Y. Measurement research on the dynamic changes of marine sustainable development in china. J. Manag. Sci. Stat. Decis. 2012, 9, 11–25. (In Chinese) [Google Scholar]
- Wang, S. Analysis of China’s Marine Economic Regional Characteristics and Development Countermeasures for these Regions. Econ. Geogr. 2012, 32, 80–84. (In Chinese) [Google Scholar]
- Morita, H.; Hirokawa, K.; Zhu, J. A slack-based measure of efficiency in context-dependent data envelopment analysis. Omega Int. J. Manag. Sci. 2005, 33, 357–362. [Google Scholar] [CrossRef]
- Xiao, J.; Hu, D. Construction and empirical study of the evaluation index system for high-quality development of marine economy in Guangdong Province based on five new development concepts. J. Phys. Conf. Ser. 2020, 1629, 12030. [Google Scholar] [CrossRef]
- Yang, X.; Li, X. Evaluation Research on Optimization Efficiency of Human Resource Allocation in Marine Insurance Industry Based on Malmquist Index Model. J. Coast. Res. 2019, 94, 677–681. [Google Scholar] [CrossRef]
- Jesus, T.P.; Knox, L.; Juan, A. Defining a new graph inefficiency measure for the proportional directional distance function and introducing a new Malmquist productivity index. Eur. J. Oper. Res. 2020, 281, 222–230. [Google Scholar]
- Yue, S.J.; Sun, S.Q.; Guo, M.Q. Sustainable total factor productivity growth: The case of China. J. Clean. Prod. 2020, 256, 120727. [Google Scholar]
- Xiang, W.Y.; Zhou, X.M. Estimate on green total factor productivity in Zhejiang Province: Based on DEA-MalmquistIndex. Sci. Technol. Econ. 2019, 32, 61–65. [Google Scholar]
Figure 1.
Regional location of Jiangsu Province, China.
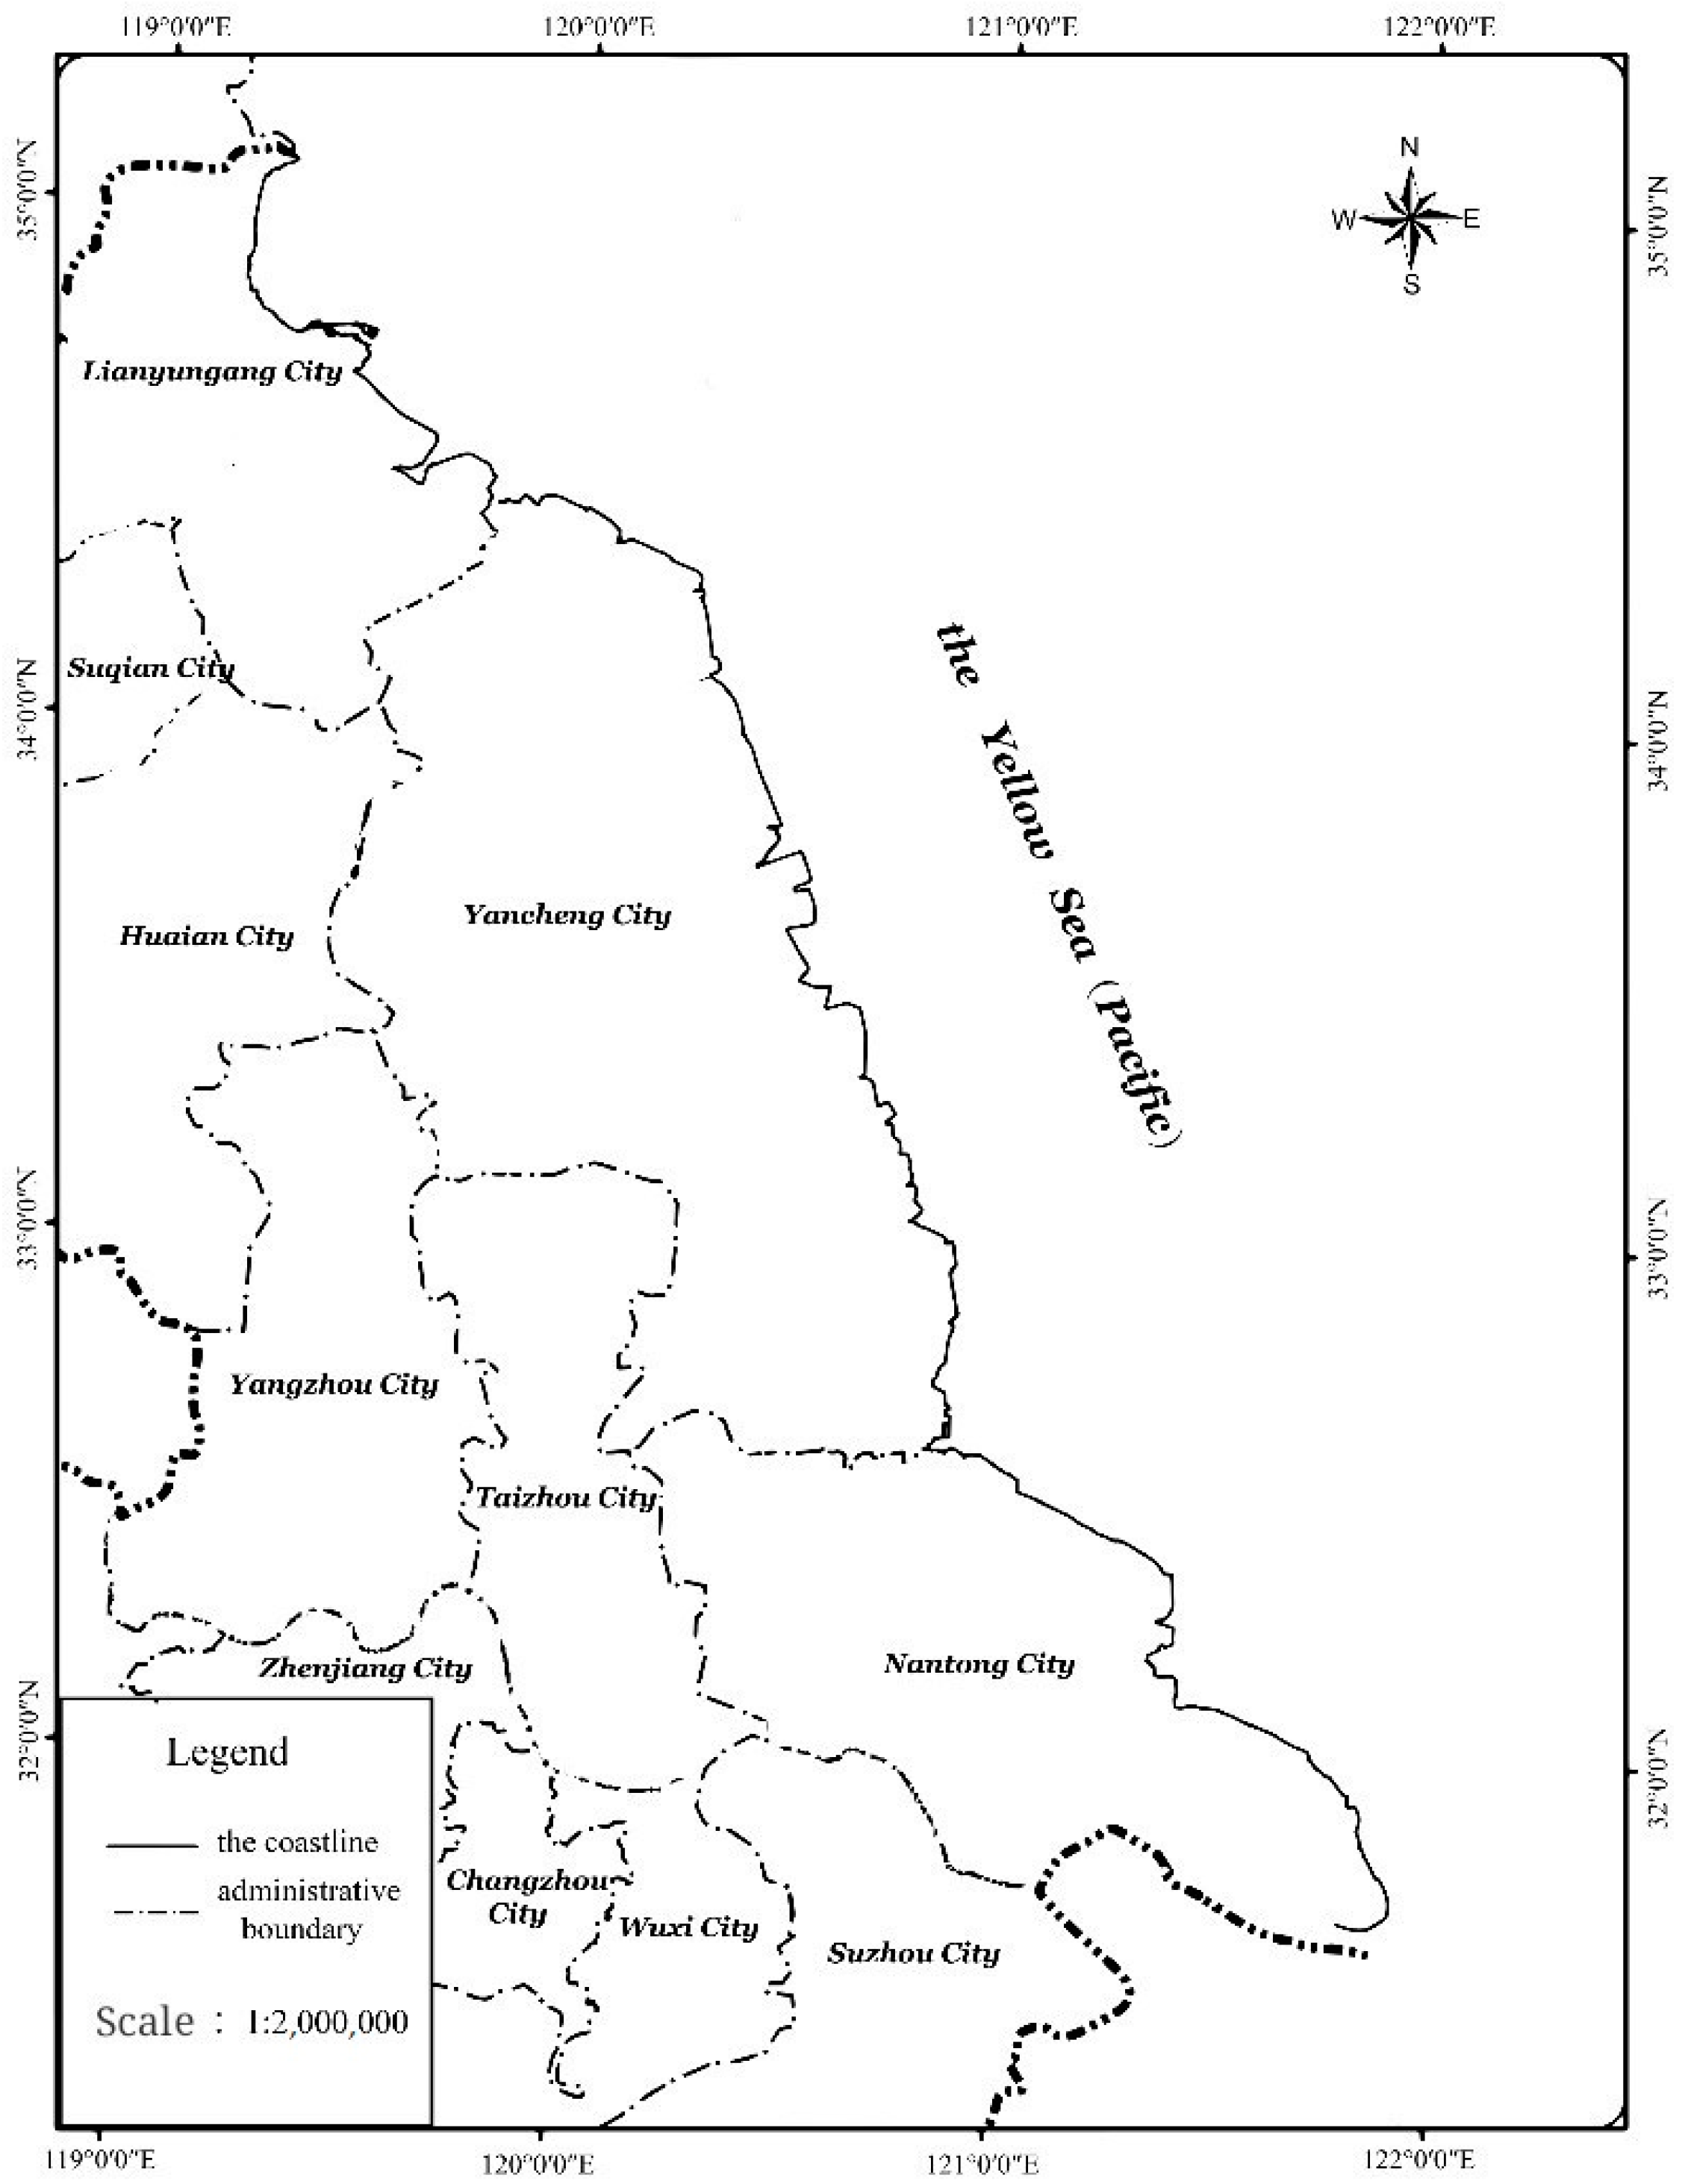
Figure 2.
The comprehensive score of principal components of the quality of marine economic development.
Figure 2.
The comprehensive score of principal components of the quality of marine economic development.
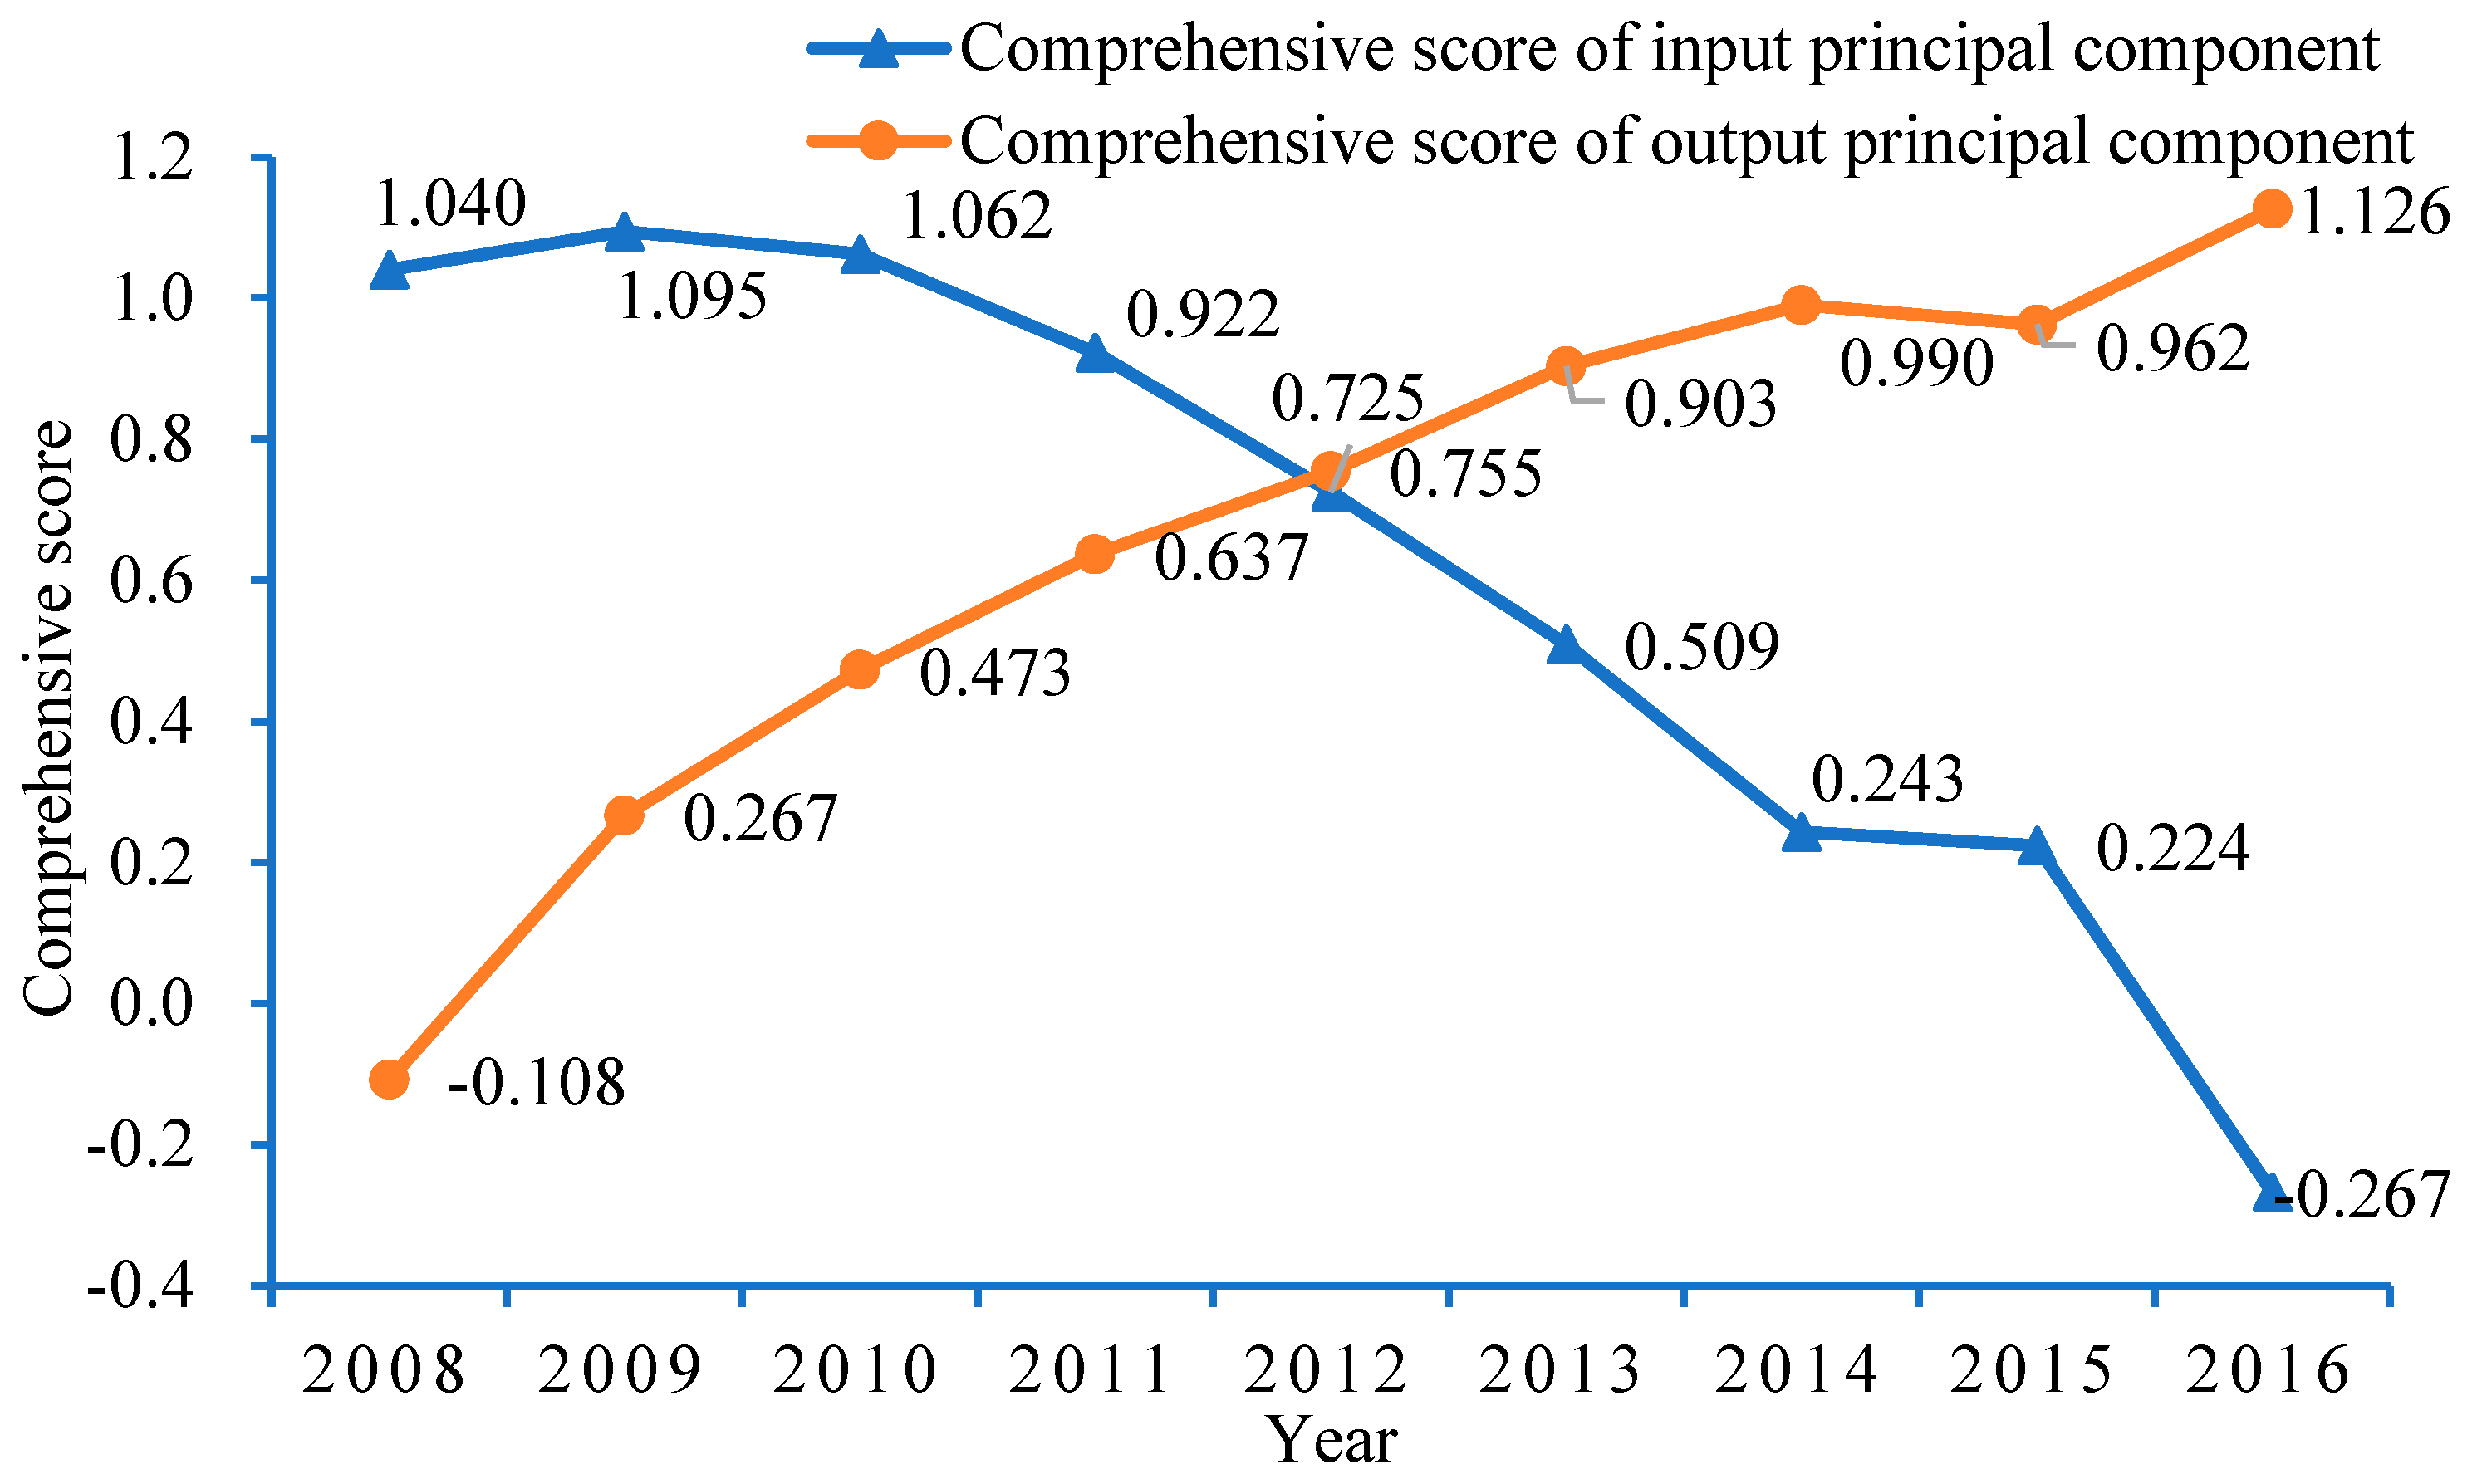
Figure 3.
Malmquist index.

Table 1.
The audit evaluation index system of marine economic development quality.
| Criterion Layer | Coastal Area Indicator Layer | Indicator Number | Indicator Type |
|---|---|---|---|
| Input indicators | Wetland area (10,000 hectares) | I1 | Cost type |
| Per capita water resources (m3/person) | I2 | Cost type | |
| Mariculture area (Ha) | I3 | Cost type | |
| Wind power generation capacity (10,000 KW) | I4 | Beneficial | |
| Phytoplankton diversity index | I5 | Cost type | |
| Large zooplankton diversity index | I6 | Cost type | |
| Benthic biodiversity index | I7 | Cost type | |
| Total industrial wastewater discharge (10,000 tons) | I8 | Cost type | |
| Industrial waste gas emission (100 million m3) | I9 | Cost type | |
| Industrial smoke (powder) dust emission (100 million m3) | I10 | Cost type | |
| Output indicators | Added value of marine and related industries (100 million yuan) | O1 | Beneficial |
| Proportion of marine GDP in GDP of coastal areas (%) | O2 | Beneficial | |
| Proportion of output value of marine primary industry (%) | O3 | Beneficial | |
| Proportion of output value of marine secondary industry (%) | O4 | Beneficial | |
| Proportion of output value of marine tertiary industry (%) | O5 | Beneficial | |
| Number of marine-related employees (10,000 persons) | O6 | Beneficial | |
| Marine passenger volume (10,000 persons) | O7 | Beneficial | |
| Cargo throughput of coastal ports (10,000 tons) | O8 | Beneficial | |
| Area of marine type nature reserve (hm2) | O9 | Beneficial |
Table 2.
Audit evaluation criteria of coupling coordination level and type.
| The Coupling coordination degree | 0.8–1.0 | 0.7–0.8 | 0.6–0.7 | 0.5–0.6 | 0.4–0.5 | 0.3–0.4 | 0.0–0.3 |
| The coupling coordination level | Excellent coordination | Good coordination | Intermediate coordination | Primary coordination | Mild dissonance | Moderate dissonance | Severe dissonance |
Table 3.
Extraction sums of squared loadings.
| Element | Principal Component Input Index | Principal Component Output Index | ||||
|---|---|---|---|---|---|---|
| 1 | 2 | 3 | 1 | 2 | 3 | |
| Total | 5.015 | 2.684 | 1.216 | 4.533 | 2.264 | 1.505 |
| Percent variance | 50.146 | 26.836 | 12.156 | 50.365 | 25.155 | 16.724 |
| Accumulation | 50.146 | 76.982 | 89.138 | 50.365 | 75.52 | 92.245 |
Table 4.
Factor loading matrix and eigenvectors of the principal components.
| Evaluation Factor | Principal Component Loading | Feature Vector | ||||
|---|---|---|---|---|---|---|
| 1 | 2 | 3 | 1 | 2 | 3 | |
| I8 | −0.986 | 0.052 | −0.038 | −0.440 | 0.032 | −0.035 |
| I5 | 0.937 | −0.178 | −0.185 | 0.419 | −0.109 | −0.168 |
| I1 | 0.906 | −0.101 | −0.193 | 0.404 | −0.062 | −0.175 |
| I7 | −0.789 | 0.312 | −0.173 | −0.353 | 0.191 | −0.157 |
| I6 | 0.739 | −0.061 | −0.515 | 0.330 | −0.037 | −0.467 |
| I10 | 0.442 | 0.859 | 0.186 | 0.198 | 0.525 | 0.168 |
| I9 | 0.504 | 0.831 | 0.181 | 0.225 | 0.507 | 0.164 |
| I4 | −0.594 | 0.751 | −0.134 | −0.265 | 0.459 | −0.122 |
| I2 | 0.561 | 0.617 | 0.175 | 0.251 | 0.377 | 0.159 |
| I3 | 0.238 | −0.404 | 0.855 | 0.106 | −0.246 | 0.776 |
| O2 | 0.933 | −0.229 | 0.121 | 0.438 | −0.152 | 0.098 |
| O1 | 0.870 | 0.474 | 0.032 | 0.409 | 0.315 | 0.026 |
| O6 | 0.862 | 0.481 | 0.098 | 0.405 | 0.320 | 0.080 |
| O9 | −0.796 | 0.427 | −0.214 | −0.374 | 0.284 | −0.174 |
| O8 | 0.791 | 0.551 | 0.215 | 0.372 | 0.366 | 0.176 |
| O5 | −0.683 | 0.632 | 0.331 | −0.321 | 0.420 | 0.270 |
| O4 | 0.523 | −0.842 | −0.026 | 0.246 | −0.559 | −0.021 |
| O3 | 0.399 | 0.402 | −0.674 | 0.187 | 0.267 | −0.550 |
| O7 | −0.063 | −0.024 | 0.907 | −0.029 | −0.016 | 0.739 |
Table 5.
Input principal component score and output principal component score.
| Year | Principal Components of Input Indicators | Principal Components of Output Indicators | ||||
|---|---|---|---|---|---|---|
| F1 Score | F2 Score | F3 Score | F1 Score | F2 Score | F3 Score | |
| 2008 | 1.438 | 0.800 | 0.860 | −0.655 | 0.768 | 0.173 |
| 2009 | 1.663 | 0.887 | 0.187 | 0.625 | −0.076 | −0.174 |
| 2010 | 1.587 | 1.073 | −0.176 | 1.052 | −0.328 | 0.152 |
| 2011 | 1.291 | 1.210 | −0.408 | 1.151 | −0.163 | 0.585 |
| 2012 | 0.621 | 1.608 | −0.149 | 1.288 | 0.284 | 0.205 |
| 2013 | −0.037 | 1.786 | 0.400 | 1.145 | 0.674 | 0.939 |
| 2014 | −0.106 | 1.055 | 0.107 | 1.430 | 0.662 | 0.617 |
| 2015 | −0.250 | 1.156 | 0.323 | 1.538 | 0.843 | −0.147 |
| 2016 | −0.640 | 0.148 | 0.116 | 1.783 | 0.976 | −0.103 |
Table 6.
Sort of comprehensive scores of principal components of input indicators and output indicators.
Table 6.
Sort of comprehensive scores of principal components of input indicators and output indicators.
| Year | 2008 | 2009 | 2010 | 2011 | 2012 | 2013 | 2014 | 2015 | 2016 |
|---|---|---|---|---|---|---|---|---|---|
| Input Indicators | 3 | 1 | 2 | 5 | 4 | 6 | 7 | 8 | 9 |
| Output Indicators | 9 | 8 | 7 | 6 | 5 | 4 | 2 | 3 | 1 |
Table 7.
The coupling coordination Degree and level of high-quality development of marine economy.
| Year | 2008 | 2009 | 2010 | 2011 | 2012 | 2013 | 2014 | 2015 | 2016 |
|---|---|---|---|---|---|---|---|---|---|
| H | 0.579 | 0.735 | 0.842 | 0.875 | 0.86 | 0.824 | 0.7 | 0.681 | 0.741 |
| Level | Primary | Good | Excellent | Excellent | Excellent | Excellent | Good | Intermediate | Good |
Table 8.
Comparison of the Malmquist Index after translation of 1 unit and 0.7 unit.
| Year | Tfpch | Sort | |
|---|---|---|---|
| The Comprehensive Score of Principal Component Shifts Upward by 1 Unit | The Comprehensive Score of Principal Component Shifts Upward by 0.7 Unit | ||
| 2009/2008 | 1.88 | 4.465 | 1 |
| 2010/2009 | 1.154 | 1.21 | 6 |
| 2011/2010 | 1.372 | 1.629 | 3 |
| 2012/2011 | 1.071 | 1.015 | 7 |
| 2013/2012 | 1.243 | 1.296 | 4 |
| 2014/2013 | 1.174 | 1.211 | 5 |
| 2015/2014 | 0.764 | 0.705 | 8 |
| 2016/2015 | 1.687 | 3.355 | 2 |
| Mean Value | 1.251 | 1.549 | |
Publisher’s Note: MDPI stays neutral with regard to jurisdictional claims in published maps and institutional affiliations. |
© 2022 by the authors. Licensee MDPI, Basel, Switzerland. This article is an open access article distributed under the terms and conditions of the Creative Commons Attribution (CC BY) license (https://creativecommons.org/licenses/by/4.0/).
Share and Cite
MDPI and ACS Style
Gao, S.; Sun, H.; Wang, R. Audit Evaluation and Driving Force Analysis of Marine Economic Development Quality. Sustainability 2022, 14, 6822. https://doi.org/10.3390/su14116822
AMA Style
Gao S, Sun H, Wang R. Audit Evaluation and Driving Force Analysis of Marine Economic Development Quality. Sustainability. 2022; 14(11):6822. https://doi.org/10.3390/su14116822
Chicago/Turabian StyleGao, Sheng, Huihui Sun, and Runjie Wang. 2022. "Audit Evaluation and Driving Force Analysis of Marine Economic Development Quality" Sustainability 14, no. 11: 6822. https://doi.org/10.3390/su14116822
Note that from the first issue of 2016, this journal uses article numbers instead of page numbers. See further details here.