Article

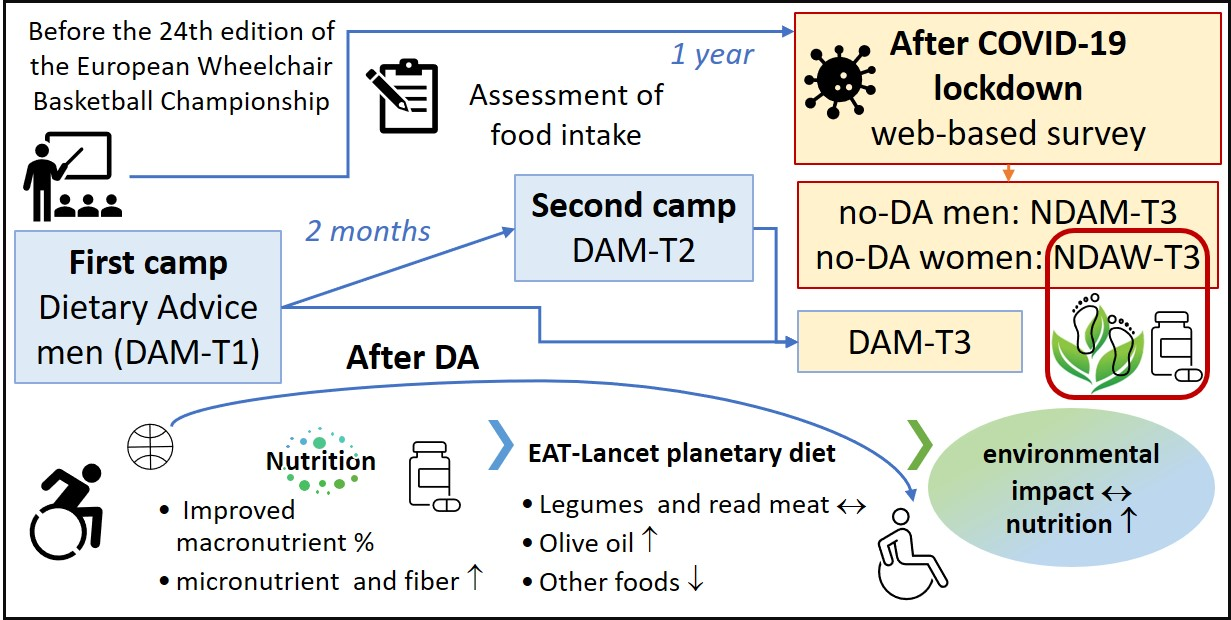
Longitudinal Effects of Dietary Advice on Wheelchair Basketball Athletes: Nutritional and Environmental Aspects

1
Research Centre for Food and Nutrition, Council for Agricultural Research and Economics (CREA-AN), 00178 Rome, Italy
2
Department of Neurosciences, Biomedicine and Movement Sciences, University of Verona, 37129 Verona, Italy
3
Department of Physiology and Pharmacology “V. Erspamer”, Sapienza University, 00185 Rome, Italy
4
Federazione Italiana Pallacanestro In Carrozzina (FIPIC), 00188 Rome, Italy
5
Joint Veteran Center, Scientific Department, Army Medical Center, 00184 Rome, Italy
*
Author to whom correspondence should be addressed.
Sustainability 2021, 13(9), 5244; https://doi.org/10.3390/su13095244
Submission received: 28 March 2021 / Revised: 2 May 2021 / Accepted: 4 May 2021 / Published: 7 May 2021
(This article belongs to the Special Issue Sustainability and Health as Trends in Consumer Behaviour)

Abstract

:
Background: Diet impacts both human and environmental health and must be designed to optimize the training and performance of athletes. The aim of this study was to quantify the effect of dietary advice (DA) on the food intake of wheelchair basketball athletes (WBA) and the environmental impact longitudinally. Methods: DA were provided to WBA of the Italian national team (DAM-T1). Nutritional assessment and evaluation of the environmental impact of diet were performed two months (DAM-T2) and one year later (DAM-T3), when a post-COVID-19 survey was performed also in WBA who did not receive counselling (men: NDAM-T3, women: NDAW-T3). Results: After DA, WBA showed a reduced percentage of energy derived from sugars and fats. Athletes adjusted their protein intake according to the personalized recommendations. The intake of some micronutrients improved after DA and was higher compared to NDAM-T3 and NDAW-T3. Despite the lower impact of diet in NDAW-T3, they presented more nutritional deficiency than men. The mean intake of vegetables was in the range of the EAT-Lancet Commission suggestion only two months after DA. After DA, fiber intake increased and adapted to the tolerated level. Conclusions: WBA improved their diet after DA but did not comply with the EAT-Lancet suggestion for red meat and legumes.

Graphical Abstract

1. Introduction

Overnutrition and high consumption of processed and animal foods have an effect on both human and environmental health [1,2] and it has been suggested that the excess body fat should be considered waste [3]. The coronavirus disease 19 (COVID-19) lockdown (LD) negatively impacted both dietary habits and physical activity, and increases in intake of energy-dense, sweet and salty foods and/or in screen use were observed in Europe, North America, South America, Australasia, Asia and Africa [4,5,6,7,8,9].
The ultra-processed food consumption was higher during the COVID-19 pandemic period and more prevalent in Latin America [10]. Moreover, the COVID-19 diet had lower nutritional quality and higher energy intake and environmental impact than the pre-COVID-19 diet in Spain [11].
On the contrary, in Italy, reported purchases of ready-made meals were reduced by 50% [12]. Overall, 21.2% of responders increased their consumption of fresh fruit and vegetables, despite the increase in “comfort food” (sweets) [12]. Chocolate, fresh vegetables, fruit and baking ingredients had the largest sales increase in Italy and 53.7% of individuals reduced their household food waste production, leading to sustainable habits [13]. It has been suggested that shifts toward mostly plant-based dietary patterns, with reduced meat consumption, can be partly due to increased awareness of illnesses linked to animal foods [14], and that increased purchasing of pulses [15] during the COVID-19 pandemic can lead to potential health and environmental benefits in the longer term. In France, a growing awareness of the importance of sustainable food choices has been reported [16] and the scores of adherence to the Mediterranean diet were higher in individuals who increased their physical activity during confinement [17].
Worldwide, higher body mass index (BMI) was associated with decreased levels of physical activity, lower diet quality and/or a greater frequency of overeating and emotional eating [6,18,19]. Paralympic athletes perceived a higher negative impact in their training by the LD, compared to Olympic athletes [20]. Various studies, conducted before the COVID-19 pandemic, have reported high fat intake and inadequate carbohydrate (CHO), fiber and/or pulse intake in Paralympic [21] and in wheelchair basketball athletes (WBA) [22,23,24,25,26]. Therefore, the need for dietary advice (DA) to improve the nutrition of Paralympic athletes has been previously suggested [23]. In male elite WBA, the macronutrient intake improved, after DA, from 3.8 ± 1.3 g/kg to 4.2 ± 1.9 g/kg CHO and from 36 ± 5 to 32 ± 5 percent of total energy intake (%En) derived from fat [27].
During an ongoing longitudinal study, aimed at evaluating the effect of DA on the food intake of the WBA of the Italian national team, the Italian Government imposed a quarantine of two months, restricting the movement of the population except for necessity, work and health circumstances, in response to the COVID-19 pandemic growing in the country. As a result, a post-COVID-19 LD follow-up was conducted, including a web-based survey comparing lifestyle changes during LD. Moreover, after LD, the nutritional quality and environmental impact of the diet of WBA who received DA were compared with those that did not.

2. Methods

2.1. Recruitment and Study Design

The study was conducted during two high-intensity training camps held in the precompetitive European championship and a follow-up was performed after one year. The Ethics Committee of the Department of Physiology and Pharmacology “Vittorio Erspamer”, Sapienza University of Rome (Italy) approved the study, and it was undertaken in accordance with the Helsinki Declaration for research on humans. Before participating, WBA were informed about the purpose of the study and provided their written consent.
During a training camp, before the 2019 European Championship (T1), personalized DA and an interactive course on healthy diet were provided to 16 WBA of the Italian national team. Adherence to DA was determined during a second training camp (T2) held two months later, exclusively on the 12 athletes who participated in both the training camps. One year after the dietary advice (June 2020), a post-COVID-19 LD follow-up (T3) was conducted during a meeting that also involved other 21 WBA, who did not receive personalized DA (12 men NDAM-T3 and 9 women NDAW-T3). These two groups were added to evaluate the differences in the self-reported impact of the LD on lifestyle, among WBA who did or did not receive DA.
Exclusion criteria were not applied to acquire data of top athletes (from the national junior team and from the women’s national team) of the “Federazione Italiana Pallacanestro in Carrozzina” (FIPIC), who agreed to participate.

2.2. Data Collection and Analysis

The health condition and the International Wheelchair Basketball Federation (IWBF) classification of WBA were provided by the FIPIC. A web-based survey was conducted to evaluate the self-reported characteristics and lifestyle, including dietary and physical activity changes during the 2 months of LD in Italy.
Due to the well-known association between sitting time and musculoskeletal symptoms [28], the survey included the Nordic Musculoskeletal Questionnaire (NMQ) [29], previously used to evaluate musculoskeletal symptoms in workers [28].
Body mass (BM) was determined using a calibrated electronic scale (Tanita BWB-800 MA, Wunder SA.BI. Ltd., Milano, Italy) to the nearest 0.1 kg with athletes wearing minimal clothing at T1, T2 and T3.
Dietary intake was assessed by means of a 3-day recall record questionnaire (two consecutive working days, and one weekend day or holiday, as fully described by Willett [30]) before each meeting event (T1, T2 and T3). The players were asked to record the amounts of food consumed by food weighing or with the help of visual tools to increase the accuracy of portion size. Data were completed during a nutritional interview. Supplement intake for each WBA was noted, and players provided packaging information about protein (PRO) powders/bars and sport beverages. An internal database was used to determine the nutrient composition of the meals according to the Italian Food Composition Tables (CREA-AN) and the United States Department of Agriculture (USDA) Databases (https://ndb.nal.usda.gov/ndb/, accessed on 14 January 2021).
Compliance with the recommended macronutrient and micronutrient intakes for the Italian population (Livelli di Assunzione di Riferimento di Nutrienti ed energia per la popolazione italiana (LARN) Dietary reference values of nutrients and energy for the Italian population), https://sinu.it/tabelle-larn-2014/, accessed on 14 January 2021), and with the suggested intakes for basketball players by the Federazione Medico Sportiva Italiana (FMSI) (https://www.nutrizioneesalute.fmsi.it/images/img/pdf/opuscolo_per_atleti_e_famiglie.pdf, accessed on 14 January 2021) and for Paralympic athletes [31], was evaluated. For micronutrient intake, gender-specific recommended values (LARN) were considered, and for fiber intake, two groups were considered based on the possible neurogenic bowel symptoms: spinal cord injury/spina bifida (SCI/SB, 15–30 g/d) [31] and amputation/other health conditions (AMP/OHC, LARN: 25 g/d).
Adherence to the suggested dietary intakes of food-groups of the EAT-Lancet planetary health diet was evaluated [1]. Moreover, the ecological footprints were assessed using the Barilla Center for Food & Nutrition (BCFN) database (https://www.barillacfn.com/en/double_pyramid_technical_data/, accessed on 14 January 2021). In particular, carbon footprint (g CO2), water footprint (L) and land footprint (m2) were calculated as previously described [3] and normalized for kg food for BM/d. Footprints reported by Berardy et al. [32] and Bacenetti et al. [33] were used for soy and whey PRO-supplements.

2.3. Statistics

Categorical variables were expressed as percentages and significance assessed by the χ2 test. Continuous variables were expressed as means and standard deviation (SD) for results passing normality test (Shapiro–Wilk) and were analyzed by analysis of variance (ANOVA) and Student–Newman–Keuls method. Otherwise, data were expressed as median (25–75% range) and analyzed by Kruskal–Wallis one-way analysis of variance on ranks and Dunn’s method. The level of significance was set below 5% (p < 0.05).

3. Results

3.1. Characteristics and Post-LD Survey

The IWBF class ranged between 1 and 4.5, with no differences among groups, whereas WBA in the NDAM-T3 group were younger compared to the other groups, according to the percentage of the senior team WBA (Table 1). Table 1 shows data regarding the health conditions of WBA and Table 2 shows the reported symptoms of COVID-19 during the LD. During this period, only 18% of the DAM-T3 athletes reported having received a screening test for COVID-19 (with overall negative results), while none of the NDAM-T3 and NDAW-T3 performed a screening test (Table 2). Despite this, 22% of the NDAW-T3 declared fatigue and percentages between 11% and 44% in all groups declared neck, shoulders, dorsal and/or lumbar pains during LD (Table 2).
Only some WBA in the NDAM-T3 group reported that the pain was not present before LD, whereas many athletes, especially in the DAM-T3 group, reported training as the main cause of pain (Table 2). However, other WBA declared that the cause of pain was the reduction in physiotherapy practice (NDAM-T3 and NDAW-T3) or the increase in the sedentary lifestyle (NDAM-T3). Accordingly, most of the male WBA declared more sedentary time and less exercising as consequences of LD (Table 2).
A voluntary reduction of food was performed by 36% of DAM-T3 and 42% of NDAM-T3, to avoid weight gain, and BM remained stable in around half of the sample (Table 2). Some WBA self-declared that they were on a diet during the LD and consequently they lost weight, while others maintained the same eating habits, but the lower frequency of training led to weight gain. In any case, subjects who received nutritional advice (DAM-T3) ascribed the BM increase to the increased training, whereas the other groups indicated the LD-induced lifestyle change as the main cause of BM increase (Table 2).
However, the comparison between measured and reported BM revealed a tendency to overestimate and underestimate BM by women and men, respectively (Table 1). On the other hand, the measured BM variation among the three different time points revealed a mean BM decrease in athletes of the DAM group (Table 1).

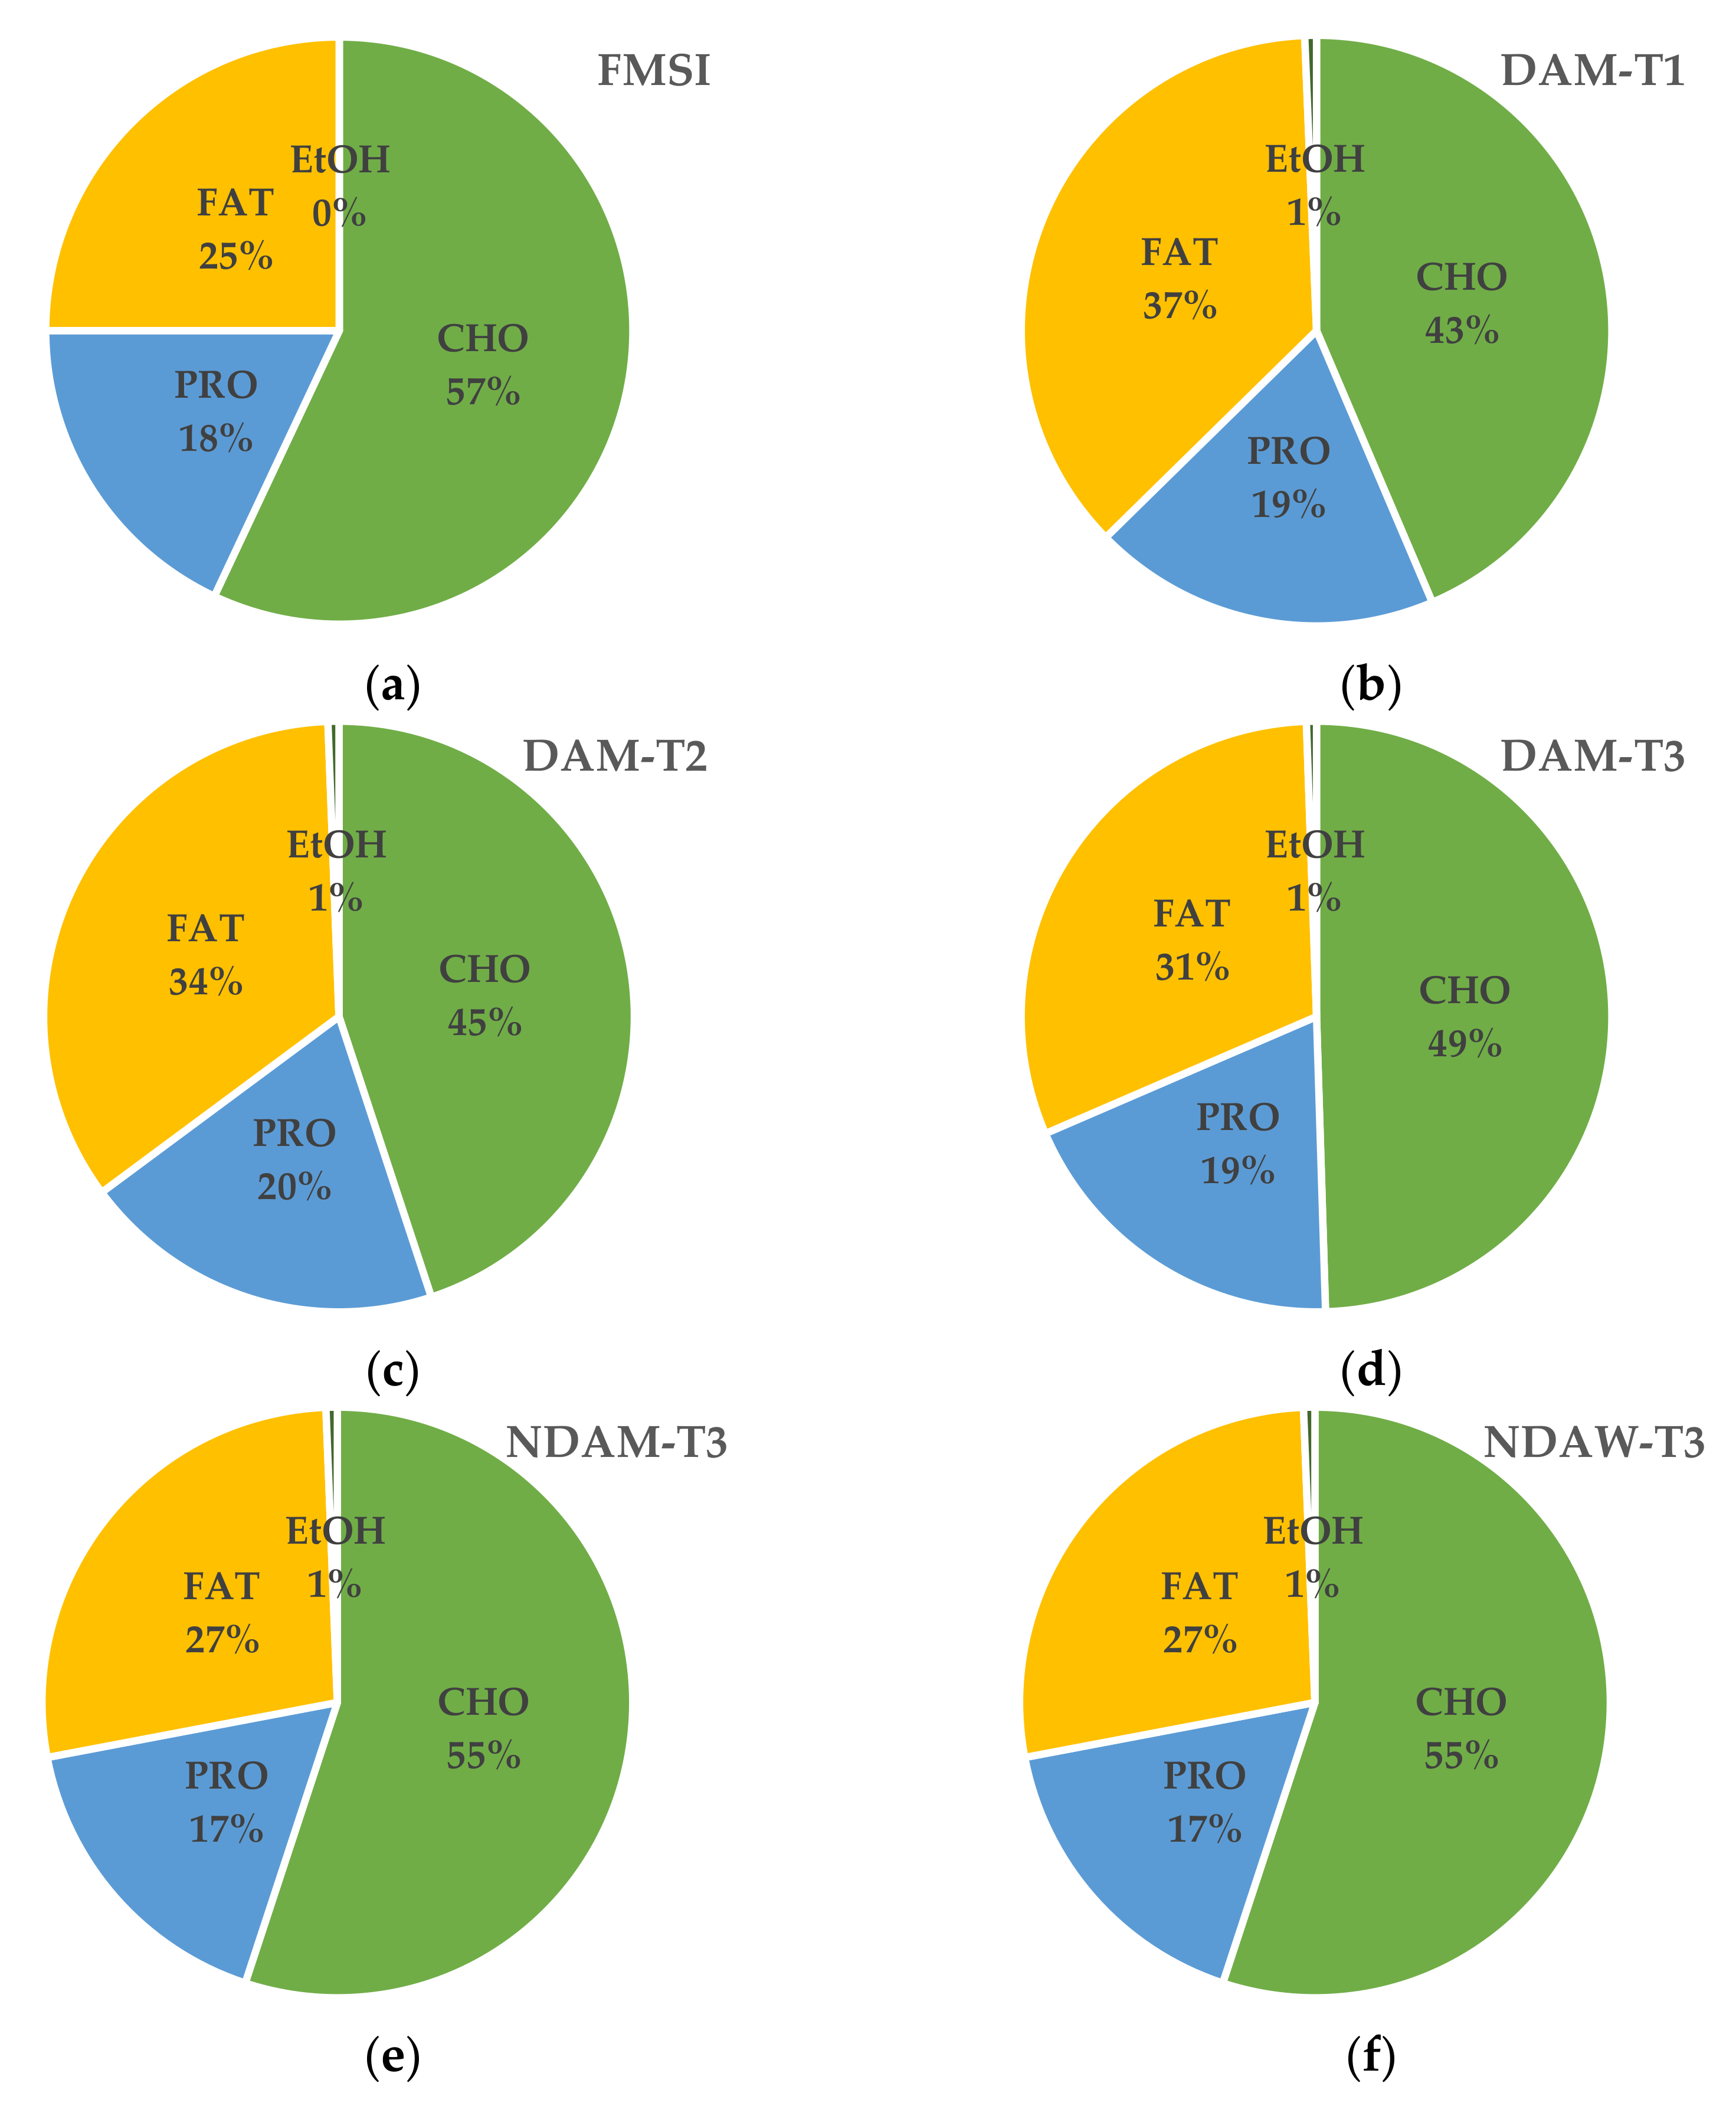
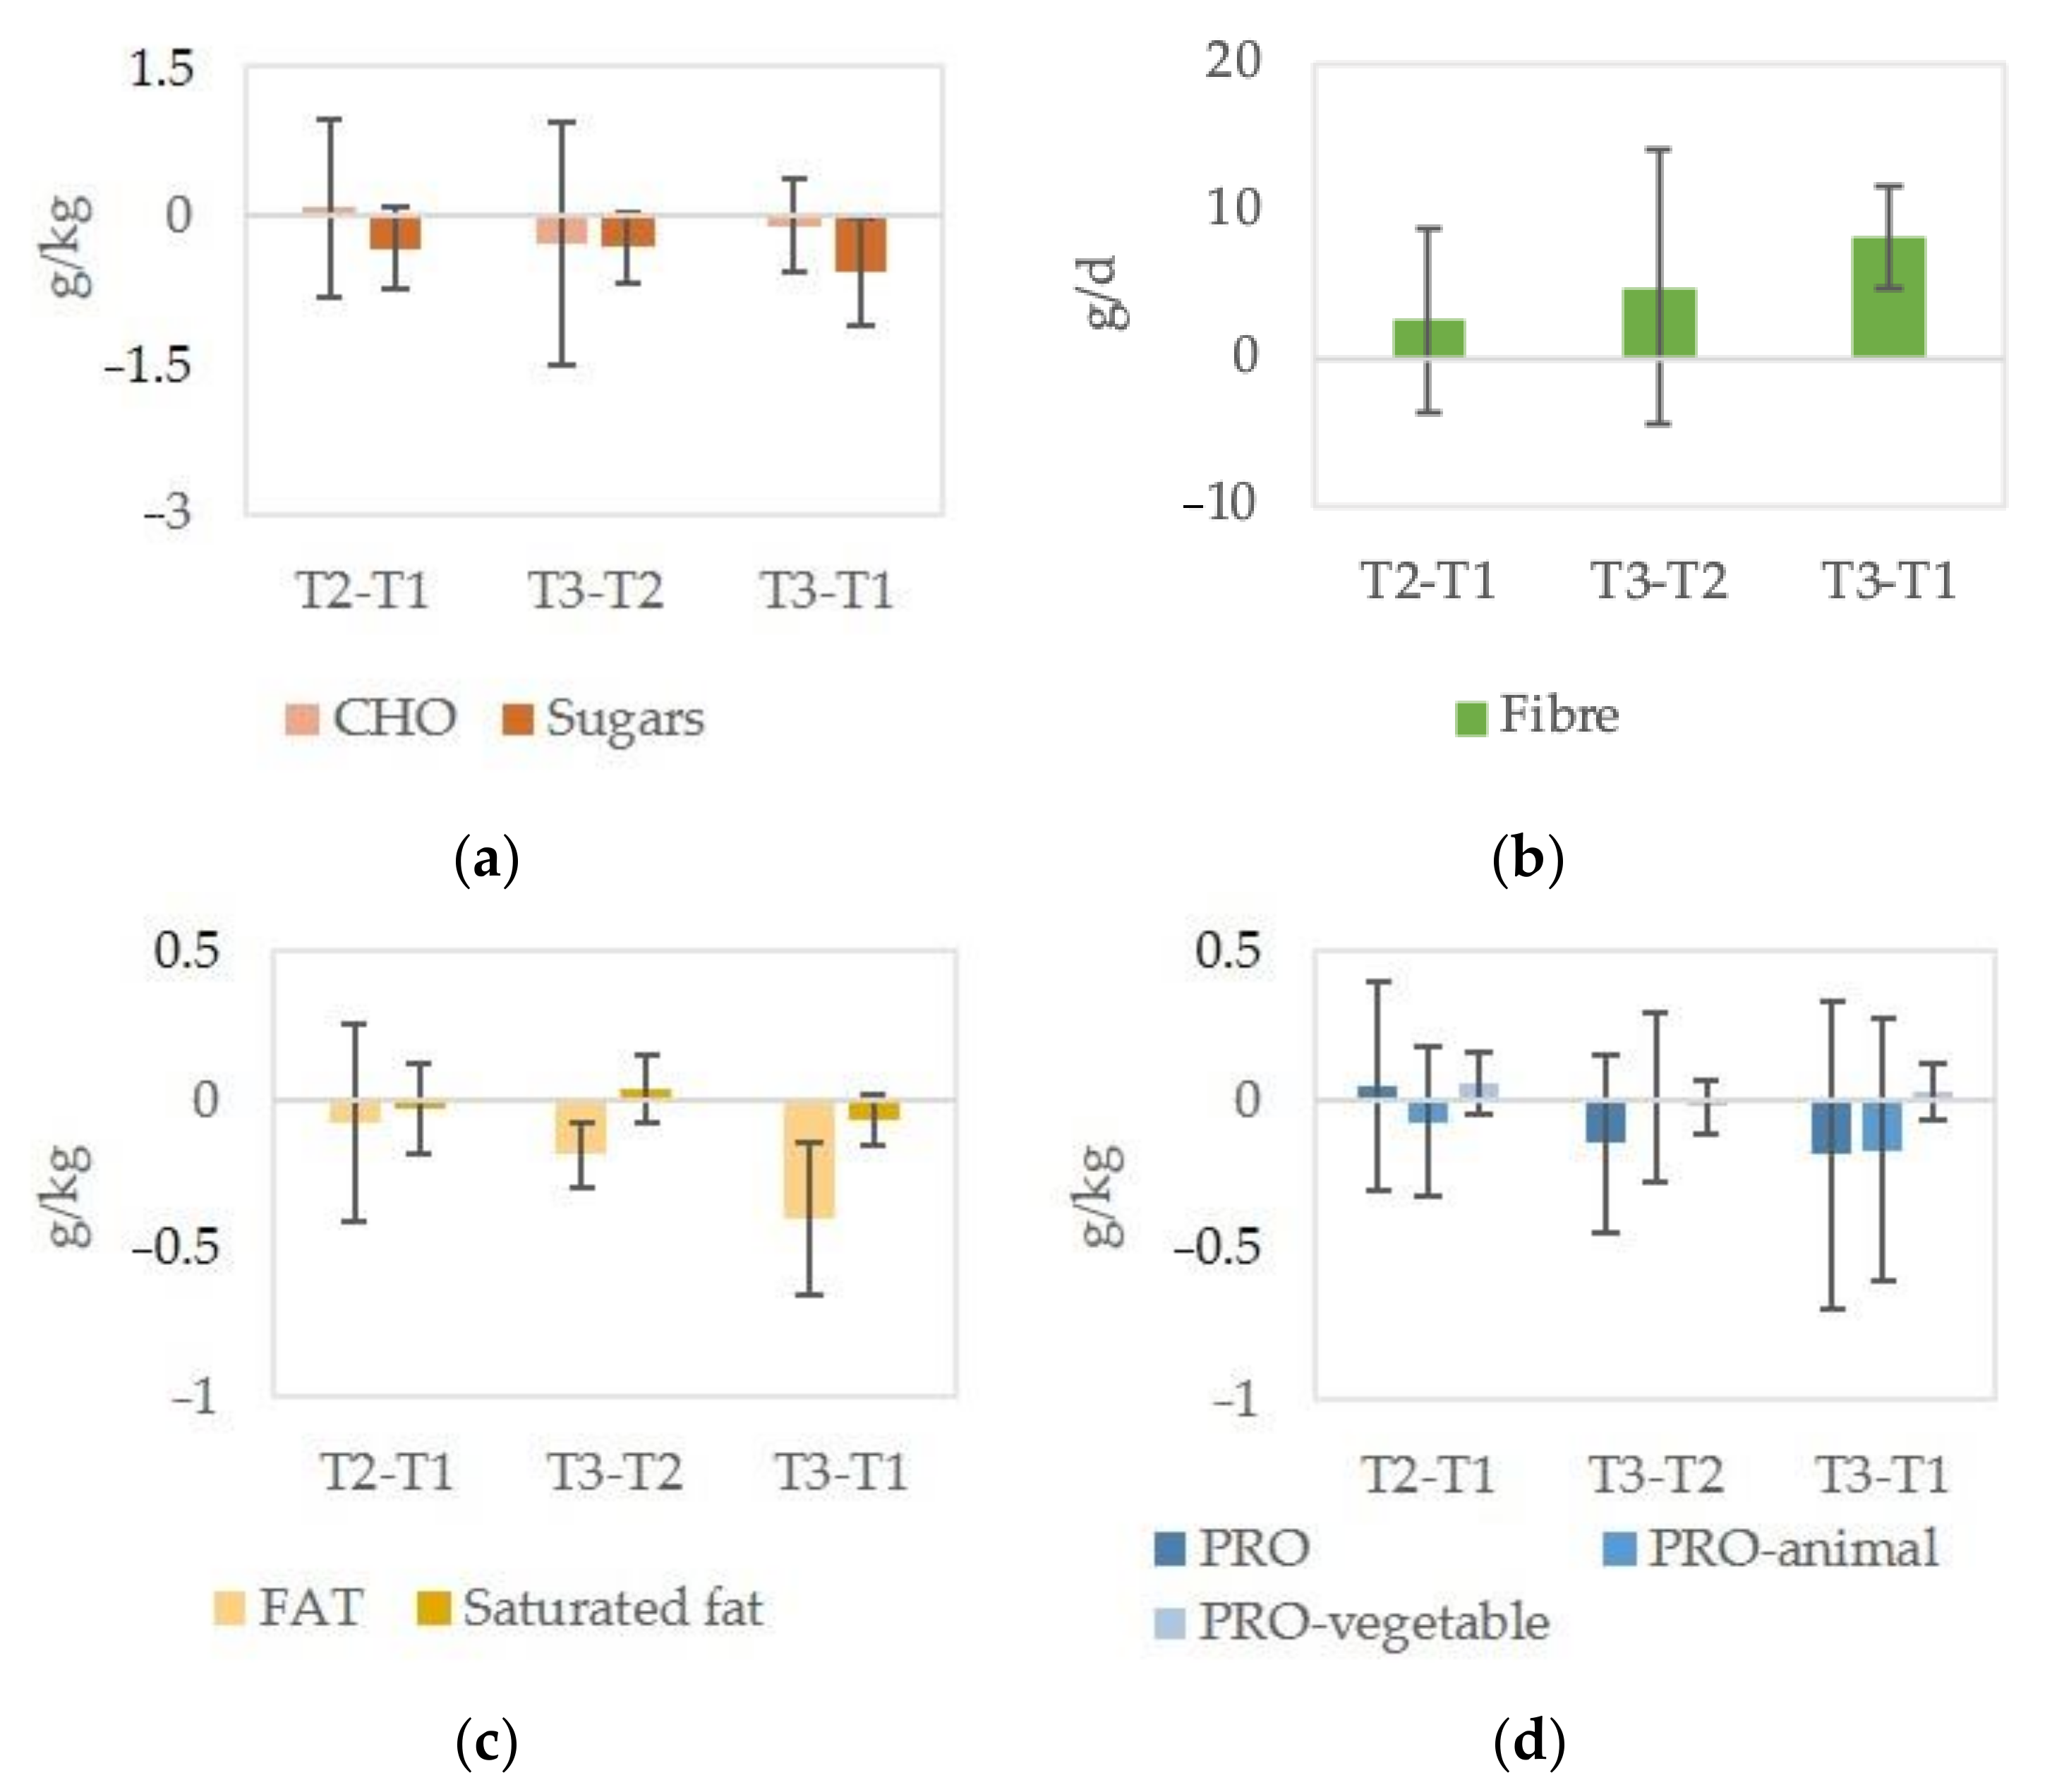
3.2. Dietary Intakes

The contribution to total energy intake for CHO (%En, Figure 1) was higher in the NDAW-T3 and NDAM-T3 groups compared to the DAM group before DA (DAM-T1, p < 0.05). The latter increased CHO %En after LD (T3) compared to the first camp (DAM-T1 versus DAM-T3: p < 0.05).
However, when compared to the recommended level of intake suggested for high-intensity training (>5 g/kg T1 and T2) and for general training (range 3–5 g/kg T3), CHO intake was below the requirement during a training camp for DAM-T1 and DAM-T2 groups, whereas it was above the recommendation in some WBA of the NDAW-T3 and NDAM-T3 groups (Table 3). Moreover, %En from sugars exceeded the recommendations in half of the athletes among the DAM group at T1, but their eating habits met specific targets after receiving DA (T2) (Table 3, Figure 2).
On the other hand, fiber intake increased after DA (Figure 2), and when using different daily intake recommendations for AMP/OHC (LARN of 25 g/d) and SCI/SB (15–30 g/d [31]), the latter adapted their intake to the tolerated level (all < 30 g/d, Table 3).
Fat intake (Figure 1 and Table 3) was lower in all groups post-LD compared to the DAM group at the first camp, before DA. However, both groups who did not receive DA had higher saturated fat intake than the value recommended by LARN (Table 3).
Around half of the women did not reach the LARN for PRO and overall NDAW-T3 had lower intake of PRO derived from animal sources, whereas no differences were found for PRO derived from vegetable sources among groups (Table 3).
Although no differences were found in the mean PRO intake after DA (Table 3), a high inter-subject variability after DA was observed (Figure 2) and more WBA used PRO-supplements at the second camp (DAM-T2) (Table 3).
Among all the WBA groups who took PRO-supplements, no significant differences were found in the dose of PRO (g/d: 26.5 ± 16.8 DAM-T1, 18.2 ± 8.6 DAM-T2, 30.0 ± 0.0 DAM-T3, NDAM-T3 and NDAW-T3).
Athletes who had a PRO intake below that recommended for the general population (0.9 g/kg BM, LARN) increased their intake, and nobody was below the LARN, but many of them were below the recommendation for Paralympic athletes (1.2–1.7 g/kg BM) [31] (Table 3).
On the other hand, four out of five WBA who had intakes above the upper level of 2.0 g/kg BM at T1 reduced their PRO consumption in the range of 1.8–2.0 g/kg BM. Consequently, changes in the percentage of WBA with intake in the range recommended for Paralympic athletes (1.2–1.7 g/kg BM) [31] were not observed (Table 3).
Absolute intakes of micronutrients in terms of amount/day and prevalence of the subjects below the recommendations (LARN) are presented in Table 4. No significant differences were found in the intake of vitamins B1, B2, C, A, beta-carotene, sodium and calcium amongst groups (Table 4). High percentages of WBA had low intake of calcium and no athletes complied with the vitamin D recommendation (Table 4), despite a mean increase of 3.8 µg in the intake one year after DA (p < 0.05). Although vitamin D and calcium were the most critical in all groups, around half of the NDAW-T3 did not cover phosphorus intake (Table 4). Women (NDAW-T3) had a lower intake of vitamin B3 and HEME iron than men, did not cover the recommended intake of vitamin E and had lower intakes of most micronutrients (Table 4).
Among men, WBA of the senior national team had higher intakes of potassium, phosphorus, non-HEME iron, zinc and vitamins B3, B6 and E (Table 4). Folic acid intake was significantly higher in the DAM-T2 group compared to NDAM-T3 (Table 4).
Remarkably, the intake of vitamin B12 improved significantly after DA, with a mean increase of 0.8 µg between the first (DAM-T1) and second (DAM-T2) camp (p < 0.05). Therefore, the percentage of WBA with inadequate intake of vitamin B12 was reduced from 80% at T1 to 0% at T2 and T3.
On the contrary, the increases in vitamin A and C were not significant, but the percentage of WBA who did not comply with the recommendation for vitamin C was higher in NDAM-T3 and NDAW-T3, compared to DAM, after DA (Table 4). Moreover, after DA, the percentage of WBA who did not cover LARN intake for vitamin A was reduced by half (Table 4).
Only a few WBA, among those who did not receive DA, reported using vitamin supplements (vitamin D: NDAM-T3 n = 1, NDAW-T3 n = 1; vitamin B12: NDAW n = 1; vitamins B1, B2, B6 and C: NDAM n = 1) or iron supplements (NDAM-T3 n = 1).

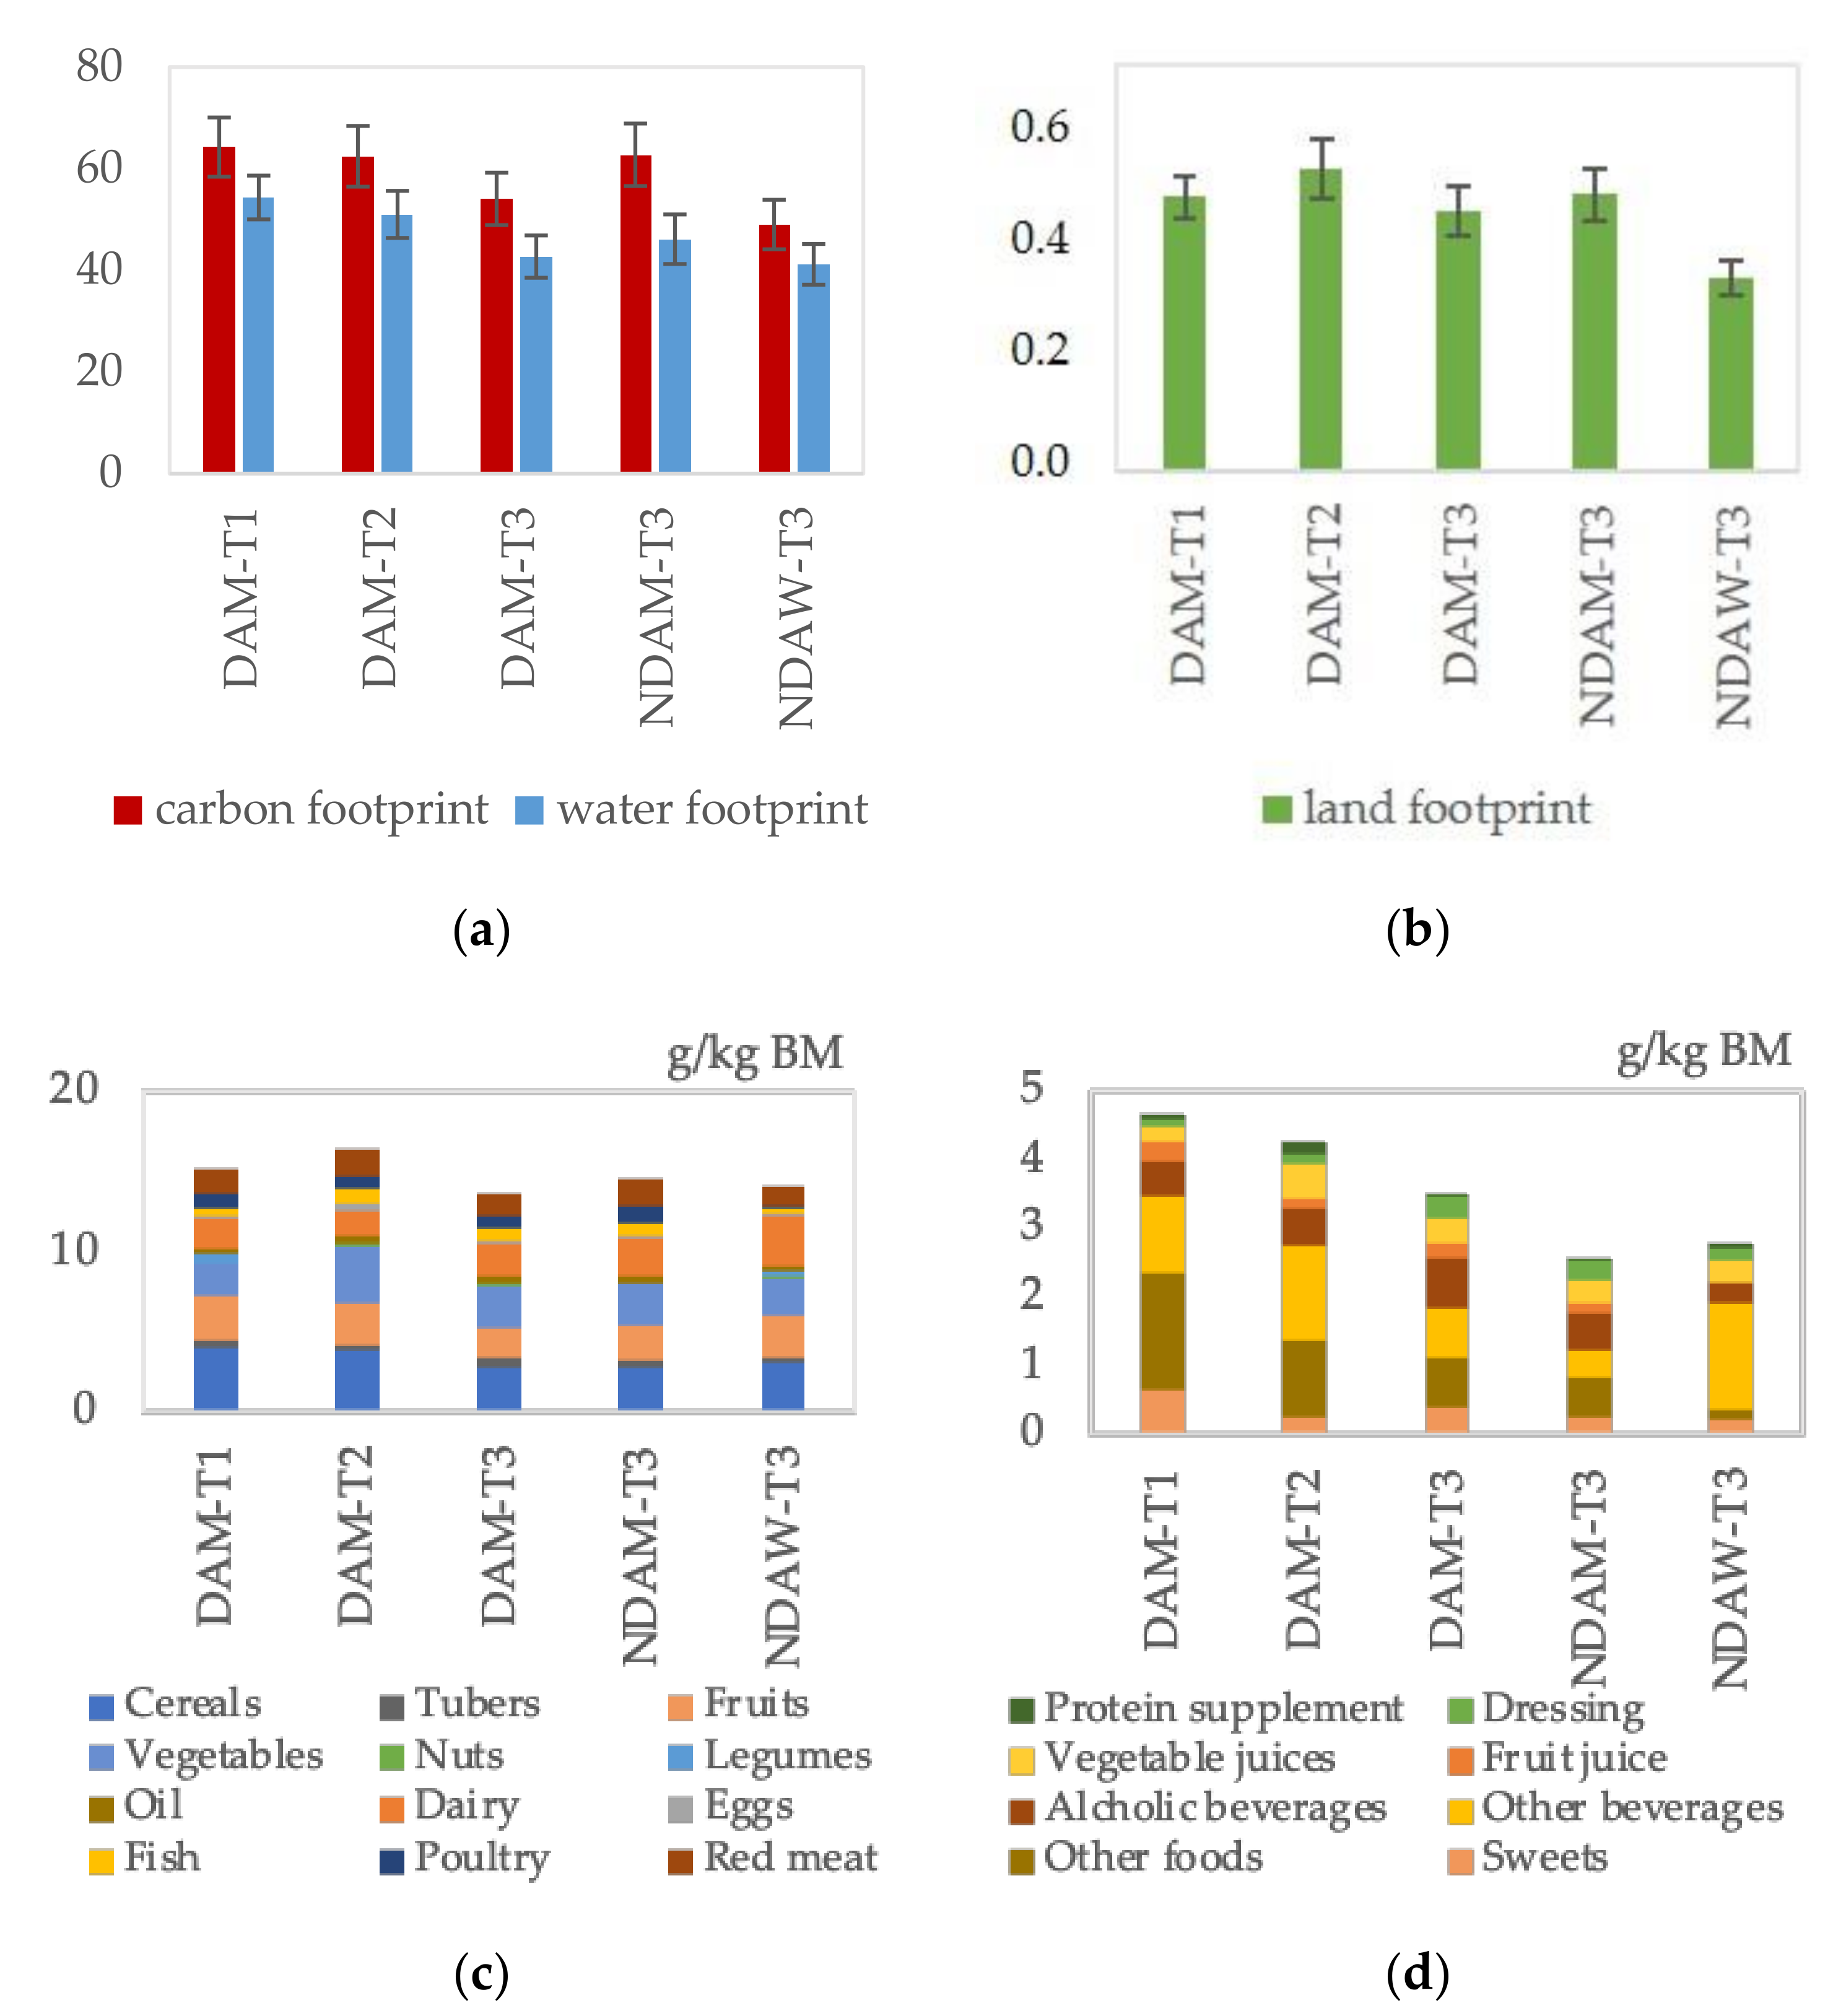
3.3. Diet Sustainability

NDAW-T3 had the lower dietary impact; however, a decreasing trend was observed in WBA of the national team after LD (DAM-T3) compared to before DA (DAM-T1) (Figure 3). Considering the amount of food consumed (expressed as g/kg BM) by EAT-Lancet food group categories, the higher contributors were cereals, fruits and vegetables in each of the WBA groups (Figure 3). However, the mean intakes of vegetables were lower before DA (DAM-T1: 2.1 ± 1.1 g/kg BM) and in WBA who did not receive DA (NDAM-T3: 2.6 ± 1.5; NDAW-T3: 2.3 ± 1.6) than the EAT-Lancet suggested portions for men (70 kg BM: range 2.9–8.6 g/kg BM). The mean intake of vegetables was in the range of the EAT-Lancet recommendation two months after DA (DAM-T2: 3.7 ± 2.3). This could account for the non-significant increase in the land footprint of diet at T2 (Figure 3).
However, red meat had the highest values in terms of CO2 emissions, land use and water consumption (Figure 4) and its consumption was higher than the suggested EAT-Lancet intake (0–0.4 g/kg BM) in all groups (Figure 3).
On the contrary, despite the environmental impact of fish and dairy foods (Figure 4), the mean intakes are within the range of the EAT-Lancet diet (0–1.4 g/kg BM and 0–7.1 g/kg BM, respectively), whereas the consumption of legumes was very low, ranging from zero (DAM-T3 and NDAM-T3) to 0.6 ± 0.9 g/kg BM (DAM-T1).
An increasing trend was observed in the intakes of Mediterranean food dressing (g/kg BM: DAM-T1 0.08 ± 0.10, DAM-T2 0.14 ± 0.19, DAM-T3 0.31 ± 0.39), including onion and garlic. Although the intake of olive oil significantly increased after DA (T2 and T3 versus T1: p < 0.05), it did not reach (g/kg BM: DAM-T1 0.26 ± 0.18, DAM-T2 0.42 ± 0.18, DAM-T3 0.44 ± 0.14) the suggested EAT-Lancet intake (0.6 g/kg BM). However, a non-significant decrease in the impact of total dietary intake of WBA in terms of carbon and water footprints was observed after DA (Figure 3). This result could be due to food categories not included in the EAT-Lancet suggested diet (Figure 3). Among these, other foods group included fast foods (western-style hamburger) and “high-fat” traditional foods (lasagne, meat tortellini and parmigiana di melanzane).
The overall environmental impact of other beverages (including sport drinks and caffeine-containing beverages) did not differ among the groups (Figure 4).
Although women consumed less sweets than WBA of the national team before DA, the difference did not reach statistical significance, whereas significant differences (DAM-T1 versus NDAW-T3: p < 0.05) were observed in the consumption of PRO-supplements and foods not considered in the EAT-Lancet classification (“other foods”, Figure 3 and Figure 4). The former had a low environmental impact, whereas the latter, including traditional foods, were the major contributors of the ecological footprints of the food groups not included in the EAT-Lancet diet (Figure 4). In particular, the “other foods” footprints were significantly lower in NDAW-T3 (carbon footprint g CO2/kg BM: 0.4 ± 1.3, water footprint L/kg BM: 0.4 ± 1.3 and land footprint m2/kg BM: 0) compared to WBA of the national team before DA (carbon footprint g CO2/kg BM: 6.0 ± 7.2, water footprint L/kg BM: 4.8 ± 5.6 and land footprint m2/kg BM: 0.04 ± 0.01) (Figure 4). The latter (DAM-T1) decreased the consumption of these foods after DA (Figure 3) and the carbon (g CO2/kg BM: 4.4 ± 5.9 DAM-T2, 2.6 ± 2.6 DAM-T3) and water (L/kg BM: 3.4 ± 5.9, DAM-T2, 1.8 ± 1.9 DAM-T3) footprints progressively decreased accordingly (Figure 4).

4. Discussion

In this study, for the first time, an integrated evaluation of the nutritional and environmental impact of DA on food intake of WBA was conducted. Athletes of the Italian national team (DAM-T1) received DA and were followed over a year, including two evaluations: at 2 months (DAM-T2) and after COVID-19 LD (DAM-T3). Although the low number of WBA could limit the representativeness of Paralympic athletes, a similar group size of elite WBA was used for the evaluation of the longitudinal effect of DA during a precompetitive period (n = 11) [27] and was demonstrated to be adequately powered to detect statistically significant differences in dietary intakes among male (n = 9) and female (n = 14) WBA [22].
The major limitation of the study is that follow-up included the LD period in Italy. Therefore, in light of the reported impact of LD on the lifestyles and dietary habits of Italians [7,8,12,34,35,36], including a mean self-reported weight gain of approximately 1.5 kg, lower exercise and increased consumption of snacks, unhealthy foods and sweets [19], two groups of WBA who did not receive DA (NDAM-T3 and NDAW-T3) were evaluated at the post-COVID-19 LD survey.
The measured BM variation among the three different time points, in athletes of the DAM group, revealed a mean BM decrease, and those whose BM increased after LD (DAM-T3) ascribed it to the increased training. On the contrary, among WBA who did not receive DA, the LD-induced lifestyle change was indicated as the main cause of weight gain. Women (NDAW-T3) declared a BM higher than the measured one, and higher percentages of WBA who did not reach recommended intakes of PRO and micronutrients were found among NDAW-T3, compared to the other groups. Micronutrient deficiencies have been previously reported in some WBA of the Turkish national wheelchair women’s basketball team [23]. Moreover, among the female wheelchair basketball players in the Japanese national team, those with heavy menstrual flow had lower hemoglobin and iron levels [37]. NDAW-T3 had lower intake of PRO from animal sources, probably accounting for the lower environmental impact of their diet but also their lower intake of HEME iron. Despite this, red meat had the highest values of ecological footprint and its consumption was higher than the suggested EAT-Lancet intake in all groups. In this context, the EAT-Lancet Commission on “Healthy Diets from Sustainable Food Systems” suggests supplementation with iron, multimineral and multivitamin preparation as an alternative to increased consumption of red meat for women at risk of iron deficiency [1], and supplementation has been suggested for WBA with a micronutrient deficiency [26]. Only among athletes who did not receive DA, a few WBA reported use of vitamin or iron supplements. Among men, WBA of the senior national team had higher intakes of potassium, phosphorus, non-HEME iron, zinc and vitamins B3, B6 and E (Table 4). Folic acid intake was significantly higher in the DAM-T2 group compared to NDAM-T3 (Table 4).
In the present study, vitamin B12 intake improved significantly after DA. This result is particularly relevant in individuals with SCI, considering that the deficiency with neurological symptoms can be masked by the pre-existing sensory impairment [38]. Petchkrua et al. [38] reported improvements from cyanocobalamin replacement in some symptoms, including reduced pain. In the post-LD survey, athletes in the DAM-T3 group reported training as the main cause of pain (neck, shoulders, dorsal or lumbar), whereas other WBA declared that the cause of pain was the reduction in physiotherapy practice (NDAM-T3 and NDAW-T3) or the increase in the sedentary lifestyle (NDAM-T3). In this context, the administration of vitamin B complex (B1/B6/B12) reduced neuropathic hyperalgesia and spinal neuron injury following temporary spinal cord ischemia in rats [39] and vitamins C and E reduced oxidative stress in a rat model of neuropathic pain [40]. No NDAW-T3 met the recommended intake of vitamin E and had lower intakes of most micronutrients than men. Although the increase in vitamin C intake did not reach statistical significance, the percentage of WBA who did not comply with LARN in NDAM-T3 and NDAW-T3 was double that of DAM after DA. On the contrary, despite the significant increase in vitamin D intake after DA, the values remained below the recommended one. Although the serum vitamin D level was inversely associated with nonspecific musculoskeletal pain in patients on acute rehabilitation unit admission [41], supplementation in patients with SCI and low serum levels of vitamin D did not improve their “Brief Pain Inventory” score [42]. However, vitamin D was among the commonly consumed supplements by rugby wheelchair athletes [43] and vitamin D deficiency remains an important factor associated with severe COVID-19 and hospital admissions [44]. Despite there being little evidence for the use of vitamin D supplements to prevent or treat COVID-19, the panel of the National Institute for Health and Care Excellence (UK) recently agreed that vitamin D is well established for maintaining bone and muscle health and that supplementation should be considered in the case of deficiency and during the COVID-19 pandemic, when people may have been indoors more than usual and do not produce enough vitamin D from sunlight [45].
The PRO intake is important for muscle health and, after DA, participants who had lower levels than that recommended for the general population (LARN) increased their consumption; on the other hand, those who had intake above 2.0 g/kg BM decreased their consumption, according to the suggestions [31]. Significant differences between DAM-T1 and NDAW-T3 were observed in the use of PRO-supplements, and after DA, more WBA took PRO-supplements. However, low environmental impacts have been reported for PRO from soy [32] and whey [33], whereas the five portions a day of fruits and vegetables recommended for a healthy dietary pattern might provide high ecological expenditure [3]. The Mediterranean diet is known to have a low environmental impact compared to other dietary patterns [46]. In Italy, the perception of behavioral control is among the major factors contributing to vegetable intake [47]. The mean intakes of vegetables were lower before DA (DAM-T1) and in WBA who did not receive DA (NDAM-T3 and NDAW-T3) than the EAT-Lancet suggested portions, but in the range of the EAT-Lancet two months after DA (DAM-T2). On the contrary, the consumption of legumes remained very low after DA, although it has been reported that the COVID-19 pandemic resulted in increased purchasing of pulses partly due to human and environmental health impacts [15]. However, researchers have suggested that some consumers are hesitant to regularly eat pulses, due to abdominal discomfort [15]. Legumes were consumed in minimal amounts also by WBA of the Spanish national team [26]. Similarly, and as previously reported in other studies [22,23], fiber intake was consistently low in both male and female WBA, but increased after DA in WBA with AMP/OHC (at least 25 g/d, LARN), whereas WBA with SCI/SB adapted their intake to the tolerated level in the suggested range for individuals with neurogenic bowel dysfunction (15–30 g/d [31]). A daily CHO intake >5 g/kg for high-intensity training periods (T1 and T2) and in the range of 3-5 g/kg for general training needs during the LD (T3) has been considered to measure CHO compliance and it was not reached by most athletes at T1 and T2, as previously reported in other studies in wheelchair athletes [21,22,26], but they improved the diet composition in terms of the percentage of macronutrients after DA (increase CHO %En and decrease fat %En). In almost all WBA, sugar intake (on a g/kg basis) was outside the global reference diet of the EAT-Lancet Commission (EAT-Lancet) and exceeded the national recommendations in half of the athletes at the first camp (T1), but WBA eating habits met the specific target after they received DA (T2). Significant differences between DAM-T1 and NDAW-T3 were observed in the consumption of foods not considered in the EAT-Lancet classification, particularly fast foods and “high-fat” traditional foods, which were the major contributors to the ecological footprints of this food group. In this context, the consumption of some traditional energy-dense meals was significantly correlated with BMI [48,49] and with endothelial dysfunction in healthy people, in Italy [50]. The consumption of “other foods” (not included in the EAT-Lancet diet) decreased after DA. This result (Figure 3), in association with a non-significant trend of an increase in the consumption of fish and eggs, could account for the increase in vitamin B12 not associated with a parallel increase in animal protein and iron due to the differences in the ratio between vitamin B12/iron and between B12/proteins among different animal foods. On the other hand, an increasing trend was observed in the intakes of Mediterranean food dressing, known to contain bioactive compounds [51], and the intake of olive oil, proposed for its anti-inflammatory activities for both obese and frail individuals [52], significantly increased after DA.

5. Conclusions

Overall, WBA of the Italian national team improved their dietary habits after DA but did not comply with the EAT-Lancet suggested portion sizes for some PRO-sources (high red meat, low legumes). Although the dietary impact of some food consumed (normalized for BM) was lower for women who did not receive DA, they presented more nutritional deficiency than men, regardless of DA (all DAM groups and NDAM-T3). In particular, NDAW-T3 had a lower intake of vitamin B3 and HEME iron than men and the percentages of women who had inadequate intake of vitamin B6 (67%), vitamin B12 (100%), vitamin C (89%), vitamin A (67%), vitamin E (100%), folic acid (100%), phosphorus (44%), iron (100%) and zinc (67%) were higher than those of men after DA (DAM-T2, vitamins: vitamin B6 (0%), vitamin B12 (0%), vitamin C (50%), vitamin A (25%), vitamin E (17%), folic acid (75%), minerals: phosphorus (0%), iron (33%) and zinc (25%). In this context, the EAT-Lancet Commission stated that “multivitamin or multimineral preparation provide an alternative that is less expensive and without adverse consequences of high red meat intake” [1]. As a result, the nutritional evaluation of food consumption should always be included in studies aiming to evaluate the environmental impact of diet.

Author Contributions

Conceptualization, I.P.; methodology, E.T.; formal analysis, E.T., A.R. and A.L.F.; investigation, E.T., A.R., V.C., C.M., M.B., B.M.M., L.M., F.M. and I.P.; data curation, E.T., A.R., A.L.F. and L.M.; writing—original draft preparation, E.T., A.R., A.L.F. and I.P.; writing—review and editing, V.C., C.M., M.B. and T.S.; supervision, I.P. All authors have read and agreed to the published version of the manuscript.

Funding

This research was funded by Federazione Italiana Pallacanestro in Carrozzina (FIPIC, Rome, Italy), grant number: 0021900 (CREA Registro Ufficiale), and by Ministero della Difesa (project AMAMP, CREA-AN subcontractor Department of Physiology and Pharmacology “V. Erspamer”, Sapienza University of Rome).

Institutional Review Board Statement

The study was conducted according to the guidelines of the Declaration of Helsinki and approved (2019) by the Ethics Committee of the Department of Physiology and Pharmacology “V. Erspamer”, Sapienza University of Rome.

Informed Consent Statement

Informed consent was obtained from all subjects involved in the study.

Data Availability Statement

Individuals’ data availability is restricted by the Ethics Committee to protect privacy.

Acknowledgments

The authors would like to thank the athletes who willingly participated in this study and Fernando Zappile, President of the FIPIC, Rome. The authors acknowledge Claudio Andrew Gobbi for the English revision of the manuscript.

Conflicts of Interest

M.B. and B.M.M. were collaborators of FIPIC. M.B. is the Federal Doctor. B.M.M. collaborated in the data collection by questionnaires. The funders had no role in the design of the study; in the analyses, or interpretation of data; in the writing of the manuscript, or in the decision to publish the results. The other authors declare no conflict of interest.

References

  1. Willett, W.J.; Rockstrom, B.; Loken, M.; Springmann, T.; Lang, S.; Vermeulen, T.; Garnett, D.; Tilman, F.; DeClerck, A.; Wood, M.; et al. Food in the Anthropocene: The EAT-Lancet Commission on healthy diets from sustainable food systems. Lancet 2019, 393, 447–492. [Google Scholar] [CrossRef]
  2. Grosso, G.A.; Mateo, N.; Rangelov, T.; Buzeti, T.; Birt, C. Nutrition in the context of the Sustainable Development Goals. Eur. J. Public Health 2020, 30 (Suppl. S1), i19–i23. [Google Scholar] [CrossRef]
  3. Serafini, M.; Toti, E. Unsustainability of Obesity: Metabolic Food Waste. Front. Nutr. 2016, 3, 40. [Google Scholar] [CrossRef] [PubMed] [Green Version]
  4. Rolland, B.; Haesebaert, F.; Zante, E.; Benyamina, A.; Haesebaert, J.; Franck, N. Global Changes and Factors of Increase in Caloric/Salty Food Intake, Screen Use, and Substance Use During the Early COVID-19 Containment Phase in the General Population in France: Survey Study. JMIR Public Health Surveill 2020, 6, e19630. [Google Scholar] [CrossRef] [PubMed]
  5. Buckland, N.J.; Swinnerton, L.F.; Ng, K.; Price, M.; Wilkinson, L.L.; Myers, A.; Dalton, M. Susceptibility to increased high energy dense sweet and savoury food intake in response to the COVID-19 lockdown: The role of craving control and acceptance coping strategies. Appetite 2021, 158, 105017. [Google Scholar] [CrossRef]
  6. Robinson, E.; Boyland, E.; Chisholm, A.; Harrold, J.; Maloney, N.G.; Marty, L.; Hardman, C.A. Obesity, eating behavior and physical activity during COVID-19 lockdown: A study of UK adults. Appetite 2021, 156, 104853. [Google Scholar] [CrossRef]
  7. Pietrobelli, A.; Pecoraro, L.; Ferruzzi, A.; Heo, M.; Faith, M.; Zoller, T.; Antoniazzi, F.; Piacentini, G.; Fearnbach, S.N.; Heymsfield, S.B. Effects of COVID-19 Lockdown on Lifestyle Behaviors in Children with Obesity Living in Verona, Italy: A Longitudinal Study. Obesity 2020, 28, 1382–1385. [Google Scholar] [CrossRef]
  8. Franco, I.; Bianco, A.; Bonfiglio, C.; Sorino, P.; Mirizzi, A.; Campanella, A.; Buongiorno, C.; Liuzzi, R.; Osella, A.R. Decreased levels of physical activity: Results from a cross-sectional study in southern Italy during the COVID-19 lockdown. J. Sports Med. Phys. Fit. 2021, 61, 294–300. [Google Scholar] [CrossRef]
  9. Huber, B.C.; Steffen, J.; Schlichtiger, J.; Brunner, S. Altered nutrition behavior during COVID-19 pandemic lockdown in young adults. Eur. J. Nutr. 2020, 1–10. [Google Scholar] [CrossRef]
  10. Ruiz-Roso, M.B.; de Carvalho Padilha, P.; Matilla-Escalante, D.C.; Brun, P.; Ulloa, N.; Acevedo-Correa, D.; Arantes Ferreira Peres, W.; Martorell, M.; Rangel Bousquet Carrilho, T.; de Oliveira Cardoso, L.; et al. Changes of Physical Activity and Ultra-Processed Food Consumption in Adolescents from Different Countries during Covid-19 Pandemic: An Observational Study. Nutrients 2020, 12, 2289. [Google Scholar] [CrossRef]
  11. Batlle-Bayer, L.; Aldaco, R.; Bala, A.; Puig, R.; Laso, J.; Margallo, M.; Vázquez-Rowe, I.; Antó, J.M.; Fullana-I-Palmer, P. Environmental and nutritional impacts of dietary changes in Spain during the COVID-19 lockdown. Sci. Total Environ. 2020, 748, 141410. [Google Scholar] [CrossRef] [PubMed]
  12. Scarmozzino, F.; Visioli, F. Covid-19 and the Subsequent Lockdown Modified Dietary Habits of Almost Half the Population in an Italian Sample. Foods 2020, 9, 675. [Google Scholar] [CrossRef]
  13. Scacchi, A.; Catozzi, D.; Boietti, E.; Bert, F.; Siliquini, R. COVID-19 Lockdown and Self-Perceived Changes of Food Choice, Waste, Impulse Buying and Their Determinants in Italy: QuarantEat, a Cross-Sectional Study. Foods 2021, 10, 306. [Google Scholar] [CrossRef] [PubMed]
  14. Attwood, S.; Hajat, C. How will the COVID-19 pandemic shape the future of meat consumption? Public Health Nutr. 2020, 23, 3116–3120. [Google Scholar] [CrossRef] [PubMed]
  15. Didinger, C.; Thompson, H. Motivating Pulse-Centric Eating Patterns to Benefit Human and Environmental Well-Being. Nutrients 2020, 12, 3500. [Google Scholar] [CrossRef] [PubMed]
  16. Marty, L.; de Lauzon-Guillain, B.; Labesse, M.; Nicklaus, S. Food choice motives and the nutritional quality of diet during the COVID-19 lockdown in France. Appetite 2021, 157, 105005. [Google Scholar] [CrossRef]
  17. Pérez-Rodrigo, C.; Citores, M.G.; Bárbara, G.H.; Ruiz-Litago, F.; Sáenz, L.C.; Arija, V.; López-Sobaler, A.; de Victoria, E.M.; Ortega, R.; Partearroyo, T.; et al. Patterns of Change in Dietary Habits and Physical Activity during Lockdown in Spain due to the COVID-19 Pandemic. Nutrients 2021, 13, 300. [Google Scholar] [CrossRef] [PubMed]
  18. Barrea, L.; Pugliese, G.; Framondi, L.; Di Matteo, R.; Laudisio, D.; Savastano, S.; Colao, A.; Muscogiuri, G. Does Sars-Cov-2 threaten our dreams? Effect of quarantine on sleep quality and body mass index. J. Transl. Med. 2020, 18, 1–11. [Google Scholar] [CrossRef]
  19. Pellegrini, M.; Ponzo, V.; Rosato, R.; Scumaci, E.; Goitre, I.; Benso, A.; Belcastro, S.; Crespi, C.; De Michieli, F.; Ghigo, E.; et al. Changes in Weight and Nutritional Habits in Adults with Obesity during the “Lockdown” Period Caused by the COVID-19 Virus Emergency. Nutrients 2020, 12, 2016. [Google Scholar] [CrossRef]
  20. Clemente-Suárez, V.J.; Fuentes-García, J.P.; Marcos, R.D.L.V.; Patiño, M.J.M. Modulators of the Personal and Professional Threat Perception of Olympic Athletes in the Actual COVID-19 Crisis. Front. Psychol. 2020, 11, 1985. [Google Scholar] [CrossRef]
  21. Figel, K.; Pritchett, K.; Pritchett, R.; Broad, E. Energy and Nutrient Issues in Athletes with Spinal Cord Injury: Are They at Risk for Low Energy Availability? Nutrients 2018, 10, 1078. [Google Scholar] [CrossRef] [Green Version]
  22. Goosey-Tolfrey, V.L.; Crosland, J. Nutritional Practices of Competitive British Wheelchair Games Players. Adapt. Phys. Act. Q. 2010, 27, 47–59. [Google Scholar] [CrossRef]
  23. Eskici, G.; Ersoy, G. An evaluation of wheelchair basketball players’ nutritional status and nutritional knowledge levels. J. Sports Med. Phys. Fit. 2014, 56, 259–268. [Google Scholar]
  24. Raguzzini, A.; Toti, E.; Bernardi, M.; Castellucci, F.; Cavedon, V.; Fedullo, A.L.; Milanese, C.; Sciarra, T.; Peluso, I. Post-Exercise Ketosis, Salivary Uric Acid and Interleukin-6 after a Simulated Wheelchair Basketball Match. Endocr. Metab. Immune Disord. Drug Targets 2021, 21, 1–11. [Google Scholar] [CrossRef] [PubMed]
  25. Toti, E.; Cavedon, V.; Raguzzini, A.; Fedullo, A.L.; Milanese, C.; Bernardi, E.; Bellito, S.; Bernardi, M.; Sciarra, T.; Peluso, I. Dietary Intakes and Food Habits of Wheelchair Basketball Athletes compared to Gym Attendees and Individuals who do not Practice Sport Activity. Endocr. Metab. Immune Disord. Drug Targets 2021, 21, 1. [Google Scholar] [CrossRef] [PubMed]
  26. Grams, L.; Garrido, G.; Villacieros, J.; Ferro, A. Marginal Micronutrient Intake in High-Performance Male Wheelchair Basketball Players: A Dietary Evaluation and the Effects of Nutritional Advice. PLoS ONE 2016, 11, e0157931. [Google Scholar] [CrossRef] [Green Version]
  27. Ferro, A.; Garrido, G.; Villacieros, J.; Pérez, J.; Grams, L. Nutritional Habits and Performance in Male Elite Wheelchair Basketball Players During a Precompetitive Period. Adapt. Phys. Act. Q. 2017, 34, 295–310. [Google Scholar] [CrossRef] [PubMed]
  28. Moreira-Silva, I.; Azevedo, J.; Rodrigues, S.; Seixas, A.; Jorge, M. Predicting musculoskeletal symptoms in workers of a manufacturing company. Int. J. Occup. Saf. Ergon. 2020, 1–9. [Google Scholar] [CrossRef]
  29. Gobba, F.; Gherisi, R.; Martinelli, S.; Richeldi, A.; Clerici, P.; Grazioli, P. Traduzione in lingua italiana e validazione del questionario standardizzato Nordic IRSST per la rilevazione di disturbi muscoloscheletrici. Med. Lav. 2008, 99, 424–443. [Google Scholar] [PubMed]
  30. Willett, W. Nutritional Epidemiology; Oxford University Press: New York, NY, USA, 2013. [Google Scholar]
  31. Bernardi, M.; Fedullo, A.L.; Bernardi, E.; Munzi, D.; Peluso, I.; Myers, J.; Lista, F.R.; Sciarra, T. Diet in neurogenic bowel management: A viewpoint on spinal cord injury. World J. Gastroenterol. 2020, 26, 2479–2497. [Google Scholar] [CrossRef]
  32. Berardy, A.; Costello, C.; Seager, T. Life Cycle Assessment of Soy Protein Isolate. In Proceedings of the International Symposium on Sustainable Systems and Technologies, Dearborn, MI, USA, 18–20 May 2015. [Google Scholar] [CrossRef]
  33. Bacenetti, J.; Bava, L.; Schievano, A.; Zucali, M. Whey protein concentrate (WPC) production: Environmental impact assessment. J. Food Eng. 2018, 224, 139–147. [Google Scholar] [CrossRef]
  34. Cancello, R.; Soranna, D.; Zambra, G.; Zambon, A.; Invitti, C. Determinants of the Lifestyle Changes during COVID-19 Pandemic in the Residents of Northern Italy. Int. J. Environ. Res. Public Health 2020, 17, 6287. [Google Scholar] [CrossRef] [PubMed]
  35. Tornaghi, M.; Lovecchio, N.; Vandoni, M.; Chirico, A.; Codella, R. Physical activity levels across COVID-19 outbreak in youngsters of Northwestern Lombardy. J. Sports Med. Phys. Fit. 2020. [Google Scholar] [CrossRef]
  36. Di Renzo, L.; Gualtieri, P.; Pivari, F.; Soldati, L.; Attinà, A.; Cinelli, G.; Leggeri, C.; Caparello, G.; Barrea, L.; Scerbo, F.; et al. Eating habits and lifestyle changes during COVID-19 lockdown: An Italian survey. J. Transl. Med. 2020, 18, 229. [Google Scholar] [CrossRef]
  37. Shimizu, Y.; Mutsuzaki, H.; Tachibana, K.; Hotta, K.; Wadano, Y. Investigation of the Female Athlete Triad in Japanese Elite Wheelchair Basketball Players. Medicina 2019, 56, 10. [Google Scholar] [CrossRef] [Green Version]
  38. Petchkrua, W.; Little, J.W.; Burns, S.P.; Stiens, S.A.; James, J.J. Vitamin B12 deficiency in spinal cord injury: A retrospective study. J. Spinal Cord Med. 2003, 26, 116–121. [Google Scholar] [CrossRef] [PubMed]
  39. Yu, C.Z.; Liu, Y.P.; Liu, S.; Yan, M.; Hu, S.J.; Song, X.J. Systematic administration of B vitamins attenuates neuropathic hyperalgesia and reduces spinal neuron injury following temporary spinal cord ischaemia in rats. Eur. J. Pain 2014, 18, 76–85. [Google Scholar] [CrossRef]
  40. Riffel, A.; Santos, M.; De Souza, J.; Scheid, T.; Horst, A.; Kolberg, C.; Bello-Klein, A.; Partata, W. Treatment with ascorbic acid and α-tocopherol modulates oxidative-stress markers in the spinal cord of rats with neuropathic pain. Braz. J. Med. Biol. Res. 2018, 51, 7097. [Google Scholar] [CrossRef] [Green Version]
  41. Matossian-Motley, D.L.; Drake, D.A.; Samimi, J.S.; Camargo, C.A., Jr.; Quraishi, S.A. Association Between Serum 25(OH)D Level and Nonspecific Musculoskeletal Pain in Acute Rehabilitation Unit Patients. JPEN J. Parenter. Enteral. Nutr. 2016, 40, 367–373. [Google Scholar] [CrossRef] [Green Version]
  42. Williams, T.G.; Ehsanian, R.; Shem, K.L.; Wright, J.; Isaac, L.; Crew, J. The Effect of Vitamin D Supplementation on Pain, Mood, Depression, and Strength in Patients with Spinal Cord Injury. PM&R 2016, 8, S153. [Google Scholar] [CrossRef]
  43. Madden, R.F.; Shearer, J.; Legg, D.; Parnell, J.A. Evaluation of Dietary Supplement Use in Wheelchair Rugby Athletes. Nutrients 2018, 10, 1958. [Google Scholar] [CrossRef] [PubMed] [Green Version]
  44. Chaabouni, M.; Feki, W.; Chaabouni, K.; Kammoun, S. Vitamin D supplementation to prevent COVID-19 in patients with COPD: A research perspective. Adv. Respir. Med. 2020, 88, 364–365. [Google Scholar] [CrossRef]
  45. COVID-19 Rapid Guideline: Vitamin D. London, 2020. Available online: http://www.ncbi.nlm.nih.gov/pubmed/33378143 (accessed on 14 February 2021).
  46. Grosso, G.; Fresán, U.; Bes-Rastrollo, M.; Marventano, S.; Galvano, F. Environmental Impact of Dietary Choices: Role of the Mediterranean and Other Dietary Patterns in an Italian Cohort. Int. J. Environ. Res. Public Health 2020, 17, 1468. [Google Scholar] [CrossRef] [Green Version]
  47. Menozzi, D.; Sogari, G.; Mora, C. Explaining Vegetable Consumption among Young Adults: An Application of the Theory of Planned Behaviour. Nutrients 2015, 7, 7633–7650. [Google Scholar] [CrossRef] [PubMed] [Green Version]
  48. Buscemi, S.; Mattina, A.; Rosafio, G.; Massenti, F.M.; Galvano, F.; Grosso, G.; Amodio, E.; Barile, A.M.; Maniaci, V.; Bonura, A.; et al. Habitual street food intake and subclinical carotid atherosclerosis. Eat. Weight Disord. Stud. Anorex. Bulim. Obes. 2014, 19, 363–370. [Google Scholar] [CrossRef] [PubMed]
  49. Buscemi, S.; Barile, A.; Maniaci, V.; Batsis, J.A.; Mattina, A.; Verga, S. Characterization of street food consumption in palermo: Possible effects on health. Nutr. J. 2011, 10, 119. [Google Scholar] [CrossRef] [PubMed] [Green Version]
  50. Buscemi, S.; Maniaci, V.; Barile, A.M.; Rosafio, G.; Mattina, A.; Canino, B.; Verga, S.; Rini, G.B. Endothelial function and other biomarkers of cardiovascular risk in frequent consumers of street food. Clin. Nutr. 2012, 31, 934–939. [Google Scholar] [CrossRef]
  51. Fedullo, A.L.; Ciccotti, M.; Giannotta, P.; Alviti, F.; Bernardi, M.; Raguzzini, A.; Toti, E.; Sciarra, T.; Peluso, I. Hormetic Effects of Bioactive Compounds from Foods, Beverages, and Food Dressing: The Potential Role in Spinal Cord Injury. Oxidative Med. Cell. Longev. 2021, 2021, 6615752. [Google Scholar] [CrossRef]
  52. Polito, A.; Peluso, I. Effects of Olive Oil on TNF-α and IL-6 in Humans: Implication in Obesity and Frailty. Endocr. Metab. Immune Disord. Drug Targets 2017, 18, 63–74. [Google Scholar] [CrossRef]
Figure 1. Macronutrient and alcohol intake as percentages of total energy intake. (a) CHO: carbohydrates; suggested intakes for basket players from the FMSI: Federazione Medico Sportiva Italiana; (b) DAM: men who received dietary advice (DA) at T1: first camp, before DA (n = 16); (c) DAM: men who received DA at T2: second camp, 2 months after DA (n = 12); (d) DAM: men who received DA at T3: post-COVID-19 lockdown (LD) follow-up (n = 12); (e) NDAM: men who did not receive DA at T3 (n = 12); (f) NDAW: women who did not receive DA at T3 (n = 9).
Sustainability 13 05244 g001
Figure 2. Variation in macronutrient and fiber intakes of athletes after dietary advice. (a) CHO: carbohydrates; (b) Fiber; (c) Fat; (d) PRO: proteins. T1: first camp, before dietary advice (DAMT1); T2: second camp, 2 months after DA (DAMT2); T3: post-COVID-19 lockdown (LD) follow-up (DAMT3). Data are expressed as mean and standard deviation.
Sustainability 13 05244 g002
Figure 3. Ecological footprints and food groups intake. (a) DAM: men who received dietary advice (DA) at T1: first camp, before DA; at T2: second camp, 2 months after DA and at T3: post-COVID-19 lockdown follow-up; NDAM: men who did not receive DA at T3; NDAW: women who did not receive DA at T3. Carbon footprint (kg CO2/kg body mass BM) and water footprint as L/kg BM; (b) Land footprint (m2/kg BM). (c) Daily intake of EAT-Lancet food groups (d) Daily intake of food groups not included in the EAT-Lancet diet.
Sustainability 13 05244 g003
Figure 4. Ecological footprints of food groups. (a) Carbon (kg CO2/kg body mass BM) footprint of EAT-Lancet food groups. DAM: men who received dietary advice (DA) at T1: first camp, before DA; at T2: second camp, 2 months after DA and at T3: post-COVID-19 lockdown follow-up; NDAM: men who did not receive DA at T3; NDAW: women who did not receive DA at T3. (b) Carbon footprint of food groups not included in the EAT-Lancet diet. (c) Water (L/kg BM) footprint of EAT-Lancet food groups. (d) Water footprint of food groups not included in the EAT-Lancet diet. (e) Land footprint (m2/kg BM) of EAT-Lancet food groups. (f) Land footprint of food groups not included in the EAT-Lancet diet.
Sustainability 13 05244 g004
Table 1. Characteristics of WBA.
Characteristics DAM-T1 (n = 16)DAM-T2 (n = 12)DAM-T3 (n = 12)NDAM-T3 (n = 12)NDAW-T3 (n = 9)
Age (year)27 (24–31) a27 (25–31) a28 (25–30) a19 (18–21) b26 (19–30) a,b
National Team100% Senior100% Senior100% Senior47% Senior100% Women
IWBF class2.5 (1.5–4.0)3.0 (1.6–4.0)4.0 (2.5–4.2)2.5 (1.7–3.2)2.5 (1.2–3.2)
Health condition8 SCI/SB, 5 AMP,
3 OHC
5 SCI/SB, 4 AMP,
3 OHC
3 SCI/SB, 4 AMP,
5 OHC
6 SCI/SB, 2 AMP,
4 OHC
4 SCI/SB, 1 AMP,
4 OHC
BM (kg)74.2 ± 12.3 a76.4 ± 11.7 a72.8 ± 9.8 a57.2 ± 11.7 b61.0 ± 10.6 b
BM variation measured difference (kg)
T2–T1: −1.4 ± 2.5
measured difference (kg)
T3–T2: −1.3 ± 4.8
T3–T1: −2.2 ± 3.8
reported variation during LD
55% ↔
9% ↓ (diet)
18% ↑ (training)
18% other/missing
reported variation during LD
50% ↔
25% ↓ (diet)
25% ↑ (LD)
reported variation during LD
45% ↔
22% ↓ (diet)
22% ↑ (LD)
11% missing
BM difference
between
measured and
reported
0.1 (0.0–4.7)0.0 (−0.5–0.3)−0.8 (−2.5–0.8)−0.2 (−5.1–0.9)1.2 (−0.3–4.1)
AMP: amputation; BM: body mass; DA: dietary advice; DAM: men who received DA; IWBF: International Wheelchair Basketball Federation classification; LD: lockdown; NDAM: men who did not receive DA; NDAW: women who did not receive DA; OHC: other health conditions; SB: spina bifida; SCI: spinal cord injury; T1: first camp, before DA; T2: second training camp, 2 months after DA; T3: post-COVID-19 LD follow-up; WBA: wheelchair basketball athletes; ↑: increase; ↓: decrease. Continuous variables are expressed as mean and standard deviation, when normality (Shapiro–Wilk) test passed (ANOVA applied, followed by Student–Newman–Keuls) or as median (25%–95%), when normality test (Shapiro–Wilk) failed (Kruskal–Wallis ANOVA on ranks, followed by Dunn’s method). a,b: different letter p < 0.05. Categorical variables are expressed as percentages.
Table 2. Post-LD web-based survey.
Self-Reported DataDAM-T3 (n = 12)NDAM-T3 (n = 12)NDAW-T3 (n = 9)
Test-COVID LD18% negativenot testednot tested
Fever LD18%8%11%
Cough LD9%17%22%
Fatigue LD9%0%22%
Reported pain:
neck
shoulders
dorsal
lumbar
LD–no before LD
27–0%
45–0%
18–0%
36–0%
LD–no before LD
25–0%
33–17%
33–8%
17–8%
LD–no before LD
44–0%
33–0%
11–0%
22–0%
Reported cause of pain training 80%
↓ physiotherapy 20%
training 44%
↑ sedentary 22%
training 17%
↓ physiotherapy 17%
Exercise LD↓ 73%–↑ 18%↓ 92%–↑ 8%↓ 44%–↑ 22%
Sedentary LD↑ 73%↑ 83%↑ 33%
Eating LD↓ 36%–↑ 9%↓ 42%–↑ 25%↓ 11%–↑ 11%
DA: dietary advice; DAM: men who received DA; LD: lockdown; NDAM: men who did not receive DA; NDAW: women who did not receive DA; T3: post-COVID-19 LD follow-up; ↑: increase; ↓: decrease. Categorical variables are expressed as percentages.
Table 3. Macronutrient intake.
Energy and MacronutrientsDAM-T1 (n = 16)DAM-T2 (n = 12)DAM-T3 (n = 12)NDAM-T3 (n = 12)NDAW-T3 (n = 9)
En (kcal/kg BM)32.9 ± 10.430.1 ± 6.129.4 ± 4.832.4 ± 8.8 26.8 ± 5.1
CHO (g/kg)
T1/T2: >5 g/kg
T3: 3–5g/kg [31]
Sugars (%En)
15 %En (LARN)
Fiber (g/d)
25 g/d (LARN) for AMP/OHC and
15–30 g/d for SCI/SB [31]
3.6 ± 1.23.4 ± 0.93.6 ± 0.74.5 ± 1.53.7 ± 0.9
<87%<92%0% *>15%>11%
15.2 ± 4.6 a10.2 ± 2.6 b10.5 ± 4.3 b8.6 ± 3.2 b10.4 ± 4.2 b
>50%0% *>11%0%>22%
17 (14–22) a18 (14–24) a,b23 (21–25) b19 (16–21) a,b18 (13–20) a
<69%
(>12% SCI/SB)
<67%<44%<61%<78%
FAT (g/kg)
Saturated fat (%En)
10 %En (LARN)
1.3 ± 0.4 a1.1 ± 0.2 a,b1.0 ± 0.2 b1.0 ± 0.3 b0.9 ± 0.2 b
11 (9–12) a10 (8–11) a12 (10–13) a,b13 (12–14) b14 (12–16) b
>56%>58%>67%>100% *>100% *
PRO-animal (g/kg)
PRO-vegetable (g/kg)
PRO-supplement use
PRO (g/kg)
range 1.2–1.7 g/kg BM [31]
0.9 g/kg BM (LARN)
0.9 (0.7–1.1) a0.9 (0.9–1.0) a0.8 (0.7–0.9) a0.9 (0.7–1.1) a0.5 (0.4–0.6) b
0.5 ± 0.20.5 ± 0.10.5 ± 0.10.4 ± 0.20.4 ± 0.2
37%67% *11%8%11%
1.5 (1.1–2.0) a1.5 (1.2_1.8) (a)1.3 (1.2_1.4) (a,b)1.3 (1.1_1.4) (a,b)1.0 (0.8_1.0) (b)
<37%–>37%
<12%
<33% _ > 42 %
0%
< 22 % _ > 11 %
0%
< 46 % _ > 15 %
0%
< 89 % _ > 11 %
<44% *
AMP: amputation; BM: body mass; DA: dietary advice; CHO: carbohydrates; DAM: men who received DA; En: energy intake; LARN: Livelli di Assunzione di Riferimento di Nutrienti ed energia per la popolazione italiana (Dietary reference values of nutrients and energy for the Italian population); LD: lockdown; NDAM: men who did not receive DA; NDAW: women who did not receive DA; OHC: other health conditions; PRO: proteins; SB: spina bifida; SCI: spinal cord injury; T1: first camp, before DA; T2: second training camp, 2 months after DA; T3: post-COVID-19 LD follow-up. Continuous variables are expressed as mean and standard deviation, when normality (Shapiro–Wilk) test passed (ANOVA applied, followed by Student–Newman–Keuls) or as median (25–95%), when normality test (Shapiro–Wilk) failed (Kruskal–Wallis ANOVA on ranks, followed by Dunn’s method). a,b: different letter p < 0.05. Categorical variables are expressed as percentages, χ2: * p < 0.05.
Table 4. Micronutrient intake.
MicronutrientsDAM-T1 (n = 16)DAM-T2 (n = 12)DAM-T3 (n = 12)NDAM-T3 (n = 12)NDAW-T3 (n = 9)
Vitamin B1 mg
1.2 (M) and 1.1 (W) LARN
1.1 (0.8–1.8)1.0 (0.9–1.7)1.1 (1.0–1.2)1.0 (0.9–1.1)0.9 (0.8–1.2)
<50%<58%<92%<20%<67%
Vitamin B2 mg
1.6 (M) and 1.3 (W) LARN
1.6 (1.1–2.9)1.8 (1.4–2.4)1.7 (1.4–1.9)1.2 (1.1–1.4)1.1 (0.9–1.3)
<44%<42%<22%<85%<55%
Vitamin B3 mg
18.0 LARN
23.4 ± 5.1 a20.5 ± 4.8 a22.3 ± 3.7 a15.9 ± 3.9 b10.8 ± 4.1 c
<6%<17%<3% *<15%<13%
Vitamin B6 mg
1.3 LARN
2.4 ± 0.7 a2.4 ± 0.6 a2.4 ± 0.3 a1.7 ± 0.5 b1.3 ± 0.7 b
0%0%0%<15%<67% *
Vitamin B12 µg
2.4 LARN
2.2 ± 0.4 a3.0 ± 0.5 b2.7 ± 0.1 c2.3 ± 0.1 a1.9 ± 0.3 a
<80%0%0%<61%<100% *
Folic acid µg
400.0 LARN
318.6 ± 133.2 a,b364.2 ± 128.1 a329.3 ± 77.5 a,b233.1 ± 92.2 b200.0 ± 89.3 b
<75%<75%<78%<92%<100%
Vitamin C mg
105 (M) and 85 (W) LARN
89.5 (71.7–154.3)94.8 (49.8–164.2)128.2 (76.4–133.3)78.9 (44.1–96.7)55.7 (48.5–73.1)
<62%<50%<44%<93%<89%
Vitamin A (RE) µg
700 (M) and 600 (W) LARN
664 (530–1266)812 (673–1437)826 (533–1211)722 (350–832)456 (326–693)
<56%<25%<44%<46%<67%
Beta-caroteneµg2703 (1924–4021)3307 (1877–6936)3884 (2426–6343)3484 (1348–4482)2009 (1436–2844)
Vitamin E mg
13.0 (M) and 12.0 (W) LARN
14.9 (13.1–17.5) a14.0 (12.7–16.3) a11.6 (9.2–14.6) a.b9.3 (7.6–11.0) b8.1 (5.0–10.5) b
<25%<17%<56%<92%<100% *
Vitamin D µg
15.0 LARN
1.9 (1.7–3.5) a1.7 (1.2–2.2) a6.5 (2.3–11.5) b2.1 (1.9–3.7) a,b2.2 (1.7–2.9) a,b
<100%<100%<100%<100%<100%
Calcium g
1.00 LARN
0.77 (0.46–10)0.61 (0.50–0.78)0.86 (0.84-0.95)0.85 (0. 73-0.98)0.74 (0.62-0.83)
<75%<92%<89%<85%<100%
Phosphorus g
0.7 LARN
1.35 (1.10–1.60) a1.30 (1.18–1.39) a1.25 (1.12–1.34) a,b0.91 (0.89–1.03) b0.75 (0.60–1.09) b
0%0%0%0%<44% *
Sodium g
in the range 1.5–2.0 LARN
1.99 (0.98–2.48)1.39 (1.01–2.63)1.15 (0.79–1.95)1.04 (0.74–1.69)1.53 (1.09–1.63)
12%17%11%23%44%
Potassium g
3.9 LARN
3.05 (2.73–4.01) a3.01 (2.51–3.63) a,b2.98 (2.26–3.32) a,b2.14 (1.80–2.57) b1.58 (1.12–2.95) b
<69%<92%<100%<85%<79%
Iron mg
10.0 (M) and 18.0 (W) LARN
HEME iron
non-HEME iron
11.2 (9.9–14.6) a11.0 (9.1–14.2) a11.9 (9.4–13.4) a8.0 (7.2–11.0) a,b5.9 (5.7–8.0) b
<25%<33%<33%<69%<100%
3.6 ± 1.3 a3.6 ± 1.1 a3.5 ±1.0 a3.6 ± 1.5 a1.7 ± 0.3 b
8.6 (6.8–10.5) a8.4 (6.1–10.8) a,b8.1 (6.1–11.0) a,b5.3 (4.2–6.5) b4.4 (3.1–7.4) b
Zinc mg
12.0 (M) and 9.0 (W) LARN
13.7 ± 3.7 a14.0 ± 2.6 a11.9 ± 2.3 a,b10.0 ± 3.4 b,c8.2 ± 3.1 c
<37%<25%<44%<77%<67%
DAM: men who received dietary advice (DA); LARN: Livelli di Assunzione di Riferimento di Nutrienti ed energia per la popolazione italiana (Dietary reference values of nutrients and energy for the Italian population); M: men; NDAM: men who did not receive DA; NDAW: women who did not receive DA; OHC: other health conditions; T1: first camp, before DA; T2: second training camp, 2 months after DA; T3: post-COVID-19 lockdown (LD) follow-up; W: women. Continuous variables are expressed as mean and standard deviation, when normality (Shapiro–Wilk) test passed (ANOVA applied, followed by Student–Newman–Keuls) or as median (25%–95%), when normality test (Shapiro–Wilk) failed (Kruskal–Wallis ANOVA on ranks, followed by Dunn’s method). a,b,c: different letter p < 0.05. Categorical variables are expressed as percentages, χ2: * p < 0.05.
Publisher’s Note: MDPI stays neutral with regard to jurisdictional claims in published maps and institutional affiliations.

