Article

Solar Gain Influence on the Thermal and Energy Performance of Existing Mosque Buildings in the Hot-Arid Climate of Riyadh City

by
Ahmed Ali A. Shohan
1,*,
Hanan Al-Khatri
2,
Ahmed Ali Bindajam
1 and
Mohamed B. Gadi
3
1
Department of Architecture and Planning, Faculty of Engineering, King Khalid University, Abha 61411, Saudi Arabia
2
Department of Civil and Architectural Engineering, College of Engineering, Sultan Qaboos University, P.O. Box 33, Al-Khod, Muscat 123, Oman
3
Department of Architecture and the Built Environment, University of Nottingham, Nottingham NG7 2RD, UK
*
Author to whom correspondence should be addressed.
Sustainability 2021, 13(6), 3332; https://doi.org/10.3390/su13063332
Submission received: 31 January 2021 / Revised: 10 March 2021 / Accepted: 16 March 2021 / Published: 17 March 2021

Abstract

:
The required cooling energy in buildings exceeds 65% of the total energy consumed inside buildings under the extreme climatic conditions of Saudi Arabia. The proper design of buildings’ envelopes has a considerable potential in reducing such levels, especially in public buildings. The reported study evaluated the thermal performance of mosque buildings with focus on the solar gains through the envelope elements. Computer simulations were carried out using Thermal Analysis Software (TAS). In addition, the thermal and comfort votes of the worshippers in one mosque were collected. The findings revealed uncomfortable thermal conditions, especially during summer months. The required cooling energy ranged between 37% and 55% in the investigated mosques. Investigating the solar gains of the envelope elements of one mosque indicated that the roof is the largest contributor to solar gain, which highlights the potential for future research to explore new constructional alternatives with the aim of improving the roofs’ thermal performance.

1. Introduction

In Saudi Arabia, air-conditioning systems are responsible for consuming approximately 65% of the electric energy used in buildings. Compared with around 22% and 21% in the United States and Australia [1], respectively, this relatively high percentage is a reflection of several factors including the harsh and extreme climatic conditions and the comparatively low and subsidized prices of electricity in the Saudi market. In this regard, it is worth mentioning that Saudi Arabia has the second-largest crude oil reserves in the world of around 22.2%, after Venezuela which has 24.8% [2]. Despite the slight increase in prices after the launch of the Saudi Vision 2030 in 2010, they are still considered to be highly subsidized compared to in many countries. Other factors that contribute to the high cooling energy consumed in Saudi buildings include the general lack of awareness about environmental issues among the public and many architects. It is widely noted that restricting the budgets allocated for public buildings like mosques comes at the expense of the quality of these buildings’ envelopes. For instance, omitting thermal insulation layers provides some savings in the initial costs of construction. However, this results in free heat transfer through the building envelope, which, in turn, results in increasing cooling and heating demands [3].
Mosques are religious buildings where Muslim worshipers perform five prayers daily. In Saudi Arabia, the number of mosques noticeably increased from 55,266 in 2008 to more than 94,000 in 2013 [4]. This increase in number was accompanied by considerable increases in the consumed cooling energy in such buildings that may sometimes exceed that of hospitals and educational buildings [5], especially during summer periods [6]. Therefore, the paper at hand aims to evaluate the thermal and energy performance of selected mosque buildings in Riyadh city by means of computer simulations using Thermal Analysis Software (TAS). The paper focuses on the solar gain of the mosques’ elements like the roof, external walls, doors, and windows.
Mosque buildings are public buildings that generally follow unified constructional details, despite their architectural design variations or their microclimatic conditions. Considering this on one hand, and the reductions and restrictions in the budget for operating and constructing mosque buildings on the other hand, the importance of achieving thermal comfort, or at least reducing the gap towards achieving it passively, is revealed. This, in turn, highlights the importance of the reported research, as evaluating the thermal and energy performance of mosques is a crucial step in identifying the building elements that require improving their constructional details.

Background of Mosques’ Buildings

Mosque buildings are architecturally special, as they are characterized by a discontinuous occupation pattern due to the nature of the activities that are performed inside them. Mosques are spaces in which Islamic followers perform their five daily prayers that are distributed along the day and last for a few minutes each. This discontinuous occupation pattern creates pressure on the cooling systems due to the extreme climatic conditions in Saudi Arabia on one hand and the necessity of achieving comfortable indoor conditions to assist worshippers in reaching peace and serenity feelings on the other hand [7]. In addition, mosques provide spaces for religious educational activities and celebrating special religious occasions. Consequently, high occupancy rates are expected during such occasions, which has resulted in considerable cooling demands, particularly in summer.
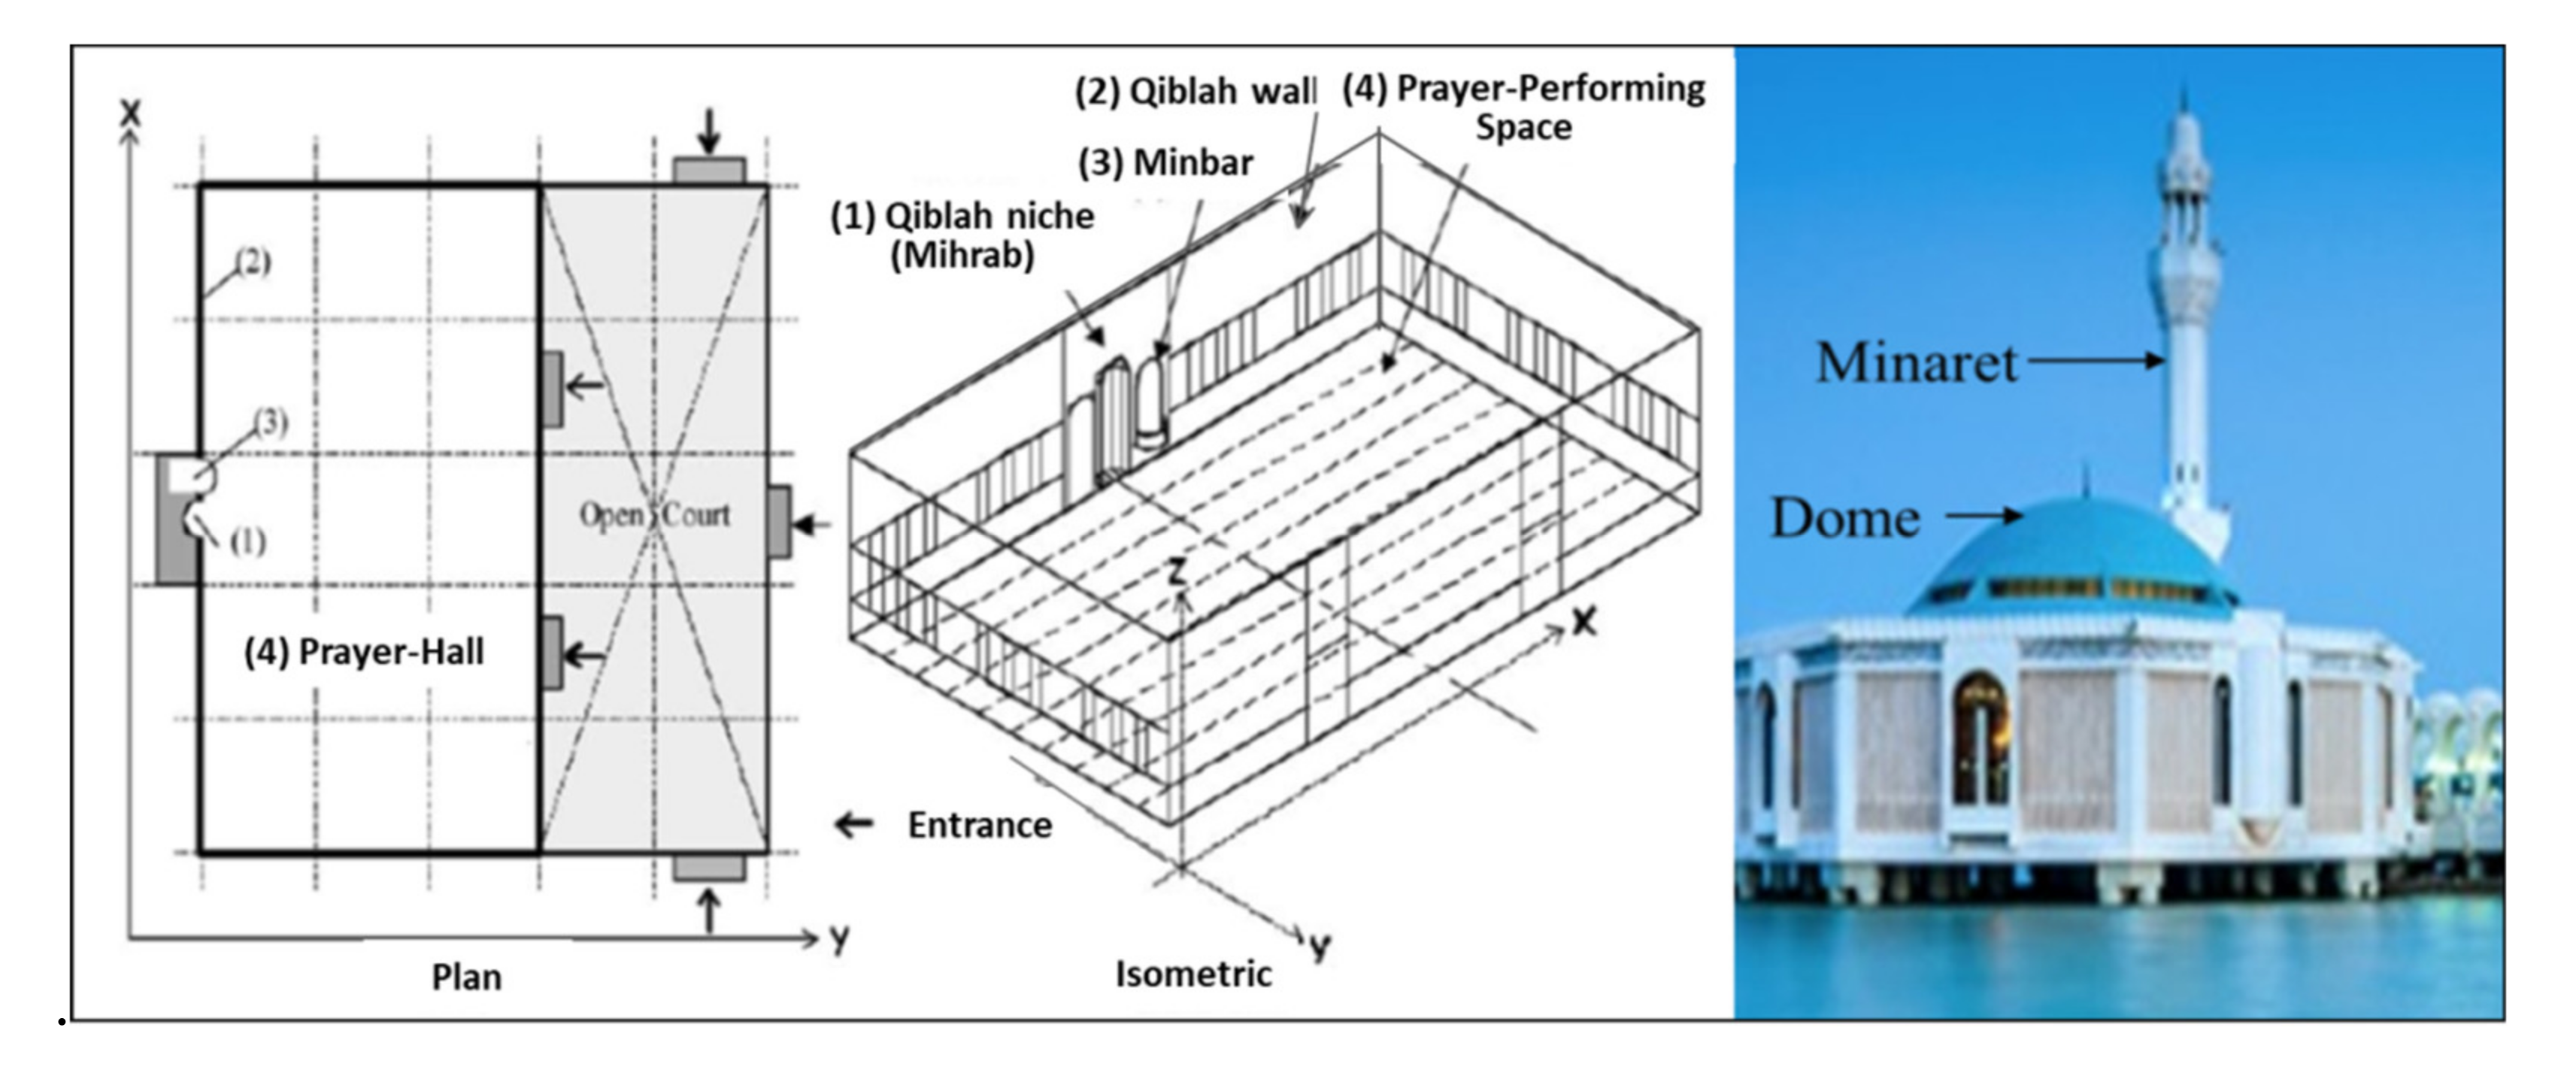
Figure 1 presented the architectural elements of a typical mosque building. Mosques are usually built in simple rectangular forms with large praying halls. The halls are usually open plan with high ceilings and sometimes small, enclosed rooms are attached to the halls. In each mosque, one of the longest sides of the rectangular form is called the qibla wall and it must be oriented towards the direction of Al-Ka’abah in Makkah city [8,9,10,11,12,13].
The prayer hall is designed to satisfy the requirements of the Muslims’ prayer [9,11]. The prayer involves some physical actions like standing, bowing, prostrating, and sitting [7,8,9,10,11]. In addition, the worshippers should stand facing qibla (the Makkah city direction) in straight parallel rows that are 1.2 m roughly in width. A special prayer is performed on Friday, in which the worshippers sit to listen to a speech (Khutbah) from the leader of the congregation (Imam) who stands on the pulpit (minbar). Accordingly, the required area per worshipper is estimated as 0.8 × 1.2 = 0.96 m2 [11]. It is worth mentioning that not all mosques are used for Friday prayers.
The qibla wall is an important wall in any mosque, as it contains two important architectural elements. The first is the niche that is known as mihrab, as noted in Figure 1. Centering the qibla wall, the niche denotes the direction of Makkah city and is used during prayers by the leader (Imam). Different sizes and shapes are found for this niche, including semi-circular or square plans [10,11,14]. The other architectural element is the pulpit (minbar). It is located to the right of the niche and it should be approximately 1–2 m higher than the level of the prayer hall [7,10,11]. The Imam stands on this pulpit when delivering speeches during special prayers like the Friday prayer, Eid prayers, and Estisqa prayer.
Considering their external appearance, the mosques’ buildings are characterized by domes and attics that center the roofs with different shapes and sizes [10]. Besides architectural expression of the status of the mosque, the typically half sphere dome plays a structural role by reducing the number of columns inside the prayer hall. This is important in mosques to ensure there is good eye contact between the Imam and the worshippers during speeches [14]. In addition, locating the domes at the center of the praying hall ensures a good distribution of natural daylight in the hall through the skylights that are part of the dome. Moreover, the external appearance of the mosques’ buildings is characterized by the tower (minaret). Each mosque should at least have one minaret that is located in the corner of the mosque building [10]. In the past, these minarets were used to deliver the call for prayer (Atha’n) as far as possible, but nowadays they are usually used for symbolism of the mosque.

2. Literature Review

Reviewing previous studies related to thermal comfort in mosques’ buildings revealed an increased interest among researchers, especially during the second decade of this century, i.e., since 2011, as presented in the following sections.

2.1. Thermal Comfort and Energy Performance in Mosques’ Buildings

An investigation on the influence of outdoor conditions, represented in the outdoor air temperature, on the energy consumption of 20 mosques was carried out in the hot arid climate of Saudi Arabia. To achieve comfortable indoor conditions, the investigated mosques depended on air-conditioning systems only for except one that, additionally, integrated a passive and evaporative cooling system using wind catchers. The findings revealed that considerable amounts of energy were consumed to achieve comfort in all mosques when the outdoor air temperature increases, except in the mosque that integrated the passive cooling system. It may worth mentioning that the integrated air-conditioning systems included window units, a chilled water system, and a central air-conditioning system [6].
Another study evaluated the indoor comfort conditions and their relationship with the consumed energy levels in three mosques located in the hot humid climate of Dammam city in Saudi Arabia. It should be mentioned that only one mosque integrated thermal insulation in its envelope. Thermal dissatisfaction was reported in the two uninsulated mosques despite consuming higher levels of energy, which highlights the importance of integrating a thermal insulation layer [11].
The thermal conditions of six air-conditioned mosques located in hot arid climate of Kuwait were investigated. Field measurements included the indoor air temperature, relative humidity, air velocity, and operative temperature. In addition, a questionnaire was distributed among the worshippers to explore the factors that influence their thermal comfort. Neutrality was achieved at 26.1 °C and 23.3 °C when considering the actual and the predicted mean votes, respectively. The study suggested designing the mosque buildings in Kuwait to maintain an operative indoor temperature of 26.1 °C to achieve considerable energy savings [10].
In another study in Kuwait, a typical mosque building was simulated using visual DOE 4.1 to explore the thermal performance of the mosque and the potential to conserve energy. Applying strategies to improve the envelope performance besides applying operational strategies to optimize energy consumption resulted in energy savings of approximately 72% [15]. In another study conducted in a hot humid zone in Saudi Arabia, visual DOE was used in addition to physical sensors to determine the indoor air temperature in mosque buildings with the aim of exploring the relation between the operational zoning strategy and the cooling energy. Around 30% annual reductions in energy were achieved when oversizing air-conditioners and operating them an hour prior to each prayer. Moreover, it was found that proper operation of air-conditioners resulted in estimated savings in the annual energy in both thermally insulated and uninsulated mosques of 23% and 36%, respectively [9].
The thermal performance of a mosque building that integrates technological strategies to achieve energy efficiency was evaluated using Energy Plus software. In addition, the influence of integrating these strategies on the indoor thermal conditions was evaluated by obtaining physical measurements including the indoor air temperature, relative humidity, air velocity, and mean radiant temperature. The findings revealed that despite integrating technological measures, the internal thermal conditions were not comfortable. Indeed, the indoor air temperature was above the upper boundary of the comfort zone for most hours in the experiment day due to heat gains through the roof. The software simulations indicated improvements in the indoor thermal conditions when integrating roof insulation. It may worth mentioning that the investigated mosque was located in Sarawak in Malaysia, which is characterized by its hot and humid climate [7].
Using Design Builder v4.5 and Energy Plus v8.3, mosque buildings from different climatic zones were simulated to evaluate the influence of their architectural features on the indoor environment. Further, the influence of integrating a green roof system and louver shading was evaluated in a mosque selected from Riyadh city that has a hot dry climate. The combined effect of the green roof and the shading systems decreased the required cooling energy in the mosque by approximately 10% [16]. In a similar study, and applying the same tools, the effects of different design options for roof applied in a mosque in Riyadh were explored. The study confirmed the previous findings, as a noticeable decrease in cooling energy was achieved when integrating the green roof combined with thermal insulation [17].
The impact of three different systems of air distributions at four diffuser station velocities on the indoor thermal comfort conditions was evaluated using Energy Plus and CFD computer simulations while considering Fanger’s Predicted Mean Vote (PMV) index. Overcooling conditions were witnessed with a PMV of -0.66 or below. Besides, the air distributer behaved differently when applying each of the examined air distribution systems and diffuser station velocities [18].
A recent simulation study was conducted with the aim of exploring the thermal performance of passive design strategies integrated into three mosques that follow the colonial style in Malaysia. The findings revealed thermally acceptable environments in the investigated mosques. This mainly was due to the integration of five passive strategies, among which a veranda as an effective shading device had the highest impact. In addition, the integration of domes in the mosques contributed positively to the comfortable indoor conditions through shading. It may worth mentioning that it is possible to broadly classify the mosques’ styles in Malaysia into vernacular, colonial, and modern [19].
Another recent study simulated the thermal comfort conditions of a mosque building in Abha city using Thermal Analysis Software (TAS). The city is located in Saudi Arabia and has a semi-arid moderate/cold mountainous climate. The computer simulation findings were compared with the findings of physical measurements including air temperature, relative humidity, and cooling loads. In addition, the thermal performance of mosques’ fabrics and envelopes in terms of solar gain and heat loss/gain by conduction and its impacts on thermal comfort and energy demands were discussed. Uncomfortable conditions during summer and winter were revealed owning to heat gain and loss, respectively. These conditions were mainly because of the poor quality of each mosque’s envelope [20].
In spite of the presented efforts to study mosques, further studies are required to investigate the thermal comfort, thermal performance, and energy conservation in mosque buildings while taking into account the lack of research considering this type of buildings. Within the available research, the studies considering mosque buildings come mainly from hot humid and semi-arid climates. The study at hand adds to the pool of research by comprehensively exploring the thermal performance of a mosque building and the effect of solar radiation on energy consumption in addition to the thermal comfort conditions. The selected mosque is located in the hot arid and desert climate of Riyadh city.

2.2. Background of Riyadh City and Its Climate

Located in the Middle East, Saudi Arabia has an area of approximately 2,331,000 km2 and it contains four major climatic zones. Two of these zones are coastal; one extends over the western coast and is in the hot to moderate and humid zone, whereas the other extends over the eastern coast and is in the hot to cold and humid zone. A moderate to cold climatic zone exists in the mountainous region of Saudi Arabia that is known as the western heights. The remaining sandy deserts and plateaus of the country are characterized by a hot to cold and arid desert climate [21,22,23].
The investigated mosque in this study is located in Riyadh, which is the capital city of Saudi Arabia. Located in the middle of the country on the eastern side of the Najd Plateau, the city is characterized by an arid desert climate where the air temperature occasionally exceeds 49 °C in summer and falls below −2 °C in winter. The mean air temperatures and relative humidity in summer fluctuate from 26 °C to 43 °C and from 10% to 22%, respectively. The corresponding temperatures and relative humidity in winter are from 3 °C to 22 °C and from 40% to 60%. The average day length in summer is around 13:50 hrs with a peak solar radiation of approximately 7.9 kW/m2. In winter, the day length is 10:15 hrs on average with a peak solar radiation of around 3.1 kW/m2. In general, rain is rare and ranges between 10 cm and 13.1 cm in winter [24].

3. Methodology

This paper reports the findings of a simulation-based investigation of the thermal and energy performance of a mosque building in Riyadh city, Saudi Arabia. A small-scale thermal comfort survey was, additionally, carried out. The survey included conducting physical measurements and distributing a questionnaire among the worshippers. Combining both methods is important to comprehensively appreciate the influence of the mosque constructional details on its energy performance, as well as on the occupants’ thermal experience. In particular, the construction details of the building determine to a large extent the internal thermal conditions to which the occupants are subjected. In turn, the occupants’ interaction with these conditions influences the cooling loads of the building and, hence, its energy performance.

3.1. The Climatic Conditions of Riyadh

According to the Koppen–Geiger climate classification, Riyadh is located in a hot arid desert climate zone. In general, it is possible to distinguish two climatic seasons in Riyadh. The period from April to October forms the hot dry season, whereas the remaining months form the relatively cooler season. As observed in Figure 2, the mean maximum air temperature in the former season extends between 32 °C and 42 °C and the mean minimum air temperature extends between 16 °C and 26 °C. Likewise, the mean maximum and minimum air temperatures in the cooler season are 21–29 °C and 8–13 °C, respectively. The relative humidity ranges are 33–64% and 60–75% in the morning for the hot and cooler seasons, respectively. For the afternoon relative humidity, the corresponding ranges are 19–34% and 33–52%. The rainy period extends from January to May with a maximum of 25 mm in April.
Figure 2 shows the average precipitation, mean minimum and maximum air temperatures, and morning and afternoon relative humidity in Riyadh. Additionally, the mean, minimum, and maximum solar irradiation levels are presented in Figure 3. The mean global irradiation extends between 70 kWh/m2 and 110 kWh/m2 during the hot dry season and between 38 kWh/m2 and 69 kWh/m2 during the cooler season. In the former season, the maximum and minimum global irradiation ranges are 92–113 kWh/m2 and 43–77 kWh/m2, respectively. The corresponding ranges in the latter season are 37–88 kWh/m2 and 14–49 kWh/m2. It is worth mentioning that Saudi Arabia is located within a sunbelt region [25].

3.2. The Investigate Mosques

Riyadh city was divided into three zones based on the city terrain and streets. Three mosques from each zone were preliminarily selected, forming a total of nine mosques. These nine mosques were compared based on their size, capacity, construction age, availability of consumed energy data, and issues related to energy consumption as reported by the people in charge of operating these mosques. As a result, one mosque from each zone was selected for this study. One of these mosques is used for Friday prayer; the remaining two are used for daily prayers only. Table 1 summarizes the features of these mosques.

3.3. Model’s Input Data

Thermal Analysis Software (TAS) was selected to carry out the simulation study reported in this paper. The selection of this software was based on the recommendations of previous studies [26,27,28,29,30].
The accuracy of the outcomes of any simulation process is considerably affected by the quality of the input data [27,31,32,33]. Based on this, the investigated mosques were visited several times to collect data regarding their envelopes, fabrics, materials, windows, doors, and internal gains including occupants, lighting, and equipment as well as the integrated HVAC systems. In addition, information regarding the thermal properties of the mosques’ elements like the thermal insulation type and thickness were obtained. The data were collected through observations and interviews with representatives from the Ministry of Islamic Affairs and some architectural agencies. The electricity bills for the mosques were obtained from the Saudi Consolidated Electric Company (SCECO). Moreover, the internal gains of the occupants, equipment, and lighting were computed based on CIBSE guide A [31].
The modeled mosques were thermally lightweight, as the external walls were from concrete blocks without insulation. Besides, no thermal insulation was added to the roofs, as the real roofs only have water insulation. The setpoint temperatures were set as 20 °C and 24 °C for the lower and upper limits, respectively, in line with the recommendations of [34,35,36]. Table 2, Table 3, and Figure 4 summarize the constructional details of the simulated mosque envelope. It is worth mentioning that these details are typical and widely common in public buildings in Saudi Arabia.

3.4. Thermal Comfort Investigation

As mentioned earlier, a small-scale thermal comfort investigation was conducted to support the findings of the simulation results. The small-scale investigation utilized sensors to collect the major physical variables that influence the thermal environment in the investigated mosque. In addition, the investigation utilized a questionnaire to collect the worshippers’ subjective responses towards their thermal environment. The measured variables were air temperature, surface temperature, globe temperature, air velocity, and relative humidity. Table 4 presents the accuracy of these sensors. The questionnaire was distributed among the worshippers during the hottest and coldest days in summer and winter, which are the 22nd of June and 22nd of December, respectively. On each day, the participants were asked to fill the questionnaire after the second and fifth prayers, as more worshippers are available in mosques at these prayers compared with the others. The participants were asked about their thermal comfort, thermal sensation, health state, activities level before attending the prayer, clothing level, and their familiarity with the mosque.

3.5. The Model Calibration

The Pearson correlation coefficient was computed to evaluate the relationships between the physical measurements obtained using the sensors and the simulated findings using TAS software. The coefficient was computed for the indoor air temperatures, outdoor air temperatures, indoor relative humidity, and outdoor relative humidity in summer and winter, as displayed in Table 5. The correlation between the outdoor data is related to the accuracy of the used weather file, whereas that between the indoor data indicates the accuracy of the simulated model. As observed, the measured and simulated parameters were moderately or strongly related in both seasons. An exception was the indoor relative humidity during winter when the measured humidity was noticeably lower than the simulated values. This may indicate a failure in the used sensor. Moreover, it is noted that the correlations between the outdoor parameters were comparatively stronger. Indeed, this is expected considering the inaccuracy of occupancy patterns predictions and the difficulty of reflecting such patterns in the simulated model. It should be mentioned that mosque buildings are characterized by random and discontinuous usage pattern, which increases the difficulty of predicting and simulating the occupancy pattern.

4. Results and Discussion

The buildings’ envelope and fabrics have an influential role in determining the quality of the indoor thermal environment. In general, solar gain is the main source for heat in buildings and it can be defined as the amount of solar radiation absorbed by a surface [37]. As an example, the solar gains of Al-Hassan Ibn Ali mosque in representative winter and summer days are discussed below based on the mosque elements.

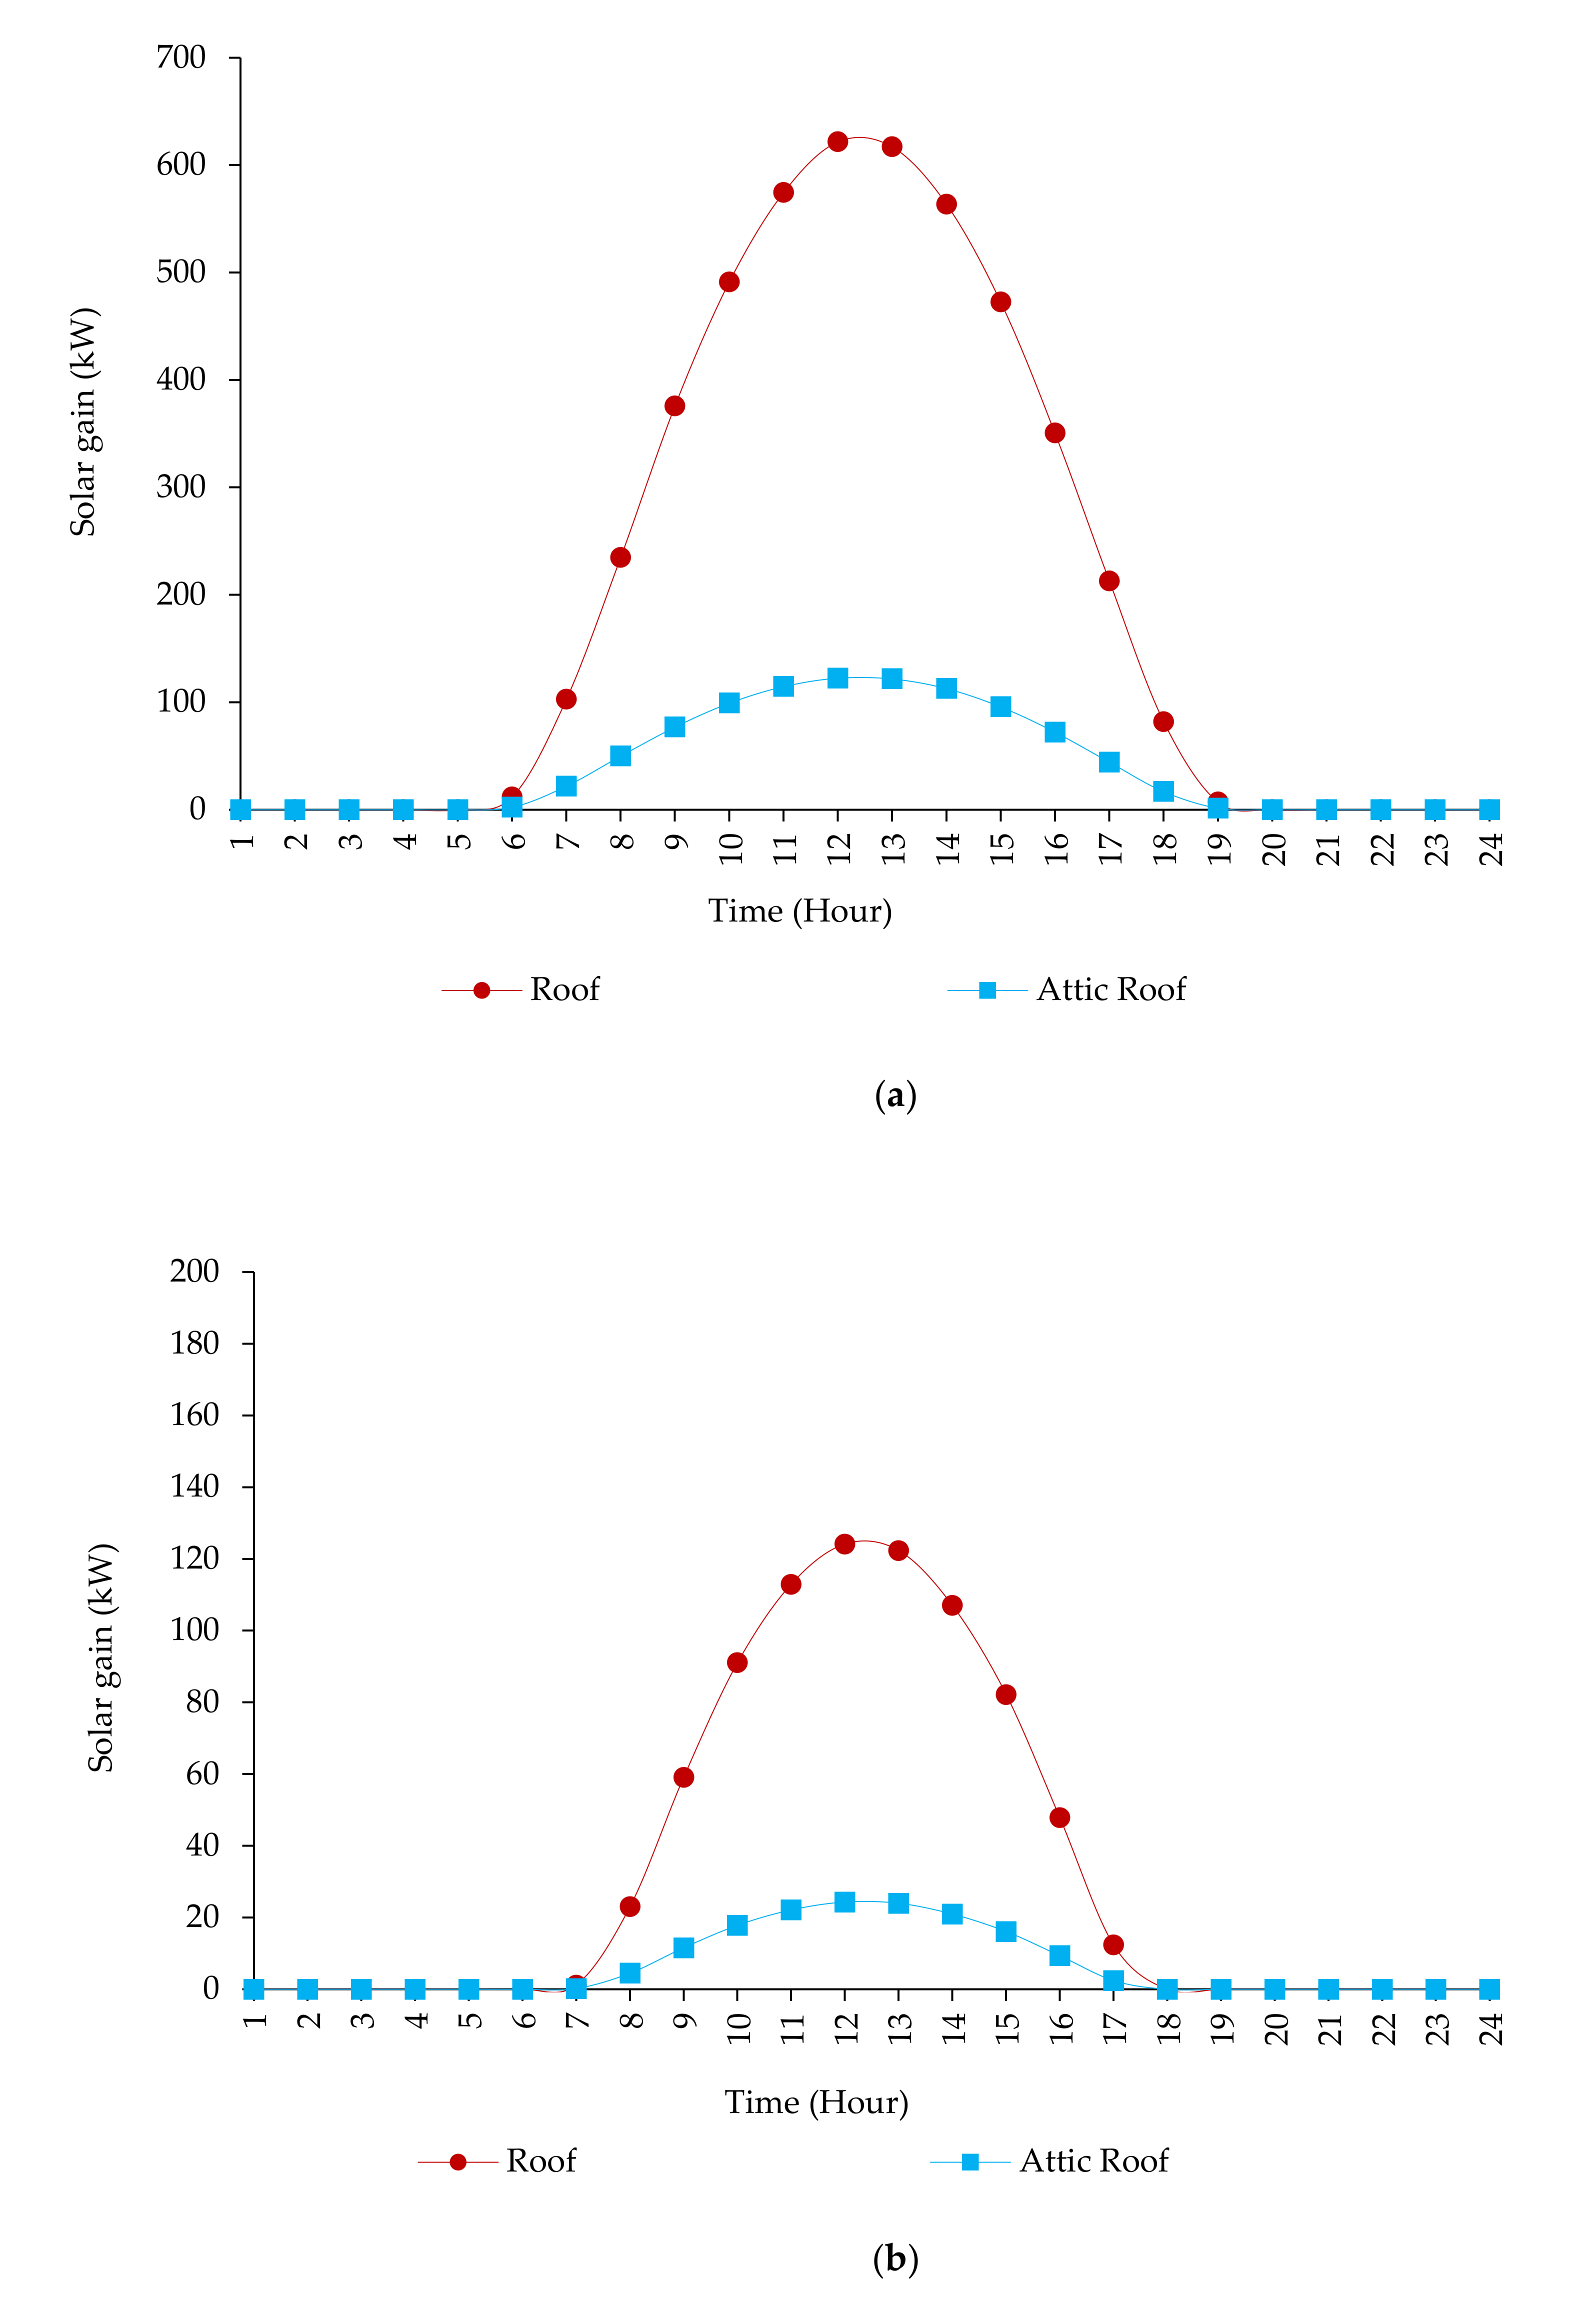
4.1. Solar Gain of Roof

Generally, the roof experiences the highest solar gain because it has the largest area exposed to the solar radiation compared with the other elements in a building. This indicates the importance of the careful selection of the roof’s construction materials and details. Figure 5 presents the solar gain of the roof of the investigated mosque. Both the roof and the attic roof are identical in terms of materials and components. Their difference is in the area and level. The former has a larger area and a lower level, which indicates its greater exposure to solar radiation, despite the fact that it experiences shade in some areas. It is noted that the summer daytime is longer by almost 2 h compared with that of winter. Considering the main roof, the maximum solar gain exceeded 622 kW and 124 kW in summer and winter, respectively. For the attic roof, the corresponding solar gains were around 122 kW and 24.3 kW. For both roofs, the maximum gains occurred at noon (i.e., at 12:00). The variation in the solar gains of the main roof and the attic roof was attributed to the difference in their areas, as the former’s area is around 910 m2 compared with 178 m2 of the latter.

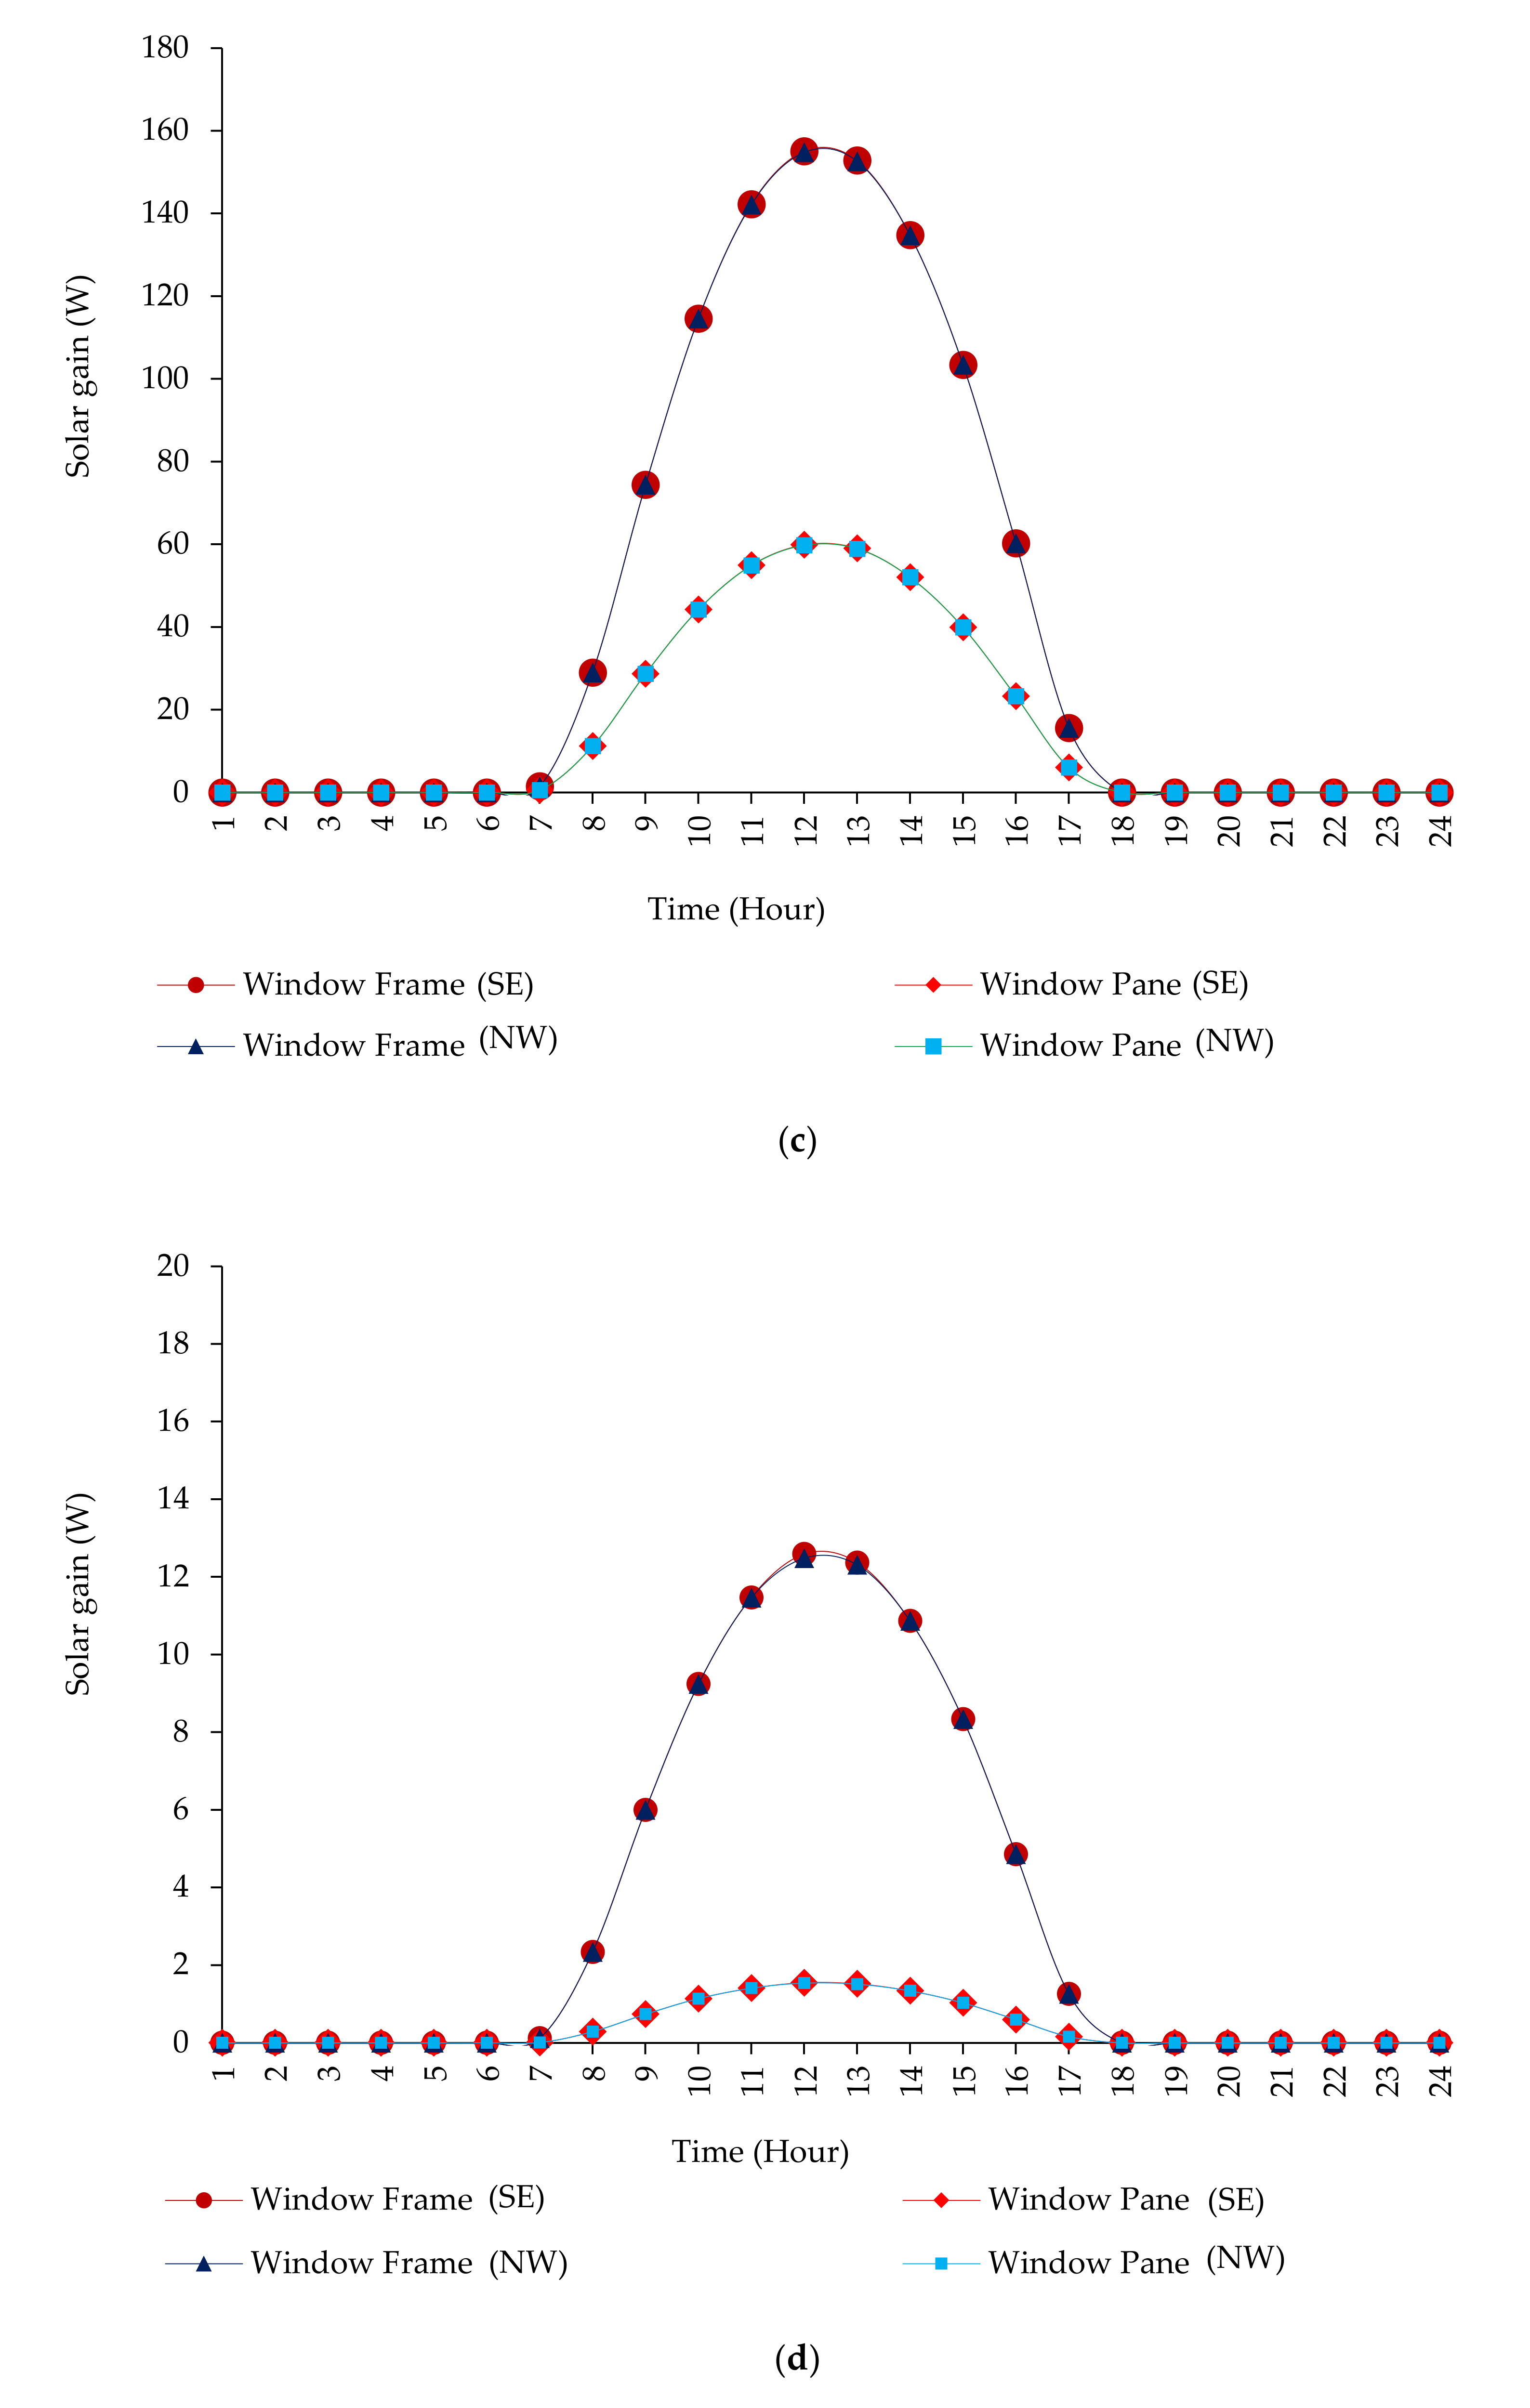
4.2. Solar Gain of Windows

The solar gain of the windows in the investigated mosque are presented in Figure 6. The mosque windows were distributed on the north-western and south-eastern facades only. As observed, both the seasonal and the materials’ effect are obvious, as the gains in summer and of frames were higher compared with those in winter and of panes. It should be mentioned that the frames were made from aluminum. Likewise, the influence of the curtains’ presence was obvious, as their presence provided significant reductions in solar gains of both windows’ frames and panes for all orientations. The solar gains were additionally consistent with the orientation of the windows’ frames and panes, regardless of if they were covered by curtains or not. Considering summer for instance, the south-eastern windows had comparatively higher solar gains during mornings (i.e., before 12:00), whereas the north-western windows’ frames and panes had comparatively higher solar gains during the afternoon (i.e., after 12:00). In winter, windows showed almost identical solar gains despite their orientation. This may be due to the combined effect of low solar angle and neighboring buildings located opposite to the south-eastern façade of the mosque, as illustrated in Figure 7.

4.3. Solar Gain of Doors

The doors in the investigated mosque are located opposite on the north-eastern and south-western facades. The solar gains of the door frames and panes as well as the frames and panes of the doors’ windows are presented in Figure 8. In general, the solar gains followed a similar pattern to that of the windows’ solar gain, as presented previously. As expected, the gains in summer were higher, with maximums exceeding 210 W compared with 150 W in winter. The north-eastern doors’ gains increased sharply during the morning to reach the maximum at 10:00. After that, the gains decreased and were almost constant between 12:00 and 15:00. They increased to another maximum at around 17:00, which was much lower than that of 10:00, before declining at the end of the day. The solar gains of the south-western doors increased gradually during the day to reach maximums at around 15:00. These maximum gains were below those of the north-eastern walls for the same period.
In addition, the winter gains of the frames and panes of the doors and doors’ windows were almost similar and followed a symmetrical pattern around the maximum gain at noon. Further, it is noted that north-eastern doors were responsible for higher gains compared with the south-western doors, which may reflect the influence of the urban context in which the mosque is located.

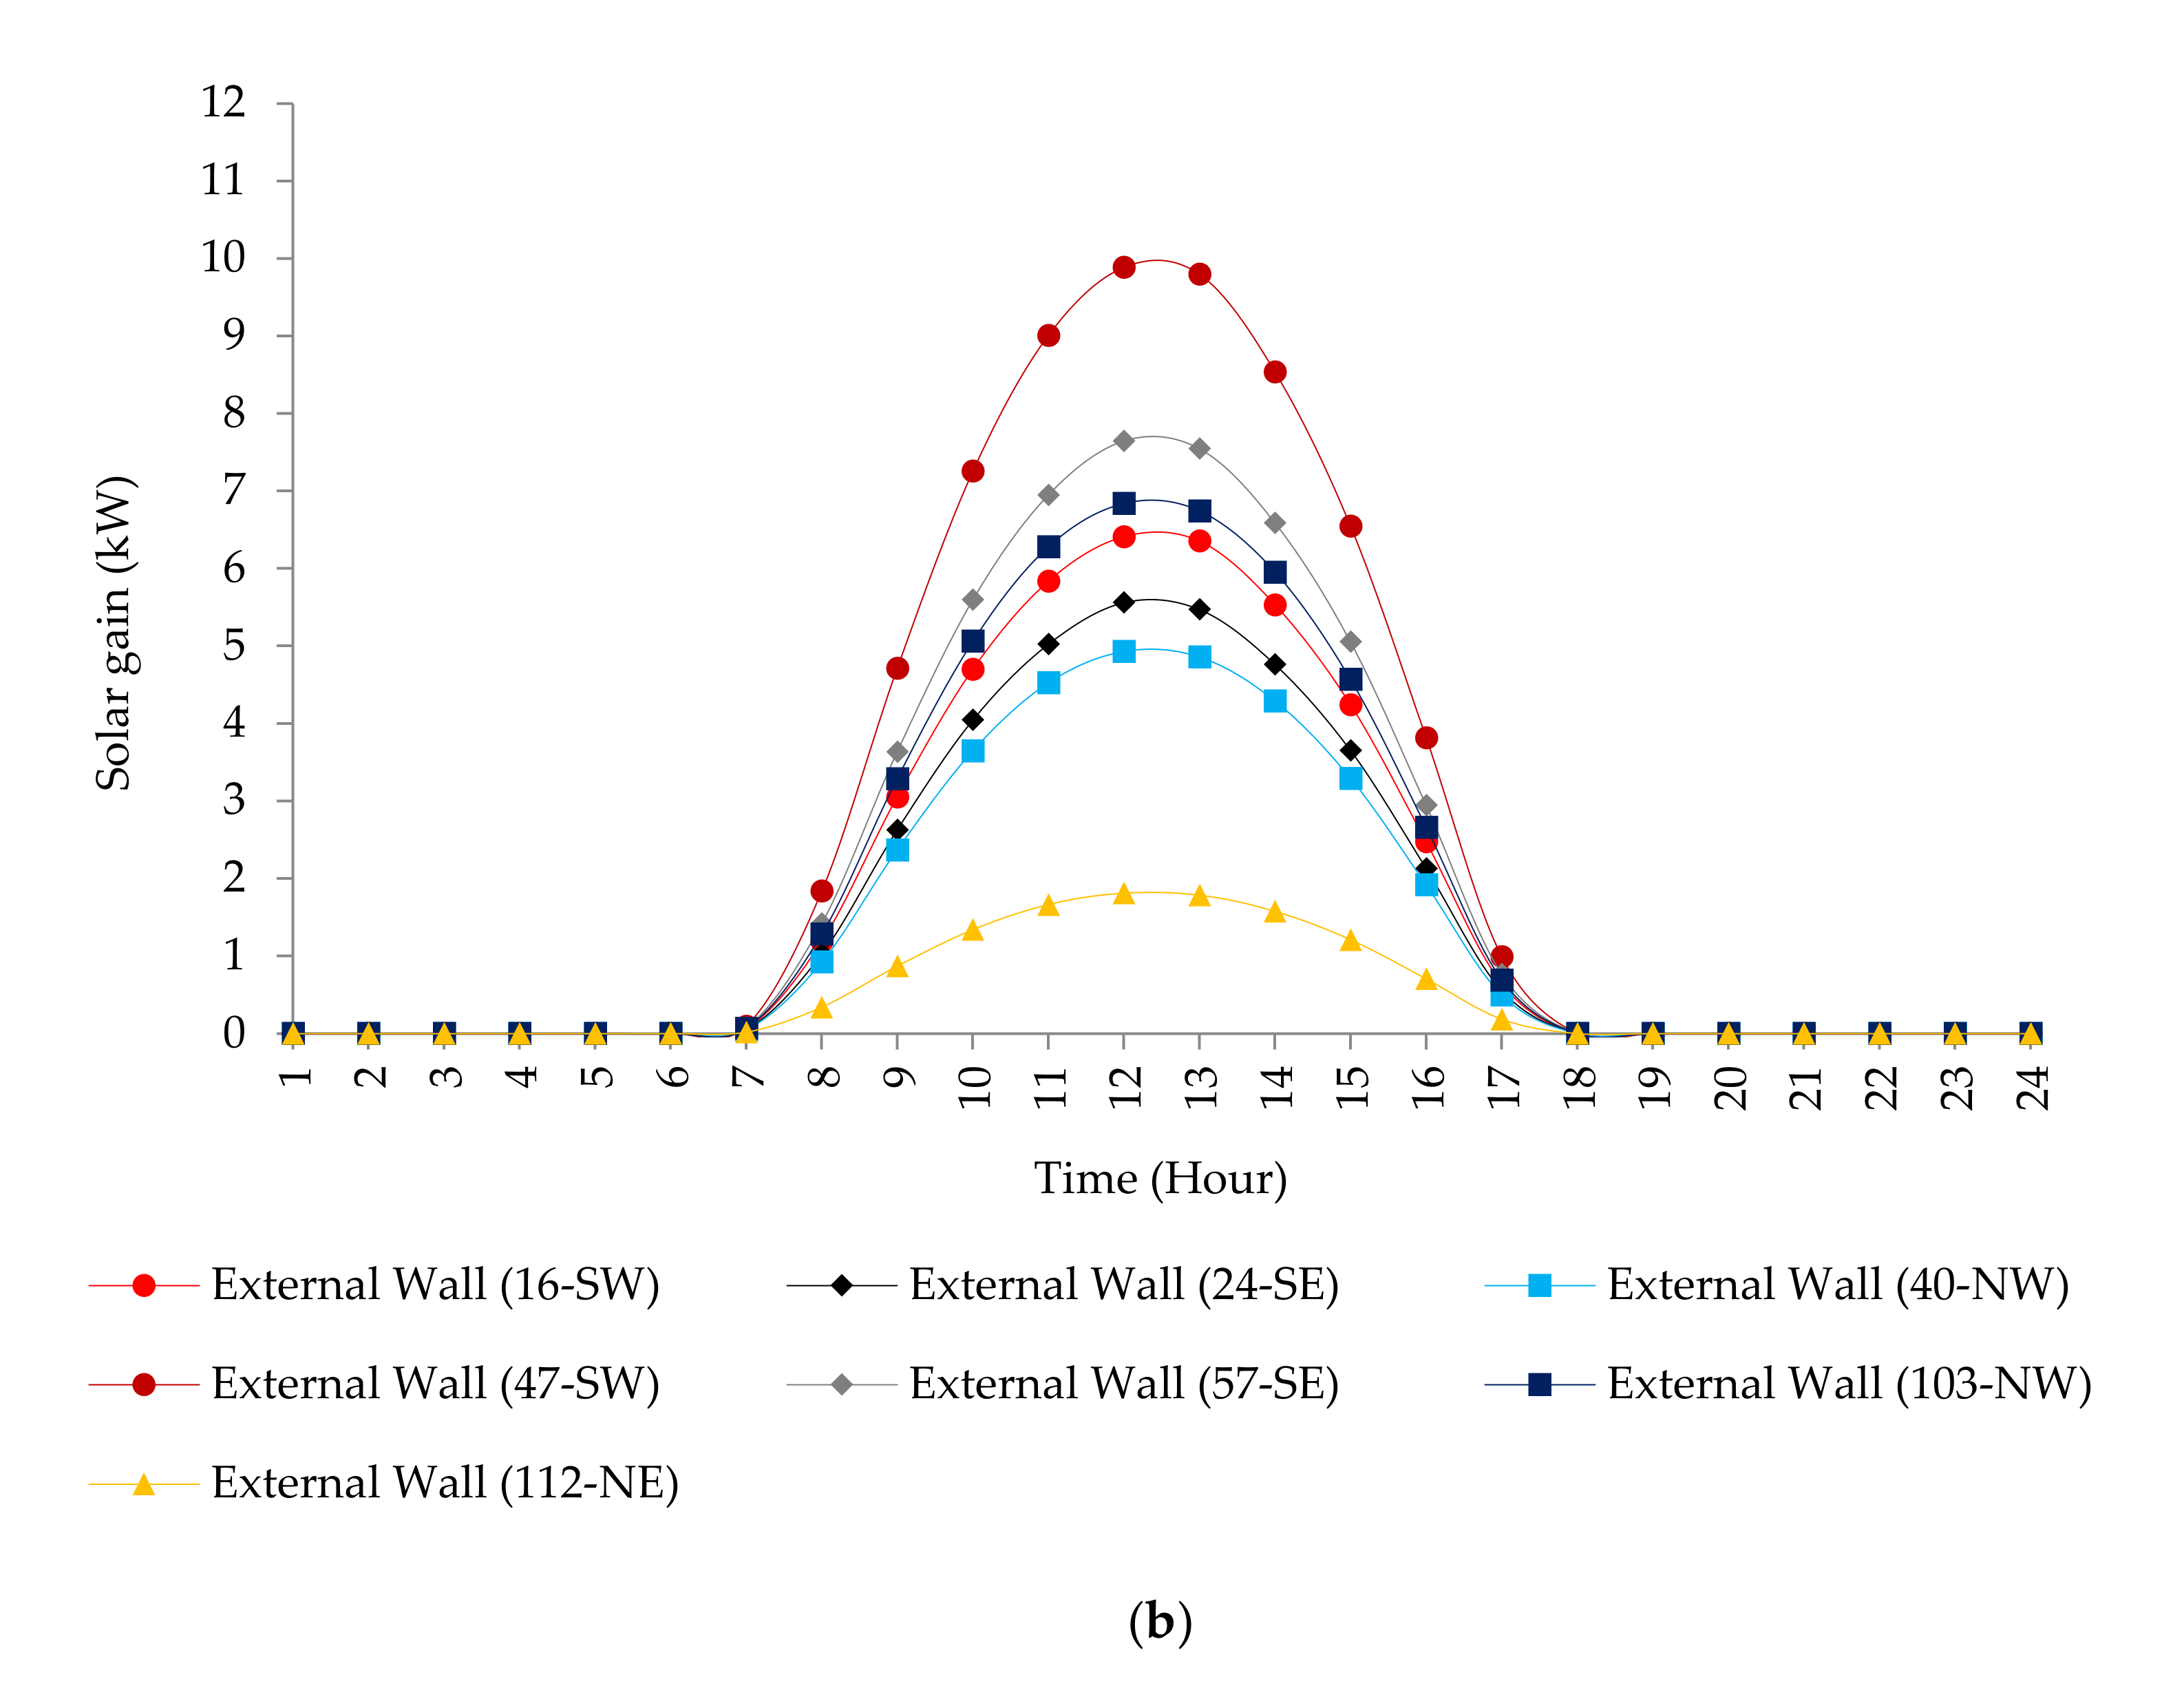
4.4. Solar Gain of External Walls

Figure 9 presents the solar gains of the external walls. A discrepancy between the summer and winter gains can be noticed, as the maximum gains were above 50 kW and below 10 kW, respectively. During summer, the solar gains’ pattern responded to the influence of the walls’ orientation. For instance, the eastern walls increased gradually during the morning, reached a maximum gain at 10:00, and then started decreasing. The western walls’ gains increased gradually until 9:00, decreased until 11:00, and increased again sharply reaching the maximum gains between 15:00 and 16:00. As expected, the gains of south-western walls were much higher than those of the north-western walls, which may be attributed to the shade from the eastern tents and the surrounding buildings.
In winter, the solar gains were symmetrical around noon, with a maximum of around 10 kW from a south-western wall. The criticality of the southern and western facades was emphasized, as their gains were generally higher compared with the other facades.

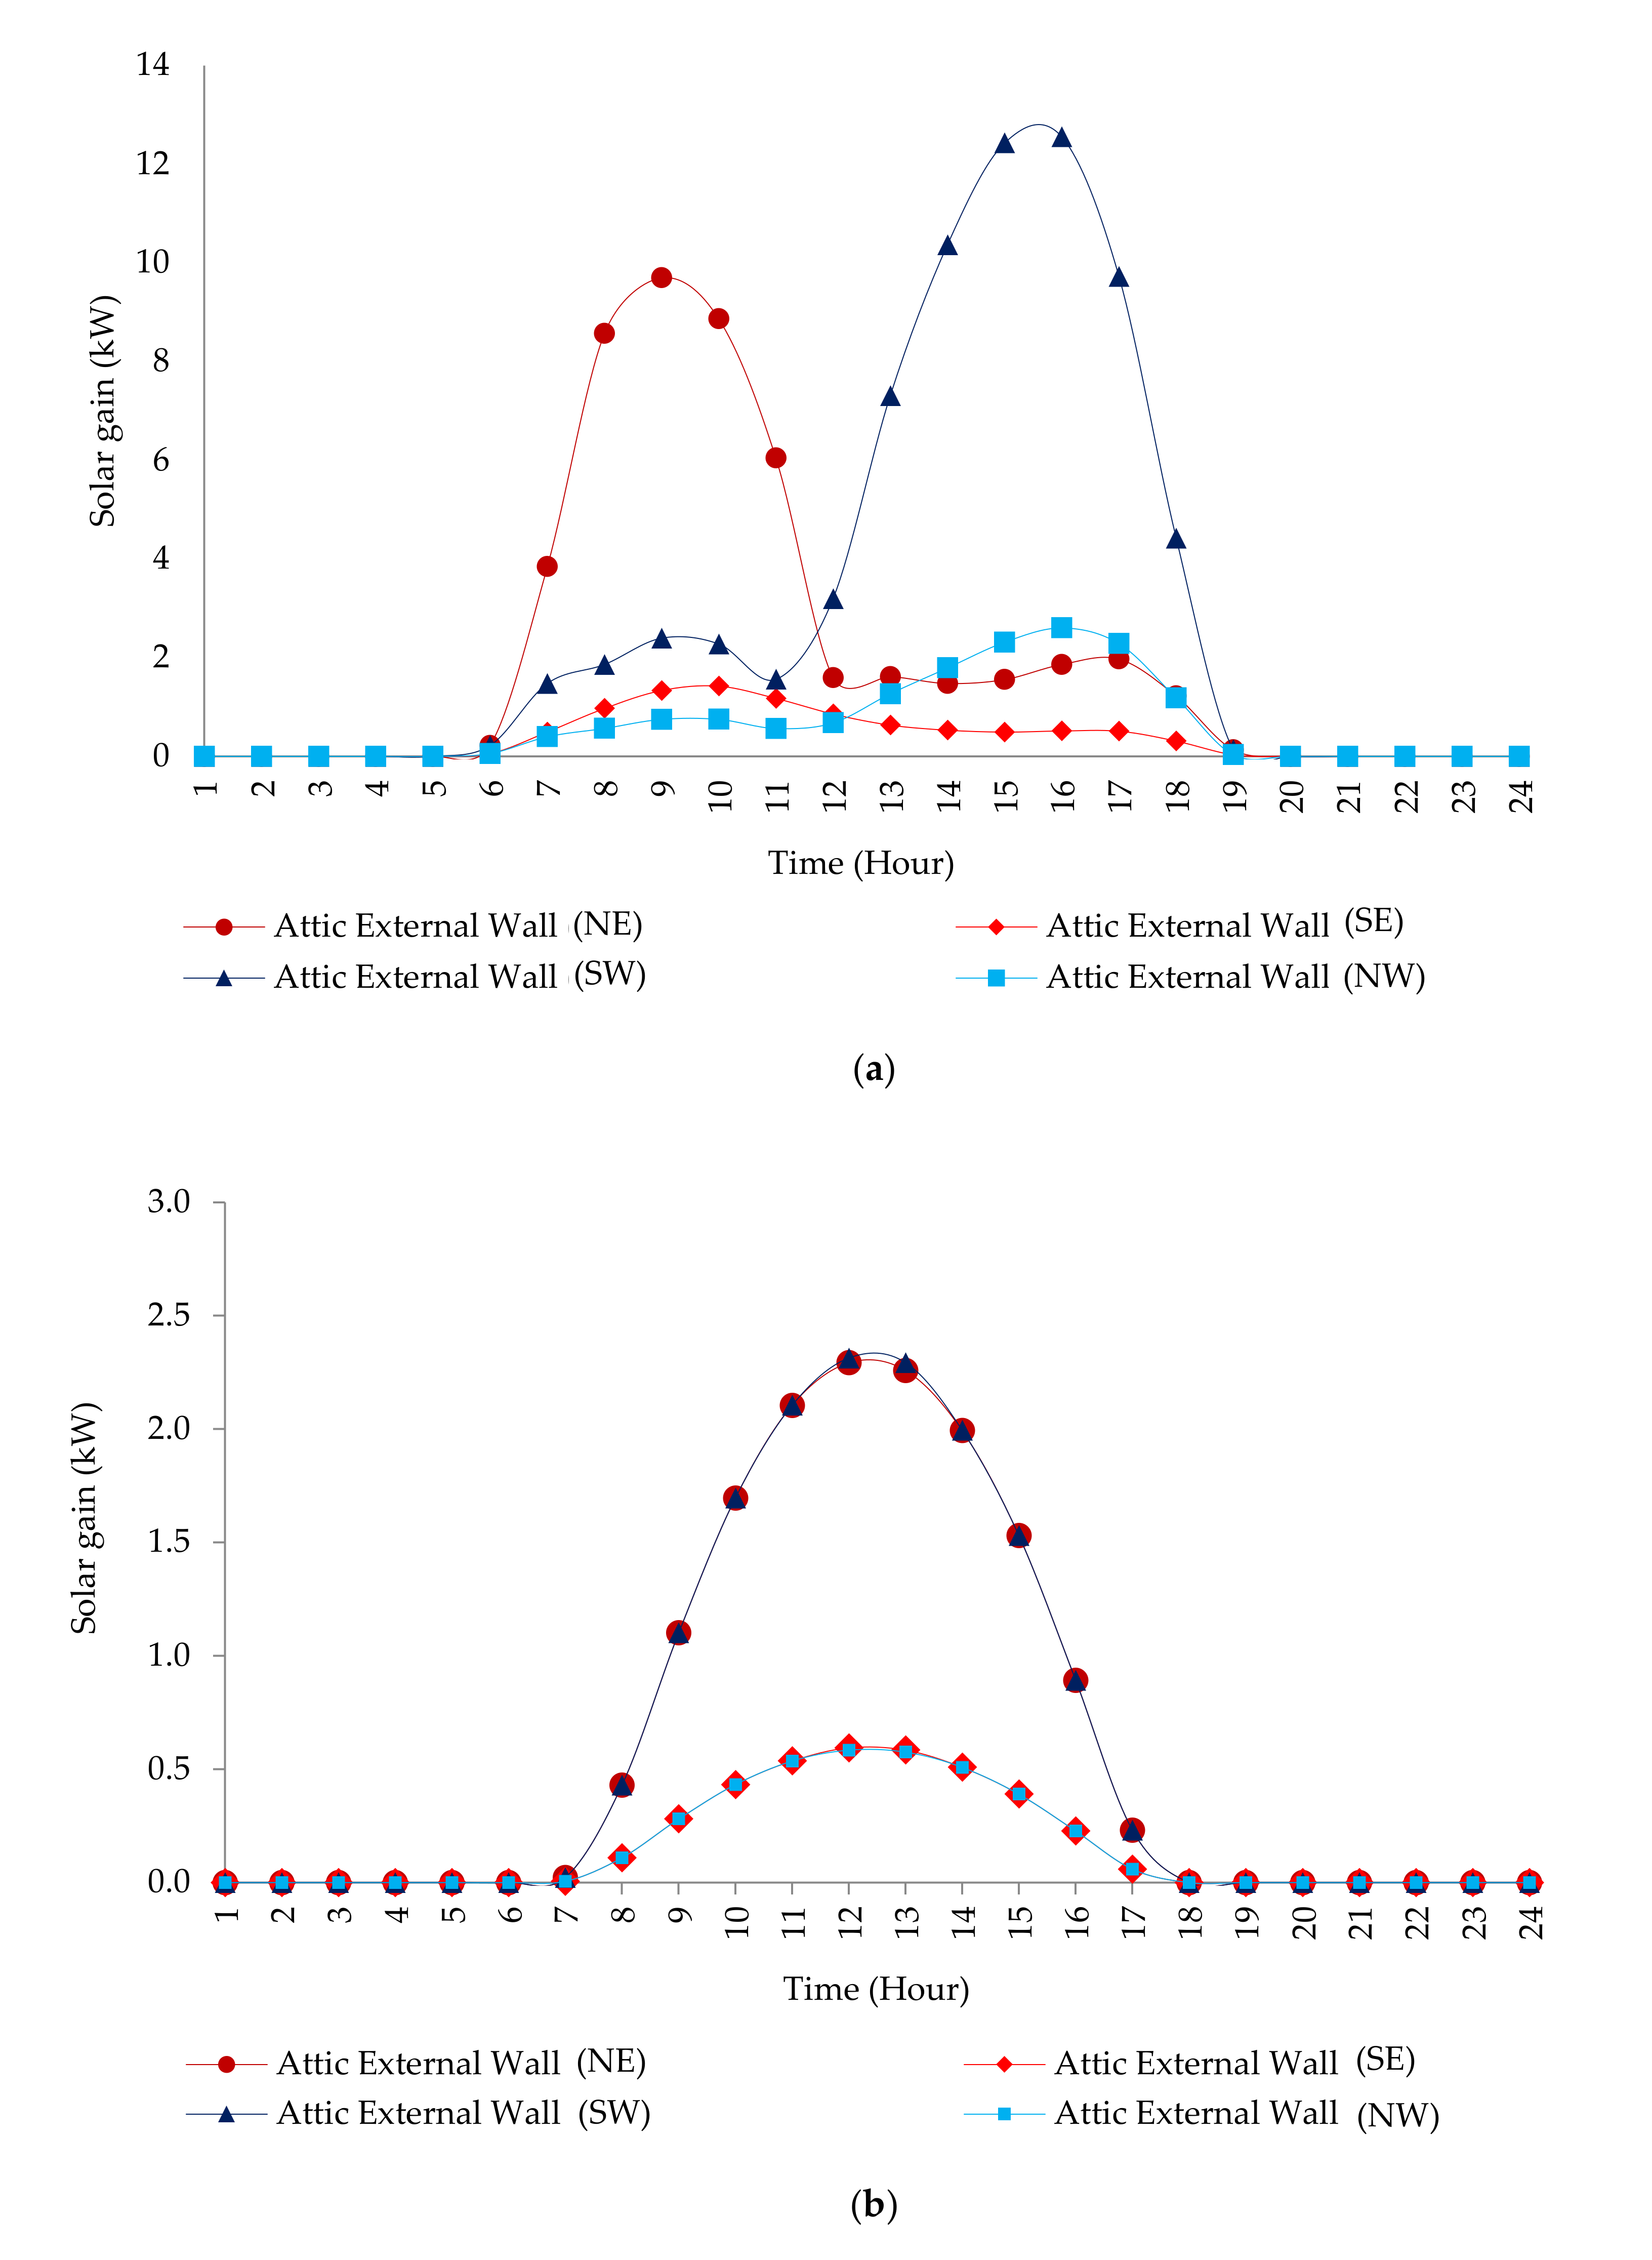
4.5. Solar Gain of the Attic

The solar gains of the attic are displayed in Figure 10. The previously noted discrepancies between summer and winter gains were observed, with maximums exceeding 12 kW in the former season and maximums of 2.5 kW in the latter. Besides, the pattern of the solar gains in both seasons were consistent with the rectangular form of the attic, with the main facades being the north-eastern and the south-western ones. For instance, the highest gains during summer mornings were from the north-eastern wall, whereas the highest gains in the afternoon were from the south-western wall. Moreover, the previously mentioned symmetrical pattern of solar gains in winter was observed for the attic. The gains of each opposite walls were almost identical, with those of the north-eastern and south-western walls being higher.

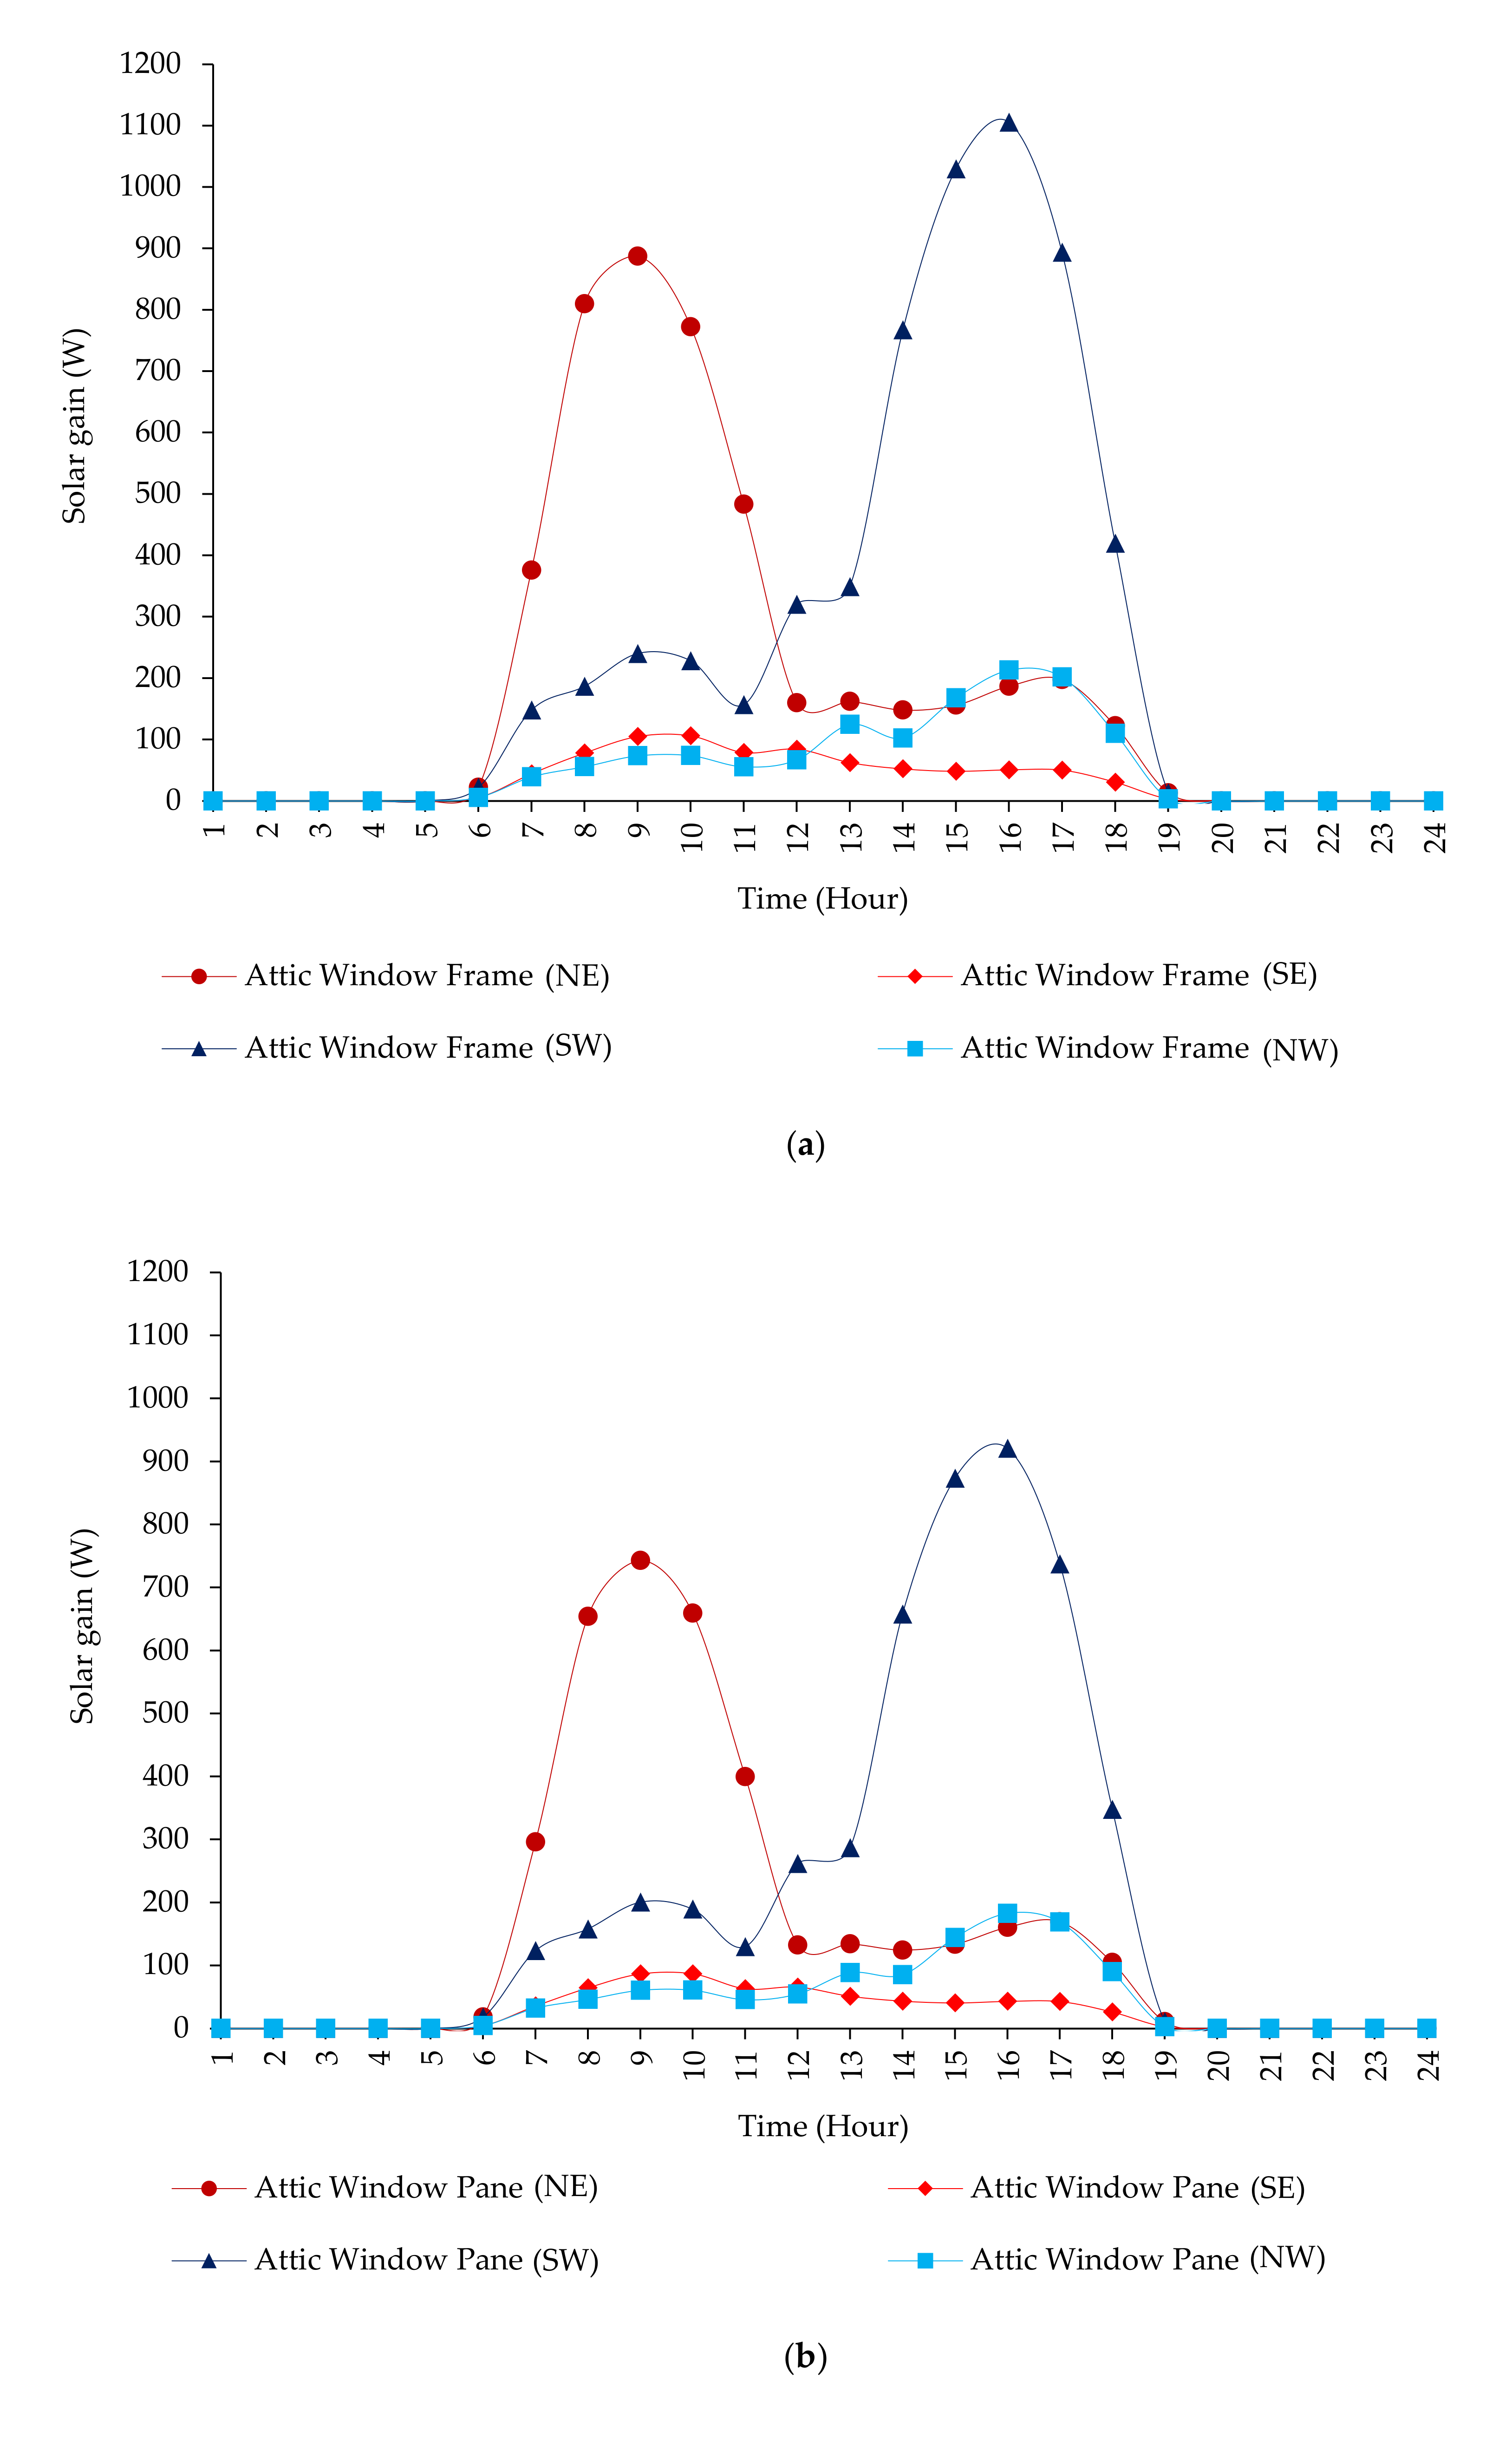
4.6. Solar Gain of the Attic Windows

The solar gains of the attic windows are presented in Figure 11. As expected, the gains in both seasons followed the pattern of the walls’ solar gains, as presented earlier. In summer, the maximum gains occurred in the afternoon of around 1.1 kW and 0.9 kW for the south-western frame and pane, respectively. In winter, the maximum gains were almost 0.23 kW for both the north-eastern and south-western frames and 0.19 kW for both the north-eastern and south-western panes.

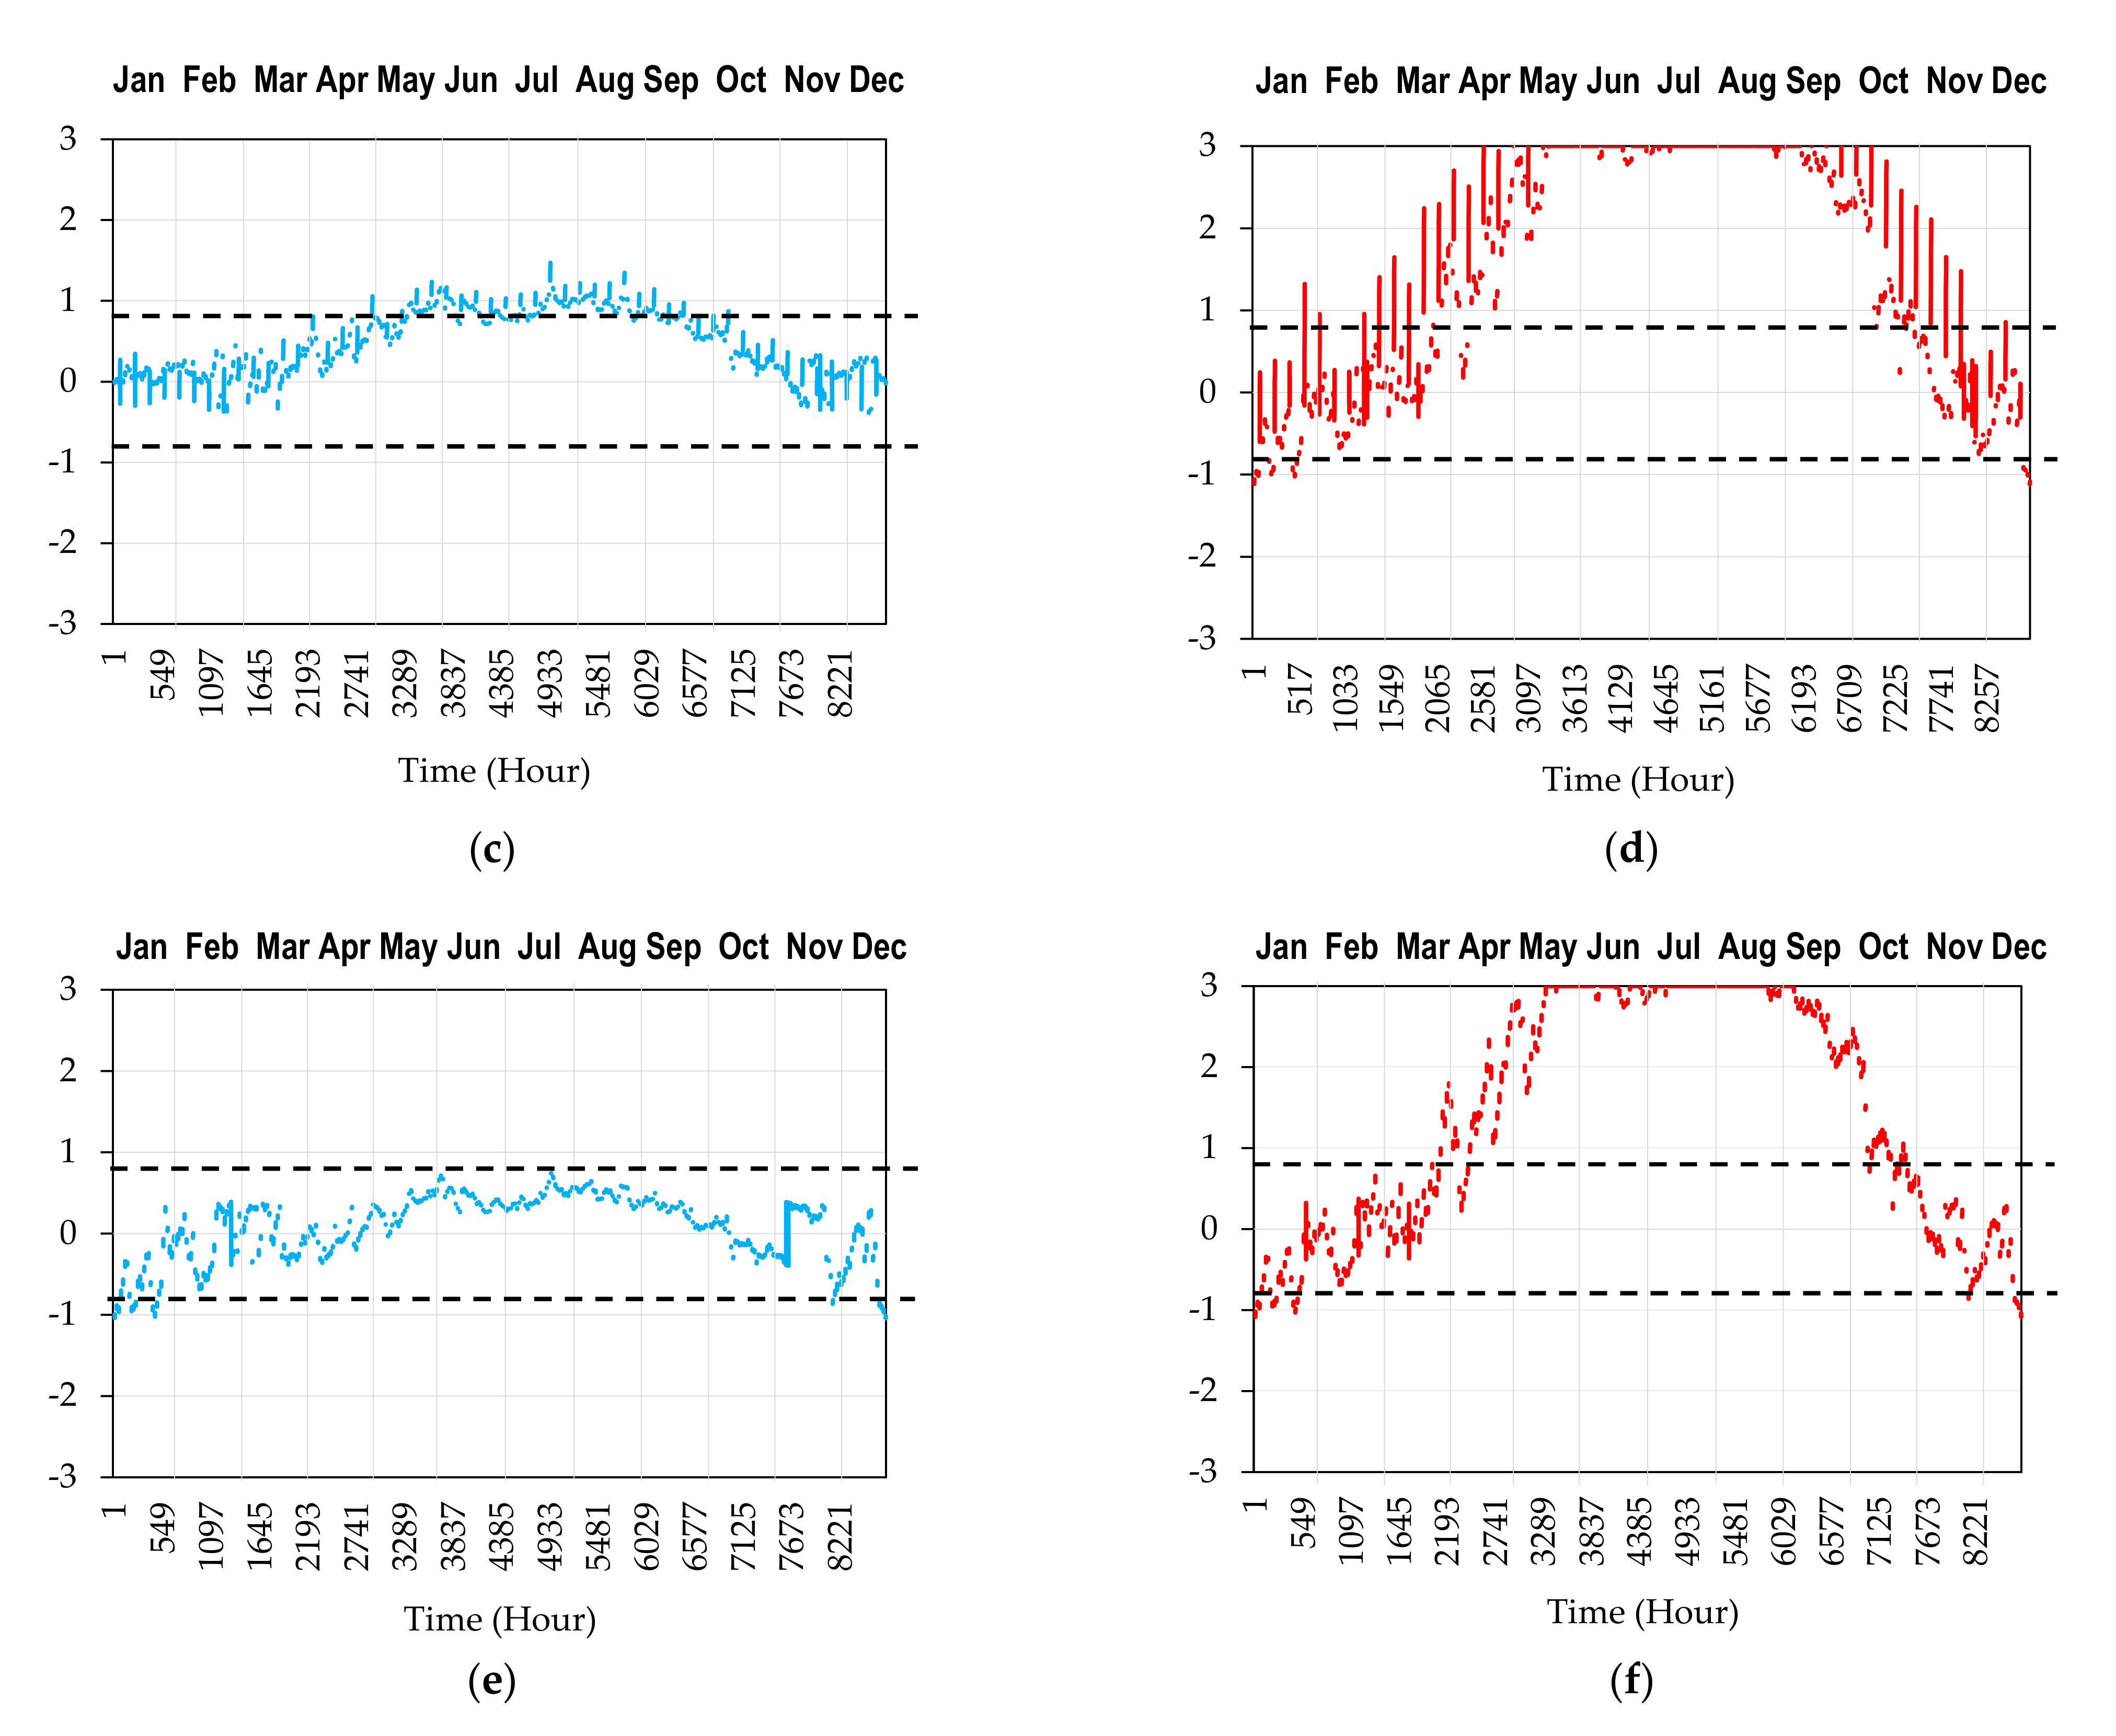
4.7. Predicted Mean Vote (PMV)

The influence of the solar gain on the indoor thermal comfort conditions was explored by the predicted mean vote (PMV). Simulating PMV in TAS requires defining three parameters, namely the metabolic rate (met), clothing level (Iclo), and air velocity (va). In both seasons, the metabolic rate of a sedentary person was taken as being 1.2 met. Clothing levels of 0.6 clo and 0.95 clo were assumed for summer and winter, respectively. The corresponding values of air velocity were taken as 0.3 m/s and 0.15 m/s. Two scenarios for each mosque were simulated, namely a free running mode and a controlled mode. The former assumed that the absence of active cooling or heating, whereas the latter assumed that the air conditioning units were switched on to satisfy the indoor thermal demands.
For both the free running and controlled modes and in the three explored mosques, the highest PMV was in summer, whereas the lowest was in winter. The free running mode in the three mosques witnessed uncomfortable PMVs that were outside the widely acceptable range of comfort of (−0.5) to (+0.5), as illustrated in Figure 12. In spite of operating the controlled mode, there were variations in the PMV during summer (e.g., May, June, July, and August) and winter (e.g., December, January, and February). Overall, the votes during the controlled mode extended between (−1.15) to (+1.47) in Al-Sheikh Ishaq Al-Hajri mosque and Al-Hassan Ibn Ali mosque, respectively. Considering the free running mode, the votes extended from (−1.54) in Al-Hassan Ibn Ali mosque up to (+3.00) in the three mosques.
Despite the fact that the relatively best indoor thermal conditions were achieved in the controlled mode in Prince Sultan mosque of (−0.96) to (+0.85), they were outside the widely accepted comfort zone of (−0.5) to (+0.5). Considering the controlled mode in Al-Hassan Ibn Ali mosque, the indoor conditions in winter were within the comfort zone, whereas they exceeded the zone in summer as the votes extended from (−0.40) to (+1.47).
Relaxing the comfort zone to extend between (−0.80) to (+0.80) revealed comfortable indoor conditions throughout the year in both Prince Sultan and Al-Sheikh Ishaq Al-Hajri mosques under the controlled mode. In Al-Hassan Ibn Ali mosque, the conditions were comfortable in the period from October to April. Obviously, none of the mosques were fully within this relaxed zone in the free running mode. However, the conditions of three months, namely December to February, were comfortable in both Prince Sultan and Al-Hassan Ibn Ali mosques. For Al-Sheikh Ishaq Al-Hajri, the comfortable conditions included the previous period in addition to November and March, which may indicate the integrating of comparatively better passive strategies in this mosque.

4.8. Actual Thermal Sensation and Comfort Votes

Before the second and fifth prayers, 610 and 250 questionnaires were respectively distributed on the worshippers in summer. The corresponding questionnaires were 450 and 240 in winter. Around 31.2% and 43.5% of the summer and winter questionnaires were completed and analyzed, respectively.
Around 81% and 91% of the participants lived in Riyadh for more than three years in the summer and winter questionnaires, respectively. The age range extended between 8 and 66 years old during the second prayer and between 10 and 70 years old in the fifth prayer in summer. The corresponding ranges in winter were from 7 to 74 years old and from 7 to 68 years old. Moreover, the clothing level of the participants was 0.59–0.84 clo and 0.59–1.44 clo in summer and winter, respectively. It is noted that the lower levels were identical in both seasons; however, the upper limits reflect the effect of the climatic conditions. For the activities’ levels, the range extended between 1.13 met and 2.21 met in summer and between 1.13 met and 1.77 met in winter.
The actual thermal sensation and comfort votes of the participants are plotted in Figure 13, combining the votes collected during the two prayers for each season. It is noted that the sensation votes in winter were comparatively skewed to the cold side of the scale, reflecting the influence of the climatic conditions. Besides, around 86% and 76% of the participants’ votes in summer and winter respectively fall into the three central categories. Considering the comfort votes, around 81% and 85% of the participants were very comfortable, comfortable, or slightly comfortable during summer and winter, respectively. It may worth mentioning that approximately 7% and 6% were neither comfortable nor uncomfortable in summer and winter, respectively.
For further analysis, a sample of the actual thermal sensation and thermal comfort votes are plotted in Figure 14. These votes were collected by a questionnaire distributed in Al-Hassan Ibn Ali mosque in August just before Friday special prayer. Considering the thermal sensation votes, the majority were within the three central categories, namely slightly cool, neutral, and slightly warm. In specific, 173 participants out of 204 were within these categories, forming a proportion of approximately 84%. Likewise, 164 of the participants were slightly comfortable, comfortable, or very comfortable. This proportion was marginally higher than 80%. It is worth mentioning that these findings differed noticeably from the predictions of the PMV, which may reflect the influence of the climatic and cultural backgrounds. Furthermore, the potential influence of the solar gain on the worshippers was explored. The participants were divided based on the proximately from the external walls. Despite this, no statistically significant association was found between the participants’ location and their thermal sensation or comfort votes. The Fisher exact test was applied with a significance level of 0.05.
Figure 15 displays the distribution of the actual comfort votes based on the actual sensation votes. For the investigated worshippers, feeling thermal neutrality was equivalent to thermal comfort, as around 93% of those who reported being thermally neutral were slightly comfortable, comfortable, or very comfortable. Besides, it was observed that sensations like (cool) and (slightly cool) were linked with thermal comfort. Indeed, 100% and 91% of participants with these sensations were slightly comfortable, comfortable, or very comfortable, respectively. Such a link is expected considering the influence of the climatic background and was reported in previous research that investigated Saudi participants [38].

4.9. Loads Breakdown

Figure 16 presents the annual loads of the investigated mosques in nine categories, namely heating, cooling, humidifying, dehumidifying, solar, lighting, occupants, equipment, and internal loads. In addition, the figure displays the monthly breakdown of the loads. It is worth mentioning that fabric gain combines the eternal opaque conduction with external transparent conduction loads. Likewise, the internal gain combines the occupant, equipment, and internal loads.
For the three investigated mosques, the cooling demands were noticeably the highest ranging between 37,562 kWh and 456,021 kWh in Al-Sheikh Ishaq Al-Hajri mosque, and Al-Hassan Ibn Ali mosque, respectively. Indeed, these demands formed around 37%, 55%, and 40% of the total energy demands in Prince Sultan, Al-Hassan Ibn Ali, and Al-Sheikh Ishaq Al-Hajri mosques, respectively. This is consistent with the patterns of the predicted mean votes (PMV). Heating demands were required in all mosques, but they were significantly lower than the cooling demands. It was, additionally, noted that the variations between the mosques’ areas and capacities were reflected in the demanded loads. In particular, the cooling demands of the Prince Sultan and Sheikh Ishaq Al-Hajri mosques formed around 13% and 6% of the cooling demands required in Al-Hassan Ibn Ali mosque that has an area that exceeds the areas of the other mosques by around 57% and 50%, respectively.
Considering the Prince Sultan mosque, the loads breakdown shows that the dominance of heat gains and that the internal loads were the main source for heat gain, with a relatively constant monthly amount exceeding 3000 kW. Heat losses mainly occurred between November and March, including both through the mosque’s fabrics besides ventilation and infiltration. The maximum losses of slightly below 3000 kW resulted in negligible heating loads compared with those of cooling. Considering the solar gains, they were responsible for 11.7% of the annual gains of the mosque with a monthly mean of around 1600 kW.
In Al-Hassan Ibn Ali mosque, the domination of heat gains was noted despite the monthly fabric losses and the winter ventilation and infiltration losses. The highest heat gain was approximately 38,000 kW in August caused by ventilation and infiltration, with a mean of around 21,000 kW during summer. The highest heat loss was roughly 32,000 kW in December caused by the same category with a mean of almost 19,000 kW during winter. Besides, the solar gain formed around 16.1% of the annual gains with a monthly mean of slightly above 11,000 kW.
Like the previous mosques, the heat gains were dominant in the Al-Sheikh Ishaq Al-Hajri mosque. The heat losses were present between October and April, including both mainly from the fabric losses and the ventilation and infiltration losses. The main source for heat gain was solar gain forming around 26.5% of the annual total loads and with a monthly mean of around 2000 kW. This may be attributed to the low occupation rate that is typically below 30%, as indicated in Table 1.
Moreover, it was noted that the solar gains of Al-Hassan Ibn Ali mosque were considerably higher than those of the other mosques. Indeed, the highest solar gain in Prince Sultan mosque and Al-Sheikh Ishaq Al-Hajri mosque were around 1850 kW and 2470 kW, respectively compared with more than 14,000 kW in Al-Hassan Ibn Ali mosque. The detailed discussion of the solar gains of the envelope elements of Al-Hassan Ibn Ali mosque revealed that the roof was the main contributor to the total solar gain. Therefore, improving the thermal performance of the mosque buildings should start from the constructional details of the roofs.

4.10. Discussion

Achieving thermal comfort passively in mosques’ buildings may not be possible in extreme climates like that of Saudi Arabia. However, any attempt to reduce the gap towards achieving thermal comfort by means of passive techniques should be considered by architects, especially under the conditions of restricting budgets allocated for public buildings. The first step in such attempts is to identify architectural elements that require a climate responsive design and careful constructional detailing. Such identification is done through evaluating the energy and thermal performance of buildings under consideration, which was carried out in the research reported in this paper. It was revealed that the roof is the major contributor to the solar gain of the investigated mosque. Indeed, the solar gain through the roof and the attic roof exceeded that of the external walls by more than 1240% and 240%, respectively. It is worth mentioning that the external walls are the second contributor to the total solar gain of the investigated mosque. Future research should explore the effect of alternative roof constructional details.
For a comprehensive appreciation of the influence of the constructional details on the energy consumption profile, it is important to evaluate the internal thermal comfort conditions of the investigated mosque. This evaluation was carried out by means of the simulation process in addition to a small-scale investigation of thermal comfort. In particular, the predicted mean votes (PMV) were obtained from the simulation, whereas both the actual thermal sensation and comfort votes were obtained from the fieldwork. The discrepancy between the predicted and actual votes can be attributed to the influence of the climatic and social background [39,40,41,42,43]. This is supported by the fact that the majority of the participants are acclimatized to the climate of Riyadh city. From another perspective, this discrepancy argues for the importance of supporting simulation studies with actual measurements whenever possible.

5. Conclusions

The energy required to cool buildings in the extreme climatic conditions of Saudi Arabia is considerably high and can reach up to 65% of the electric energy used in buildings. The applied restrictions on public buildings’ budgets are usually reflected in the poor quality of buildings’ envelope and, thus, increased consumption of active energy to achieve comfortable indoor thermal conditions. In this paper, the thermal performance of mosque buildings located in the hot arid desert climate of Riyadh city were investigated by computer modeling assessments using TAS simulation software. The predicted mean votes were evaluated, as well as the actual thermal and comfort votes. In addition, the annual loads and the loads breakdown were discussed. Further, the thermal performance of one mosque was explored in terms of solar heat gain. Predicting the mean thermal vote in the three mosques revealed uncomfortable conditions under the controlled mode, especially in summer. However, relaxing the boundaries of the comfort zone to accommodate for the climatic and cultural background influence resulted in almost eliminating the uncomfortable conditions in all mosques except Al-Hassan Ibn Ali mosque. Besides, the findings revealed the consumption of high levels of cooling energy that ranged between 37% to 55% in the investigated mosques, mainly due to the poor quality of the envelope elements. The detailed investigation of the solar gains of Al-Hassan Ibn Ali mosque indicated that the roof is the main source of heat. Accordingly, future research is recommended to explore alternative constructional details of roofs in public buildings in order to improve their thermal performance.

Author Contributions

Conceptualization, A.A.A.S.; methodology, A.A.A.S., M.B.G., A.A.B. and H.A.-K.; software, A.A.A.S. and M.B.G.; validation, A.A.A.S.; formal analysis, A.A.A.S. and H.A.-K.; funding acquisition, A.A.A.S.; investigation, A.A.A.S.; writing—original draft preparation, A.A.A.S.; writing—review and editing, M.B.G., A.A.B. and H.A.-K.; supervision, M.B.G.; project administration, A.A.A.S., A.A.B. and H.A.-K. All authors have read and agreed to the published version of the manuscript.

Funding

Funding for this research was given under award numbers RGP.2/202/42 by the deanship of Scientific Research; King Khalid University, Ministry of Education, Kingdom of Saudi Arabia.

Acknowledgments

We would like to mention our sincere gratitude to King Khalid University (KKU) for the support provided for this study. We also would like to extend my gratitude to the Ministry of Education, Ministry of Municipal and Rural Affairs (MOMRA) and to the Ministry of Islamic Affairs (MOIA) in Saudi Arabia, for giving us all data and permits that were needed for this study.

Conflicts of Interest

The authors declare no conflict of interest.

References

  1. Alajlan, S.A.; Smiai, M.S.; Elani, U.A. Effective tools toward electrical energy conservation in Saudi Arabia. Energy Convers. Manag. 1998, 39, 1337–1349. [Google Scholar] [CrossRef]
  2. OPEC. The Annual Statistical Report 2010/2011 of OPEC Share of World Crude Oil Reserves 2010. 2011. Available online: http://www.opec.org/opec_web/en/202.htm (accessed on 15 June 2012).
  3. Shohan, A.A.A. Thermal Comfort and Energy Demand of Small and Large Mosque Buildings in Saudi Arabia. Ph.D. Thesis, University of Nottingham, Nottingham, UK, 2015. [Google Scholar]
  4. Al-Howaimel, A. The Ministry of Islamic Affairs is Responsible for 94 Thousand Mosque Buildings in Saudi Arabia. Alriyadh News Paper, 1 January 2013. [Google Scholar]
  5. Alsaeah, T. Energy consumption in Mosques in Saudi Arabia. Aleqtsadia, 14 September 2013. [Google Scholar]
  6. Alhemiddi, N.A. Strategies to Reduce the Electricity Energy Consumption in Mosque Buildings: An Analysis Study for Riyadh Mosque Buildings and Arrahmaniyah Mosque in Sakaka City in Saudi Arabia. King Saud Univ. J. 2003. Available online: http://faculty.ksu.edu.sa/3702/Documents/RESH/Res-90-1.pdf (accessed on 15 March 2017).
  7. Ibrahim, S.; Baharun, A.; Nawi, M.; Junaidi, E. Assessment of thermal comfort in the mosque in Sarawak, Malaysia. Int. J. Energy Environ. 2014, 5, 327–334. [Google Scholar]
  8. Kassim, N.; Abdullah, N.; Taib, Z.B.M. Decoration in Praying Hall of Mosque: A Review of Current Literature. Proc. Soc. Behav. Sci. 2014, 153, 55–60. [Google Scholar] [CrossRef] [Green Version]
  9. Budaiwi, I.; Abdou, A. HVAC system operational strategies for reduced energy consumption in buildings with intermittent occupancy: The case of mosques. Energy Convers. Manag. 2013, 73, 37–50. [Google Scholar] [CrossRef]
  10. Al-ajmi, F.F. Thermal comfort in air-conditioned mosques in the dry desert climate. Build. Environ. 2010, 45, 2407–2413. [Google Scholar] [CrossRef]
  11. Al-Homoud, M.S.; Abdou, A.A.; Budaiwi, I.M. Assessment of monitored energy use and thermal comfort conditions in mosques in hot-humid climates. Energy Build. 2009, 41, 607–614. [Google Scholar] [CrossRef]
  12. Othman, R.; Inangda, N.; Ahmed, Y. A Typological Study of Mosque Internal Spatial Arrangement—A Case Study on Malaysian Mosques. J. Des. Built Environ. 2008, 4, 41–54. [Google Scholar]
  13. Abdou, A.A. Measurement of acoustical characteristics of mosques in Saudi Arabia. J. Acoust. Soc. Am. 2003, 113, 1505–1517. [Google Scholar] [CrossRef] [PubMed]
  14. Aba-Alkhail, A. The mosque and people. Albenaa 1979, 1, 70–78. [Google Scholar]
  15. Al-Anzi, A.; Al-Shammeri, B. Energy saving opportunities using building energy simulation for a typical mosque in Kuwait. In Proceedings of the ASME-2010 4th International Conference on Energy Sustainability, Phoenix, AZ, USA, 17–22 May 2010; pp. 17–22. [Google Scholar]
  16. Alabdullatief, A.; Omer, S.; Zein-Elabdein, R.; Alfraidi, S. Green roof and louvers shading for sustainable mosque buildings in Riyadh, Saudi Arabia. In Proceedings of the First International Conference on Mosques Architecture, Imam Abdulrahman Bin Faisal University, Dammam, Saudi Arabia, 5–7 December 2016; pp. 5–7. [Google Scholar]
  17. Alabdullatief, A.; Omer, S.A. Sustainable techniques for thermal comfort in buildings designed used by worshipers: A case of roof options for mosque buildings in hot arid climate. In Proceedings of the 16th International Conference on Sustainable Energy Technologies, Bologna, Italy, 17–20 July 2017. [Google Scholar]
  18. Samiuddin, S.; Budaiwi, I.M. Assessment of thermal comfort in high-occupancy spaces with relevance to air distribution schemes: A case study of mosques. Build. Serv. Eng. Res. Technol. 2018, 39, 572–589. [Google Scholar] [CrossRef]
  19. Sanuzi, A.N.Z.; Abdullal, F.; Azmin, A.K.; Kassim, M.H. Passive Design Strategies of Colonial Mosques in Malaysia. In Green Buildings and Renewable Energy. Innovative Renewable Energy; Sayigh, A., Ed.; Springer: Cham, Switzerland, 2020. [Google Scholar]
  20. Shohan, A.A.A.; Gadi, M.B. Evaluation of thermal and energy performance in Mosque buildings for current situation (simulation study) in mountainous climate of Abha city. Sustainability 2020, 12, 4014. [Google Scholar] [CrossRef]
  21. Al-Bakri, U.A.U. Natural Ventilation in Traditional Courtyard Houses in the Central Region of Saudi Arabia. Ph.D. Thesis, University of Wales, Cardiff, UK, 1997. [Google Scholar]
  22. Al-Shareef, F.M. Natural Light Control in Hadjazi Architecture: An Investigation of the Rowshan Performance by Computer Simulation. Ph.D. Thesis, University of Liverpool, Liverpool, UK, 1996. [Google Scholar]
  23. Al-Hagbani, A.A. Physical and Economic Factors and Their Effects on Development of Solar Energy in Saudi Arabia. Ph.D. Thesis, University of Glasgow, Glasgow, UK, 1993. [Google Scholar]
  24. Weather_Underground. Abha International Airport Weather Station-Abha. 2020. Available online: https://www.wunderground.com/weather/OEAB (accessed on 28 April 2012).
  25. Almasoud, A.H.; Gandayh, H.M. Future of solar energy in Saudi Arabia. J. King Saud Univ. Eng. Sci. 2015, 27, 153–157. [Google Scholar] [CrossRef] [Green Version]
  26. Groat, L.; Wang, D. Architectural Research Methods, 2nd ed.; John Wiely & Sons, Inc.: Hoboken, NJ, USA, 2013. [Google Scholar]
  27. Saleh, S.Y.H. Evaluation and Enhancement of Environmental Performance of Refugee Shelters in Palestine. Ph.D. Thesis, University of Nottingham, Nottingham, UK, 2011. [Google Scholar]
  28. Crawley, D.B.; Hand, J.W.; Kummert, M.; Griffith, B.T. Contrasting the capabilities of building energy performance simulation programs. Build. Environ. 2008, 43, 661–673. [Google Scholar] [CrossRef] [Green Version]
  29. Ahmed, Q.; Szokolay, S. Thermal Design tools in Australia: A comparative study of TEMPER, CHEETAH, ARCHIPAK and QUICK. In Proceedings of the Building Simulation ’99, IBPSA, Adelaide, Australia, 16–18 August 1993; pp. 351–357. [Google Scholar]
  30. Clipson, C. Simulation for Planning and Design: A Review of Strategy and Technique. In Environmental Simulation: Research and Policy Issue; Marans, R.W., Stokols, D., Eds.; Springer: Boston, MA, USA, 1993; pp. 23–57. [Google Scholar]
  31. CIBSE. Environmental Design CIBSE Guide A, 8th ed.; CIBSE (The Chartered Institution of Building Services Engineers): London, UK, 2015. [Google Scholar]
  32. Clarke, J.A. Energy Simulation in Building Design, 2nd ed.; Routledge: London, UK, 2001. [Google Scholar]
  33. Hyde, R. Climate Responsive Design: A Study of Buildings in Moderate and Hot Humid Climates; E & FN Spon: Oxon, UK, 2000. [Google Scholar]
  34. ASHRAE. 2017 ASHRAE Handbook Fundamentals; ASHRAE (American Society of Heating, Refrigerating and Air-Conditioning Engineers): Atlanta, GA, USA, 2017. [Google Scholar]
  35. SBC. The Saudi Building Code (SBC): Guide 201—Architectural; SBC: Riyadh, Saudi Arabia, 2007.
  36. SBC. The Saudi Building Code (SBC): Guide 601—Energy Conservation; SBC: Riyadh, Saudi Arabia, 2007.
  37. EDSL. Thermal Analysis Software (TAS); EDSL Company: New York, NY, USA, 2014. [Google Scholar]
  38. Al-Khatri, H.; Alwetaishi, M.; Gadi, M.B. Exploring thermal comfort experience and adaptive opportunities of female and male high school students. J. Build. Eng. 2020, 31, 101365. [Google Scholar] [CrossRef]
  39. Singh, M.K.; Mahapatra, S.; Atreya, S.K. Adaptive thermal comfort model for different climatic zones of North-East India. Appl. Energy 2011, 88, 2420–2428. [Google Scholar] [CrossRef]
  40. Hwang, R.-L.; Lin, T.-P.; Chen, C.-P.; Kuo, N.-J. Investigating the adaptive model of thermal comfort for naturally ventilated school buildings in Taiwan. Int. J. Biometeorol. 2009, 53, 189–200. [Google Scholar] [CrossRef] [PubMed]
  41. Pitts, A. The language and semantics of thermal comfort. In Proceedings of the 4th Windsor Conference: Comfort and Energy Use in Buildings—Getting Them Right, Windsor, UK, 27–30 April 2006; pp. 1–7. [Google Scholar]
  42. Chappells, H.; Shove, E. Debating the future of comfort: Environmental sustainability, energy consumption and the indoor environment. Build. Res. Inf. 2005, 33, 32–40. [Google Scholar] [CrossRef]
  43. Humphreys, M.A. Field studies of thermal comfort compared and applied. J. Inst. Heat. Vent. Eng. 1976, 44, 5–27. [Google Scholar]
Figure 1. Architectural design elements of a typical mosque building [Reproduced from [13]].
Sustainability 13 03332 g001
Figure 2. Average precipitation.
Sustainability 13 03332 g002
Figure 3. Global irradiation levels in Riyadh.
Sustainability 13 03332 g003
Figure 4. Constructional details of Al-Hassan Ibn Ali mosque: (a) roof details, (b) External walls details, (c) doors details, and (d) windows details.
Sustainability 13 03332 g004aSustainability 13 03332 g004b
Figure 5. Solar gain of the roof on: (a) 22 June and (b) 22 December.
Sustainability 13 03332 g005
Figure 6. Solar gain of windows on: (a) 22 June (without curtains), (b) 22 June (with curtains), (c) 22 December (without curtains), and (d) 22 December (with curtains).
Sustainability 13 03332 g006aSustainability 13 03332 g006b
Figure 7. Aerial view of Al-Hassan Ibn Ali Mosque.
Sustainability 13 03332 g007
Figure 8. Solar gain of doors’ and doors windows’: (a) frames on 22 June, (b) panes on 22 June, (c) frames on 22 December, and (d) panes on 22 December.
Sustainability 13 03332 g008aSustainability 13 03332 g008b
Figure 9. Solar gain of the external walls on: (a) 22 June and (b) 22 December.
Sustainability 13 03332 g009aSustainability 13 03332 g009b
Figure 10. Solar gain of the attic walls on: (a) 22 June and (b) 22 December.
Sustainability 13 03332 g010
Figure 11. Solar gain of the attic windows’: (a) frames on 22 June, (b) panes on 22 June, (c) frames on 22 December, and (d) panes on 22 December.
Sustainability 13 03332 g011aSustainability 13 03332 g011b
Figure 12. Hourly PMV in: (a) Prince Sultan mosque (Controlled), (b) Prince Sultan mosque (free-running), (c) Al-Hassan Ibn Ali mosque (Controlled), (d) Al-Hassan Ibn Ali mosque (free-running), (e) Al-Sheikh Ishaq Al-Hajri mosque (Controlled), and (f) Al-Sheikh Ishaq Al-Hajri mosque (free-running).
Sustainability 13 03332 g012aSustainability 13 03332 g012b
Figure 13. Participants’ actual thermal votes of: (a) sensation and (b) comfort (labels are number of participants).
Sustainability 13 03332 g013
Figure 14. Actual thermal votes in Al-Hassan Ibn Ali mosque during summer: (a) Thermal Sensation Votes (TSV), n = 204, and (b) Thermal Comfort Votes (TCV), n = 204. (Labels are participants’ numbers).
Sustainability 13 03332 g014
Figure 15. Distribution of actual comfort votes based on actual sensation votes.
Sustainability 13 03332 g015
Figure 16. Annual total demands (ATD) and estimated loads breakdown (ELB) in (a) Prince Sultan mosque (ATD), (b) Prince Sultan mosque (ELB), (c) Al-Hassan Ibn Ali mosque (ATD), (d) Al-Hassan Ibn Ali mosque (ELB), (e) Al-Sheikh Ishaq Al-Hajri mosque (ATD), and (f) Al-Sheikh Ishaq Al-Hajri (ELB).
Sustainability 13 03332 g016
Table 1. Details for the selected case studies of mosque buildings in the selected city of Riyadh.
Mosque NameMosque ImageDistrictType of MosqueCapacity (People)Area (m2)
MaximumTypical
Prince Sultan Sustainability 13 03332 i001Al-MoroojRegular for five daily prayers515250480
(30 × 16)
Al-Hassan Ibn Ali Sustainability 13 03332 i002Al-MansuraJuma’ah or Friday prayer + Regular 107510751110
(40.8 × 27.2)
Al-Sheikh Ishaq Al-Hajri Sustainability 13 03332 i003Al-Kharj ResidenceRegular for five daily prayers630175550
(22.8 × 24.12)
Table 2. Details of opaque constructions and the component materials for the selected mosque building.
Envelope TypeDescription of MaterialsThickness (cm)Conductivity (W/m. °C)Specific Heat (J/kg. oC)Density (kg/m3).Solar ReflectanceEmissivity
ExternalInternalExternalInternal
RoofTerrazzo tiles2.51.7585024000.350.350.900.90
Cement mortar2.50.94100017500.3003.00.900.90
Gradient foamed lightweight (L.W.) concrete of Portland cement 500 kg/m5–70.5383712810.350.350.900.90
Cement plaster30.4283712000.600.600.900.90
Bitumen polyester 180/m2 for waterproofing0.40.50100017000.260.260.910.91
Heavyweight concrete 0.8 m3, 0.4 m3 sands, and 250 kg/m3 Portland cement301.9592122430.350.350.900.90
Cement plaster 1.50.4283712000.600.600.900.90
Internal cement render1.50.5076913000.600.600.900.90
Internal paint layer0.2999.90.0010.0010.640.640.920.92
External wallInternal paint layer0.2999.90.0010.0010.640.640.920.92
Internal cement render1.50.5076913000.600.600.900.90
Cement plaster 1.50.4283712000.600.600.900.90
L.W. hollow concrete block 200.508804650.350.350.900.90
Cement plaster 1.50.4283712000.600.600.900.90
External cement render1.50.57100013000.300.300.900.90
External paint layer0.2999.90.0010.0010.640.640.920.92
Door & WindowSteel and paint0.24350078000.470.470.250.25
or 1.5 mm of Wood50.1516336090.400.400.900.90
Aluminum for a window frame1020489627000.500.500.220.22
Table 3. Details of transparent materials and the component materials for the selected mosque building.
Material TypeTransparent Window (Window Glass)Transparent Window (Light Blind)Transparent Window (Dark Curtain)
Conductivity, [W/m°C]1.731.001.00
Solar reflectanceExternal0.100.50038
Internal0.100.500.38
Solar transmittance0.690.400.11
Light transmittanceExternal0.080.500.38
Internal0.080.500.38
Light reflectance0.890.400.11
EmissivityExternal0.840.850.85
Internal0.840.850.85
Table 4. The used sensors in the physical measurements of the thermal comfort investigation.
VariableSensorAccuracy
Surface temperatureInfrared Thermometer DT-8862 Sustainability 13 03332 i004±2.5 °C (−50 °C to +20 °C)
±1.0% of reading (+20 °C to 300 °C)
±1.5% of reading (+300 °C to 650 °C)
Globe temperatureWBGT Meter Sustainability 13 03332 i005±3% RH
±1.8 °F/1.0 °C
±4 °F/2 °C
Air speedCEM AAVM-8880 CAL Kit–Hot Wire USB Logging Anemometer Sustainability 13 03332 i006±5%
Air temperature and relative humidityCEM USB Temperature and Humidity Datalogger-DT-172 Sustainability 13 03332 i007±2% RH, ±1 °C
Solar radiationMP-100 Pyranometer Solar Radiation Shortwave Sustainability 13 03332 i008±5%
Table 5. Pearson’s correlation coefficients of measured and simulated parameters.
Indoor Air TemperatureOutdoor Air TemperatureIndoor Relative HumidityOutdoor Relative Humidity
Summer0.3710.9850.3730.911
Winter−0.4970.851−0.1050.960
Publisher’s Note: MDPI stays neutral with regard to jurisdictional claims in published maps and institutional affiliations.

