
Development of an Innovative ICT Infrastructure for an Eco-Cost System with Life Cycle Assessment


Advanced Design and Manufacturing Engineering Centre (ADMEC), School of Architecture, Design and the Built Environment, Nottingham Trent University, Nottingham NG1 4FQ, UK
*
Author to whom correspondence should be addressed.
Sustainability 2021, 13(6), 3118; https://doi.org/10.3390/su13063118
Submission received: 30 January 2021
/
Revised: 4 March 2021
/
Accepted: 5 March 2021
/
Published: 12 March 2021
(This article belongs to the Special Issue Circular Economy Evaluation: Towards a Transparent and Traceable Approach under a Life Cycle Perspective)
Abstract
:A novel Internet-based information communication technology (ICT) infrastructure for an eco-accounting system was successfully developed to deliver “EcoCosts”, which are the values of environmental impact throughout the product life cycle. The ICT infrastructure manages its internal elements and interacts with operation modules in the supply chain via Web-based service interfaces. The infrastructure consists of upperware, middleware, and resource layers. The upperware layer manipulates the middleware elements (cloud-based load balancing, life cycle assessment, Web-based services, and Radio Frequency Identification (RFID)-enabled mobile access), and manages the associated resources within the eco-accounting system. As novel features of the ICT infrastructure, load balancing is used to handle large numbers of data and to allocate the computing load across the eco-accounting network nodes, and life cycle assessment is conducted to analyse product footprints, which are the core of “EcoCost”, to facilitate consumers in comparing the environmental impacts between different products. A case study was conducted by transmitting product EcoCosts from businesses to consumers through the Internet, successfully verifying the system developed in this research. Because this research aims to pay more attention to the ICT aspects, the EcoCost is represented using a single value, hence simplifying the related calculation. This research provides a novel solution for dealing with the large numbers of data and computing loads required to manage EcoCost data throughout the product life cycle and to transmit EcoCosts from businesses to consumers.
1. Introduction
An ecological accounting system was developed in this research that measures products’ ecological cost, referred to as “EcoCost” for short, throughout the product supply chain, as shown in Figure 1.
Attempts have previously been made to calculate the EcoCost. For example, in the myEcoCost project, the EcoCost values were represented by two individual indicators: carbon footprints and material footprints [1,2]. Because the ecological impact is affected by multiple factors, more indicators need to be considered. In a recent development, the EcoCost was represented using a single value—Eco-point, an aggregated value of three indicators (human health, ecosystems, and resources) [3]—which is more comprehensive than myEcoCost; however, its implementation for efficient online transmission has not been resolved.
Figure 1.
Information flow of an ecological accounting system [4].
Figure 1.
Information flow of an ecological accounting system [4].

This research aims to apply information and communication technology (ICT) to measure and assess the ecological impact of products. The research uses a single value, rather than multiple values, to present the EcoCost of products. The use of a single EcoCost value facilitates the comparison of ecological impacts among products and lends itself to applications in different fields, such as sustainable consumption and recycling.
The EcoCost can be calculated using a life cycle impact assessment (LCIA) method with relevant LCIA software tools [5]. There are various LCIA methods and tools, such as the 15 LCIA methods listed in [4,6] and 10 popular LCIA software/tools reviewed in [7]. In general, these tools are installed on the user’s personal computer and then complete the assessment locally. Studies have been conducted focusing on midpoint and endpoint characterizations when choosing LCIA methods, such as [8]. Both midpoint and endpoint methodologies provide useful information for the users, and their applications depend on the particular situation of individual studies. Midpoint methods may be preferable for specific communication purposes, such as being politically preferable for speaking in terms of global warming potentials rather than in terms of DALYs [8], while endpoint methods may be most valuable in those cases where aggregation and understandable results are required [8].
With the widespread application of the Internet, online LCIA is in high demand for the calculation of EcoCost. Nowadays, more and more designers and manufacturers, who are geographically dispersed in different locations, conduct collaborative product development tasks over the Internet. However, only a small number of LCIA software packages can be used to assess ecological impact online, due to the limited functions and usability of the software [2]. The life cycle assessment (LCA) Calculator [9] was developed to help designers and engineers to understand, analyse, and compare the environmental impacts of their products in order to make “greener” design decisions; however, the environmental impact was assessed simply on the basis of carbon footprints only, which is not comprehensive enough, because environmental impact should be assessed on the basis of multiple indicators. Although the LCA Calculator can be used online and has no software to download or install, it is only applied for limited data processing and LCIA analysis [10]. Due to the lack of sufficient ICT capabilities/functions (such as Web-based services, load balancing, and cloud), the LCA Calculator is unable to transmit environmental impact values among the operation modules through the supply chain [10]. COMPASS is a Web-based streamlined LCIA software package; however, it does not provide real online support because it cannot effectively deal with the information flow generated by a large number of ecological impact values in the eco-accounting system [11]. GaBi is a professional LCIA tool to collect, analyse, and monitor the sustainability performance data of the company’s products and services, but it can only be downloaded for use (offline) [12]. SimaPro is one of the most widely used LCIA software tools, and it provides an Internet-based programming interface COM [13]. With the COM interface, users need to create their own interfaces to utilise the computing functions of SimaPro and build a Web server enabling SimaPro to be accessed over the Internet. Because considerable IT-related expertise is required, it is difficult for users to operate [14]. Moreover, the COM-based version of SimaPro is very expensive and is not suitable for common users. Another widely used LCIA software is openLCA; however, it does not provide an online function [14,15]. In addition, Sustainable Minds has been developed to help designers and researchers to achieve simple LCIA online calculation [16]; however, due to its limited functions (e.g., the database cannot be modified and the results are not detailed enough for further analysis), it cannot be used to complete complex assessment tasks online. Sustainable Minds utilises a single score (called Okala point) to represent the ecological impact of the product, which is designed for the user who is not an LCIA specialist [16].
Due to the lack of sufficient ICT support, the existing LCIA software has the following shortcomings: (1) Currently, there is no LCIA software available that can transmit online the ecological impact values from one operation module to another one over the supply chain, as shown in Figure 1. There are increasing demands for enterprises, especially small and medium-sized enterprises, to participate in the supply chain to upload the EcoCosts of sub-products (processes) and then transmit the EcoCosts of the (final) product to end-users. (2) The existing LCIA software cannot effectively handle the automated information flow within the ecological accounting system, and hence, it is difficult to process a large number of EcoCost values to transfer them to businesses (suppliers) and end-users.
To overcome the above problems, an innovative ICT infrastructure for the eco-accounting system has been developed and is presented in this paper, which utilises Cloud-based load balancing, product life-cycle assessment, Web-based services, and Radio Frequency Identification (RFID) communication techniques. The new ICT infrastructure has the following features: (1) Load balancing is developed to resolve the problems of transmitting a large volume of EcoCost data over the Internet, especially the problem of real-time data exchange between the operation modules (such as businesses). (2) Life cycle assessment has been conducted using a common LCIA tool and a friendly online interactive interface to calculate the EcoCost and provide it to the operation module as the basis of product assessment. (3) RFID, which is embedded in the product (especially electronic products), facilitates the comparison of environmental impacts between different products and helps consumers seek suitable products (not just on financial cost but also EcoCost).
To help end users understand the LCIA results, it would be helpful for the infrastructure to incorporate a certain level of benchmarking to provide a reference to the quality of the lifecycle impact of a given product. This would involve a large amount of LCA calculations in order to measure and benchmark the environmental impact on a category of products. Since this research focuses on the ICT aspect of the eco-accounting system, benchmarking is not included in this paper. However, in the CIRC4Life project supported by the EU H2020 circular economy program [17], the authors researched this matter [18] by conducting an LCIA of a group of domestic lighting products, and based on the LCIA results, all the products shown in the online shop are assigned EcoCost values [19]. With the EcoCost values, the end-users are allowed to assess the environmental quality of products and to make their decision to select more sustainable products. In this research, the ICT-based communication infrastructure is established as an open-source platform to manage the interoperability among the operation modules. There are a considerable number of EcoCost values to be transmitted every day, which is a challenge so far. The communication infrastructure developed by this research is able to be expanded to cope with more complicated and considerable EcoCost values generated from the operation modules. Illustrating it with a case study, the research calculates the EcoCost values through the product’s lifecycle and transmits them from the business to the customer over the Internet, which overcomes the challenge.
In this paper, the overview of the information communication infrastructure is presented, followed by the technologies applied and the case study of implementing the technologies and methods, which have successfully validated the developed system.
2. Overview
Figure 2 presents an overview of the information communication infrastructure, which is developed to receive and send the EcoCost values automatically by gathering the product’s EcoCosts from businesses and transmitting the EcoCosts of products sold to consumers. The communication infrastructure controls all the modules within the EcoCost accounting system, consisting of upperware, middleware, resource layer and related interfaces for the interaction with operation modules. The upperware layer manages the middleware (load balancing, life cycle assessment, Web-based services, and RFID-enabled mobile access), and associated resources within the EcoCost accounting system and meanwhile communicates with the operation modules (business users and end-consumers) that are running on the supply chain. The infrastructure with the above components and functions is presented in the following subsections.
2.1. Upperware
The upperware is developed as the top layer of the information communication infrastructure (see Figure 2), which controls the middleware formed by four intermediate modules, namely load balancing, life cycle assessment, Web-based services, and RFID-based mobile access network. Through the Internet-based application programming interfaces, the upperware controls the operation modules, i.e., business users and consumers. The upperware provides the functions of controlling and coordinating mechanisms and communication with the middleware and resource layer, such as database, mobile network, and relevant interfaces.
2.2. Middleware
There are four elements (functional modules) in the middleware, which are integrated with the upperware via internal interfaces. To ensure that those elements are effectively connected to the upperware, graphic user interfaces (GUIs) were developed, allowing for configuring and managing the modules within the middleware in a graphic mode. The GUIs were adapted to the functional modules, allowing for the manager who works at the infrastructure to control and track the operation status of each module in real time.
The middleware provides the following functions: assessment of environmental impacts throughout product’s life cycle, Web-based services for interacting with operation modules, managing the workload of handling EcoCost data to different computers, optimisation of the flow of EcoCost data within the infrastructure to facilitate efficient data exchange between functional modules, mobile authentication for consumers to access EcoCost data, and operation of interfaces and relevant resources.
2.3. Interaction with Operation Modules
Within the operation modules, there are a variety of formats and forms of input and output data and related functional requirements. Therefore, the specification and requirement are created for each operation module, and the user interfaces are developed according to the specific functional requirements of the operation module. The business user is to work on an operation module in the supply chain and assess the product life cycle and then send the generated EcoCost data to the ICT infrastructure; finally, consumers are able to obtain the EcoCost data from the infrastructure via the interfaces developed, as shown in Figure 3.
3. Development of the ICT Infrastructure with Product’s Sustainability Assessment
The major technologies utilised in the communication infrastructure contains load balancing for Cloud network, life cycle assessment (LCA) of products, RFID-based mobile access, and Web-based services for communicating with operation modules over the supply chain, which are illustrated in the following sub-sections.
3.1. Load Balancing for Handling Data Flow within the EcoCost Environment
Load balancing is a distributed computing approach that is usually used in cloud computing. Since the spectrum of cloud computing is much too broad, it is vital to optimise the dataflow and balance the computer usage of each node in the network to reduce the overall load of the network [20]. In this research, there are many EcoCost data of products to be dealt with, which will generate considerable computing loads. Hence, load balancing is applied to allocate the load to multiple computers located in the network nodes, so as to optimise the data flow within the EcoCost environment [2]. In doing so, a load balancing module is developed to execute the automated flow of EcoCost data in order to meet the needs of businesses and consumers for large data processing.
3.1.1. Structure of Load Balancing Module
A typical load balancing module consists of a load balancer computer and several load workers computers [4]. As the core of the load balancing module, the load balancer is responsible for managing the load distribution and controlling the load workers. By monitoring the computer usage of load workers, the load balancer distributes the load to a load worker that has low computer usage. The computer usage to be monitored includes the computer’s utility, such as CPU (central processing unit) and memory, and the amount of loads being processed [4].
In order to develop the above module, this research creates a network formed by four computers, including a Web server, application servers, and database servers. The Web server acts as a “load balancer” to distribute the load (such as a request/task sent by the operation module in the supply chain) to the application server with the lowest usage; while the application server works as a “load worker” to receive the load and perform the specified task. According to the data distribution mechanism of load balancing, the Web server does not handle a task, but allocates it to the application servers for further processing. The application server instructs the database server to complete the allocated task, e.g., EcoCost information querying, and then transfer the obtained information to the Web server. Figure 3 presents the structure of the load balancing module implemented by this research.
The load balancing module is constructed based on the following criteria:
- Within this module, each server (i.e., Web server, application servers, and database servers) occupies a single computer. Therefore, the Web server is deployed on one computer and interacts with the application servers deployed on other computers, respectively.
- The Web server acts as a load balancer, which monitors the usage of application servers in real time and distributes the load to the application server with the lowest usage. The Web server does not execute specific requests received from operation modules (such as business or consumer); instead, these requests are passed to the application servers (load workers) for further processing, as shown in Figure 3.
- The application servers execute the specific tasks via interaction with the database server and processing the result to the Web server and then send it to the operation module.
- The application servers are installed with an identical computer operating system and relevant application software. Therefore, the application servers provide identical functions and services.
- To ensure data security, the database server is located at the bottom of the ICT infrastructure, away from the Web server that exposes the interface to the public. The database server is unable to interact with the Web server bypassing the application servers, which greatly reduces the risk of direct data access by external servers (such as hacker computers) [21].
3.1.2. Load Distribution via Computer Usage Monitoring
To distribute the load to the lowest usage application server, the following computer hardware information (i.e., resource usage of each server computer) is monitored:
- (a)
- The usage of CPU and memory of the computer. To obtain accurate measurement results, the CPU usage is continuously tracked and logged according to the specified time-length (for instance, one hundred CPU records per second). The root-mean-square algorithm (RMS) is applied to eliminate the interference generated by the application software working in the operation system, as shown in Figure 4.
- (b)
- Load progressing, which is related to the user request that the computer is processing (such as data querying and messaging), with the following parameters:
- Amount of loads, which determine how many loads are processed on the computer.
- Type of load, which could be a request to send new EcoCost data or read the existed data, to evaluate the load strength.
Through measuring the hardware information, the utility of each application server is obtained. When several operation modules upload product ecological data at the same time, they will access the Web server, which will generate massive calculation loads. Therefore, the Web server must have the ability to track each application server and distribute loads in real time to the “optimal” application server (lower utilisation). The implication for the lower utilisation is that the idle rate of the application server is high, and the running tasks are less than other application servers. Figure 5 presents the usage of an application server, which is obtained and displayed on the Web server GUI developed.
The summary of the implementation of enabling load distribution is shown as follows:
- A business user or a consumer, which is located within an operation module, initialises a request for sending/acquiring EcoCost through the Web server.
- The Web server collects the hardware information from the application servers, utilising the controller of network nodes implemented by the network-published node engine (NNE).
- Based on the hardware information collected, the Web server determines an optimal application server, which has the lowest utilisation rate.
- The Web server distributes the load (i.e., user request to be executed) to the dedicated application server. Differently from the traditional round-robin method [5], the load is distributed to the computer with the lowest utilisation rate rather than the one in a random or sequential manner, which is a significant application of load distribution.
- The application server parses the request and then communicates with the database server to perform the EcoCost data queries.
- The application server passes the EcoCost data to the Web server.
- The Web server transmits EcoCost data or completion receipt to the operation module online.
3.2. Life Cycle Assessment (LCA) and Data Management
Life cycle assessment is conducted to perform the assessment of the environmental impact of products, utilising the openLCA, which is a professional LCA software developed by GreenDelta [22]. The input data for the LCA are collected from the Ecoinvent database, which is used as the data source of life cycle inventory (see Figure 6). The Ecoinvent database covers thousands of products, and each product consists of several processes through the product’s life cycle [6,23]. The results of the impact assessment are presented in the following stages: material, manufacturing, and distribution.
In order to make it convenient to compare the sustainability amongst different products, in this research, the EcoCost is represented with a single value only. According to the input data, LCA is implemented to obtain the EcoCost of products, which will be used as the new data source of life cycle inventory and placed in the database for the EcoCost environment. The criteria applied in LCA takes the daily consumption of an average European as a reference.
The ReCiPe Hierarchist [24] method was selected for the LCA because it has the following major advantages. First, it is one of the most recent and harmonized LCIA approaches available [25]. The method combines LCA results into a single score via weighting, which allows the user to easily compare the environmental impact of different products or scenarios. In addition, Hierarchist is referenced in the ISO standards on LCA to address “consensus model, and often encountered in scientific models”, which is recommended as the default model by ReCiPe [25]. Unlike other methods (such as Eco-Indicator 99, EPS Method, LIME, and Impact 2002+), ReCiPe does not include the potential impact from future extractions in the impact assessment but assumes such impacts have been included in the inventory analysis [24].
EcoCost calculation is conducted based on the ReCiPe endpoint impact categories, which represent three endpoint impact categories, namely ecosystems, resources, and human health. Both midpoint and endpoint methodologies provide useful information to the decision-maker [8], while endpoint characterization is utilised to reflect “direct relevance to society’s understanding of the final effect” [8]. By applying normalisation and weighting methods, i.e., “World ReCiPe H/A (person/year)”, the three endpoint scores are aggregated as the overall environmental impact score of a function unit, and, hence, a single value is obtained, which is the product’s EcoCost (see Figure 7).
To understand the results, it would be ideal for the platform to incorporate some level of benchmarking, providing a reference to the quality of the Life Cycle Impact of a given product. However, such environmental impact benchmarking, especially for a specific category of products, is based on a large number of LCA calculations, where the functional unit and the assessment method applied to the LCA are the same in the product assessed. This research focuses on the information communication infrastructure for the ecological accounting system to deliver the EcoCosts, so the benchmarking issue is not covered in this paper, but it will be conducted in the future work of the research by utilising the approach developed by the CIRC4Life project supported by the EU H2020 circular economy program [17].
To manage those data in an effective way, the meta-database structure is established using the PostgreSQL database management system, which is shown in Figure 8. The meta-database model contains massive data search and database modelling and generates descriptive meta-data enabling the exploration of related informative data, with major consideration of managing digital resources, legacy data integration, and electronic identification [26].
3.3. Web-Based Services
The information communication (IC) infrastructure developed by this research provides various Web-based services, such as EcoCost service, Life-cycle inventory service, Registration service for consumer and business, and so on. As a core module of information communication infrastructure, the EcoCost service is created to transmit the EcoCosts of products over the Internet from an operation module to another, for example, from a supplier to a consumer.
Figure 9 presents the workflow of the EcoCost service, where a business user/actor delivers EcoCost values via the ICT infrastructure. First, a business user creates a connection to the Web server by submitting “Send” requests and invoking the application programming interfaces (APIs) that are exposed by the Web server. Second, the Web server transfers the requests to the application server. The requests are to be completed by an optimal application server, including the transmission of EcoCost values to be sent to another business user over the supply chain, as well as an indicator (a “session” ID) by which the business user is able to continue to interact with the Web server. Then, the application server deals with the requests by storing EcoCost values at the proper location in the database. As soon as the requests are processed, the Web server will send a “Success” message that confirms that the task is completed.
The communication standard used in the EcoCost service is representational state transfer (REST). On the client side, when a business user or a consumer triggers a remote method, which is exposed as REST by the Web server, REST messages are sent to the Web server based on Extensible Mark-up Language (XML), to establish the remote connection between the user and the Web server [1].
The server side and client side (business user) are programmed in different computing languages and on different computer platforms. Because REST provides a wide range of interfaces for multi-language interaction, the programs developed in the server side and client side can run across different languages and operate at various platforms, such as Windows and Mac. The major protocol used in REST is the Hypertext Transfer Protocol (HTTP), which enables the execution of service requests and response results through a well-known computer protocol. In addition, Secure Socket Layer (SSL) is to be implemented in the full functioning platform by creating a secure connection between the server side and the client side.
3.4. Radio Frequency Identification (RFID)
RFID is the specific application and development of Automatic Equipment Identification (AEI) [27]. It uses wireless radio frequency to conduct contactless and bidirectional communication so that it can achieve the goal of identification and data exchange and realize the automatic recognition and management for different kinds of products in different situations (moving, static, or harsh environments) [28]. In this research, RFID technology is utilised to achieve the following functions:
- The RFID tag is embedded in the product, which includes the Serial number (SN) of the product. Each serial number is associated with a product record in the database. By searching the serial number from the database, the product information can be obtained and sent to the consumer.
- In addition, RFID provides a means to verify the consumer’s identity when they access the eco-accounting system. Unlike the conversational identification methods (such as user name and password), RFID simplifies the authentication process of consumers and provides convenience for consumer operations, because the confidential information is not required to input.
Figure 10 presents the mechanism of data transmission between an RFID tag and an RFID reader. Within this system, the software has been developed for an RFID reader to acquire the data of products or customers.
4. Case Study
The ICT-based network and communication infrastructure has been successfully developed in this research, which calculates and delivers the EcoCosts of products from a business to a customer via the Internet. In this case, a computer mouse (Figure 10) is a new product, which is sold to consumers as a demonstration. EcoCost values of the computer mouse are calculated using life cycle assessment (LCA); In doing so, the relevant LCA method, i.e., ReCiPe, is utilised for evaluating product’s environmental impact and calculating EcoCosts.
The EcoCosts generated are transmitted online to the load-balancing based network, which further processes the data to pass the EcoCosts and related information to the customer. The advantage of load balancing lies in that multiple computers distributed on network nodes can process a large number of information data at the same time, which efficiently optimises the data flow sent through multiple businesses and ensures the response to consumer requests.
Figure 11 shows the computer mouse product with an embedded RFID-enabled tag containing the product’s serial number. With the support of RFID technology, consumers acquire the EcoCosts via matching the product’s serial number with the product datasets from the Web server.
Within this case study, the following three steps were implemented to demonstrate and validate the delivery of the EcoCost:
- Step 1: EcoCost calculation with life-cycle assessment
The EcoCost represents the aggregation of environmental impacts of every process in the product’s life cycle. This case dealt with a process of the product selected only, but the method is equally applicable to every process of the product as well as other products. Ref. 6681 [29], for example, is one of processes producing the product. Within the Eco-Invent database [29], one of the world’s leading life-cycle inventory databases, this process is described as “the consumption of electricity in production”. Table 1 presents the details of Process 6681 coded in an XML format, which is used as the input data for LCA.
With the software developed by this research, which is shown in Figure 12, the details of the process are extracted from the source file of process 6681, including the process name, category, subcategory, manufacturer, date, etc.
The eco-accounting model for analysing the product’s processes is established utilising openLCA, which is a professional LCA software [15]. The elementary input data used for the LCA are collected from the EcoInvent v3.7 [29]. The EcoCost assessment method has been created to calculate the overall environmental performance of the computer mouse through its life cycle to obtain its EcoCost value, which is detailed as follows:
- Functional unit
One unit (item) of the computer mouse (Logitech Cable Mouse M125) is used as an example to assess the environmental impact of the product. The mouse consists of several components, such as a microcontroller, sensor, cables, buttons (i.e., left or right button), page turning device, housing, printed circuit board, USB plug, etc.
- System boundary
The system boundary covers the product’s life cycle, including raw material extraction, production of basic materials, production of the components and end of life (EoL) treatment (see Figure 13). The use stage is excluded since there is uncertainty regarding the energy consumption during the use stage. When the mouse is connected to the computer, the energy comes from the computer, and hence, it is hard to calculate the power consumption of the mouse. Transportation between the manufacturer and the retailer is also excluded from the system boundary since the retail location is uncertain. In the manufacturing stage, the production and assembly of components and sub-systems are considered, including raw material acquisition, production of basic materials, and manufacture of components. The energy consumption and waste generation during manufacturing are considered within the material, which is drawn from processes in the Ecoinvent database [29].
- Inventory data
The background data, such as raw material extraction and production of the basic materials, were derived from the Ecoinvent database 3.7 [29]. The bill of materials data is listed in Table 2, where the EoL treatment is considered in compliance with the WEEE directive [27].
- Life cycle impact assessment
LCA calculation was conducted using ReCiPe, based on the three endpoint impact categories (ecosystems, resources, and human health). Utilising normalisation and weighting methods, i.e., “World ReCiPe H/A (person/year)”, the three endpoint scores were aggregated as the overall environmental impact score of a function unit, and hence, a single value of EcoCost was obtained. The assessment models have been developed with openLCA in line with the Ecoinvent database, as shown in Figure 14.
- Results and Export
Table 3 shows the assessment results of three endpoints and the total environmental impact (EcoCost) of a computer mouse. The total environmental impact score is 1.72 points, which is the aggregation scores of three endpoint impact categories. The environmental impact scores of the three endpoint categories (Resources, Human Health and Ecosystems) are 0.92, 0.77, and 0.02, respectively.
Figure 15 shows that the above results were exported to a spreadsheet file using openLCA. Figure 16 shows the export function of openLCA and the generated data file, which can be opened by Microsoft Excel software.
- Step 2: Online handling EcoCost data via distributing the load across different computers
The EcoCost produced is subsequently transmitted to the load balancing network for further data processing. The business user uploads the EcoCost values using the developed online product upload tool (see Figure 17). Each user has an individual account. By entering the username and password, the user is able to access the account and then submit Eco data file (EcoCost value and three endpoints of the product) through the operation interface. Subsequently, load-balancing and Internet-based service technologies are applied to process data and record them in the Cloud database.
There are a large number of EcoCost data (e.g., midpoints, endpoints, and processes of products) to be transmitted from the business to the ICT infrastructure. To ensure that the data are properly transmitted over the Internet, multiple information and communication technologies (such as Cloud, load-balancing, Web services) are applied to handle the data (e.g., to sort and record datasets) and transmit them online from the supplier to the consumer.
The load-balancing network was created to demonstrate the interoperability and data communication capability of the system. The network consists of the four server computers: one Web server, two Application servers, and one Database server. The Web server is responsible for retrieving the EcoCost dataflow and then distribute the computer’s work-load to the application servers for further processing.
The above-mentioned four server computers were deployed as the four nodes on the network. Within this network, the network-published node engine (NNE), as the node controller utilised in the LabVIEW-based communication development environment, controls the update of four server nodes. In detail, when the one of the application servers, such as App server I (see Figure 17), updates new data, it will be immediately transmitted to the NNE; under the control of the NNE’s Processing Loop, the new data are then synchronised to the Web server, which is shown as a “subscriber” in Figure 17. In this way, the application server’s hardware information (CPU and RAM usage and load progressing status of the computer) is transmitted to the Web server in real time. According to the hardware information obtained, the usage of every application server is evaluated, and then the Web server allocates the load to the application server that is identified as the lowest usage. Figure 18 illustrates the process of synchronising data from the Application server to the Web server utilising a network-published node engine.
Using the developed load balancer, as shown in Figure 5 in Section 3.1.2, the computer hardware information is received from the application servers through the NNE. The two application servers with different IP addresses are monitored simultaneously, and their hardware information is sent to the Web server over the wireless network. According to the hardware information obtained, the lowest usage application server is identified for further load balancing purposes.
Figure 19 presents that the Web server retrieving the two requests from the business user, which is an operation module on the supply chain. The loads are distributed to the two application servers, and then the Application server I and Application server II are assigned the two tasks/requests, respectively. On one hand, the Application server I receives the user request to confirm the business user’s Identity, which is shown in Figure 20. To do so, a remote connection between the business server and the Web server is established successfully. Then, the verification is completed by verifying the information in the user database. On the other hand, the Application server II processes a product querying request, which is assigned by the Web server, and then transmits EcoCost values back to the business user over the Internet, as shown in Figure 21.
In the actual tests and applications, two application servers operate in parallel and handle plenty of task requests simultaneously, while the overall usage remains within the range of 25–70%, which are subject to the amount and strength of computing loads and the performance of each computer. The use of two application servers plays an important role in balancing the load to optimise the information flow transmitted through the system. In case the first application server works at a high CPU and/or memory usage, the second application server is informed to balance loads in time. The above communication process is tracked in real time and logged by the load-balancing module.
The test result shows that the workload of handling EcoCost data can be effectively distributed through different computers by balancing the load and monitoring the computer usage when a remote user initialises the requests to the module. Importantly, the module can be scaled up to accommodate more server computers by installing the duplicated software and configuring the communication ports, which will effectively improve the processing capacity of large-scale data to enable the data transmission through every business server over a supply chain.
- Step 3: Transmitting EcoCost data to a consumer with the RFID module developed
The consumer who accesses the EcoCost data of the product has to verify their identity via the Web server computer. In doing so, the consumer ID card is placed on an RFID-based reader and a 13-digit serial number is read out and then transferred to the Web server, which is achieved by calling a developed interface over the Internet. After successful verification, the consumer is then allowed to access the product data from the database server computer.
In order to obtain the product’s EcoCost, the consumer places the RFID-enabled mouse product on the reader, and the serial number of product is read out of the RFID tag and is then passed to the Web server to fetch data. The request is handled online, and EcoCost values are returned to the consumer in real time. Figure 22 shows that the consumer has successfully retrieved EcoCost information of product, including the EcoCost value and the associated endpoint impacts (resources, human health and ecosystems).
5. Conclusions
The ICT infrastructure for the eco-accounting system has been successfully developed by this research, which generates the EcoCosts through the product’s life cycle and provides the EcoCosts from the business to the consumer.
This research made the following contributions:
- More comprehensive EcoCost values are efficiently transferable online. The existing EcoCost calculations are either based on single/couple indicator(s), such as carbon footprint and material footprint, or unavailable for efficient online transmission. The EcoCost values calculated in this research are based on ReCiPe’s 17 mid-point indicators and three end-point indicators, which are more comprehensive. The load balancing technique developed by this research makes the online transmission of the EcoCost values more efficient.
- A considerable number of EcoCost data can be handled and transmitted over the value chain. The major problem of the existing eco-accounting software is the lack of sufficient ICT support, resulting in the information flow within the ecological accounting system not being effectively processed. To overcome this problem, a new type of ICT infrastructure for the eco-accounting system is developed based on load balancing, life-cycle assessment, and RFID technology, transmitting a large number of EcoCost values from one operation module to another over the value chain, which is a novel application of information communication in ecological accounting.
- This study contributed to scaling up the ICT infrastructure for eco-accounting systems. The ICT infrastructure developed by this research is able to scale up to allow new businesses to be involved in supply chains in creating their business processes and services. The server computers for supporting the business operation are able to scale up to cope with more complicated and considerable EcoCosts of different products, which cover not only the existing businesses but also the new ones participating in the value chain.
- This study contributed to the management of inter-operation among the operation modules. The ICT-based communication infrastructure has been established as a top platform to coordinate and manage the interoperation among the operation modules. Consumers, as the last operation module, are allowed to make the comparison of ecological impacts among different products while seeking sustainable products based on the EcoCosts.
In LCA calculation, there is a large number of data to be used in various types/formats, such as basic inputs, midpoints, and endpoints, and these data need to be updated to ensure the quality of LCA. The updating of information data is one of the most complex aspects of the LCA process, which will be considered in the future development of a fully operational web-based LCA tool.
As stated in Section 3.2, it would be ideal for the platform to incorporate some level of benchmarking to help users understand the LCA results. Because this research focuses on the development of information communication infrastructure for the ecological accounting system, the benchmarking issue is not covered in this paper, but it will be considered in the future work of the research by utilising the approach developed in the EU H2020 CIRC4Life project [17].
Author Contributions
Formal analysis, W.P. and D.S.; Funding acquisition, D.S.; Investigation, W.P., D.S., and S.W.; Methodology, D.S.; Software, W.P.; Supervision, D.S.; Writing—original draft, W.P.; Writing—review and editing, D.S. and S.W. All authors have read and agreed to the published version of the manuscript.
Funding
This research was funded by (1) the EU FP7 Project: myEcoCost-A Consumer Oriented Prototype–Forming the Nucleus of a Novel Ecological Accounting System (Grant Agreement No. 308530), and (2) the EU H2020 project: CIRC4Life-A circular economy approach for lifecycles of products and services (Grant Agreement No. 776503).
Institutional Review Board Statement
Not applicable. The research conducted in this paper does not involve humans or animals.
Informed Consent Statement
Not applicable. The research conducted in this paper does not involve humans or animals.
Data Availability Statement
The raw/processed data required to reproduce the findings, such as LCIA results, are available from this paper.
Acknowledgments
The authors acknowledge supports received from the myEcoCost project consortium members in carrying out the research reported in this paper.
Conflicts of Interest
The authors declare no conflict of interest.
References
- myEcoCost, European Commission’s FP7 myEcoCost project ‘Forming the Nucleus of a Novel Ecological Accounting System’. Available online: https://www.myecocost.eu/ (accessed on 29 January 2021).
- Von Geibler, J.; Wiesen, K.; Mostyn, R.S.; Werner, M.; Riera, N.; Su, D.Z.; Björling, S.E.; Domen, T.; Smith, J.; Jenkins, A.; et al. Forming the Nucleus of a Novel Ecological Accounting System: The myEcoCost Approach. J. Key Eng. Mater. 2014, 572, 78–83. [Google Scholar] [CrossRef] [Green Version]
- Su, D.; Peng, W. Eco-Accounting Infrastructure; Springer: Berlin/Heidelberg, Germany, 2020; pp. 73–84. [Google Scholar]
- Su, D.; Peng, W. Internet-based Inter-Operation Infrastructure for Data Management within an Ecological Accounting System. In Proceedings of the International Conference on Computer Science and Software Engineering (CSSE2014), Hangzhou, China, 18–19 October 2015; pp. 759–772. [Google Scholar]
- Wu, Y.; Su, D. Review of Life Cycle Impact Assessment (LCIA) Methods and Inventory Databases. Concurr. Eng. Approaches Sustain. Prod. Dev. A Multi-Discip. Environ. 2020, 39–55. [Google Scholar] [CrossRef]
- Bare, J.C.; Pennington, D.W.; De Haes, H.A.U. Life cycle impact assessment sophistication. Int. J. Life Cycle Assess. 1999, 4, 299–306. [Google Scholar] [CrossRef]
- Su, D.; Ren, Z.; Wu, Y. Guidelines for Selection of Life Cycle Impact Assessment Software Tools. In Concurrent Engineering Approaches for Sustainable Product Development in a Multi-Disciplinary Environment; Springer: Cham, Switzerland, 2020; pp. 57–70. [Google Scholar]
- Bare, J.C.; Hofstetter, P.; Pennington, D.W.; De Haes, H.A.U. Midpoints versus endpoints: The sacrifices and benefits. Int. J. Life Cycle Assess. 2000, 5, 319. [Google Scholar] [CrossRef] [Green Version]
- LCA Calculator. Available online: https://www.lcacalculator.com/ (accessed on 29 January 2021).
- Borrion, A.; Matsushita, J.; Austen, K.; Johnson, C.; Bell, S. Development of LCA Calculator to support community infrastructure co-design. Int. J. Life Cycle Assess. 2018, 24, 1209–1221. [Google Scholar] [CrossRef] [Green Version]
- Speck, R.L. A Comparative Analysis of Commercially Available Life Cycle Assessment Software. Ph.D. Thesis, Michigan State University, Lansing, MI, USA, 2014. [Google Scholar]
- Spatari, S.; Betz, M.; Florin, H.; Baitz, M.; Faltenbacher, M. Using GaBi 3 to perform life cycle assessment and life cycle engineering. Int. J. Life Cycle Assess. 2001, 6, 81–84. [Google Scholar] [CrossRef]
- SimaPro. Available online: www.simapro.co.uk (accessed on 29 January 2021).
- Peng, W.; Wu, Y.; Su, D. Application of Information and Communication Technologies for Eco-Accounting. In Sustainable Product Development: Tools, Methods and Examples; Su, D., Ed.; Springer: Berlin/Heidelberg, Germany, 2020; pp. 85–126. [Google Scholar]
- openLCA, The Open Source Life Cycle and Sustainability Assessment Software. Available online: http://www.openlca.org (accessed on 29 January 2021).
- Sustainable Minds. Available online: www.sustainableminds.com (accessed on 29 January 2021).
- CIRC4Life, European Commission’s Horizon 2020 CIRC4Life Project Entitled. A Circular Economy Approach for Lifecycles of Products and Services. Available online: https://www.circ4life.eu/ (accessed on 29 January 2020).
- Wang, S.; Su, D.; Wu, Y.; Chai, Z. Application of life-cycle assessment to the eco-design of LED lighting products. Euro-Mediterr. J. Environ. Integr. 2020, 5, 1–10. [Google Scholar] [CrossRef]
- Ona Online Shop. Available online: https://onaemotion.com/en/lamp-shop-online/ (accessed on 25 February 2021).
- Isard, M.; Budiu, Y.; Yu, M.; Birrell, A.; Fetterly, D. Distributed data-parallel programs from sequential building blocks. EuroSys 2019, 59–72. [Google Scholar] [CrossRef]
- Su, D.Z.; Peng, W.J. Application of PDA and Wireless Technology in a Server-Client Structure for Remote Machine Condition Monitoring. Key Eng. Mater. 2010, 450, 449–452. [Google Scholar] [CrossRef]
- GrudziĔski, J.; Monika, K.; Łukasz, B. Computer-aided Environmental Risk Assessment of Potato Cultivation Technology Using OpenLCA Software. J. Ecol. Eng. 2016, 17, 198–202. [Google Scholar] [CrossRef]
- Su, D.Z.; Ren, Z.M. Ecological Impact Assessment and Eco-Design of Industrial Gearboxes. Key Eng. Mater. 2011, 486, 197–200. [Google Scholar] [CrossRef]
- Huijbregts, M.A.J.; Steinmann, Z.J.N.; Elshout, P.M.F.; Stam, G.; Verones, F.; Vieira, M.; Zijp, M.; Hollander, A.; Van Zelm, R. ReCiPe2016: A harmonised life cycle impact assessment method at midpoint and endpoint level. Int. J. Life Cycle Assess. 2017, 22, 138–147. [Google Scholar] [CrossRef]
- Goedkoop, M.; Heijungs, R.; Huijbregts, M.; Schryver, A.D.; Struijs, J.; Zelm, R.V. ReCiPe 2008: A Life Cycle Impact Assessment Method Which Comprises Harmonised Category Indicators at the Midpoint and the Endpoint Level. 2009. Available online: https://www.leidenuniv.nl/cml/ssp/publications/recipe_characterisation.pdf (accessed on 17 March 2021).
- Hilty, L.; Severith, M. Integrating ERP and environmental information systems—The case of life cycle inventories. In Proceedings of the EnviroInfo 2011—25th Symposium Informatics for Environmental Protection—Innovations in Sharing Environmental Observations and Information (Part 2), Ispra, Italy, 5–7 October 2011; pp. 659–668. [Google Scholar]
- Peng, W.; Su, D. Development of an Online Recycling Monitoring System for Customer Electronic Products Using the Internet, NFC and RFID Technologies. Key Eng. Mater. 2015, 486, 81–86. [Google Scholar] [CrossRef]
- Zhang, D. Radio Frequency Identification (RFID) Technology. Telecommun. Technol. 2020, 2, 86–88. [Google Scholar]
- Ecoinvent, Ecoinvent Database (Version 3.7). Available online: https://www.ecoinvent.org/ (accessed on 29 January 2021).
Figure 2.
Overview of the Information Communication Infrastructure.

Figure 3.
Structure of load balancing module formed by multiple server computers.

Figure 4.
Logging the usage of a CPU core.

Figure 5.
Measurement of hardware information of the application server, such as CPU usage, memory usage and load progressing, using the tool developed.
Figure 5.
Measurement of hardware information of the application server, such as CPU usage, memory usage and load progressing, using the tool developed.

Figure 6.
Input data for life cycle assessment (LCA).

Figure 7.
EcoCost calculation based on ReCiPe.

Figure 8.
The EcoCost database developed for LCA.

Figure 9.
Web-based service, to transmit EcoCost data to the communication infrastructure.

Figure 10.
Information flow of Radio Frequency Identification (RFID).

Figure 11.
Computer mouse with an embedded RFID tag.

Figure 12.
Details of a product’s process obtained from EcoSpold dataset using the software developed in this research.
Figure 12.
Details of a product’s process obtained from EcoSpold dataset using the software developed in this research.

Figure 13.
System boundary of the LCA case study.

Figure 14.
Life cycle impact calculation in openLCA.

Figure 15.
Results export in openLCA.
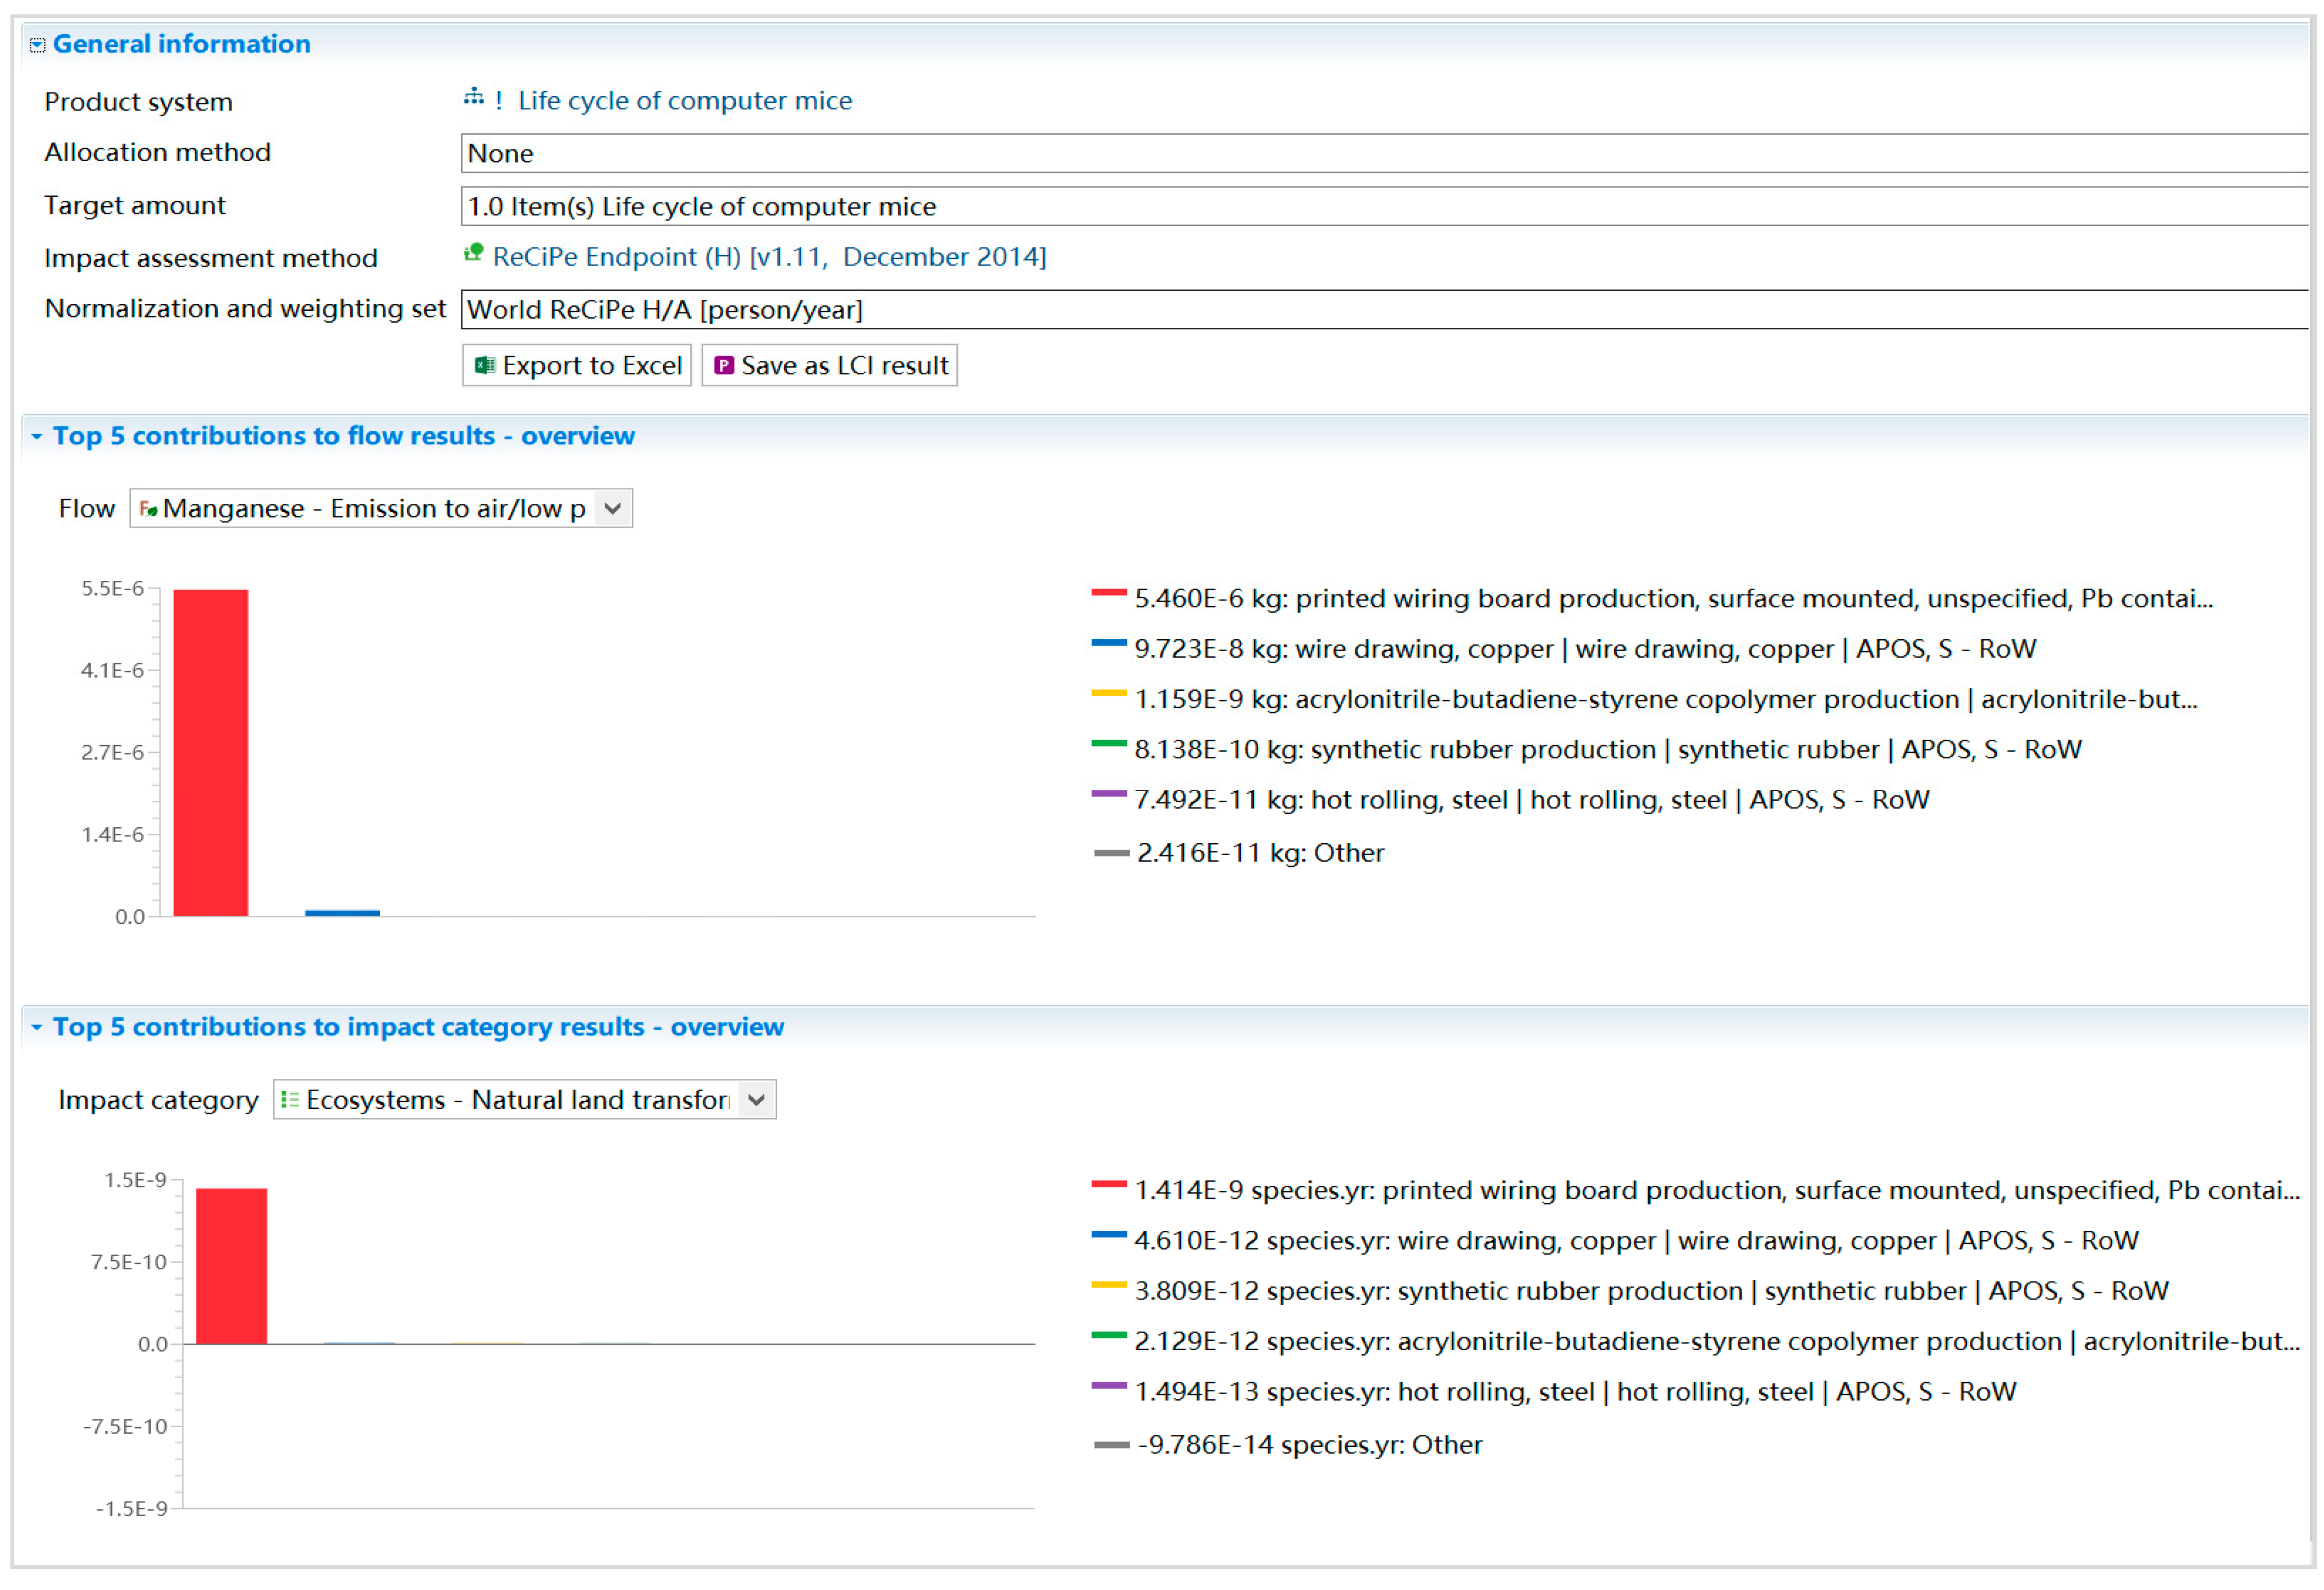
Figure 16.
Overview of the exported LCA result file.

Figure 17.
Online EcoCost upload tool.

Figure 18.
Deployment and hosting of the network-published node engine (NNE).

Figure 19.
Web server, to receive the requests from a business actor in the supply chain and distribute the load to the application server with lowest usage for further processing.
Figure 19.
Web server, to receive the requests from a business actor in the supply chain and distribute the load to the application server with lowest usage for further processing.

Figure 20.
Application server 1, to handle requests allocated by Web server and then return the result.
Figure 20.
Application server 1, to handle requests allocated by Web server and then return the result.

Figure 21.
Application server 2, to handle the requests allocated by Web server in order to balance the load and optimise the information flow.
Figure 21.
Application server 2, to handle the requests allocated by Web server in order to balance the load and optimise the information flow.

Figure 22.
EcoCost information displayed on the consumer tablet device using the module developed.


Table 1.
Input data for a computer mouse product for LCA.
| Product Code | 6681 |
| Company | PSI |
| Start Year | 2005 |
| End Year | 2005 |
| Location | China (CN) |
| Address | OVGA, 5232 Villages PSI |
| General Comment | Supply mix is identical to production mix at medium. |
| Product Name | Electricity, medium voltage |
| Category | Electricity |
| Subcategory | Supply mix |
| Amount | 1 |
| Unit | kWh |
| Scheme | EcoSpold 01 dataset |
| Source file | 06681.xml |
Table 2.
Bill of materials.
| Assembly Component | Material | Amount | Unit |
|---|---|---|---|
| Housing | ABS | 0.0493 | kg |
| Scroll | Synthetic rubber | 0.002 | kg |
| Printed Wiring Board | Chromium steel | 0.0022 | kg |
| Hot rolling steel | 0.0022 | kg | |
| Polypropylene | 0.00245 | kg | |
| Cable | copper | 0.0185 | kg |
| Polyvinylchloride | 0.01675 | kg |
Table 3.
EcoCost value with a single score (one unit of computer mouse).
| Impact Category | Amount | Unit |
|---|---|---|
| Resources—total | 0.92434 | points |
| Human Health—total | 0.76963 | points |
| Ecosystems—total | 0.02256 | points |
| Total (EcoCosts) | 1.71653 | points |
Publisher’s Note: MDPI stays neutral with regard to jurisdictional claims in published maps and institutional affiliations. |
© 2021 by the authors. Licensee MDPI, Basel, Switzerland. This article is an open access article distributed under the terms and conditions of the Creative Commons Attribution (CC BY) license (http://creativecommons.org/licenses/by/4.0/).
Share and Cite
MDPI and ACS Style
Peng, W.; Su, D.; Wang, S. Development of an Innovative ICT Infrastructure for an Eco-Cost System with Life Cycle Assessment. Sustainability 2021, 13, 3118. https://doi.org/10.3390/su13063118
AMA Style
Peng W, Su D, Wang S. Development of an Innovative ICT Infrastructure for an Eco-Cost System with Life Cycle Assessment. Sustainability. 2021; 13(6):3118. https://doi.org/10.3390/su13063118
Chicago/Turabian StylePeng, Wenjie, Daizhong Su, and Shuyi Wang. 2021. "Development of an Innovative ICT Infrastructure for an Eco-Cost System with Life Cycle Assessment" Sustainability 13, no. 6: 3118. https://doi.org/10.3390/su13063118
Note that from the first issue of 2016, this journal uses article numbers instead of page numbers. See further details here.