
Bikeway Provision and Bicycle Commuting: City-Level Empirical Findings from the US


1
School of Architecture and Fine Art, Dalian University of Technology, Dalian 116024, China
2
Department of the Built Environment, Eindhoven University of Technology, 5600MB Eindhoven, The Netherlands
3
Department of Air Transportation Management, Nanjing University of Aeronautics and Astronautics, Nanjing 211106, China
*
Author to whom correspondence should be addressed.
Sustainability 2021, 13(6), 3113; https://doi.org/10.3390/su13063113
Submission received: 9 February 2021
/
Revised: 8 March 2021
/
Accepted: 8 March 2021
/
Published: 12 March 2021
(This article belongs to the Section Sustainable Transportation)
Abstract
:The growing worldwide awareness of the significant benefits of bicycling as an urban transport mode has aroused great interest in exploring the role that bikeways play in promoting utilitarian bicycling. However, few studies assess the contribution of citywide bikeway provision with the inclusion of all facility types and differentiation of facility utilities. This study provides new evidence by evaluating the collective effects of bikeway kilometers per square kilometer, bikeway kilometers per 10,000 population, and low-stress bikeway proportion on the bicycle-commuting share in 28 US cities between 2005 and 2017. Using linear panel regression models, we found that the expansion of citywide bikeway infrastructure positively influences the share of commute trips by bicycle. The results also indicated that the proportion of low-stress bikeways has a stronger impact on the bicycling-to-work share than bikeway kilometers per 10,000 population, while the impact of bikeway kilometers per square kilometer ranks last. These findings may aid policy makers and planners in formulating sound city-level bikeway policies favoring sustainable urban transportation scenarios.
1. Introduction
Automobile-oriented urban development results in many problems, such as traffic accidents and congestion, air and noise pollution, fuel consumption, social segregation, and insufficient physical activities, which increase economic costs to society and erode quality of life [1]. In order to mitigate these negative impacts caused by auto overuse, many cities around the world have strived to encourage utilitarian bicycling [2,3]. Among the various interventions, the provision of bikeway infrastructure is one of the most crucial strategies to achieve this vision [4,5,6]. To assist in formulating sound bikeway policies, there has been a growing interest of academics in exploring the relationship between bikeway provision and utilitarian bicycling [7,8,9]. For example, a multilevel longitudinal study of 13 US metropolitan areas found that the presence of bikeway facilities was associated with increased volumes of bicycle traffic, offering supportive evidence to facilitate bicycle travel by expanding bikeway infrastructure [10].
Nonetheless, three major gaps are not fully filled in the available empirical research [7]. Firstly, prior studies have investigated the association between the provision of specific bikeways (e.g., on-street lanes) and bicycle ridership [11,12,13]. However, considering various types of bikeways in real-world implementations and budget constraints on bikeway investments, it is necessary to address the effect of citywide bikeway provision with inclusion and differentiation of all facility types. Secondly, despite it is being argued that some types of bikeways are low-stress facilities that provide higher rates of utilization for bicycling [14], few studies have empirically validated this claim [15], let alone estimated the collective effects of the overall and low-stress bikeway provision within urban areas. Thirdly, previous studies have generally applied a single metric to quantify the supply of the studied bikeways, with the data collected by the centerline-kilometer measure [11,16,17] or without explicit description of methods for data acquisition [18]. In-depth research using multiple metrics to reflect the characteristics of citywide bikeway provision with data acquired by lane kilometers will help to systematically understand the intrinsic mechanisms of certain actions in motivating bicycle travel.
Given the aforementioned limitations, this study aims to identify how bikeway provision influences bicycle commuting at the city level. It uses a sequential linear panel regression modeling approach to multi-year (between 2005 and 2017) aggregate data from 28 US urban areas to address the following two questions: (i) How much do citywide bikeway provision characteristics collectively contribute to real-world bicycle commuting in automotive cities that are experiencing bicycling renaissances? and (ii) Among the bikeway provision attributes respectively measured by bikeway kilometers per square kilometer, bikeway kilometers per 10,000 population, and low-stress bikeway proportion, which one weighs more in encouraging commuters to shift to bicycling?
This study has three contributions. First, we employed unbalanced panel data from 28 US cities across multiple years (between 2005 and 2017) rather than cross-sectional data collected in a single year. Second, we took all types of bikeways with differentiation of facility utilities into account to assess their collective effects on bicycling-to-work behavior. Third, we applied three metrics simultaneously to quantify the characteristics of citywide bikeway provision and explored their influencing mechanisms in boosting bicycle commuting in cities with emerging bicycling cultures. The results will improve the efficacy of city-level bikeway policies toward the vision of increasing bicycling-to-work shares and reducing auto dependence.
The paper is structured as follows. Section 2 offers a literature review of existing academic studies on the relationship between bikeway provision and utilitarian bicycling and identifies the research gaps. Section 3 provides an introduction to the data and models used in this study. Section 4 presents the results of our analysis. Section 5 discusses the key results, the associated implications for planning policies, as well as the weaknesses and future perspectives. Section 6 draws the conclusion.
2. Literature Review
2.1. Bikeway Provision and Utilitarian Bicycling
An increasing number of empirical studies have evaluated the link between bikeway provision and utilitarian bicycling, owing to the rising demands for sound planning policies on expanding bikeway infrastructure to support bicycle travel. To date, many studies have focused on the effects of the provisions of off-street paths and/or on-street lanes [11,12,13,16,19]. Bikeway infrastructure (Table 1) is a generic term for linear bicycle facilities specifically designated for exclusive use or sharing with other transportation modes [20]. Ignoring the supply of other types of bikeways, like bicycle boulevards, will overstate the effect of the supply of the specific types included in the research and lead to omitted variable bias. Meanwhile, the analyses of the influence of expanding on-street lanes, a combination of protected, buffered, painted, and shared bike lanes (Table 2), will miscalculate the effects of bikeways with different designs. Moreover, due to limited financial resources of bikeway programs and investments, policy makers and planners are looking to prioritize certain actions that can efficiently accommodate bicycling. Therefore, it is essential to consider the overall supply of citywide bikeway infrastructure with differentiation of facility types while analyzing their relationship to utilitarian bicycling.
In recent years, there has been a growing consensus that of all types of bikeways, bike paths, protected bike lanes, and bicycle boulevards are low-stress facilities that offer more utilities in favor of bicycling [14]. A study evaluating bike improvement plans in uptown Cincinnati (Ohio, US) revealed that protected bike lanes exhibited a more significant advantage over bike lanes concerning bicycling [21]. In a study on user preferences for bicycle infrastructure in the San Francisco Bay Area, Griswold et al. found that urban bicyclists preferred bicycle boulevards to buffered bike lanes or bike lanes [22]. Another study examining facility preferences of 1178 respondents from six communities in Alabama and Tennessee (US) found that although the introduction of multi-use paths, protected bike lanes, buffered bike lanes, and bike lanes promotes respondents’ willingness to bike, the regression coefficients of the former two treatments were much larger than those of the latter two types [23]. In terms of empirical evidence, a multilevel study of 36 British cities and towns indicated that the proportion of low-stress bikeways correlates positively with the share of bicycle commuting [15]. However, more empirical findings with further clarification are still required.
Regarding the above concerns, it is imperative to identify the combined effects of citywide bikeway provision with the overall supply and the proportion of low-stress bikeways taken into account. To the best of our knowledge, a city-level study found that increasing the provision of the studied bikeways (including bike paths, protected bike lanes, buffered bike lanes, bike lanes, and shared lanes) and the proportion of high-quality bikeways (including bike paths and protected bike lanes) could nudge bicycle commuting in the right direction [17]. Nonetheless, the research ignored the influences of bicycle boulevard provision and other factors that affect bicycling-to-work behavior. Moreover, few studies have investigated the intrinsic mechanisms between bikeway provision and bicycle commuting. This study seeks to explore how bikeway provision collectively influences bicycle commuting in cities with emerging bicycling traditions, controlling for social–demographic, transport mode choice-related, and climatic variables.
2.2. Measures of Bikeway Provision
Although previous empirical studies shed light on the relationship between bikeway provision and bicycle ridership, there is limited discussion on the metrics used to quantify the supply of bikeway infrastructure. The most simplistic measures are the length of bikeways [4,6,18] and the frequency of bikeways [13], see Table 2. However, both metrics are not fully comparable across cities because of the differences in land area and population size. Bikeway density can eliminate the influence of land area. It has two common expressions. One is the ratio of bikeway length to land area [12], the other is the length of bikeways within a certain distance buffer, like meters of cycleways at 0, 1–999, and 1000+ meters buffers [24], and kilometers of bike lanes within a 1.6 kilometer buffer [25]. Bikeway length per capita aims to overcome the influence of population size and has been applied in some studies. For example, a cross-sectional study of 18 US cities used kilometers of bicycle pathways per 100,000 residents to attribute differences in levels of bicycle commuting to the overall supply of pathways [26]. Buehler and Pucher applied kilometers of bike paths per 100,000 population and kilometers of bike lanes per 100,000 population to compare the effects of the provisions of the two-group bikeways on bicycling to work [11].
Bikeway density and bikeway length per capita reflect the supply of bikeways in consideration of land area and population, respectively, but are restrictive in distinguishing the provision of specific types of the infrastructure. Some studies cope with this problem by using bikeway proportion, which is the ratio of the length of the specific types to that of total facilities. A study of over 50 districts in England and Wales, for instance, used the proportion of off-road bicycle routes to investigate the bikeway-supply determinant on the share of commute trips by bicycle [27]. Recently, a limited number of studies have applied this metric to quantify the provisions of specific groups of bikeways consisting of types of facilities with similar utilities. Based on Level of Traffic Stress criteria [14], Cervero et al. [15] and Wang et al. [28] divided citywide bikeway facilities into four ordinal groups and used their proportions to estimate the association between the four-group bikeway supply and bicycling-to-work level.

Table 2.
Summary of bikeway provision metrics used in the literature.
| Bikeway Provision Metrics | Reference | Descriptions of the Adopted Metrics | ||
|---|---|---|---|---|
| Single metric | Bikeway length | [4] | Kilometers of all types of bikeways | |
| Kilometers of bike paths and lanes 1 | ||||
| [6] | Kilometers of all types of bikeways | |||
| Kilometers of bike paths, (protected) bike lanes, shared lanes, and bicycle boulevards | ||||
| [18] | Kilometers of cycle tracks, lanes, and green routes | |||
| Bikeway frequency | [13] | Frequency of off-street trails and on-street bicycle facilities 1 | ||
| Bikeway density | Bikeway length/land area | [12] | Kilometers of on-street bicycle lanes 1 per square kilometer | |
| Bikeway length within a certain distance buffer | [24] | Meters of cycleways 2 at 0 m, 1–999 m, and 1000+ m buffers | ||
| [25] | Kilometers of bike lanes within 1.6 km buffer | |||
| Bikeway length per capita | [11] | Kilometers of bike paths and lanes 1 per 100,000 population | ||
| [16] | Kilometers of bike paths and lanes per 1000 population | |||
| [26] | Kilometers of bicycle pathways 1 per 100,000 residents | |||
| Bikeway proportion | Length of a particular type of bikeway/total bikeway length | [27] | Proportion of off-road bike routes | |
| Length of types of bikeways with similar utility/total bikeway length | [15] | Proportion of very low-stress, low-stress, medium-stress, and high-stress links | ||
| [28] | Proportion of very low-stress, low-stress, medium-stress, and high-stress links | |||
| Two metrics | Bikeway length per capita and bikeway proportion | [17] | Kilometers of five types of bikeways per 1000 commuters | |
| Proportion of Class I and Class II bikeways | ||||
1 Referring to (protected or buffered) bike lanes and shared lanes. 2 Referring to bike lanes and set-aside street space for recreational cyclists and pedestrians.
Thus, using a single metric cannot fully reflect the features of citywide bikeway provision. Yang et al. [17] adopted bikeway length per capita and bikeway proportion together to estimate the effects of the supply of the studied bikeways. Nevertheless, in addition to the limitations mentioned in Section 2.1, this study also overlooked the influence of land area, which may misestimate the value of bikeway provision and consequently offer suboptimal bikeway-related implications to policy makers and planners for future investments. Furthermore, previous studies usually do not mention the statistical methods used in collecting bikeway provision data [18] or employ the data collected by centerline-kilometer measure [11,16,17], which understate the facility supply on-street segments with bikeways in both directions relative to those in only one direction. The lane-kilometer measure accounts for the length of the infrastructure in one direction and could reflect the types of bikeways if different designs are implemented on each side of the same street segment. In these regards, the present study employed bikeway density, bikeway length per capita, and low-stress bikeway provision simultaneously to measure the lane kilometers of bikeways within urban areas and weighed their importance in fostering bicycling-to-work shares. The results are beneficial to identify the priorities of actions on bikeway extensiveness and tailor effective urban bikeway policies.
3. Data and Methods
3.1. Choice of US Cities as Study Areas
The US is a typical country with a rich automobile culture. Recognizing the significant benefits of utilitarian bicycling, there has been a considerable expansion of bikeway infrastructure throughout the US in the past 15 years. In the 50 most populous cities, the amount of citywide bikeway infrastructure doubled in density, from 0.56 kilometers per square kilometer in 2007 to 1.12 kilometers per square kilometer in 2016 [2], with most of the cities’ annual bicycle commute shares grown over 50% during the same period [29]. In the recently published Strategic Agenda for Pedestrian and Bicycle Transportation [30], continuous enhancement of bikeway infrastructure for more bicycling trips is still a goal action for the Federal Highway Administration. Taking into account the reliability and comparability among cities, data collection efforts were hence concentrated on the 70 most populous cities.
3.2. Bikeway Provision Data and Metrics
3.2.1. Data Sources
Yearly data on bikeway provision with differentiation of facility types of an individual city are hard to collect and determine the sample size. After massively searching the 70 most populous cities’ government websites and randomly comparing with the data from Google Earth Pro, we gathered the annual lane kilometers of different types of bikeways in 31 cities over multiple years (between 2005 and 2017, most of the cities’ facilities are not recorded every reference year). Although the lane-kilometer measure does not distinguish the detailed attributes of bikeways (e.g., daily bicycle traffic flows, lane widths, and lane pavements), it distinguishes between street segments with bikeways serving one or both directions.
Bikeway facilities in this study contained bike paths, protected bike lanes, buffered bike lanes, bike lanes, shared lanes, and bicycle boulevards, see Table 1. It is worth mentioning that the bikeway on the same side of a certain street segment may be upgraded as time goes on. For example, to make the 2nd Avenue from East 2nd Street to East 14th Street in Manhattan (New York City) more bicycle-friendly, a nine-year step-by-step improvement, from no bikeway in 2000 to buffered bike lane in 2001 and protected bike lane in 2009, was applied. However, this is not a problem as the yearly citywide bikeway provision differentiates bikeway types, which already includes such information.
3.2.2. The Three Metrics
As noted, we used three metrics, including bikeway density, bikeway length per capita, and low-stress bikeway proportion, to quantify the provision of citywide bikeway infrastructure. Bikeway density and bikeway length per capita were defined as annual bikeway kilometers per square kilometer and annual bikeway kilometers per 10,000 population, respectively. The annual square kilometers of land area and annual number of population within the urban areas were derived from the U.S. Census Bureau (https://www.census.gov/, accessed on 8 February 2021).
In light of the Level of Traffic Stress developed by Mekuria et al. [14] and the specific designs of different types of bikeways (e.g., spatial separations and potential interactions between bicycles and vehicles), we divided the six types of bikeways into three classes: bike paths, protected bike lanes, and bicycle boulevards classified as “C1 bikeways (low stress)”; buffered bike lanes and bike lanes as “C2 bikeways (medium stress)”; and shared lanes as “C3 bikeways (high stress)”. The annual proportion of Cx bikeways (x = 1–3) was the ratio of the annual length of Cx bikeways to that of total bikeways.
3.3. Bicycling to Work
Even though commuter bicycling is only a part of utilitarian bicycling, we chose to focus on it for two reasons. Firstly, commuting is a significant aspect of travel behavior. In the US, it covers approximately 20% of the number of daily trips [31]. Secondly, the home–workplace journey is an activity confronted with a fixed schedule and time pressure. Consequently, it has higher requirements for citywide bikeway provision.
We acquired data on the annual proportion of commutes by bicycle (the ratio of the annual number of bicycling-to-work commuters to that of total commuters) from the League of American Bicyclists [32], who got the ratio through digging deeply into the raw data set of one-year estimates collected by the American Community Survey (ACS). The specific question presented to survey respondents was: “How did this person usually get to work last week? If this person usually used more than one method of transportation during the trip, mark (X) the box of the one used for most of the distance.” Respondents can only mark the “bicycle” box if he or she rode a bicycle or other vehicle that is pedaled for most of the commute distance. Strictly speaking, the ACS data only captured the single primary commuting mode for the week before the survey, which cannot precisely represent the annual commuting mode share. Such limitation notwithstanding, it is a reliable source for longitudinal changes in bicycling-to-work share across multiple cities in the US.
3.4. Control Variables
Control variables captured factors beyond the bikeway provision that influence bicycling-to-work behavior. Table 3 presents the definitions and data sources of the control variables contained in our research.
Table 3.
Definitions and data sources of control variables.
| Variables | Definitions | Data Sources | |
|---|---|---|---|
| Social–demographic variables | % Gender | Annual proportion of male and female commuters | [33] |
| % Income | Annual proportion of commuters earn less than USD 14,999, USD 15,000–49,999, and USD 50,000 and above | ||
| % Motor vehicle ownership | Annual proportion of commuters with 0 vehicle, 1 vehicle, and 2 vehicles or more | ||
| Transport mode choice-related variables | Gasoline price | Annual retail gasoline price (dollars per gallon) | [34] |
| Transit revenue kilometers per capita | Annual transit revenue kilometers per 10,000 population | [35] | |
| Climatic variables | Temperature | Annual mean temperature (°C) | [36] |
| Precipitation | Annual inches of precipitation | ||
Variables, which measure cultural and psychological attributes (e.g., social norms, attitudes, and habits), pro-bicycling policies and programs (e.g., bike parking, bike-sharing program, and bicycling education and training), as well as built and natural environments (e.g., land use, network layout, and hilliness) [8,37], were excluded from this study as city-level comparable data were not available.
3.5. Modeling Approach
The goal of this multivariate modeling was to address the combined effects of citywide bikeway provision on real-world bicycling-to-work behavior, controlling for social–demographic, transport mode choice-related, and climatic variables. Considering data features and sample size, we adopted a sequential linear panel regression modeling approach (the package of plm) in RStudio (Version 1.2.1335) developed by Croissant and Millo [38] to carry out this research.
Ensuring appropriate expression of the dependent variable and choosing the suitable level of the same independent variable were two essential steps before modeling. Data prepared for the dependent variable represented the annual proportion of commute trips by bicycle, which was bounded by 0 and 1 (excluded 0 and 1). To meet the assumption of linear functional form models, we natural logarithm-transformed the annual bicycle-commuting share and used boxplots to delete the outliers. This produced a data set of 167 valid observations (an unbalanced panel: Icity = 28, Tyear = 1–13, N = 167) for modeling, with the natural log-transformed annual bicycle-commuting shares closely following a normal distribution. Meanwhile, to pick out the appropriate level of the same independent variable, we conducted Pearson’s correlation analyses to examine the correlations for each pair of variables and ran collinearity diagnostics to avoid the presence of multicollinearity among the selected independent variables.
We employed a two-step linear panel regression modeling approach to develop our models: a base model and a full model. The base model tested the influences of the control variables. The full model evaluated the influences of the key explanatory variables of interest—annual bikeway kilometers per square kilometer, annual bikeway kilometers per 10,000 population, and annual proportion of C1 bikeways—with the inclusion of factors included in the base model. It is worth noting that: (i) we hypothesized that to starter cities [39], the provision of bikeway infrastructure offered the facility opportunity for fostering the level of utilitarian bicycling; (ii) we hypothesized that differences across the 28 cities had effects on annual bicycle commute shares, which could be captured by random effects, and ran Hausman tests to validate our hypotheses; and (iii) many of the study cities were concentrating on expanding C1 and C2 bikeways, which results in a low or very-low (close to 0) annual proportion of C3 bikeways. Therefore, we did not introduce the annual proportions of bikeways that were labeled as C2 or C3 into the full model.
4. Results
4.1. Descriptive Analyses and Bivariate Relationships
Figure 1 maps the 28 cities, highlighting their five-year (2013–2017) average proportions of home–workplace commutes by bicycle. Our samples, on the one hand, were to some extent evenly distributed across the US. On the other hand, they covered urban areas that had low bicycling-to-work shares as well as places with relatively moderate to high shares, like Portland, Washington DC, and Minneapolis, while all of them belonged to starter cities in bicycle commuting [39]. Notably, New York City has been making efforts to transform automobile-oriented streets into bicycle-friendly ones to encourage bicycle commuting [4]. However, it was excluded from our research because of several reasons, such as the high percentage of commuters with no vehicle available and the high amount of public transit use. Moreover, our samples also included twin cities (Minneapolis-Saint Paul, Phoenix-Mesa, and San Francisco-Oakland) and central-satellite cities (Los Angeles-Long Beach), which may result in intercity commuter bicycling. Due to that, data, particularly on bikeway infrastructure provision and bicycling-to-work proportions, were collected separately, we consequently omitted this bias.
Table 4 presents the descriptive statistics of the variables introduced into our models and bivariate Pearson’s correlations between independent and dependent variables. As expected, bicycling to work was positively and significantly correlated with annual bikeway kilometers per square kilometer (r = 0.422, p < 0.000) and annual proportion of C1 bikeways (r = 0.368, p < 0.000). There was a weak Pearson’s correlation between annual bicycle commute share and annual bikeway kilometers per 10,000 population (r = 0.150), with the magnitude of the coefficient (p = 0.052) slightly larger than 0.05. The bivariate correlations for the control variables were generally interpretable. Furthermore, the correlations between each pair of the independent variables were either weak or insignificant, apart from the significant negative correlation between the annual proportion of C1 bikeways and annual mean temperature (r = −0.568, p < 0.01). Nonetheless, diagnostics of modeling variables for multicollinearity did not indicate any problem as the tolerance values were between 0.35 and 0.87, all above 0.10.
Table 4.
Descriptive statistics and bivariate Pearson’s correlations with the dependent variable.
| Variables | Min | Max | Mean | SD | Correlation | |
|---|---|---|---|---|---|---|
| r | p-value | |||||
| Dependent variable | ||||||
| ln (annual proportion of commutes by bicycle) | −5.298 | −2.765 | −3.911 | 0.604 | ||
| Independent variables | ||||||
| Bikeway provision-related variables [40,41,42,43,44,45,46,47,48,49,50,51,52,53,54,55,56,57,58,59,60,61,62,63,64,65,66,67] | ||||||
| Annual bikeway kilometers per square kilometer | 0.089 | 5.898 | 1.767 | 1.252 | 0.422 | 0.000 *** |
| Annual bikeway kilometers per 10,000 population | 0.906 | 30.383 | 7.624 | 5.520 | 0.150 | 0.052 |
| Annual proportion of C1 bikeways | 0.026 | 0.622 | 0.283 | 0.149 | 0.368 | 0.000 *** |
| Social–demographic variables | ||||||
| Annual proportion of male commuters | 0.498 | 0.574 | 0.532 | 0.016 | −0.410 | 0.000 *** |
| Annual proportion of commuters earning ≤ USD 14,999 | 0.134 | 0.302 | 0.196 | 0.032 | −0.269 | 0.000 *** |
| Annual proportion of commuters with 0 vehicle | 0.016 | 0.090 | 0.047 | 0.021 | 0.311 | 0.000 *** |
| Transport mode choice-related variables | ||||||
| Annual retail gasoline price | 2.024 | 3.984 | 3.049 | 0.541 | 0.198 | 0.010 * |
| Annual transit revenue kilometers per 10,000 population | 0.143 | 4.773 | 1.235 | 0.907 | 0.381 | 0.000 *** |
| Climatic variables | ||||||
| Annual mean temperature | 6.394 | 25.065 | 14.901 | 4.266 | −0.476 | 0.000 *** |
| Annual inches of precipitation | 3.230 | 74.260 | 29.294 | 16.948 | 0.295 | 0.000 *** |
Significant levels: * p < 0.05, *** p < 0.001.
4.2. Modeling Results
Table 5 presents the modeling results for exploring citywide bikeway provision influencing the proportion of commute trips by bicycle across 28 US cities for multiple years.
The middle columns of Table 5 present the results of the base model. The relationships were generally congruent with the findings revealed in previous studies [10,11,16,23]. Among the social–demographic variables, the share of male commuters was significantly negatively associated with the proportion of commutes by bicycle. This was inconsistent with some studies [15,28]. The potential reason might be that women live closer to workplaces than men and thus bicycle more in commute trips [68]. The coefficients for the percentages of low-income and zero-vehicle commuters were not statistically significant. For the transport mode choice-related variables, higher gasoline price was significantly associated with a higher level of bicycle commuting. The coefficient for public transport supply (transit revenue kilometers per 10,000 population) was also positive, but not statistically significant. Additionally, high temperature worked against home–workplace bicycling, while there was no significant relationship between bicycle-commuting share and wet weather.
The right-hand columns of Table 5 show the outcomes of the full model. The relationships between the control variables and dependent variable in the full model were generally in line with those in the base model. Notably, the coefficient for male commuter proportion remained negative, but no longer significant. A plausible reason for this alternation might be that the expansion of citywide bikeway infrastructure makes the road environment more bicycle-friendly, attracting both male and female bicycle commuters [4]. The alternation of the significance of the coefficient for the proportion of zero-vehicle commuters (p < 0.05) was interpretable as the provision of bikeway infrastructure drawing more zero-vehicle commuters onto bicycles [15]. The coefficient for temperature was no longer significant. This was also seen in past work [11]. An unexpected result was the change of the significance of the coefficient for precipitation. One potential reason for this might be that cities have better bikeway facilities, and higher bicycling-to-work shares are mainly coastal cities (Figure 1), which also have higher inches of precipitation. More importantly, the coefficients for the key explanatory variables, which reflected the characteristics of citywide bikeway provision, were all significantly positive. According to the full model, a unit increase in annual bikeway kilometers per square kilometer was associated with a 0.090 increase in ln (annual bicycling-to-work proportion). Similarly, a unit increase in annual bikeway kilometers per 10,000 population and annual proportion of C1 bikeway separately resulted in a 0.027 and 1.623 increase in ln (annual bicycling-to-work proportion), holding the rest of the variables constant. The results also suggested that the annual proportion of C1 bikeways had a slightly stronger impact on the share of bicycle commuting than annual bikeway kilometers per 10,000 population, while the impact of annual bikeway kilometers per square kilometer ranked last, with standardized coefficients of –0.188, 0.251, and 0.400, respectively. Furthermore, by adding the three key explanatory variables to the base model, the adjusted R-squared value increased from 0.411 to 0.582, which underscored that the addition of bikeway supply-related variables appreciably improved upon the predictive and explainable powers of the base model.
5. Discussion
5.1. Summary of Key Results and Policy Implications
This study aims to fill the research gaps in the relationship between bikeway provision and bicycle commuting in cities with emerging bicycling cultures, using data acquired from 28 US cities over multiple years. In the following paragraphs, we will elaborate on the intrinsic mechanisms of citywide bikeway provision for motivating bicycle commuting, providing valuable insights for bikeway planning policies.
Our findings provide evidence that the overall supply of citywide bikeway infrastructure plays a role in bicycle commuting. As the annual bikeway kilometers per square kilometer and annual bikeway kilometers per 10,000 population increased, so did the annual share of commutes by bicycle. This supports the concept that the absence of bikeway infrastructure is a crucial barrier for utilitarian bicycling [69] and is congruent with prior empirical findings that the availability of suitable bicycling infrastructure is a critical factor to bicycle travel [4,17]. What is more, compared to annual bikeway kilometers per square kilometer, annual bikeway kilometers per 10,000 population has a stronger impact on annual bicycle commute share. As defined, the annual bikeway kilometers per square kilometer is the ratio of the annual bikeway length to the annual land area. A fine-grained bikeway system that lies on a gridiron street network establishes convenient bicycle access, creating a fundamental road space for bicycle commuting. The annual bikeway kilometers per 10,000 population takes population size into account, reflecting the capacity of bikeway infrastructure. Since a city is a human settlement with a concentration of population, a convenient bikeway system is necessary but not enough in promoting utilitarian bicycling. Population size, which to some extent reveals the number of existing and potential bicycle commuters, should also be fully considered to meet the requirements for bikeway capacity. For example, cities with similar scales of land areas but larger population sizes need more bikeways (e.g., increase the number of lanes on the same street segments) to match the same levels of facility demands for bicycle commuting.
Increasing the share of low-stress bikeways also provides benefits. The annual proportion of C1 bikeways was significantly positively associated with the annual proportion of commutes by bicycle, which was consistent with results from prior empirical [15] and preference studies [22,23]. More importantly, the annual proportion of C1 bikeways had a stronger impact on bicycle commuting than annual bikeway kilometers per 10,000 population. On the one hand, bicycling safety plays a critical role in utilitarian bicycling [70]. Collisions with vehicles are the main causes of bicyclists’ injuries and deaths [71]. Minimizing the frequency of bicycle–vehicle conflicts (including decreasing the probability of severe injuries and deaths in crashes) along with offering confidence to existing and potential bicyclists are two major motivations for designing bikeway infrastructure [72]. The C1 bikeways, a category of bikeways that either aims to spatially separate bicyclists from motor vehicles (bike paths and protected bike lanes) or focuses on restricting the volumes and speeds of motor vehicle traffic to guarantee the priority of bicycling (bicycle boulevards), are identified as the top effective designs for improving both objective and subjective safety. On the other hand, the C1 bikeways are also regarded as the highest comfort facilities in encouraging utilitarian bicycling [48]. Combining the two aspects, it is reasonable that, compared to annual bikeway kilometers per 10,000 population, annual proportion of C1 bikeways has a stronger explanatory power for bicycle commuting.
Overall, this study demonstrates that the feature of citywide bikeway provision that can effectively foster bicycle commuting is the availability of convenient, high-capacity, and low-stress bikeways. That includes expanding the overall supply of bikeways, with land area and population size taken into account, and increasing the share of bike paths, protected bike lanes, and bicycle boulevards as much as possible. Nevertheless, urban policy makers and planners should not presume that by adding bikeways with these characteristics, bicycling to work will explode in popularity. In cities with emerging bicycling traditions, both short-term bikeway construction and long-term continuous enhancement are necessary to facilitate bicycling-to-work trends in the right direction.
5.2. Limitations and Future Directions
This study has a few limitations. First, it was limited to exploring the effects of bikeway provision on bicycle commuting at the city rather than the neighborhood, block, street, household, or individual level. This resulted in ignoring the linear or even the nonlinear associations at lower levels. Meanwhile, which city a commuter lives in and which year a commuter commutes during can have bearings on bicycle commuting. Investigating the relationship at multiple levels by applying more advanced modeling approaches with city-fixed effects and year-fixed effects tests is encouraged.
Second, intersection bicycle infrastructure, like bike boxes and two-stage turn queue boxes, is a critical component of the citywide bikeway network and plays a crucial role in bicycling-to-work behavior [7,72]. Due to data availability, this study failed to involve the provision of intersection-related bicycle infrastructure. Future research can supplement our findings at multiple levels with the inclusion of node-based infrastructure supply by using more metrics, such as the connectivity and complexity of the citywide bikeway network, proximity to bikeway facilities in the neighborhood and workplace, and coverage of bikeway facilities on the bicycling-to-work route.
Thirdly, we also acknowledge that psychological attributes, like social norms and attitudes, and other pro-bicycling policies, like bicycle parking and storage availability at workplaces, influence the level of bicycle commuting [8,37,73]. Future studies with such variables included are required to gain more robust insights.
6. Conclusions
This study examined the influence of bikeway provision on bicycle commuting in 28 US cities during 2005–2017 from the urban perspective. We applied three metrics—bikeway kilometers per square kilometer, bikeway kilometers per 10,000 population, and low-stress bikeway proportion—to measure the characteristics of citywide bikeway provision and evaluated their combined effects on bicycle commuting.
We conclude that there is a positive and significant relationship between the presence of bikeway infrastructure and the share of bicycle commuting, controlling for other influencing factors. Among the three metrics, the proportion of low-stress bikeways has a stronger impact on bicycling-to-work share than bikeway kilometers per 10,000 population, while the impact of bikeway kilometers per square kilometer ranks last. Our work provides insights into how citywide bikeway provision attributes have promoted bicycle commuting over multiple years in various urban areas in the US. These findings might be useful for urban policy makers and planners to quantify the requirements for citywide bikeway provision and structure the corresponding infrastructure policies toward the vision of fostering bicycle commuting and mitigating auto dependence.
Author Contributions
Conceptualization, Q.Y. and J.C.; methodology, Q.Y., J.C., T.F., Z.L. and H.T.; software, Q.Y.; data curation, Q.Y.; writing—original draft preparation, Q.Y.; writing—review and editing, Q.Y., J.C., T.F., Z.L., and H.T.; visualization, Q.Y.; supervision, J.C., T.F., and H.T.; funding acquisition, J.C. and Q.Y. All authors have read and agreed to the published version of the manuscript.
Funding
This research was funded by the National Natural Science Foundation of China, grant number 51778099, and the China Scholarship Council, grant number 201806060042.
Institutional Review Board Statement
Not applicable.
Informed Consent Statement
Not applicable.
Data Availability Statement
Publicly available data sets were analyzed in this study.
Acknowledgments
We would like to thank the 2019 TRAIL International Ph.D. Summer School on Cycling in Cities, hosted by the Research School for Transport, Infrastructure and Logistics (TRAIL), for intensive training during the manuscript preparation.
Conflicts of Interest
The authors declare no conflict of interest.
References
- Roadmap to a Single European Transport Area–Towards a Competitive and Resource Efficient Transport System. Available online: https://eur-lex.europa.eu/LexUriServ/LexUriServ.do?uri=COM:2011:0144:FIN:EN:PDF (accessed on 28 March 2011).
- Bicycling & Walking in the United States: Benchmarking Report. Available online: https://bikeleague.org/sites/default/files/2016BenchmarkingReport_web.pdf (accessed on 8 February 2021).
- Lopez, A.; Pardo, C.; Quinones, L. Cycling plans, strategies and design guidelines. Available online: http://sutp.transport-nama.org/files/contents/documents/resources/F_Reading-Lists/GIZ%20SUTP%20Overview%20Cycling%20plans%20and%20strategies_July%202016.pdf (accessed on 8 February 2021).
- Pucher, J.; Buehler, R. Making cycling irresistible: Lessons from the Netherlands, Denmark and Germany. Transp. Rev. 2008, 28, 495–528. [Google Scholar] [CrossRef]
- Pucher, J.; Dill, J.; Handy, S. Infrastructure, programs, and policies to increase bicycling: An international review. Prev. Med. 2010, 50, 106–125. [Google Scholar] [CrossRef] [PubMed]
- Stehlin, J.G. Cyclescapes of the Unequal City: Bicycle Infrastructure and Uneven Development; University of Minnesota Press: Minneapolis, MN, USA, 2019. [Google Scholar]
- Buehler, R.; Dill, J. Bikeway networks: A review of effects on cycling. Transp. Rev. 2015, 36, 9–27. [Google Scholar] [CrossRef]
- Heinen, E.; Van Wee, B.; Maat, K. Commuting by bicycle: An overview of the literature. Transp. Rev. 2010, 30, 59–96. [Google Scholar] [CrossRef]
- Campisi, T.; Acampa, G.; Marino, G.; Tesoriere, G. Cycling master plans in Italy: The I-BIM feasibility tool for cost and safety assessments. Sustainability 2020, 12, 4723. [Google Scholar] [CrossRef]
- Le, H.T.K.; Buehler, R.; Hankey, S. Have walking and bicycling increased in the US? A 13-year longitudinal analysis of traffic counts from 13 metropolitan areas. Transp. Res. Part Transp. Environ. 2019, 69, 329–345. [Google Scholar] [CrossRef]
- Buehler, R.; Pucher, J. Cycling to work in 90 large American cities: New evidence on the role of bike paths and lanes. Transportation 2012, 39, 409–432. [Google Scholar] [CrossRef]
- Dill, J.; Carr, T. Bicycle commuting and facilities in major U.S. cities: If you build them, commuters will use them. Transp. Res. Rec. J. Transp. Res. Board 2003, 1828, 116–123. [Google Scholar] [CrossRef]
- Hankey, S.; Lindsey, G.; Wang, X.; Borah, J.; Hoff, K.; Utecht, B.; Xu, Z. Estimating use of non-motorized infrastructure: Models of bicycle and pedestrian traffic in Minneapolis, MN. Landscape Urban Plan. 2012, 107, 307–316. [Google Scholar] [CrossRef]
- Low-stress Bicycling and Network Connectivity. Available online: https://transweb.sjsu.edu/sites/default/files/1005-low-stress-bicycling-network-connectivity.pdf (accessed on 8 February 2021).
- Cervero, R.; Denman, S.; Jin, Y. Network design, built and natural environments, and bicycle commuting: Evidence from British cities and towns. Transp. Policy 2019, 74, 153–164. [Google Scholar] [CrossRef]
- Buehler, R. Determinants of bicycle commuting in the Washington, DC region: The role of bicycle parking, cyclist showers, and free car parking at work. Transp. Res. Part Transp. Environ. 2012, 17, 525–531. [Google Scholar] [CrossRef]
- Yang, Q.; Cai, J.; Huang, J. A research on bikeway network planning and design strategies for travel quality improvements. Urban Plan. Forum 2019, 253, 94–102. Available online: https://kns.cnki.net/kcms/detail/detail.aspx?doi=10.16361/j.upf.201906009 (accessed on 20 December 2019).
- Gössling, S. Urban transport transitions: Copenhagen, city of cyclists. J. Transp. Geogr. 2013, 33, 196–206. [Google Scholar] [CrossRef]
- Kang, L.; Fricker, J.D. Bicyclist commuters’ choice of on-street versus off-street route segments. Transportation 2013, 40, 887–902. [Google Scholar] [CrossRef]
- AASHTO Guide for the Planning, Design, and Operation of Bicycle Facilities. Available online: https://www.albany.edu/ihi/files/DraftBikeGuideFeb2010.pdf (accessed on 8 February 2021).
- Zuo, T.; Wei, H. Bikeway prioritization to increase bicycle network connectivity and bicycle-transit connection: A multi-criteria decision analysis approach. Transp. Res. Part Policy Pract. 2019, 129, 52–71. [Google Scholar] [CrossRef]
- Griswold, J.B.; Yu, M.; Filingeri, V.; Grembek, O.; Walker, J.L. A behavioral modeling approach to bicycle level of service. Transp. Res. Part Policy Pract. 2018, 116, 166–177. [Google Scholar] [CrossRef]
- Clark, C.; Mokhtarian, P.; Cricella, G.; Watkins, K. User preferences for bicycle infrastructure in communities with emerging cycling cultures. Transp. Res. Rec. J. Transp. Res. Board 2019, 2673, 89–102. [Google Scholar] [CrossRef]
- Cervero, R.; Sarmiento, O.L.; Jacoby, E.; Gomez, L.F.; Neiman, A. Influences of built environments on walking and cycling: Lessons from Bogotá. Int. J. Sustain. Transp. 2009, 3, 203–226. [Google Scholar] [CrossRef]
- Schoner, J.E.; Cao, J.; Levinson, D.M. Catalysts and magnets: Built environment and bicycle commuting. J. Transp. Geogr. 2015, 47, 100–108. [Google Scholar] [CrossRef] [Green Version]
- Nelson, A.C.; Allen, D. If you build them, commuters will use them: Association between bicycle facilities and bicycle commuting. Transp. Res. Rec. J. Transp. Res. Board 1997, 1578, 79–83. [Google Scholar] [CrossRef]
- Parkin, J.; Wardman, M.; Page, M. Estimation of the determinants of bicycle mode share for the journey to work using census data. Transportation 2008, 35, 93–109. [Google Scholar] [CrossRef] [Green Version]
- Wang, K.; Akar, G.; Lee, K.; Sanders, M. Commuting patterns and bicycle level of traffic stress (LTS): Insights from spatially aggregated data in Franklin County, Ohio. J. Transp. Geogr. 2020, 86. [Google Scholar] [CrossRef]
- Where We Ride: Analysis of Bicycle Commuting in American Cities. Available online: https://bikeleague.org/sites/default/files/Where_We_Ride_2017_KM_0.pdf (accessed on 13 September 2017).
- Strategic Agenda for Pedestrian and Bicycle Transportation. Available online: https://www.fhwa.dot.gov/environment/bicycle_pedestrian/publications/strategic_agenda/fhwahep16086.pdf (accessed on 8 February 2021).
- 2017 National Household Travel Survey. Available online: https://nhts.ornl.gov (accessed on 8 February 2021).
- Bicycle Commuting Data. Available online: https://www.bikeleague.org/content/bicycle-commuting-data (accessed on 27 January 2021).
- American Community Survey 1-Year Estimates: Means of Transportation to Work by Selected Characteristics. Available online: https://www.census.gov/acs/www/data/data-tables-and-tools/ (accessed on 29 February 2020).
- Annual Retail Gasoline and Diesel Prices. Available online: https://www.eia.gov/dnav/pet/pet_pri_gnd_dcus_nus_a.htm (accessed on 22 February 2021).
- National Transit Summaries and Trends. Available online: https://www.transit.dot.gov/ntd/annual-national-transit-summaries-and-trends (accessed on 3 November 2020).
- U.S. Climate Data. Available online: https://www.usclimatedata.com/climate/united-states/us (accessed on 8 February 2021).
- Macioszek, E.; Świerk, P.; Kurek, A. The bike-sharing system as an element of enhancing sustainable mobility—A case study based on a city in Poland. Sustainability 2020, 12, 3285. [Google Scholar] [CrossRef] [Green Version]
- Croissant, Y.; Millo, G. Panel data econometrics in R: The plm package. J. Stat. Softw. 2008, 27, 1–43. [Google Scholar] [CrossRef] [Green Version]
- Promoting Cycling for Everyone as a Daily Transport Mode. Available online: https://ec.europa.eu/energy/intelligent/projects/sites/iee-projects/files/projects/documents/presto_policy_guide_general_framework_en.pdf (accessed on 8 February 2021).
- Bikeways and Trails Facilities Plan. Available online: https://www.cabq.gov/council/projects/current-projects/bikeways-and-trails-facilities-plan (accessed on 8 February 2021).
- Atlanta’s Transportation Plan. Available online: https://transportationplan.atlantaga.gov/factsdata.html (accessed on 8 February 2021).
- 2014 Austin Bicycle Plan. Available online: https://www.austintexas.gov/page/austin-bicycle-plan (accessed on 6 November 2014).
- Boston Bike 2013 Update: State of the Hub. Available online: https://www.cityofboston.gov/images_documents/2013%20ReportFinal_tcm3-44028.pdf (accessed on 8 February 2021).
- Bikeways: Year in Review. Available online: https://chicagocompletestreets.org/streets/bikeways/ (accessed on 8 February 2021).
- 2018 Colorado Springs Bike Master Plan. Available online: https://coloradosprings.gov/bikes/page/bike-master-plan (accessed on 8 February 2021).
- Denver Moves: Bicycles. Available online: https://www.denvergov.org/ (accessed on 8 February 2021).
- Reverse Triangle Transportation Area Plan. Available online: https://www.fresnocog.org/wp-content/uploads/2017/06/3c-Bikeway-Facility-Types.pdf (accessed on 8 February 2021).
- Houston Bike Plan. Available online: https://houstonbikeplan.org/wp-content/uploads/2017/07/HoustonBikePlan_Full.pdf (accessed on 8 February 2021).
- Bicycle Master Plan. Available online: http://www.longbeach.gov/lbds/planning/advance/general-plan/mobility/bicycle/ (accessed on 8 February 2021).
- LADOT Annual Report. Available online: https://ladot.lacity.org/documents/plans-and-reports (accessed on 8 February 2021).
- Bicycle Master Plan: 2012. Available online: https://www.mesaaz.gov/home/showdocument?id=8616 (accessed on 8 February 2021).
- Milwaukee by Bike: City of Milwaukee 2010 Bicycle Master Plan. Available online: https://city.milwaukee.gov/City-of-Milwaukee-Bicycle-Milwaukee-Plan.htm#.XqbY1aEjxwV (accessed on 7 September 2010).
- Vision Zero Crash Study. Available online: http://www.minneapolismn.gov/www/groups/public/@publicworks/documents/webcontent/wcmsp-216606.pdf (accessed on 8 February 2021).
- Greater New Orleans Pedestrian and Bicycle Count Report. Available online: https://www.norpc.org/assets/pdf-documents/studies-and-plans/PBRI%20Count%20Report%202017_FINAL_compressed.pdf (accessed on 8 February 2021).
- I Bike Oakland. Available online: https://www.oaklandca.gov/resources/i-bike-oakland-newsletter (accessed on 8 February 2021).
- Philadelphia Pedestrian and Bicycle Plan. Available online: https://www.phila.gov/media/20190516105543/Pedestrian_Bicycle_Plan_Plan_Progress_Report_2015.pdf (accessed on 8 February 2021).
- Comprehensive Bicycle Master Plan. Available online: https://www.phoenix.gov/streetssite/Documents/Bicycle%20Master%20Plan/2014bikePHX_Final_web.pdf (accessed on 8 February 2021).
- How Portland’s Neighborhood Greenways Evolved. Available online: https://www.sightline.org/2014/12/11/how-portlands-neighborhood-greenways-evolved/ (accessed on 11 December 2014).
- City of Riverside Bicycle Master Plan Update: Addendum. Available online: https://www.riversideca.gov/traffic/masterplan2012.pdf (accessed on 8 February 2021).
- City of Sacramento Bicycle Master Plan. Available online: https://www.cityofsacramento.org/-/media/Corporate/Files/Public-Works/Transportation/Active-Transportation/Sacramento-BMP-Amended-201808.pdf?la=en (accessed on 14 August 2018).
- New Bicycle Network Projects. Available online: https://www.stpaul.gov/departments/public-works/bicycles/bicycle-projects (accessed on 14 November 2016).
- City of San Diego Bicycle Master Plan. Available online: https://www.sandiego.gov/sites/default/files/legacy/planning/programs/transportation/mobility/pdf/bicycle_master_plan_final_dec_2013.pdf (accessed on 8 February 2021).
- Congestion Management Program. Available online: https://www.sfcta.org/projects/congestion-management-program#panel-reports-documents (accessed on 8 February 2021).
- Bike Plan 2020: 2017 Annual Report. Available online: http://sanjose.granicus.com/MetaViewer.php?meta_id=625628 (accessed on 13 March 2017).
- Bridging the GAP: 2015 Annual Report. Available online: https://www.seattle.gov/Documents/Departments/SDOT/About/BTG/BTG_Annual_Report_2015.pdf (accessed on 8 February 2021).
- City of Tucson Bicycle and Pedestrian Program: 2015 Report. Available online: https://www.tucsonaz.gov/files/transportation/files/ForWeb_Bike_Ped_Annual_Report_0.pdf (accessed on 8 February 2021).
- District of Columbia Annual Report. Available online: https://ddot.dc.gov/ (accessed on 8 February 2021).
- Witlox, F.; Tindemans, H. Evaluating bicycle-car transport mode competitiveness in an urban environment: An activity-based approach. World Transp. Policy Pract. 2004, 10, 32–42. Available online: http://www.eco-logica.co.uk/pdf/wtpp10.4.pdf (accessed on 28 March 2005).
- Promoting Non-Motorized Transport in Asian Cities: Policymakers’ Toolbox. Available online: https://unhabitat.org/sites/default/files/download-manager-files/Promoting%20NMT%20in%20Asian%20CitiesS.pdf (accessed on 8 February 2021).
- The National Bicycling and Walking Study: 15-Year Status Report. Available online: http://www.pedbikeinfo.org/cms/downloads/15-year_report.pdf (accessed on 8 February 2021).
- Traffic Safety Facts: Bicyclists and Other Cyclists. Available online: https://crashstats.nhtsa.dot.gov/Api/Public/ViewPublication/812765 (accessed on 8 February 2021).
- DiGioia, J.; Watkins, K.E.; Xu, Y.; Rodgers, M.; Guensler, R. Safety impacts of bicycle infrastructure: A critical review. J. Safety Res. 2017, 61, 105–119. [Google Scholar] [CrossRef] [PubMed]
- Mateu, G.; Sanz, A. Public policies to promote sustainable transports: Lessons from Valencia. Sustainability 2021, 13, 1141. [Google Scholar] [CrossRef]
Figure 1.
Map of 28 US cities with five-year (2013–2017) average bicycle commute shares.

Table 1.
Illustrations of bikeway infrastructure 1.
| Location | Bikeway Types | Bicycle–Vehicle Exposure | Vehicle Traffic Passing by | ||
|---|---|---|---|---|---|
| Volume (ADT 2) | Speed (mph) | ||||
| Off-street | Bike path | An off-road pathway for bicycling. The shared-use path for both bicycling and walking is also included. | Completely separated. | ||
| On-street | Protected bike lane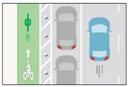 | Also known as “cycle track,” it is an exclusive bikeway protected by vertical barriers, such as curbs, bumps, bollards, and parked vehicles. | Completely separated. | ||
Buffered bike lane | A bike lane paired with an additional painted buffer zone. | Moderate separation, interaction exists. | <15,000 | 25–30 | |
Bike lane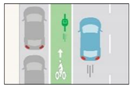 | A painted dedicated space for bicycling, including shoulder bike lane, contra-flow bike lane, and bike lane in the uphill direction of a climbing bike lane. | Moderate separation, interaction exists. | <8000 | 25–30 | |
Shared lane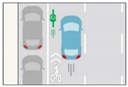 | Also known as “sharrow,” it is a travel lane where bicycles and vehicles share the same space, including the shared lane in the downhill direction of a climbing bike lane. | Exposed to vehicles, interaction exists. | 3000–15,000 | 25–30 | |
Bicycle boulevard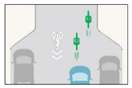 | Also called “bicycle street, or neighborhood greenway,” it is a residential street with traffic calming interventions. Bicycling has absolute priority. | Exposed to vehicles, but bicyclists have priority. | <1500 | Speed limit up to 25 | |
1 Consulting from two authoritative manuals: Guide for the Development of Bicycle Facilities (https://nacto.org/wp-content/uploads/2015/04/AASHTO_Bicycle-Facilities-Guide_2012-toc.pdf, accessed on 8 February 2021) and Urban Bikeway Design Guide (https://nacto.org/publication/urban-bikeway-design-guide/, accessed on 8 February 2021). 2 Average daily traffic.
Table 5.
Modeling results.
| Variables | Base Model | Full Model | ||||||
|---|---|---|---|---|---|---|---|---|
| Unstandardized Coef. | Standardized Coef. | p-value | Unstandardized Coef. | Standardized Coef. | p-value | |||
| B | Std. Err. | B | Std. Err. | |||||
| Bikeway provision-related variables | ||||||||
| Annual bikeway kilometers per square kilometer | 0.090 | 0.044 | 0.188 | 0.041 * | ||||
| Annual bikeway kilometer per 10,000 population | 0.027 | 0.009 | 0.251 | 0.002 ** | ||||
| Annual proportion of C1 bikeways | 1.623 | 0.345 | 0.400 | 0.000 *** | ||||
| Social–demographic variables | ||||||||
| Annual proportion of male commuters | −8.657 | 3.573 | −0.233 | 0.015* | −3.488 | 3.012 | −0.094 | 0.247 |
| Annual proportion of commuters earning ≤ USD 14,999 | −1.712 | 1.958 | −0.092 | 0.382 | −0.254 | 1.808 | −0.014 | 0.888 |
| Annual proportion of commuters with 0 vehicle | 2.029 | 2.230 | 0.069 | 0.363 | 8.188 | 2.596 | 0.280 | 0.002 ** |
| Transport mode choice-related variables | ||||||||
| Annual retail gasoline price | 0.531 | 0.167 | 0.476 | 0.002** | 0.238 | 0.105 | 0.213 | 0.023 * |
| Annual transit revenue kilometers per 10,000 population | 0.036 | 0.060 | 0.053 | 0.551 | 0.007 | 0.051 | 0.010 | 0.898 |
| Climatic variables | ||||||||
| Annual mean temperature | −0.044 | 0.011 | −0.309 | 0.000 *** | −0.016 | 0.011 | −0.113 | 0.157 |
| Annual inches of precipitation | 0.005 | 0.003 | 0.149 | 0.059 | 0.008 | 0.003 | 0.231 | 0.002 ** |
| Constant | −0.206 | 2.045 | 0.920 | −3.943 | 1.761 | 0.025 * | ||
| R-squared | 0.436 | 0.607 | ||||||
| Adjusted R-squared | 0.411 | 0.582 | ||||||
Significant levels: * p < 0.05, ** p < 0.01, *** p < 0.001.
Publisher’s Note: MDPI stays neutral with regard to jurisdictional claims in published maps and institutional affiliations. |
© 2021 by the authors. Licensee MDPI, Basel, Switzerland. This article is an open access article distributed under the terms and conditions of the Creative Commons Attribution (CC BY) license (http://creativecommons.org/licenses/by/4.0/).
Share and Cite
MDPI and ACS Style
Yang, Q.; Cai, J.; Feng, T.; Liu, Z.; Timmermans, H. Bikeway Provision and Bicycle Commuting: City-Level Empirical Findings from the US. Sustainability 2021, 13, 3113. https://doi.org/10.3390/su13063113
AMA Style
Yang Q, Cai J, Feng T, Liu Z, Timmermans H. Bikeway Provision and Bicycle Commuting: City-Level Empirical Findings from the US. Sustainability. 2021; 13(6):3113. https://doi.org/10.3390/su13063113
Chicago/Turabian StyleYang, Qiyao, Jun Cai, Tao Feng, Zhengying Liu, and Harry Timmermans. 2021. "Bikeway Provision and Bicycle Commuting: City-Level Empirical Findings from the US" Sustainability 13, no. 6: 3113. https://doi.org/10.3390/su13063113
Note that from the first issue of 2016, this journal uses article numbers instead of page numbers. See further details here.