
Time Allocation between Paid and Unpaid Work among Men and Women: An Empirical Study of Indian Villages
by
 , , and
A. Amarender Reddy
1,* ,
,
Surabhi Mittal
2 ,
,
Namrata Singha Roy
3 and
and
Sanghamitra Kanjilal-Bhaduri
4
1
Indian Council of Agricultural Research-Central Research Institute for Dryland Agriculture, Hyderabad 500059, India
2
Agricultural Economics Research Association (AERA), New Delhi 110012, India
3
Department of Economics, Christ University, Bengaluru 560029, India
4
Department of Economics, University of Algarve, 8005139 Faro, Portugal
*
Author to whom correspondence should be addressed.
Sustainability 2021, 13(5), 2671; https://doi.org/10.3390/su13052671
Submission received: 30 December 2020
/
Revised: 5 February 2021
/
Accepted: 20 February 2021
/
Published: 2 March 2021
(This article belongs to the Special Issue Agricultural Production and Global Climate Change: Social, Cultural, and Agroecological Aspects of the Agriculture/Climate Interface)
Abstract
:The paper examines the time allocation between paid work (wage earning or self-employed work generally termed as employment work) and unpaid (domestic chores/care work generally termed as non-employment work) along with wage rates, imputed earnings, and occupational structure among men and women and according to different social groups to establish the extent to which the rural labour market is discriminated by sex and social group. The major objective of the paper is to show the differential in wage income between men and women in farm and non-farm activities. The paper also shows the division of time between employment and non-employment activities by men and women. The paper uses high-frequency data and applies econometric techniques to know the factors behind time allocation among different activities across gender. The study finds that males spend more hours on employment work and work at a higher wage rate than females. As a result, a vast monetary income gap between men and women is observed, even though women worked more hours if employment and non-employment activities are jointly taken into consideration. Time spent on employment work and non-employment (mainly domestic chores) has been found to vary significantly due to social identity, household wealth, land, income, education, and skill. The segregation of labour market by sex was evident in this study, with men shifting to non-farm occupations with greater monetary returns and continued dependence on women’s farm activities. Enhancing the ownership of land and other assets, encouraging women’s participation particularly among minorities, and improving health are some of the policy recommendations directed from this study to enhance participation in employment work and shifting towards higher wage income employment.
1. Introduction
Over the past two decades, India has emerged as one of the fastest-growing economies [1] in the world, with far-reaching changes in its rural economy as much as in the overall economy. Of all the emerging economies, India remains predominantly rural with a two-third population and about seventy per cent of its workforce [2] working and living in rural areas. In recent years, there has been increased dynamism and movements in the labour markets based on education, skills, and growing non-farm employment opportunities [3,4,5]. Men and women mostly work in the informal sector with flexible allocation for employment work (remunerated work or market activities, which included paid and self-employed) and non-employment work (which include unremunerated or non-market work such as domestic chores/home care). Several studies indicate that employment work and wage rates increase with education in the informal sector [6,7,8,9,10,11,12,13]. For male workers, the labour supply curve (supply to employment work) mostly depicts a negative slope for greater responsiveness to the income effect than the substitution effect, whereas for females, substitution effect work is more potent than the income effect and, hence, depicts a forward bending curve [14,15,16]. A study based on Labour Bureau Survey of Pakistan by [17] mentioned that at a micro level the questions relate to vulnerability, “hidden underemployment” in terms of hours of work, measuring the productivity and contribution to income of unpaid (non-employment) family workers within the household economy and socio-demographic household determinants of entry into this specific employment status.
According to [18], an important aspect that generally gets missed in the studies on women’s employment trends relates to how much women’s work participation is in the form of unpaid labour. [19] states that the intersections of paid and unpaid work must be considered to provide a coherent perspective of gender differences in work. Gender-based wage differentials and occupational segregation characterize the labour division among men and women in paid work. Yet, unpaid work in social reproduction, subsistence production, family businesses, and the community is often ignored. A study by [20] reveals that women’s involvement in paid activities has consistently declined. They observe that the amount of unpaid work activities of women has increased substantially. Moreover, the increase in unpaid activities is more intense for those women who are less educated, marginalized, and belong to impoverished households. [21], in their study on the Indian rural labour market, has shown that the push factors are more substantial at the lower end of the spectrum, while pull factors and the opportunity cost of not working are more potent at the upper ends.
While labour supply and wage determination models give a demand–supply framework of the labour market, it assumes that the market is perfectly competitive. However, in reality, the labour market is too segmented. There is a fundamental duality within the informal sector, whereby some people work in a lower tier because they can do no better. In contrast, others work in an upper tier where entry is restricted because of human capital and financial capital requirements [22]. In rural labour markets, regular/salaried employment such as teachers, health workers, clerks, etc., is mostly occupied by educated and socially forward communities. [23] proposed an integrated labour market model, assuming that all of the equilibrating forces that apply to a single labour market also applied to a labour market with a multiplicity of sectors so that wages equalize across sectors [24]. The labour market in developing countries consists of a small number of labour market segments or sectors linked to one another by actual or potential mobility of workers and firms [25,26]. A comparative study between Vietnam and India by [27] showed that access to rural non-farm employment significantly reduces vulnerability in both countries. However, the ILO study found that in most economies, women still earn 90 per cent or less of what their male co-workers earn [28]. Therefore, it is required to put together these various segments into one model, as conditions in one segment affect and are affected by conditions in other segments.
The above discussion suggests a large gap in the literature on understanding rural labour markets through a holistic and multidisciplinary perspective, mostly due to the lack of individual-level data that would integrate the socioeconomic, nutritional, and local factors. Therefore, the current study examines the relationship between paid and unpaid work concerning time allocation, wage rates, and occupational structure among men and women and among different social groups to establish the extent to which the rural labour market is segmented by sex and social group.
The major objective of the paper is to show the differential in wages between men and women in farm and non-farm activities. The paper also shows the division of time between paid and unpaid activities by men and women. Further, the specific research objective of the paper is to examine the influence of different socio-economic characteristics of workers on wage rates. Further, the paper investigates the impact of various socio-economic characteristics of workers on the choice of occupation among men and women.
2. Data
This paper uses the household level data collected under the project “Village dynamics studies in South Asia” by the International Crops Research Institute for the Semi-Arid Tropics (ICRISAT).
The paper uses historical data from 1975 to 2010 for six villages—two (Aurepalle and Dokur of Mahabubnagar district) for the state of Telengana, four (Kalman and Shirapur from Solapur district and Kinkhed and Kanzara of Akola district) for State of Maharashtra—to show the long-term trend in time spent on paid and unpaid work by both men and women. These data were collected at every 15-day interval by the resident field investigators, using a detailed questionnaire (the questionnaire and data collection methods, along with the data, are available at http://vdsa.icrisat.ac.in (accessed on 1 March 2021)), and personal interviews were conducted with every person in the selected household located in each village. All individuals between 15 and 65 years of age were selected for the analysis.
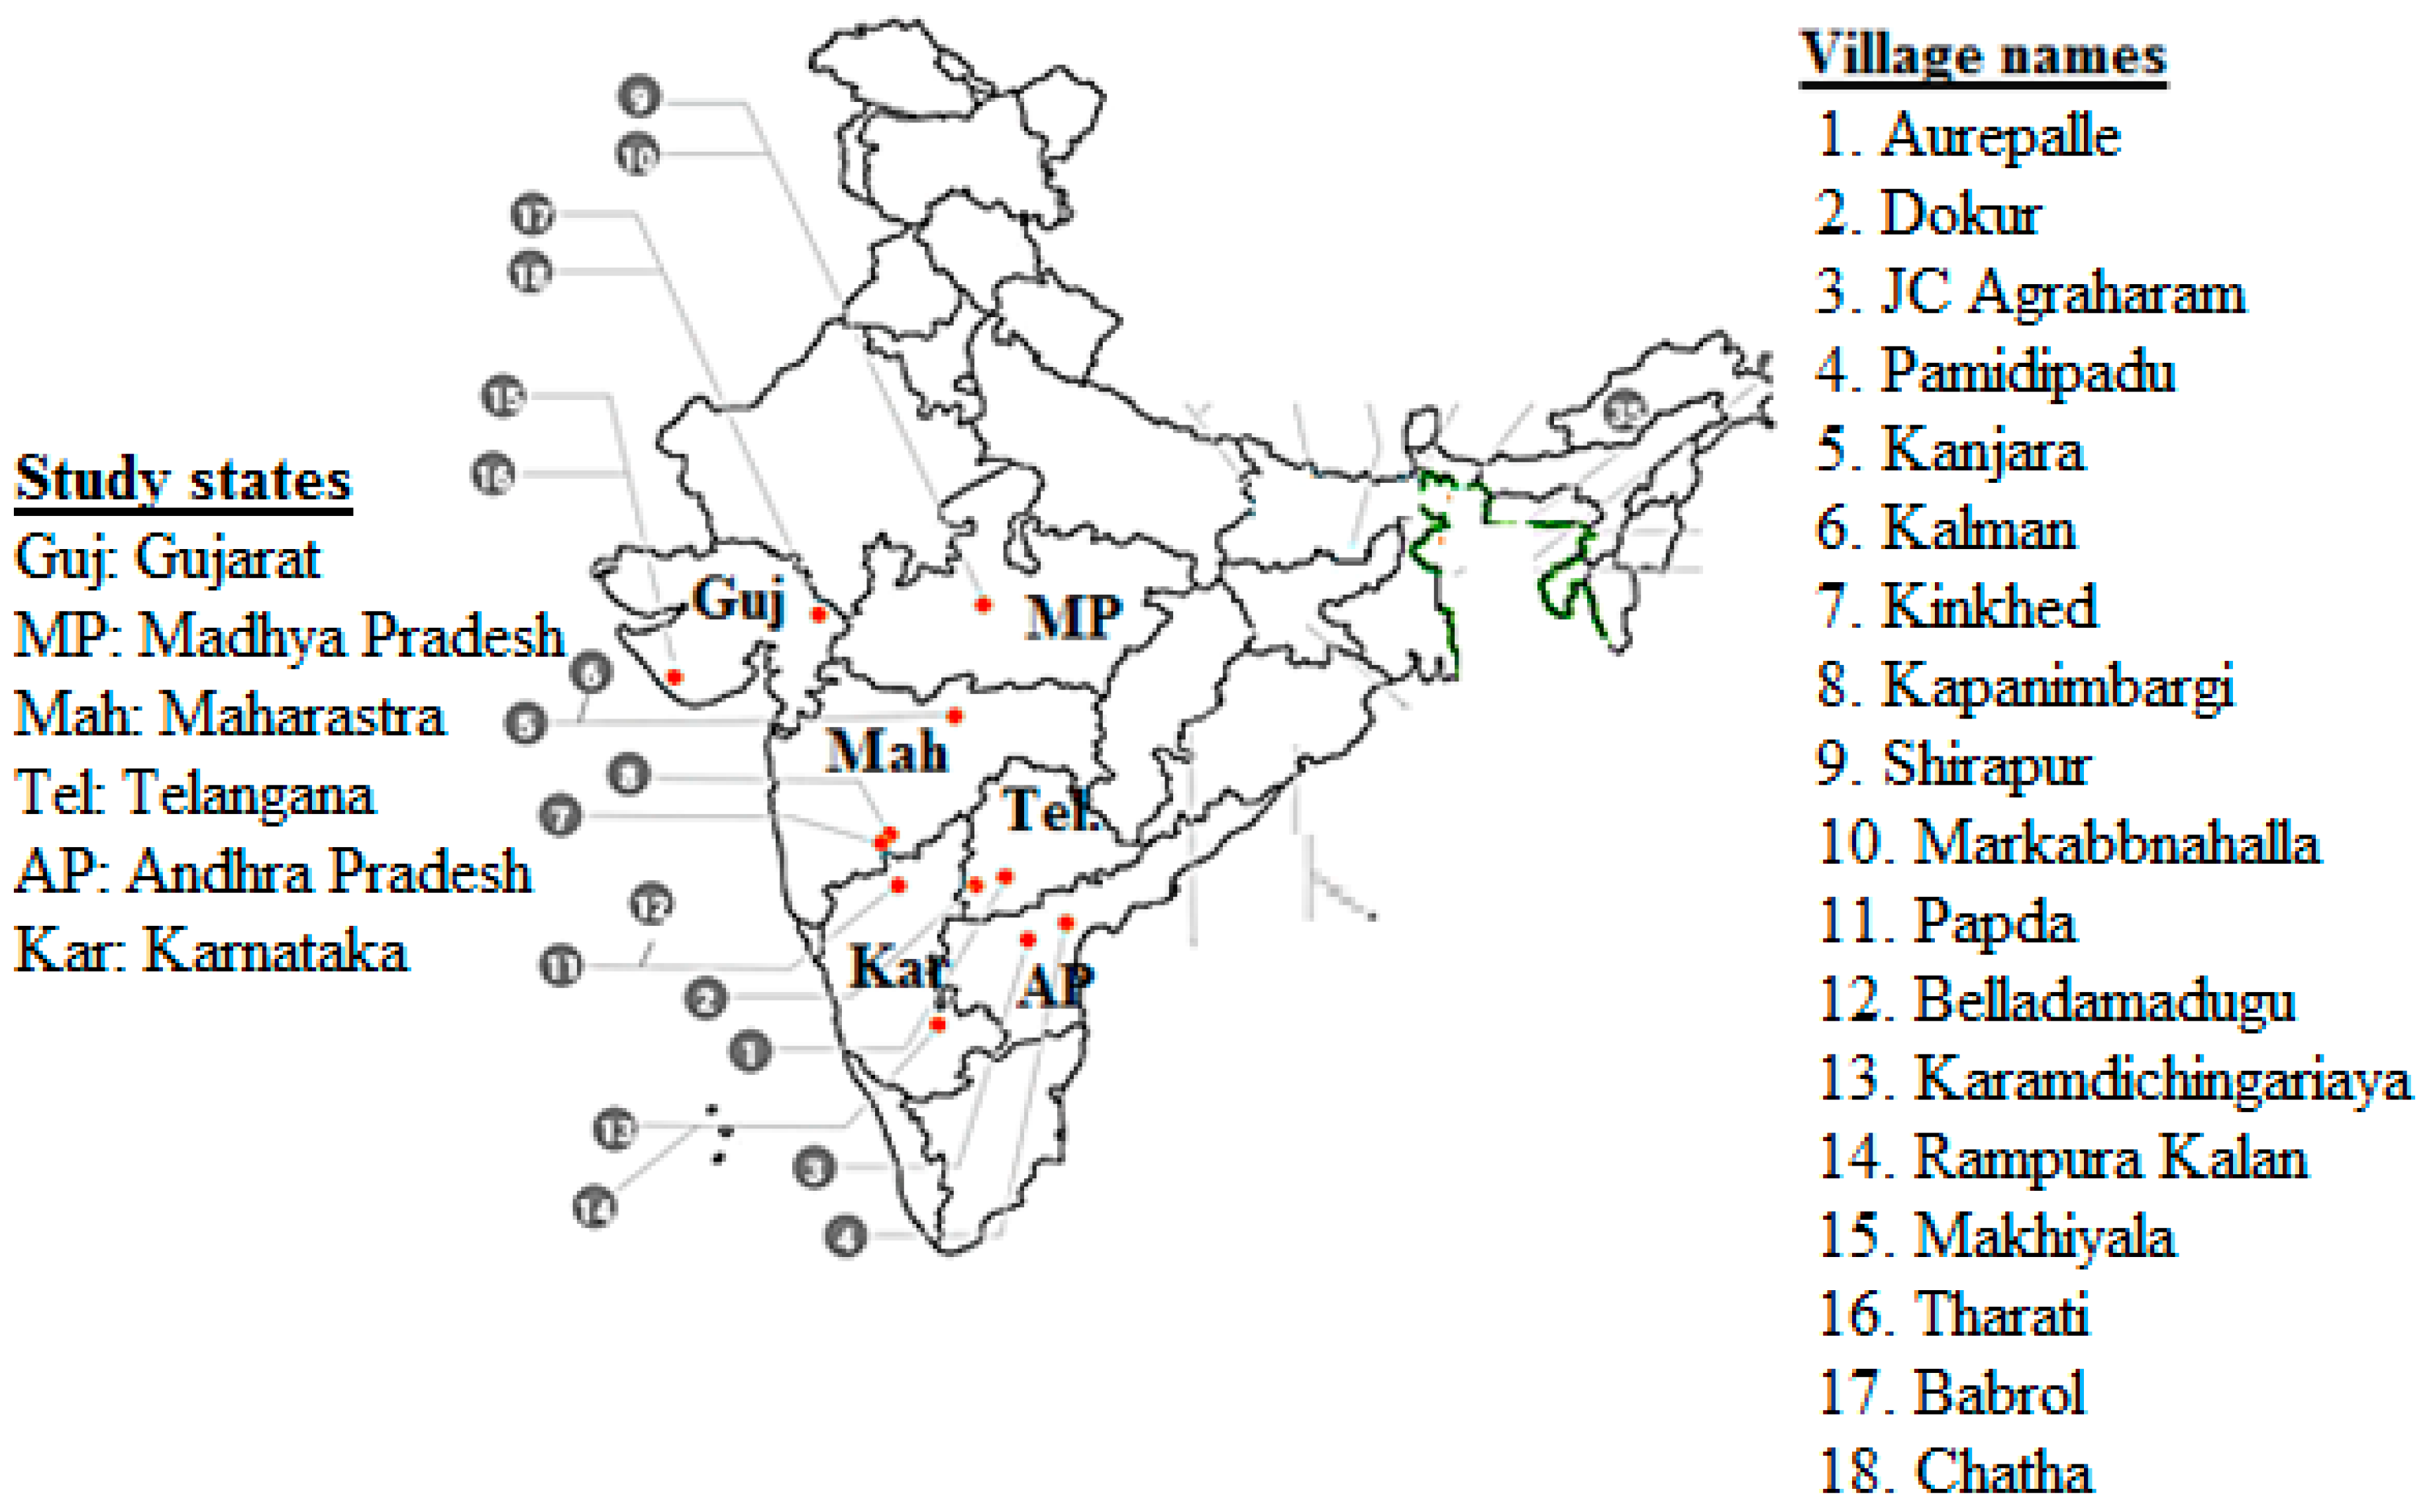
For the broader objective of the study and for analysis of the labour supply model, the paper uses the data of 1260 sample households from 18 selected villages of India for the year 2014 (the data have been collected under the project “Village dynamics studies in South Asia” conducted by ICRISAT. Two thousand and fourteen was the last survey round. After that, due to some administrative glitch, the project was halted). The data used in this paper were obtained from a larger research project entitled “Village dynamics studies in South Asia (VDSA)”. Under the project, a research team from the International Crops Research Institute for the Semi-Arid Tropics (ICRISAT) collected a range of data from households in 18 selected villages in 5 states (Andhra Pradesh, Maharashtra, Madhya Pradesh, Gujarat, and Karnataka) (Figure 1). Due care was taken so that those villages represented broad agro-climatic sub regions in the semi-arid tropics of India. The data were collected every 15 days by resident field investigators through personal interviews with each individual in the household in each village by using a standard questionnaire. The survey questionnaires included: (i) census of all households, (ii) GES—general endowments survey, (iii) transaction module, (iv) livestock, (v) employment schedule, (vi) plot list and cropping pattern, (vii) cultivation schedule, (viii) monthly price schedule, (ix) daily rainfall. For this study, the employment schedule along with the census of households and general endowment survey schedules were used. The VDSA questionnaires, data collection methods, and the data are available from http://vdsa.icrisat.ac.in/ (accessed on 1 March 2021). According to the best of knowledge of the authors, no similar study is available in the literature, hence an analysis using data for the year 2014 will be effective to fill in the literature gap on this issue.
These households are selected based on the stratified random sampling method to represent the landless (owning less than 0.30 acre), small-scale farmers (with 0.31–2.50 acre), medium-scale farmers (with 2.51–5.00 acre), and large-scale farmers (with more than 5.0 acre) in proportion to the total population in each village. Of the total sample, households of 1260 men respondents were 948 and women respondents were 631. To take advantage of the high frequency of the data, variations in hours worked and wage earnings by sex, level of education, paid work (all remunerative or market employment such as casual agricultural labour, regular/salaried employment, self-employed in agriculture, rearing livestock, self-employed in non-agricultural work), and unpaid (domestic/care duties, which are also called non-employment or unremunerated) are analysed.
Unpaid (otherwise known as non-employment or unremunerated or non-market) work includes (i) household management: cooking, cleaning washing, sleeping, etc., (ii) “care” activities: taking care of children, elderly people, the sick and disabled, (iii) production of goods for self-consumption such as stitching cloths, making mats, jams and pickles, etc., (iv) collection of free goods, such as fuel, fodder, water, fruits, fish, etc., (v) other services such as, transporting children, etc., as well as servicing and repairing the house and household durables, vehicles, etc., and (vi) social work—voluntary work for the community.
3. Methodology
The paper analyses the labour supply model and [29] wage model. To avoid the problem of sample selection bias, the Heckman selection bias criteria [30] has also been used. The specifications of the models are given below.
- (a)
- Labour supply model (paid work)
The data were collected at a high frequency for each year, and they record the number of hours spent on each paid and unpaid activity. The data were collected for each day of the year; hence, there is a record for 365 days for the year of study.
The analysis was based on time use survey of each individual. The activities included in the analysis are classified as paid work: (a) hired work (farm and non-farm, with a wage rate); (b) self-employed in agriculture, (c) rearing livestock, and (d) self-employed in non-agricultural work. The unpaid work or not working includes (a) attending to domestic/care duties (such as cleaning utensils, washing clothes, cooking, and preparing children for school), (b) being seriously ill, and (c) being unemployed (these are people who are looking for a job but could not find a job). The leisure activities hours are not accounted for in the analysis. For analytical purposes, we have first calculated the number of hours in all the above activities by both men and women in a year and then divided by 52 to arrive at hours spent per week for different activities.
The labour supply model (for paid work) used for the analysis is specified as:
where i is each individual.
- Y = labour supply measured as hours worked in paid work per week
- = wage rate (INR/day) (8 hr per day is counted as a work day)
- = farm size (acre)
- = irrigated area (acre)
- = value of assets (e.g., land, agricultural tools, equipment, and house) (in INR)
- = caste dummies
- = caste dummies
- = religion dummies
- = gender
- = number of years of schooling
- = experience (no. of years in work after schooling)
- = square experience
- = arm circumference (cm)
- = error term
The independent variables used in the regressions and the rationale for inclusion are explained in Table 1.
- (b)
- Mincer equation
A Mincer earnings function is a single-equation model that explains wage income as a function of schooling and experience. In the equation, the logarithm of income is modelled as the sum of years of education and a quadratic function of the number of years of potential labour market experience. However, in this study, we have used a modified Mincer equation to include various other variables such as farm size, irrigated area, caste dummies, etc.
The modified Mincer equation used for the analysis is specified as:
where i is persons who worked in economic activities (both paid and unpaid self-employment)
- Yi = wage rate (INR/day) (8 working hours is considered as one day)
- = farm size (acre)
- = irrigated area (acre)
- = value of other assets (e.g., agricultural tools, and equipment’s and house) (in INR)
- = caste dummies
- = religion dummies
- = number of years of schooling
- = experience (no. of years in work after schooling)
- = square experience
- = arm circumference (cm)
- = main occupation dummies
- = error term
The independent variables used in the regressions and the rationale for inclusion is explained in Table 1.
Historically, most of the previous studies based on the Mincer equation only studied wage rates for regular/salaried workers. However, in this study, we have computed labour income for the self-employed in their own farm, livestock rearing, and petty business based on actual net earnings (gross earnings minus cost of inputs). For other occupations such as farm labour, non-farm labour, and regular employment, the study took the actual wage rate per day. In the modified Mincer equation, the log of wage incomes= per day was used as the dependent variable with the set of explanatory variables including (i) farm size (acre); (ii) irrigated area (acre); (iii) value of other assets (INR 1000); (iv) caste dummies (Other Backward Classes (OBC) comparison group); (v) religion dummies (Muslim comparison group); (vi) years of schooling; (vii) experience; (viii) square experience, and (ix) main occupation (own farm work as reference category).
4. Results
4.1. Exploratory Analysis
4.1.1. Work Day’s Male and Female
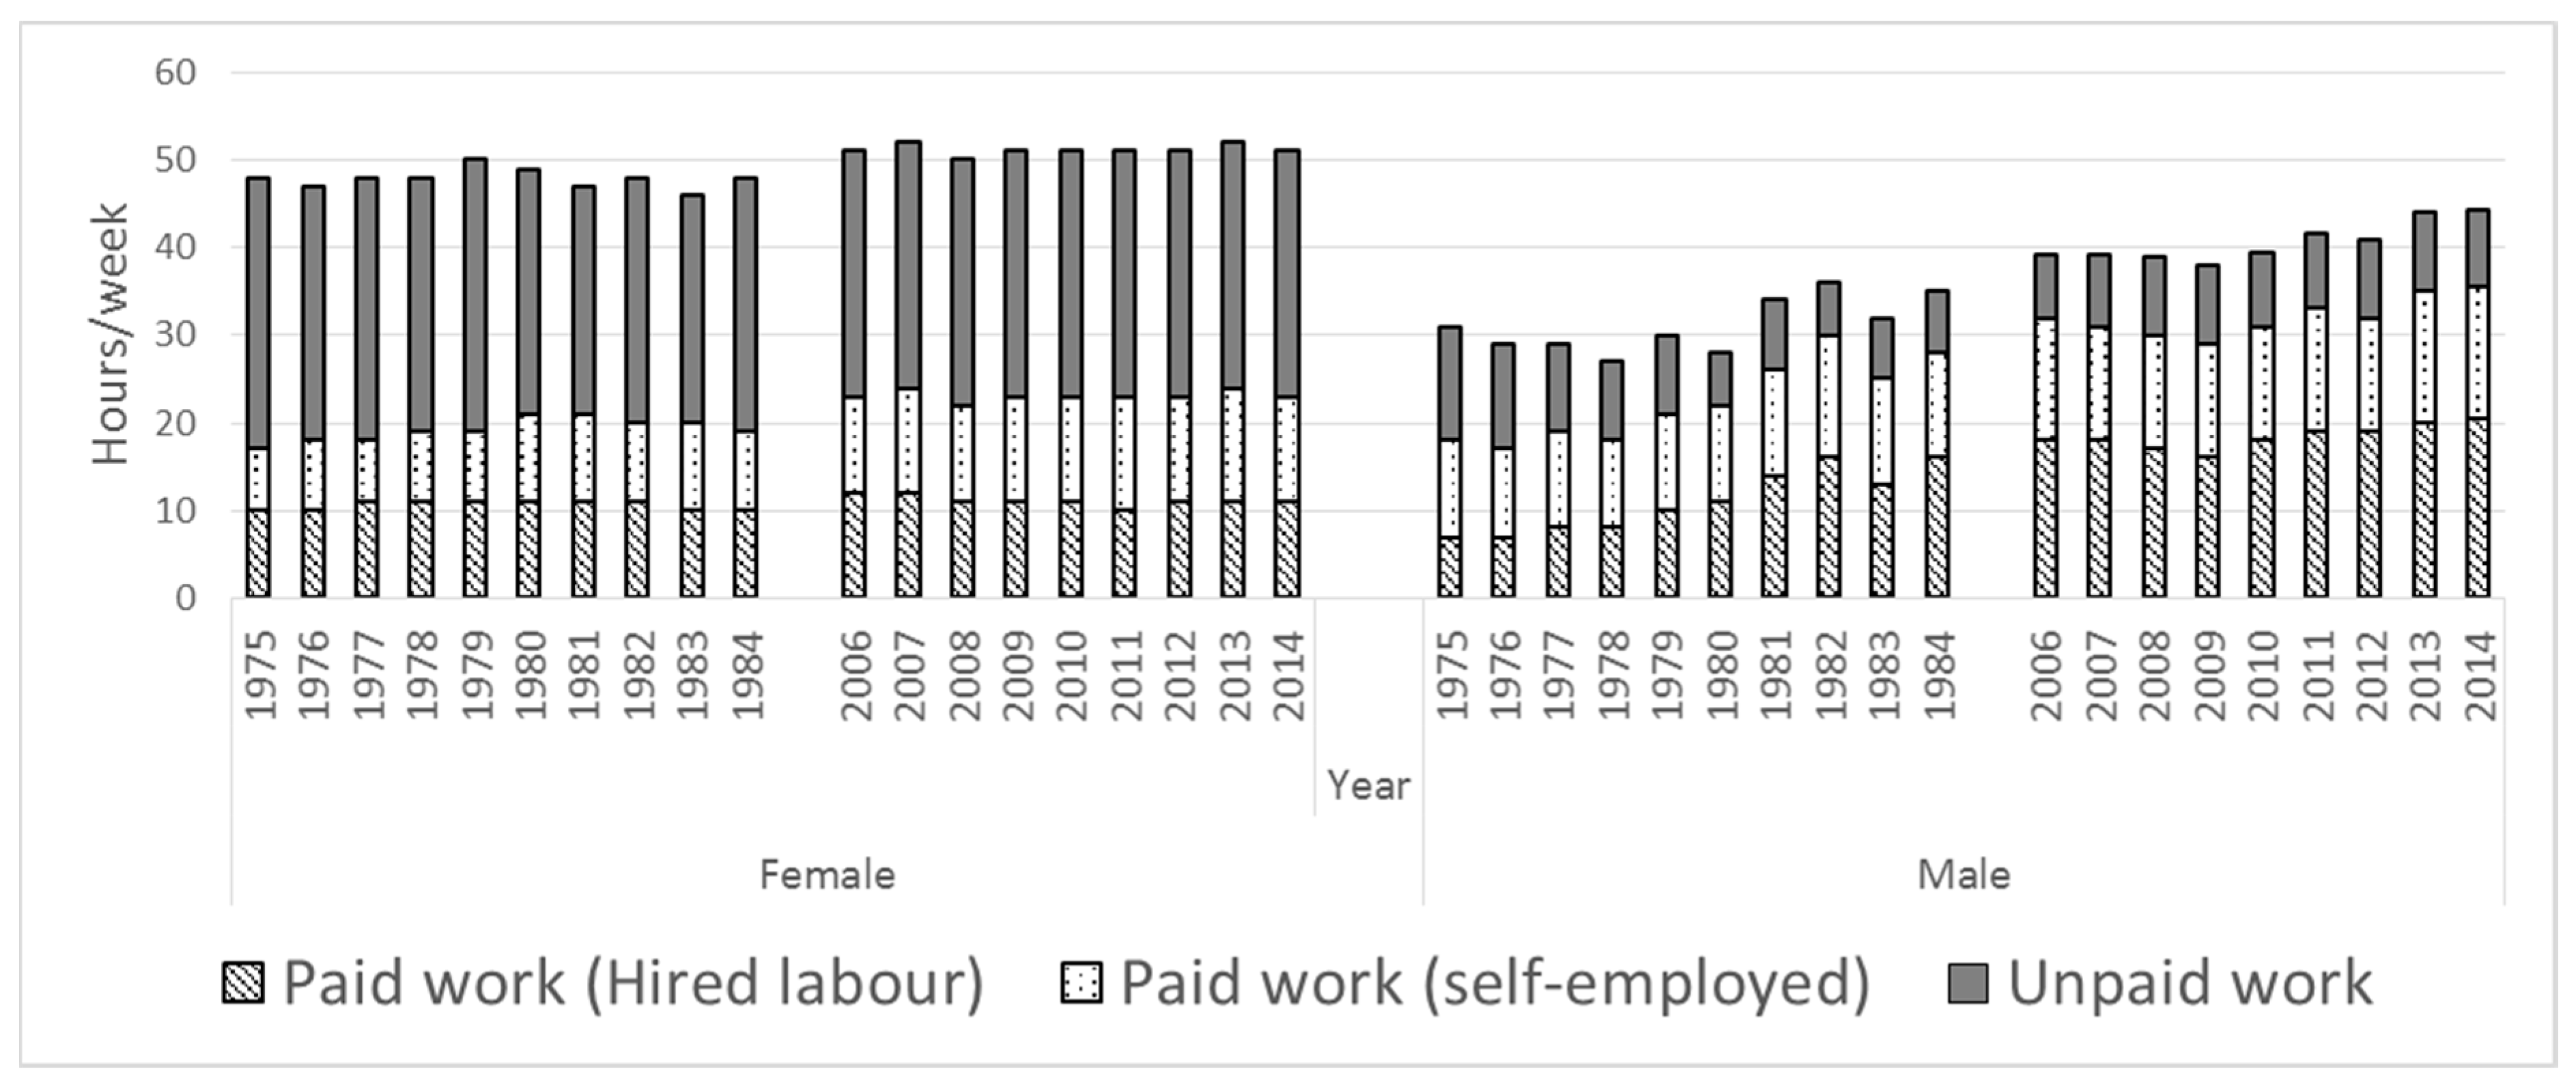
The time series data trends between 1975 and 2014 are plotted for paid (both hired and self-employed) and unpaid work hours for both males and females (Figure 2). It shows that the number of hours spent on paid work (hired work plus self-employed) is lower during the 1970s compared to the late 2000s, especially for men. During the 1970s, mostly traditional pure agrarian economy prevailed. Over time, as the economy moved into the trajectory of development path (1990s globalization also played an important role), involvement in paid work was enhanced. In both periods, hours spent on paid work are higher for males compared to females.
Over the period, the number of activities in paid work (in non-farm sector and others) increased for both men and women compared to the mid-1970s. In addition to this, the favourable monsoon from 2004 to 2010 and the employment guarantee act introduced in 2006 across India increased the demand for labour in agriculture and allied activities, resulting in higher hours spent on paid work among both men and women. The increase in hours worked for men started way back during 1979, but it is still not as high as that of men for women.
Figure 1 also summarizes the work hours per week across gender, unpaid work (which includes home/care/domestic work) over 1975–2014. On average, the number of working hours is higher for females than males for most of the time period. Initially, in 1975, while females work for about 30 h/week in unpaid work, males have only about 10 h/week. In more recent times, 2006 to 2014, females were working about 28 h in unpaid work, while males were working just about 1/3rd of females. Along with this higher burden of domestic work, the greater involvement of females in the farming sector despite farm mechanization exacerbates the double burden of female work. Females mostly perform the planting, weeding, threshing, and fertilizer application work, which requires bending of body with a lot of patience and pain but with less energy consumption, while men do activities such as irrigation, pesticide application, and manure application [32]. Hence, there is a need for widespread availability of improved sickles for weeding and threshing to reduce drudgery and pain and save time for women while doing their usual operations [33].
Time-use analysis studies by researchers, such as [34,35], also show that women though are engaged in more unpaid work, but adding paid work outside the home adds to their burden. In addition to this, there is strong evidence that feminization in agriculture is happening as more women time is being spent on agricultural activities even though their wage rates are low [36].
This result is consistent with the time availability hypothesis, which states that individuals’ time in housework falls with their own time in market labour and rises with their spouses’ time in market labour [37,38,39]. From a theoretical standpoint, the time availability hypothesis predicts that housework will be allocated to the spouse who spends fewer hours in the paid labour market. As women seem to be spending less hours in the labour market via paid work, hence the burden of housework is on women.
4.1.2. Occupation Pattern
Table 2 presents the detail descriptions of the sample data. Of the 948 men between 15 and 65 years of age in the sample, 40 per cent were self-employed in agricultural, 12 per cent were engaged in non-farm labour, 10 per cent were engaged in farm labour, and 8 per cent were participating in regular employment (mostly government servants and salaried employees). Another 8 per cent were involved in small business activities (such as tailoring or textile making), 3 per cent were engaged in rearing livestock, and another 3 per cent were engaged in a traditional caste occupation (such as a washer manor goldsmith). Only 1 per cent were involved in domestic duties. This shows that self-employment in agriculture remains a major economic activity for men in villages, followed by non-farm labour and farm labour. It is interesting to see that a number of male members of the households (14 per cent) were attending higher-education institutions.
Of the 631 women between 15 and 65 years of age in the sample, the main occupations were self-employment in agriculture (29 per cent); attending to domestic duties (21 per cent); farm labourer (21 per cent); rearing livestock (11 per cent). Farm labour and rearing livestock were the dominant activities among the illiterate, while literates were mostly self-employed in the agricultural sector. Although most non-farm labourers had received a middle-level education (6 to 8 years of schooling), the spread was up to 12 years of education. Many women with regular employment (monthly salaried) or engaging in small business work were educated up to the graduate level or above. Farm labourers and non-farm labourers were mostly landless and much younger than women who were self-employed in agriculture or engaged in domestic duties. Women with regular employment or in small business work mainly were in middle age or old age. Women from scheduled castes worked chiefly as farm labourers or non-farm labourers, although some were self-employed in agriculture. Respondents from scheduled tribes were self-employed primarily in agriculture or engaged as farm labourers or rearing livestock. The majority of female workers from other backward classes or forward castes were self-employed in the agricultural sector.
4.1.3. Labour Supply and Earnings
Traditionally, rural society has been divided based on landholdings. Land is an important asset, and possessing land has a positive influence on employment opportunities, especially self-employment in agriculture, which provides better wages and a higher socioeconomic status. The spill overs spread to the labour market, as the landless are discriminated against when acquiring skills or employment. Land ownership has a positive association with hours spent being self-employed in agriculture and rearing livestock, but it is negatively associated with paid labour. It has a positive impact on wage rates, as it will raise reservation wage rates by increasing employment and earnings from the land owned and by enhancing bargaining power in the labour market. The ownership of irrigated land has similar effects on employment opportunities and wage rates.
Table 3 shows the number of hours the survey respondents spent on different activities disaggregated by men and women. Men reported spending a total of 45 h per week on the work listed, of which 36.2 h per week were spent on paid work and only 8.8 h per week on unpaid work. While in contrast, women spent about 23.1 h of their total weekly work hours of 51.2 h on economic paid work and 28.1 h per week on unpaid activities. So, time spent by women on unpaid activities is more than three times of that spent by men.
This division resulted in a confinement of women in household work or in occupations that are close to domestic tasks and care, which are under-valued because they are performed by women. If both paid (hired work and self-employment) and unpaid activities (domestic duties and care) are considered, women worked more hours than men. Regarding paid work, the average wage rate for women was only INR 99/day, while for men, it was INR 200/day of eight hours.
Hence, the annual average income for women was only 7920 compared with 27,000 for men. The gap between women and men’s wages is about 241%. If the self-employed hours of men are imputed at the ongoing wage rate of INR 200/day and women at INR 99/day, the annual income gap between men and women is reduced from 241 per cent to 77 per cent. If the value of self-employed work and domestic duties is imputed at the average wage rate of women (at INR 99/day), then the gap between men’s and women’s imputed income is further reduced to 29.1 per cent. This indicates that if the value of domestic duties of both men and women is imputed, the gap in annual incomes between men and women is drastically reduced from 241 per cent to just 29 per cent. These figures reinforce the phenomenon that women spent more hours in unpaid domestic duties and self-employment than men. Social stigma, limited employment opportunities outside farming, a low level of education and gender discrimination in engaging in higher-paid occupations, such as an electrician, carpentry, and skilled activities, are factors responsible for the lesser involvement of women in paid work as suggested by the literature [40,41].
The activities mentioned in Table 4 as farm work and non-farm work, giving the wage payment in detail clearly shows that women spent greater hours on hired farm work, with lower wage rates, while men spent more hours on hired non-farm work at a comparatively higher wage rate, which is another indication of the segmentation of labour markets by sex.
4.2. Estimation
4.2.1. Labour Supply Model
To know the determinants of labour supply (hours worked per week) for all paid work, the labour supply equation is estimated with total hours worked (for the year 2014) as the dependent variable. Here, the paid work included all hired labour work, self-employment both in farm and non-farm and petty business. The results are presented in Table 5. The simple regression equation is used after correcting the sample selection bias. The pseudo R2 (which is an indicator of the goodness of fit of the model) is 0.27, indicating that the explanatory variables included in the model explain approximately 27 per cent of the variation in occupation choice among the respondents.
Wage rate positively influenced the labour supply for paid work. This implied if wage rates are higher, then more hours per week are spent by the labour. Labour supply is also positively influenced by farm size. Overall, an additional acre of land increased the time spent per worker on economic activities by 13.09 h per week. The coefficient of irrigated area is negative to labour supply. This is explained, as in recent years, farmers have replaced human labour with machines on irrigated agricultural land. The negative association between irrigation and labour supply may also be due to the wealth effect, as farmers with irrigated land earn more income from agriculture. A higher value of assets owned (other than land) had a negative influence on the number of hours spent on paid work, as people with greater assets shift to self-employment, such as rearing livestock or owning a business, which is a positive sign. Additionally, families burdened with debt are more likely to spend greater hours in paid work.
It is not simply land ownership that is important in rural areas, but whether the land is irrigated or not. If the land is irrigated, it is more productive, the owner’s social status is improved, and employment opportunities are created. Irrigated land is also an indication of a higher household income. As was shown in the study, having irrigated land increases the number of hours spent on one’s own farm, livestock, and other domestic activities for both men and women, while simultaneously decreasing the number of hours spent on paid work. When working as paid labourers, those who possessed irrigated land received higher wages than those who did not possess irrigated land. This may be because these workers might have been doing higher-skilled work or have been working only when the local wage rates were higher, such as during the peak harvest season.
Caste dummies show highly significant negative coefficients that imply a prevalence of caste discrimination. In a caste-ridden economy, such as India, social status also plays a significant role in occupation choice. The religion dummy is non-significant. More years of education had a significant negative influence on the number of hours spent on paid work. Since the available paid work in the rural economy is mainly concentrated within informal, inferior, and semi-skilled sectors, higher education is not demanded and is compelled to remain out of the workforce. Several studies [3,42] have suggested that education has a strong linkage with wage payments, even in rural areas. As the education level increases, the general observation is that involvement in paid work for both men and women has decreased.
Work experience had a significant favourable influence on paid work hours, as most of the older and more experienced respondents stayed in paid work. The physical capability indicator, arm circumference, significantly influences paid work hours, as they require more manual labour. Respondents from scheduled castes and scheduled tribes were negatively associated with hours spent on paid economic activities. Men were more likely to spend more hours than women in all economic activities. The study aligns with the finding of [43], where it is mentioned that in rural India, it has been observed that an improvement in the household’s economic position in terms of access to land or income often leads to withdrawal of women from paid work outside the household farms or firms.
4.2.2. Mincer Equation Estimation
A modified Mincer equation has been estimated for only for paid wage earners. The analysis highlights on the labour market segmentation in wage rates. The dependent variable is the wage rate per day in a log form. The explanatory variables included in the model explained approximately 34 per cent of the variation in the wage rate among women and about 45 per cent of the variation among men, as indicated from the adjusted R2.
The theory of dual (or segmented) labour markets states that there is a primary labour market, where workers are offered high wages and good conditions to obtain higher levels of productivity, and a secondary market, where lower levels of pay, poor conditions, and insecure employment predominate, producing lower productivity. Women are concentrated in jobs within the secondary market as a result of restrictions on their labour market options. This contributes to the gender pay gap as seen in the results of Table 6.
Since women, in general, are mostly engaged as casual labourers in agriculture, the study finds little impact on human, physical, and social background of the workers on wage rates. By contrast, among men, educated workers with more assets or land, who belonged to forward castes or minority religions or who had greater arm circumference received significantly more wages per day than the other respondents. Forward caste women preferred not to work as paid workers, due to the stigma attached to involvement in paid work, and are mostly engaged in domestic duties, compared with lower-caste women. There is a greater influence of social stigma attached to women working outside the home from a socially better off family in a patriarchal structure, as it symbolizes lower social status. Many studies [44,45,46] have reported that minorities, especially Muslim women, are disadvantaged in the labour market. Although, the analysis does not show any statistically significant coefficients. [47] have found that women in the Muslim cultural group do more extra-domestic work due to higher cultural restrictions than women in other cultural groups. Hindu women worked more hours self-employed in agriculture and rearing livestock.
As education increases, the hours remaining unemployed are increased for women, which is alarming. Only if women are educated at graduation and above, then it reduces the unemployed hours. The hours spent on domestic duties are also substantially higher than males; the hours for women are four times higher than males, irrespective of educational level, which depicts the double burden of female work.
Male workers engaged in non-farm labour, regular employment, or small business activities also received higher wage rates than those in the other occupational groups.
Employment opportunities in paid work were higher for men with a middle-level education but not for educated women. This is a reflection of the segmentation of labour based on sex in respect of education. In rural areas, an employment opportunity is mostly available for semi-skilled men, such as carpenters, repairers in a two-wheeler/agricultural implement repair shop, electricians, bricklayers, or cleaners. It is difficult for women to find paid employment appropriate to their education level, due to entry barriers created by social rigidities and traditions [48,49,50]. Hence, they are mostly concentrated within informal, inferior, semi-skilled work, for which higher education is not demanded, and they are compelled to remain out of the workforce. This could also be justified by observing the hours that women remain unemployed.
Generally, while women were engaged mostly in low-paying casual labour in the agricultural sector, men worked in various occupations, in which they received higher wage rates. Human capital theory explains such a gap through reference to differences in the innate abilities of men and women or differences in their experience and educational or training investment, which translates into differences in productivity. It is also possible that women receive lower wages than men as a result of discrimination in the labour market. Discrimination may impact directly on earnings of women; it may also have an indirect effect upon income levels if it plays a role in determining the employment patterns of men and women. Finally, it is theorised that women may place less importance upon the level of earning associated with work and opt for work that has other preferred characteristics, whereas men may opt for higher-paying employment, placing greater importance upon monetary remuneration. Other implicit constraints influencing such preferences should be taken into consideration in these discussions.
5. Conclusions and Policy Options
The present study attempts to analyse jointly paid–unpaid time allocation and the wage gap in rural India using primary data of 18 villages. Overall, the study finds that males are spending more significant hours on economic activities compared to females. Of the economic activities, men’s participation in paid work has been higher than females. As a result, a vast monetary income gap between men and women is observed, even though women worked more hours if economic and non-economic activities are taken into account. The study also indicates that, if the value of domestic duties of both men and women is imputed, the gap in annual incomes between men and women is drastically reduced. The segregation of the rural labour market by sex was evident in this study, with men shifting to non-farm occupations with higher wage rates and women still depending on-farm work (either self-employed or as casual labourers). Agriculture has been found to continue its trend to feminization. The higher wage rates for men in non-farm occupations, women’s greater involvement in the less-remunerative agricultural sector, the greater participation of women in domestic duties, and higher unemployment among educated women are some of the indicators in this study pointing to the discrimination against women in rural labour markets in India. The labour supply function estimation confirms the positive influence of wage rate, farm size, work experience, debt, and physical capability on hours spent on paid activities. At the same time, a negative association is observed with irrigated land, education, scheduled castes, and scheduled tribes. In line with this model, the wage estimation model showed that women were mostly engaged in low-paying casual labour in the agricultural sector, while men worked in various occupations with greater wage returns. The respondents from scheduled tribes were found to be primarily self-employed in agriculture or engaged as farm labourers or in rearing livestock. Women from scheduled castes were mainly working as farm labourers or non-farm labourers. Farm labourers and non-farm labourers were mostly landless and much younger than women who were self-employed in agriculture or engaged in domestic duties. Women with regular employment or involved in small business work were mostly in middle age or old age.
The study calls for specific policy prescriptions that include (a) enhancing the ownership of assets such as land and irrigated areas, which would increase the number of hours spend on economic activities; (b) encouraging participation of women belonging to minorities in self-employment in agriculture, which can be promoted through the distribution of government surplus land to these women for cultivation; (c) enhancing the skills and education of workers living in rural areas, so they can take advantage of growing employment opportunities in the non-farm sectors; (d) mechanizing harvesting and weeding to improve women’s productivity rather than replace women in agriculture; (e) skill and entrepreneur development with a focus on middle-educated rural youth involving both females and males.
Author Contributions
Conceptualization, A.A.R., S.M. and N.S.R.; methodology, A.A.R. and N.S.R.; software, A.A.R.; validation, A.A.R. and N.S.R.; formal analysis, A.A.R.; investigation, A.A.R., S.M., N.S.R. and S.K.-B.; A.A.R.; data curation, A.A.R.; writing—original draft preparation, A.A.R. and N.S.R.; writing—review and editing, S.M. and S.K.-B.; supervision, A.A.R.; project administration, A.A.R.; All authors have read and agreed to the published version of the manuscript.
Funding
The authors received no financial support for the research, authorship, and/or publication of this article.
Institutional Review Board Statement
This study is based on secondary data which is freely accessible. Hence Ethical review and approval were waived for this study.
Informed Consent Statement
Not applicable.
Data Availability Statement
The study is based on publicly archived datasets. http://vdsa.icrisat.ac.in/ (accessed on 1 March 2021).
Acknowledgments
This paper has been presented at 6th Regulating for Decent Work (RDW) Conference organized by ILO Geneva, 8–10 July 2019. We acknowledge the valuable comments and suggestions of the panellists and incorporated all the comments. The usual disclaimer, however, applies.
Conflicts of Interest
The authors declared no potential conflicts of interest concerning the research, authorship, and/or publication of this article.
References
- Reserve Bank of India. Handbook of Statistics on Indian Economy 2019–20; Reserve Bank of India: Mumbai, India, 2019.
- Census. 2011. Available online: https://censusindia.gov.in/2011-common/censusdata2011.html (accessed on 15 December 2020).
- Reddy, A. Rural labour markets: Insights from Indian villages. Asia-Pac. Dev. J. 2014, 21, 107–136. [Google Scholar] [CrossRef]
- Singha Roy, N.; Mukhopadhyay, I. Emerging Challenges of Rural Labor Market: Insights from Indian Villages. Arthaniti: J. Econ. Theory Pract. 2019, 18, 86–103. [Google Scholar]
- Psacharopoulos, G.; Arriagada, A.M. The educational composition of the labour force: An international comparison. Int. Labour Rev. 1986, 125, 561–574. [Google Scholar]
- Henri, A.O. Education and wage inequality in the informal sector: The case of Cameroon. Int. Labour Rev. 2019, 158, 561–576. [Google Scholar]
- Kingdon, G.; Patrinos, H.A.; Colclough, C. The Changing Pattern of Wage Returns to Education and its Implications. Dev. Policy Rev. 2010, 28, 733–747. [Google Scholar]
- Sevilla-Sanz, A.; Gimenez-Nadal, J.I.; Fernández, C. Gender roles and the division of unpaid work in Spanish households. Fem. Econ. 2010, 16, 137–184. [Google Scholar] [CrossRef]
- Boye, K. Relatively different? How do gender differences in well-being depend on paid and unpaid work in Europe? Soc. Indic. Res. 2009, 93, 509–525. [Google Scholar] [CrossRef]
- Lewis, J.; Campbell, M.; Huerta, C. Patterns of paid and unpaid work in Western Europe: Gender, commodification, preferences and the implications for policy. J. Eur. Soc. Policy 2008, 18, 21–37. [Google Scholar] [CrossRef]
- Sayer, L.C. Gender, time and inequality: Trends in women’s and men’s paid work, unpaid work and free time. Soc. Forces 2005, 84, 285–303. [Google Scholar] [CrossRef]
- Nordenmark, M. Does gender ideology explain differences between countries regarding the involvement of women and of men in paid and unpaid work? Int. J. Soc. Welf. 2004, 13, 233–243. [Google Scholar] [CrossRef]
- Kingdon, G.; Unni, J. Education and Women? Labour Market Outcomes in India. Educ. Econ. 2001, 9, 173–195. [Google Scholar] [CrossRef]
- Kanjilal, S. Gender Relations in Employment under Overlapping Class Caste and Community Identity. Ph.D. Thesis, University of Calcutta, Kolkata, India, 2016. [Google Scholar]
- Dasgupta, P.; Goldar, B. Female Labour Supply in Rural India: An Econometric Analysis; Working Paper No. 265; Institute of Economic Growth: New Delhi, India, 2005. [Google Scholar]
- Mammen, K.; Paxson, C. Women’s Work and Economic Development. J. Econ. Perspect. 2000, 14, 141–164. [Google Scholar] [CrossRef] [Green Version]
- Shahnaz, L.; Khalid, U.; Akhtar, S. Unpaid Family Workers: Unravelling the Mystery of Falling Unemployment; Discussion Paper Series No: 17; Centre for Research on Poverty Reduction and Income Distribution: Islamabad, Pakistan, 2008. [Google Scholar]
- Mazumdar, I.; Neetha, N. Gender dimensions: Employment trends in India, 1993–1994 to 2009–10. Econ. Political Wkly. 2011, 46, 118–126. [Google Scholar]
- Antonopoulos, R. The Unpaid Care Work-Paid Work Connection. Levy Economics Institute, Working Papers Series. 2009. Available online: https://ssrn.com/abstract=1176661 (accessed on 25 September 2020).
- Singh, P.; Pattanaik, F. Economic status of women in India: Paradox of paid–unpaid work and poverty. Int. J. Soc. Econ. 2019, 46, 410–428. [Google Scholar] [CrossRef]
- Majumder, R. Female labour supply in India: Proximate determinants. Indian J. Labour Econ. 2012, 55, 393–406. [Google Scholar]
- Fields, G.S. Labour Market Modelling and the Urban Informal Sector: Theory and Evidence. In The Informal Sector Revisited; Turnham, D., Salomé, B., Schwarz, A., Eds.; Development Centre of the Organisation for Economic Co-Operation and Development: Paris, France, 1990. [Google Scholar]
- Krugman, P.R.; Obstfeld, M. International Economics, 6th ed.; Addison Wesley: Boston, MA, USA, 2003. [Google Scholar]
- Harris, J.; Todaro, M. Migration, Unemployment, and Development: A Two Sector Analysis. Am. Econ. Rev. 1970, 60, 126–142. [Google Scholar]
- Basu, K. Analytical Development Economics; MIT Press: Cambridge, MA, USA, 1997. [Google Scholar]
- Fields, G.S. Employment in Low-Income Countries: Beyond Labor Market Segmentation. In Employment and Shared Growth; Paci, P., Serneels, P., Eds.; World Bank: Washington, DC, USA, 2007. [Google Scholar]
- Imai, K.S.; Gaiha, R.; Thapa, G. Does non-farm sector employment reduce rural poverty and vulnerability? Evidence from Vietnam and India. J. Asian Econ. 2015, 36, 47–61. [Google Scholar] [CrossRef] [Green Version]
- ILO. World Employment and Social Outlook—Trends 2020; International Labour Office: Geneva, Switzerland, 2020. [Google Scholar]
- Mincer, J. Labour Force Participation of Married Women: A Study of Labour Supply. In Aspects of Labour Economics; Lewis, H.G., Ed.; Princeton University Press: Princeton, NJ, USA, 1962. [Google Scholar]
- Heckman, J.J. The Common Structure of Statistical Models of Truncation, Sample Selection and Limited Dependent Variables and a Simple Estimator for Such Models. Ann. Econ. Soc. Meas. 1976, 5, 475–492. [Google Scholar]
- Tang, A.M.; Dong, K.; Deitchler, M.; Chung, M.; Maalouf-Manasseh, Z.; Tumilowicz, A.; Wanke, C. Use of Cutoffs for Mid-Upper Arm Circumference (MUAC) as an Indicator or Predictor of Nutritional and HealthRelated Outcomes in Adolescents and Adults: A Systematic Review; FHI 360/FANTA: Washington, DC, USA, 2013. [Google Scholar]
- Mittal, S.; Hariharan, V.K.; Kumar, A. Gender Role in agricultural processes and decision making—Empirical Evidence from India. In Proceedings of the 2018 Conference, International Association of Agricultural Economists, Vancouver, BC, USA, 28 July–2 August 2018. [Google Scholar]
- Binswanger-Mkhize Hans, P. The stunted structural transformation of the Indian economy: Agriculture, manufacturing and the rural non-farm sector. Econ. Political Wkly. 2013, XLVIII, 5–13. [Google Scholar]
- Pattnaik, I.; Lahiri-Dutt, K.; Lockie, S.; Pritchard, B. The feminization of agriculture or the feminization of agrarian distress? Tracking the trajectory of women in agriculture in India. J. Asia Pac. Econ. 2018, 23, 138–155. [Google Scholar] [CrossRef]
- Padmaja, R.; Pramanik, S.; Pingali, P.; Bantilan, C.; Kavitha, K. Understanding nutritional outcomes through gendered analysis of time-use patterns in semi-arid India. Glob. Food Secur. 2019, 23, 49–63. [Google Scholar] [CrossRef] [PubMed]
- Padmaja, R.; Bantilan, M.C.S. Feminisation of Agriculture in SAT villages—An Important Driver and Outcome of Agricultural Transformation. In Proceedings of the Workshop on Emerging Issues in South Asian Agriculture, ICRISAT, Hyderabad, India, 17 September 2013. [Google Scholar]
- Gronau, R. Leisure, home production, and work—The theory of the allocation of time revisited. J. Political Econ. 1977, 85, 1099–1123. [Google Scholar] [CrossRef]
- Campaña, J.C.; Giménez-Nadal, J.I.; Molina, J.A. Self-employed and Employed Mothers in Latin American Families: Are There Differences in Paid Work, Unpaid Work, and Child Care? J. Fam. Econ. Issues 2020, 41, 52–69. [Google Scholar] [CrossRef]
- Carta, F.; De Philippis, M. You’ve come a long way, baby. Husbands’ commuting time and family labour supply. Reg. Sci. Urban Econ. 2018, 69, 25–37. [Google Scholar] [CrossRef]
- Klasen, S. What Explains Uneven Female Labor Force Participation Levels and Trends in Developing Countries. World Bank Res. Obs. 2019, 34, 161–197. [Google Scholar] [CrossRef]
- Lahoti, R.; Swaminathan, H. Economic Growth and Female Labour Force Participation in India; Working Paper No. 414; Indian Institute of Management: Bangalore, India, 2013. [Google Scholar]
- Singha Roy, N. Wage Rate: Is this Return to Education or Return to Physical Capability? Evidence from Rural India. Indian J. Labour Econ. 2020, 63, 99–117. [Google Scholar] [CrossRef]
- Verick, S. Female Labor Force Participation in Developing Countries. IZA World Labor 2014, 2014, 87. [Google Scholar] [CrossRef] [Green Version]
- Prakash, N. Improving the Labor Market Outcomes of Minorities: The Role of Employment Quota; IZA Discussion Paper No. 4386, 51 Pages Posted: 15 Oct 2009; University of Connecticut, Institute for the Study of Labor: Mansfield, CT, USA, 2009. [Google Scholar]
- Basant, R. Education and Employment among Muslims in India: An Analysis of Patterns and Trends; IIMA Working Papers WP2012-09-03; Indian Institute of Management Ahmedabad, Research and Publication Department: Ahmedabad, India, 2012. [Google Scholar]
- Kumar, A.; Hashmi, N.I. Labour Market Discrimination in India. Indian J. Labour Econ. 2020, 63, 177–188. [Google Scholar] [CrossRef]
- Olsen, W.; Mehta, S. Female Labour Participation in Rural and Urban India: Does ‘Housewives’ Work Count? 2006. Available online: https://www.researchgate.net/publication/228461844 (accessed on 15 August 2020).
- Afridi, F.; Dinkelman, T.; Mahajan, K. Why Are Fewer Married Women Joining the Work Force in India? A Decomposition Analysis over Two Decades. J. Popul. Econ. 2018, 31, 783–818. [Google Scholar] [CrossRef]
- Chatterjee, U.; Murgai, R.; Rama, M. Job Opportunities along the Rural-Urban Gradation and Female Labor Force Participation in India; Technical Report 7412, Policy Research Working Paper; World Bank: Washington, DC, USA, 2015. [Google Scholar]
- Reddy, A.A. Occupational structure of workers in rural Andhra Pradesh. J. Indian Sch. Political Econ. 2006, 18, 77–91. [Google Scholar] [CrossRef]
Figure 1.
India map showing selected states and villages (marked in red).

Figure 2.
Hours spent on paid work and unpaid activities per week. Source: authors’ estimation from village dynamics studies in South Asia (VDSA) data.
Figure 2.
Hours spent on paid work and unpaid activities per week. Source: authors’ estimation from village dynamics studies in South Asia (VDSA) data.


Table 1.
Description of dependent variables and its rationale for inclusion and hypothesis to be tested.
Table 1.
Description of dependent variables and its rationale for inclusion and hypothesis to be tested.
| Variable | Rationale for Inclusion of Dependent Variable and Hypothesis |
|---|---|
| Wage rate (INR/day) | Higher wage rate increase probability of engaged in paid work (the variable included only in labour supply equation). |
| Farm size (acre) 1 acre = 0.4 acre | Indicator for physical capital, source of employment on own farm. It is hypothesized that farm size will have a positive influence on hours spent on paid work. |
| Irrigated area (acre) | Indicator of land productivity. It is hypothesized that the irrigation will increase land productivity, but its actual impact depends on the cropping pattern. It is also hypothesized that households with irrigated land only engage in higher-salaried work at a higher wage rate. |
| Value of other assets (INR 1000) | The economic status of households. It is hypothesized that higher economic status households are likely to reduce hours spent in paid work as an inferior casual labourer but may like to work in higher-status employment due to the wealth effect. |
| Debt (INR) at the beginning of the crop year | Higher debt force households to work more hours in paid work, especially in inferior casual labour activities (included only in the labour supply equation). |
| Caste dummies | Indicator of social discrimination. Backward class is used as the reference group. The other categories are scheduled tribe, scheduled caste, and forward caste. It is assumed that the socially discriminated groups work more hours as casual labourers, but less hours in higher-status regular/salaried economic activities. |
| Religion dummies | Discrimination based on religion. Muslim religion is used as a reference group. The other categories are Hindu and other minorities including Christian. It is hypothesized that the religions in minority are more likely to be discriminated against and earn a lower wage rate and also have fewer opportunities in economic activities. |
| Gender | Gender discrimination. It is hypothesized that the women are more likely to work at lower wage rates and engage in more of unpaid work; they are likely to engage in fewer hours of paid work. |
| Years of schooling (years) | Human capital through education. It is hypothesized that with more years of schooling, individuals are more likely to be unemployed, as there are no opportunities for educated people to engage in more hours of paid work. However, it is hypothesized that they will get a higher wage rate. |
| Experience (no. of years in work after schooling) | Human capital through experience. It is hypothesized that with more years of experience, paid work and hours spent in paid work will be higher, and wages will be better. |
| Square of experience | As the number of years of experience increase, at an older age, the hours spent on work per week decline. |
| Arm circumference (cm) | Physical capacity to work [31]. Bigger arm circumference refers to better anthropometry measure and, thus, more availability for paid work, and people will work more hours at better wages. |
| Main occupation dummies | It is only included in the Mincer equation. It is hypothesized that the wage rates (labour productivity) will be higher among regular/salaried workers, while among farm labour, it will be less. |
Table 2.
Distribution of sample individuals by main occupation (in percentage) N = 1260.
| Paid Work | Unpaid Work | Attending Educational Intuitions | ||||||
|---|---|---|---|---|---|---|---|---|
| Category/Group | Hired Labour Work | Self-Employment | ||||||
| Farm Labour | Non-Farm Labour | Regular Employment | Self-Employed in Agriculture | Rearing Livestock | Small Business | Attending Domestic Duties | ||
| Gender | ||||||||
| Men (N = 948) | 10 | 12 | 8 | 40 * | 3 | 8 | 1 | 18 |
| Women (N = 631) | 21 * | 3 | 2 | 29 | 11 * | 2 | 21 * | 11 |
| Education | ||||||||
| Illiterate | 25 * | 8 | 1 | 42 | 10 * | 2 | 9 | 3 |
| 1–5 years of schooling | 21 | 6 | 1 | 44 | 6 | 6 | 14 | 2 |
| Middle (6th to 12th) | 10 | 9 | 6 | 32 | 5 | 8 | 12 | 18 |
| Graduate or above | 2 | 1 | 22 * | 15 | 1 | 7 | 7 | 45 |
| Landholdings | ||||||||
| Landless | 31 * | 13 | 7 | 8 | 6 | 8 | 10 | 17 |
| Small | 10 | 7 | 5 | 45 * | 6 | 4 | 10 | 13 |
| Large | 3 | 2 | 6 | 51 * | 8 | 3 | 11 | 16 |
| Age group (years) | ||||||||
| 15 to 24 | 11 | 10 * | 5 | 17 | 4 | 4 | 10 | 39 |
| 25 to 60 | 18 * | 7 | 6 | 42 * | 8 | 6 | 10 | 3 |
| Caste group | ||||||||
| Other Backward Classes (OBC) | 16 | 9 | 4 | 37 | 6 | 7 | 8 | 13 |
| Schedule Tribes (ST) | 14 | 6 | 7 | 38 | 10 | 4 | 10 | 11 |
| Schedule Caste (SC) | 28 * | 15 * | 8 | 18 | 4 | 5 | 9 | 13 |
| Forward Caste FC | 6 | 3 | 7 | 35 * | 7 | 7 | 20 * | 15 |
| Total | 15 | 8 | 5 | 35 | 7 | 5 | 11 | 14 |
Note: * indicates significance at 5% level by using chi-squire test.
Table 3.
Average number of hours spent per week on various activities.
| Activities | Female | Male | % Change in Male Hours over Female |
|---|---|---|---|
| (I) Paid work (hours per week) | 23.1 | 36.2 * | 56.7 |
| Hired work | 12.3 | 20.8 * | 69 |
| Own farm | 5.2 | 8.5 | 62 |
| Own livestock | 5.1 | 6.3 | 24 |
| Own non-farm work | 0.5 | 0.6 | 33 |
| (II) Unpaid activities (hours per week) | 28.1 * | 8.8 | −68.7 |
| Domestic duties | 26.3 * | 6.5 | −75 |
| Seriously ill | 0.9 | 0.6 | −33 |
| Unemployed | 0.9 | 1.7 | 83 |
| Total hours per week (I + II) | 51.2 * | 45.0 | −12.1 |
| Wage income (INR/year) | 7920 | 27,000 * | 241 |
| Wage rate (INR/day) | 99 | 200 * | 102 |
| Imputed income (all activities per annum) | 32,967 | 42,551 | 29 |
Source: authors’ estimation from the VDSA data; paid work included all casual labour in both farm and non-farm activities, regular and salaried work (paid monthly), and self-employment. Note: * indicates significance at 5% level by using t-test.
Table 4.
Average number of hours per week and wage rates in hired work by gender.
| Gender | Sector of Employment | Hours per Week | Wage Rate/Day | Income (INR/Annum) |
|---|---|---|---|---|
| Men | Non-farm | 15.6 * | 222 * | 22,530 * |
| Farm | 5.2 | 132 | 4470 | |
| Total | 20.8 | 200 | 27,000 | |
| Women | Non-farm | 5.1 | 107 | 3550 |
| Farm | 7.2 * | 94 | 4363 | |
| Total | 12.3 | 99 | 7920 |
Note: * indicates significance at 5% level by using t-test; 1 day is equal to 8 h.
Table 5.
Determinants of hours spent on paid work: labour supply model.
| Independent Variables | Coefficients |
|---|---|
| Constant | 29.5 |
| Wage rate (INR/day) | 0.65 * |
| Farm size (acre) | 13.09 *** |
| Irrigated area (acre) | −34.65 ** |
| Value of other assets (INR 1000) | −1.42 *** |
| Debt (INR) | 0.94 *** |
| Caste dummies (OBC comparison group) | |
| Scheduled tribes | −128.13 *** |
| Scheduled caste | −149.65 *** |
| Forward caste | −43.64 |
| Religion dummies (Muslim comparison group) | |
| Hindu | −123.71 |
| Other minority | 78.82 |
| Gender (male = 1) | 380.39 *** |
| Years of schooling | −17.57 *** |
| Experience | 24.97 *** |
| Experience Square | −0.62 *** |
| Arm circumference | 28.08 *** |
| Adjusted R Square | 0.27 |
Note: dependent variable: work hours per week (economic activities included all paid and self-employment activities in agriculture and non-agriculture, but not included domestic/care activities). *, significant at 10% level; **, significant at 5% level; ***, significant at 1% level.
Table 6.
Determinants of earnings per day received by men and women—modified Mincer equation.
| Independent Variables | Women Labour | Men Labour |
|---|---|---|
| Coefficient | Coefficient | |
| Constant | 89.54 | 198.50 |
| Farm size (acre) | −0.010 | 0.015 *** |
| Irrigated area (acre) | 0.024 | 0.023 * |
| Value of other assets (INR1000) | 0.001 *** | −0.002 *** |
| Caste dummies (OBC comparison group) | ||
| Scheduled tribe | −0.092 * | 0.089 |
| Scheduled caste | −0.018 | −0.043 |
| Forward caste | 0.053 | 0.204 *** |
| Religion dummies (Muslim comparison group) | ||
| Hindu | 0.065 | 0.173 |
| Other minority | −0.085 | 0.428 *** |
| Years of schooling | −0.016 *** | 0.001 |
| Experience | −0.005 | 0.024 *** |
| Experience square | 0.000 | −0.001 *** |
| Arm circumference (cm) | −0.020 | 0.016 ** |
| Main occupation | ||
| Farm labourer | 0.046 | 0.037 |
| Livestock rearing | 0.120 | −0.044 |
| Non-farm labour | 0.029 | 0.135 ** |
| Regular employment | 0.013 | 0.237 *** |
| Petty business | −0.115 | 0.351 *** |
| Domestic work | −0.089 | 0.097 |
| Adj R Square | 0.34 | 0.45 |
Note: dependent variable is daily wage rate for paid work and imputed earnings per day for self-employment activities (INR/day). *, significant at 10% level; **, significant at 5% level; ***, significant at 1% level; OBC: other backward class.
Publisher’s Note: MDPI stays neutral with regard to jurisdictional claims in published maps and institutional affiliations. |
© 2021 by the authors. Licensee MDPI, Basel, Switzerland. This article is an open access article distributed under the terms and conditions of the Creative Commons Attribution (CC BY) license (http://creativecommons.org/licenses/by/4.0/).
Share and Cite
MDPI and ACS Style
Reddy, A.A.; Mittal, S.; Singha Roy, N.; Kanjilal-Bhaduri, S. Time Allocation between Paid and Unpaid Work among Men and Women: An Empirical Study of Indian Villages. Sustainability 2021, 13, 2671. https://doi.org/10.3390/su13052671
AMA Style
Reddy AA, Mittal S, Singha Roy N, Kanjilal-Bhaduri S. Time Allocation between Paid and Unpaid Work among Men and Women: An Empirical Study of Indian Villages. Sustainability. 2021; 13(5):2671. https://doi.org/10.3390/su13052671
Chicago/Turabian StyleReddy, A. Amarender, Surabhi Mittal, Namrata Singha Roy, and Sanghamitra Kanjilal-Bhaduri. 2021. "Time Allocation between Paid and Unpaid Work among Men and Women: An Empirical Study of Indian Villages" Sustainability 13, no. 5: 2671. https://doi.org/10.3390/su13052671
Note that from the first issue of 2016, this journal uses article numbers instead of page numbers. See further details here.