Typology of Medium-Sized Cities in Spain Using PCA (Principal Component Analysis)
by
 , and
, and
Francisco Cebrián-Abellán
1,* ,
,
María-Jesús González-González
2,* and
María-Eva Vallejo-Pascual
3,* 1
Geography Department, Castilla-La Mancha University, 13001 Ciudad Real, Spain
2
Geography and Geology Department, Leon University, 24071 León, Spain
3
Economics and Statistics Department, Leon University, 24071 León, Spain
*
Authors to whom correspondence should be addressed.
Sustainability 2021, 13(5), 2456; https://doi.org/10.3390/su13052456
Submission received: 4 November 2020
/
Revised: 24 January 2021
/
Accepted: 27 January 2021
/
Published: 25 February 2021
(This article belongs to the Special Issue Urban Sustainability: Re-envisioning Cities to Lead the Way toward A Circular Economy)
Abstract
:This article analyses processes of change undergone by Spanish medium-sized cities during 1981–2011 on the one hand, and 2000–2018 on the other, as they are different sources. We established a classification to show the importance of this type of city starting from the hypothesis that the process is a generalised one in which they behave according to their position in the territory. The dynamics of change are predominantly associated with contexts of economic expansion. The typology was generated based on population and housing variables, which synthesise the role played by economic activity in each city. Additional methodologies were used: firstly, the bibliography on medium-sized cities in different social and cultural contexts was reviewed; secondly, statistical data were selected, compiled and processed using multivariant statistical analyses, and the results mapped. A study of 133 cities was carried out and absolute values and variation rates used to understand the processes of change. As a result, seven representative groups were obtained. The conclusions of the study can be corroborated by different sources.
1. Introduction
Urban processes have usually focused on large cities and their metropolitan areas, few studies having been carried out on those of medium size. One of the questions is to contribute to the debate and understand the behaviour of their respective growth rates, especially in peripheral areas since the beginning of the century. Medium-sized cities have undergone a significant transformation that has had a generalised socioeconomic, territorial and landscape impact. We define as midsize cities in the European context cities between 50,000 and 300,000 residents.
These processes are marked by significant temporal and spatial contrasts, since there have been periods of clear urban expansion, especially in the peripheries at the beginning of the 21st century, and others when it has slowed down considerably. Changes that have taken place are analysed using the latest intercensal periods (from 1981 to 2011) to understand the territorial redefinition of cities. Not all cities have behaved in the same way, and neither have different urban areas responded with the same operating logic. We assume that the process of change is predominantly associated with contexts of economic expansion. The reality is that, from this perspective, the last twenty years have meant a significant change in these cities with regard to their expectations of a repositioning in the urban network at all scales. Distances with larger urban centres have been greatly shortened in terms of their facilities and capacities, transport and communications networks that bring them closer to national metropolises. They are potentially areas of growth and, at the same time, decongestion of neighbouring urban agglomerations. Their growth has improved facilities and enabled the arrival of new infrastructures, although urbanization has not always been continuous, as in many cases, it has occurred irregularly, with multiple problems, mainly derived from their accessibility. Thus, in this type of urban area we find increased functional competition between the urban centre and the potential new commercial or recreational-commercial surfaces that have been installed on the outskirts, affecting new municipalities [1].
From the perspective of the evolutionary process, medium-sized cities are compact, characterised by their territorial continuity, high density, good accessibility and predominance of public spaces, but also by urban sprawl towards their peripheries. There are many examples including Olsson [2] for Valhallavägen in Stockholm (2014), or Monteiro [3] for some neighbourhoods in Lisbon (2012), who focus on planning, transport, mobility, urban morphology or public spaces. These studies were carried out in an Anglo-Saxon environment by pioneers in the field and were used as the basis for subsequent studies in Europe at an intermediate scale [4].
In view of these scenarios, proposals for classifying cities based on quantitative and qualitative criteria that take into account the idea of scale, function and position in the territory have been put forward. UNCHS (United Nations Centre for Human Settlements (Habitat)) ([5] took into account the triple condition of areas of articulation in the urban system; of centres that regulate and balance the territory in demographic, social and economic terms; and as elements able to modify models of production, consumption and/or demographic concentration. This implies assuming functional complexity, degree of centrality or historical symbology. The European Union ESPON (European Spatial Planning Observation Network) [6] programme organizes them according to their functional, morphological and administrative strategy.
However, in this study, we focused on two variables, population and housing, to establish a typology based on their correlation. Based on the two key variables of the analysis, population and housing, it is possible to design a more sustainable city, preserving green areas and limiting sprawl. The answer can probably be found in the paradigm proposed by the circular economy. The aim is a prosperous city in which economic productivity is increased by reducing congestion, waste and costs; cities with better air quality, less pollution and improved social interaction. These cities would be less dependent on raw materials and create a balance between local products and global supply chains [7]. In fact, the circular economy operates firstly in the city, and extends to the region and nation [8,9].
However, the responses may be different depending on the type of medium-sized city. The characteristics of medium-sized cities located at a distance from mega cities are different to those that are closer, or situated in coastal regions. Therefore, the establishment of work groups is essential for implementing the concept of the circular economy in this type of city.
The 1981–2011 period was chosen because it summarizes the adjustment process that occurred in medium-sized cities during globalization. The four censuses, each conducted every ten years, were used as they constitute a sufficiently long period of time (40 years) to offer a classification for cities based on their dynamics. The proposal for cities by Ganau and Vilagrasa [10] was adopted as a working criterion as it focuses on the group of cities with more than fifty thousand inhabitants, and those that meet the status of provincial capital, without reaching this minimum. The criterion of 300,000 inhabitants was adopted as the upper threshold. The municipal scale (NUT5) was included as the unit of analysis. A total of 133 cities are included in this category for the year 2018.
The objective is to establish territorial differentiations based on location and dynamics, as well as population and housing variables, which synthesize the role of economic activity in the respective cities. Furthermore, some of them are part of polynuclear metropolitan areas articulated by cities at the top of the urban hierarchy. Despite this, medium-sized cities still behave according to their position in the urban network and function within the structure of the autonomous regions.
This paper is organized in three parts. Firstly, the state of play, based on a review of the international literature on this subject and in the Spanish context in recent years, analysing the dynamics observed in inner cities. Secondly, the methodology used to establish the typology of cities based on population and housing is addressed. Thirdly, the results obtained are analysed and followed by the discussion and conclusion.
2. State of the Art
The idea of urban systems conditioned by the role of large cities has had a great deal of influence globally [11]. However, their premise is increasingly questioned. This allows us to think in more diverse urban terms, under the protection of new urban agendas and more balanced networks that represent the backbone of the territory [9,10]. It is within this context that the debate on whether medium-sized cities are a complement and alternative to large urban spaces takes place.
Some years ago, Brunet [12,13] referred to the concept of the medium-sized city as an unidentified geographical object (UGO). This daring but accurate presentation summarizes the difficult task of addressing the reality of the “second level of the urban hierarchy” within a set of consistent criteria. The truth is that the academic and planning world has not reached a conceptual consensus on how to define it. Loaded with diversity and heterogeneity, it forms part of the collective ideology. Aspects related to demographic size or functionality [14,15,16] have been used in an effort to resolve this issue.
One of the recurring elements in the classification of cities is their demographic size. It is a relatively objective criterion since population data can be obtained fairly easily for different urban scales. The debate on medium-sized cities is still open and the heterogeneity of institutional and academic proposals depends, in the European context, on the sociodemographic characteristics of each country, population density and the urban system in which they are inserted [17,18,19].
In the European case, the review of the published bibliography leaves the debate quite open. The Datar-Reclus report [20] assigned the status of large cities to those with over 200,000 inhabitants, which somehow left cities not reaching that demographic threshold in the intermediate category. The European Union as a whole considered cities with between 20,000 and 500,000 inhabitants as intermediate, although numerous works offer different complementary views (100,000 and 250,000 inhabitants). At the country level, some consider criteria adapted to their idiosyncrasies. According to the European Spatial Planning Observation Network (ESPON) [6], Poland, France and Spain have proposed lower intervals, between 20,000 and 200,000 [20,21]. Greece includes cities with a population of between 20,000 and 250,000 in this category. In Germany, the interval is between 20,000 and 100,000 [14]. Italy establishes different criteria according to authors, some of whom propose a population of between 200,000 and 1,000,000 [22] (p. 3) or 100,000 and 300,000. As a rule, thresholds are between 20,000 and 200,000 [23,24]. It is also true that Eurostat no longer makes explicit reference to this category in its statistics and has incorporated the idea of urban functional area as a new criterion for defining the medium-sized city [25].
In other sociocultural contexts, the situation differs considerably. In the United States, the National League of Cities has assigned the condition of medium-sized to those with populations between 98,000 and 175,000 [26]. In Mexico, the approach is much more ambitious, with thresholds ranging between 100,000 and 999,000 inhabitants. In Argentina, the statistical criteria reduce the Mexican proposal, since cities with 50,000–500,000 inhabitants [27] are classified as medium-sized and these thresholds have further lowered to 20,000–150,000 [28].
In Spain, studies addressing medium-sized cities have done so from different approaches, according to disciplines and historical periods, and they have also left a balance of different proposals. The first studies were conducted on cities with between 50,000 and 150,000 inhabitants, omitting those assigned to metropolitan areas [29]. Three decades ago, Serrano proposed criteria of between 25,000 and 100,000 [30] as size classification, closely mirrored by Esteban and López, who defined the thresholds as 20,000 to 100,000 residents [31]. Ganau and Vilagrasa made a more ambitious reading at the beginning of the 21st century, proposing populations of between 50,000 and 300,000, and did not include cities integrated in metropolitan areas [10] in their definition. At the end of the first decade, Andrés proposed thresholds between 50,000 and 250,000 as a reference [26,27]. They all agree that the statistical criteria are incomplete and only partially solve the problem of defining intermediate cities.
The Ministry of Development of the Government of Spain establishes populations between 100,000 and 250,000 inhabitants [25] and leaves the condition of large urban areas to municipalities that exceed 50,000 inhabitants and the status of small urban areas to those with municipalities of between 20,000 and 50,000 inhabitants [28,29]. This does not shed light on proposals put forward by different regional administrations, for example, the Territorial Strategy of the Valencian Community, which limits this category to populations between 10,000 and 100,000 inhabitants [30], and in the Andalusian case, medium-sized cities are urban centres with between 20,000 and 100,000 inhabitants [31,32].
Although they have traditionally been defined by their demographic size, these cities play an important role as intermediaries from different and complementary approaches, and they also articulate their respective regional environments, underlining the importance of centrality, ability to act as intermediaries, and the labour market conditions [32]. On the other hand, they have the capacity to articulate and rebalance their respective urban areas at a local, county and/or regional scale based on their demographic size and position. Thus, the discourse on this category of cities, which have been assigned the qualification of medium-sized since the end of the eighties, has changed [33]. Typically, they are located between large urban spaces and rural areas, cushioning the depopulation processes operating in the last decades of the 20th century. They also act as intermediaries in the development of infrastructures [17]. In the Spanish case, the defining criteria catalogue them based on their ability to articulate their own interland, lead an urban subsystem, and be part of a larger system [34]. The criteria are listed below.
- (a)
- (b)
- Cities in linear or corridor metropolitan environments [35].
- (c)
- Centrality assumed for connected inner cities [37].
- (d)
- Belonging to polynuclear regions.
The process of conceptual conformation has also made it possible to progress, gradually adopting different names that seek to collect its demographic, functional scale and territorial position, going from a medium-sized city [38], to an intermediate one [39], or to the mesopolis [34]. It is based on a fundamental aspect, the capacity to act as intermediary between rural spaces and cities of higher rank in the urban hierarchy, with special emphasis on innovation associated with territorial capital, dependent on local social capital, knowledge, institutional contexts and business networks [40,41].
In recent decades, Spain has undergone changes in economic models, due to increased activities in services, and the incorporation of new technological processes. During 2001–2018, large Spanish cities (with over 30,000 inhabitants) increased their demographic size by 8.95%, whereas medium-sized ones did so by 9.88%, and in absolute values in 2018 had 8,807,588 habitants—without counting the population in their respective metropolitan area, while the population in medium-sized cities was 4,769,518. To cite a few examples, between 1981 and 2011, the average annual population growth rate in Madrid was 0.01% and 0.17% in Valencia [36]; while the average annual growth rate of the resident population in medium-sized cities stood at 0.93% in the same period (based on data from censuses corresponding to 1981 and 2011). Medium-sized cities offer better quality-of-life standards than large cities and are more sustainable, especially in a context marked by the decline in demographic dynamics [42,43,44,45,46].
Also, the concept of the city is moving further away from the traditional idea of a compact city, assuming that of an urban area. Thus, the debate on urban limits, which are becoming increasingly blurred in urbanised rural environments [47], is opened. The EU and OECD (Organisation for Economic Co-operation and Development) [48] definition is clarifying: A city is a local administrative unit (LAU) where the majority of the population live in an urban centre of at least 50,000 inhabitants. A commuting zone contains the surrounding travel-to-work areas where at least 15% of employed residents are working in the city. A functional urban area consists of a city and its commuting zone. Functional urban areas therefore consist of a densely inhabited city and a less densely populated commuting zone whose labour market is highly integrated with the city [49]. The traditional idea of the city as a homogeneous and compact territory is being replaced by that of the urban area as a territorial criterion for defining the city.
3. Methodology
3.1. Study Area and Data
Three complementary research lines were used: firstly, the bibliography on city processes in different sociocultural contexts; secondly, the compilation of statistical data which were then organised; and thirdly, an analysis of cartography. The paper analyses the growth dynamics of intermediate cities using demographic and housing variables to establish a typology of medium-sized cities in Spain. The size chosen from the demographic perspective was between 50,000 and 300,000 inhabitants, and provincial capitals not reaching this threshold were added. We assume that the municipal scale is the most appropriate, although we are aware that, within each municipality, there are models of diversified settlement, and the population is not always concentrated in a single entity. Proof of this is that studies have been carried out at the infra-municipal scale [29]. Cities of this size are easily interpretable territorial units for planning at a regional scale and for the analysis of relationships [50]. Demographic and housing variables collected in the last four population and housing censuses (1981, 1991, 2001 and 2011) were selected; 133 cities (Appendix A Table A1, Figure A1, Figure A2 and Figure A3) were studied and absolute values and housing and population variation rates used to evaluate the dynamics of the processes of change that have taken place in them.
3.2. Modelling Applied
A statistical analysis (Figure 1) was then performed with SPSSv.26 (2019) software (SPSS, or IBM SPSS) used for statistical analysis in many research fields: health studies, market surveys, government and education organizations, etc.
According to Lebart et al. [50] (pp. 184–189), when the purpose is classification and the data are quantitative (as are the 6 indicators described), the application of a previous Principal Component Analysis (PCA theoretical method can be found in Hair et al. [51] (pp. 89–150), Lebart et al. [50] (pp. 32–57), and Anderson [52]) enables us to identify the relevant dimensions (components or factors) to then carry out a cluster analysis.
In the second stage, the Hierarchical Cluster Analysis (HCA) explores the organization of samples in groups and among groups depicting a hierarchy. Cluster Analysis can be found in Hair et al. [51] (pp. 415–474) and Lebart et al. [50] (pp. 155–175). The result of an HCA is usually presented in a dendrogram, a plot showing the organization of samples and their relationships in tree form. Clustering is achieved by using an appropriate metric of samples distance and linkage criteria among groups. The squared Euclidean distances and Ward’s linkage method are two of the most commonly used [51] (p. 247), [52].
3.3. Empirical Study of Information: Establishment of A Typology of Spanish Medium-Sized Cities
The empirical study takes information provided by the population and housing censuses, prepared by the National Statistics Institute (INE) for 1981, 1991, 2001 and 2011, as a basis. Data on population relative to the municipal register for 2008 and 2018, also available on the page of the same organism (despite the fact that it is a record of each municipality), have been taken into account.
The analysis is based on the study of 133 Spanish medium-sized cities, that is, cities with between 50,000 and 300,000 inhabitants, according to census data for 2018, with the aim of identifying a typology, groups of cities depending on the evolution of their population and housing. The identification codes for these cities (National Statistics Institute (NSI) code) are in Appendix A Table A1.
To define the indicators on which the classification is to be based, the evolution of the population and number of dwellings have been reviewed first and can be seen in Figure 2.
As reflected by the numerical results (on the right in Figure 2), despite the fact that they are medium-sized cities, there is a great diversity in terms of population and housing (typical deviations are high with respect to their arithmetic means). Therefore, the proper comparison must be made by observing the median and the Box-Plot diagram (left of Figure 2): the box is drawn from Q1 to Q3; the horizontal line in the middle denotes the median and extreme cases identified. Therefore, it can be seen that:
- ○
- In the period analysed, and as reflected by the median of the blue boxes, there has been a gradual population growth in absolute terms, at a somewhat faster rate between the 2001 and 2011 censuses. The number of dwellings in absolute terms, taking into account the median, has also grown at a rate similar to that of the population, bearing in mind that both variables are necessarily related to the size of the city: the larger the population, the more dwellings will be required.
- ○
- Dispersion has behaved differently: both the numerical results (std deviation) and the graphs show that the dispersion of dwellings has increased during the period, while in the case of the population, it has barely changed.
- ○
- Except in a few cases, average cities that show dispersed behaviour (upward) with respect to the population show similar behaviour in the number of dwellings (codes highlighted in the graph).
In order to evaluate population and housing dynamics, two indicators have been constructed that are not influenced by the size of the city and which correct differences in dispersion and express the evolution of both variables in relative terms. The Average Annual Rate of change in urban Population (AARP) and Average Annual Rate of change in the number of urban Dwellings (AARD) have been considered, thus enabling the analysis of population and housing variations in relative terms.
- ○
- Meaning: The highest average rates are identified with cities in which their population (or number of dwellings) has grown faster in the period considered.
- ○
- Notation and formula:t = year t t − n = year t – nPt = Urban Population in t Pt − n = Urban Population in t − nVt = number of urban Dwellings in t Vt − n = number of urban Dwellings in t − nn = year number between t and t − naar_P = 1)·100aar_D = (1)·100
In addition, and in order to evaluate the relationship between population and housing, 4 rates have been prepared that express the number of inhabitants per dwelling in each of the 4 census years, with the following identifying labels: PD_rate_1981, PD_rate_1991, PD_rate_2001, PD_rate_2011.
- ○
- Meaning: The number of inhabitants for each dwelling in the city considered in each of the census years is indicated. The lowest ratios will be those in which the number of inhabitants per dwelling has decreased, and therefore, the dwelling has grown more with respect to the number of inhabitants.
- ○
- Notation and formula:t = year tPt = urban Population in tVt = number of urban Dwellings in tPD_rate_t =
In order to evaluate this indicator, Figure 3 shows the evolution and numerical results that allow the comparison between years.
As can be seen, both the mean and median of this indicator have decreased in the period, slightly moderating their fall between the 2001 and 2011 censuses. This fact corroborates what was pointed out above: housing has grown in relative terms above the population, and the number of inhabitants per dwelling has decreased significantly in this period. Therefore, the ratio considered measures the real estate effect of medium-sized cities. Based on these indicators, the statistical methodology applied to identify groups or typologies of Spanish medium-sized cities in terms of their population–housing dynamics is described below (Appendix A Figure A3).
4. Result
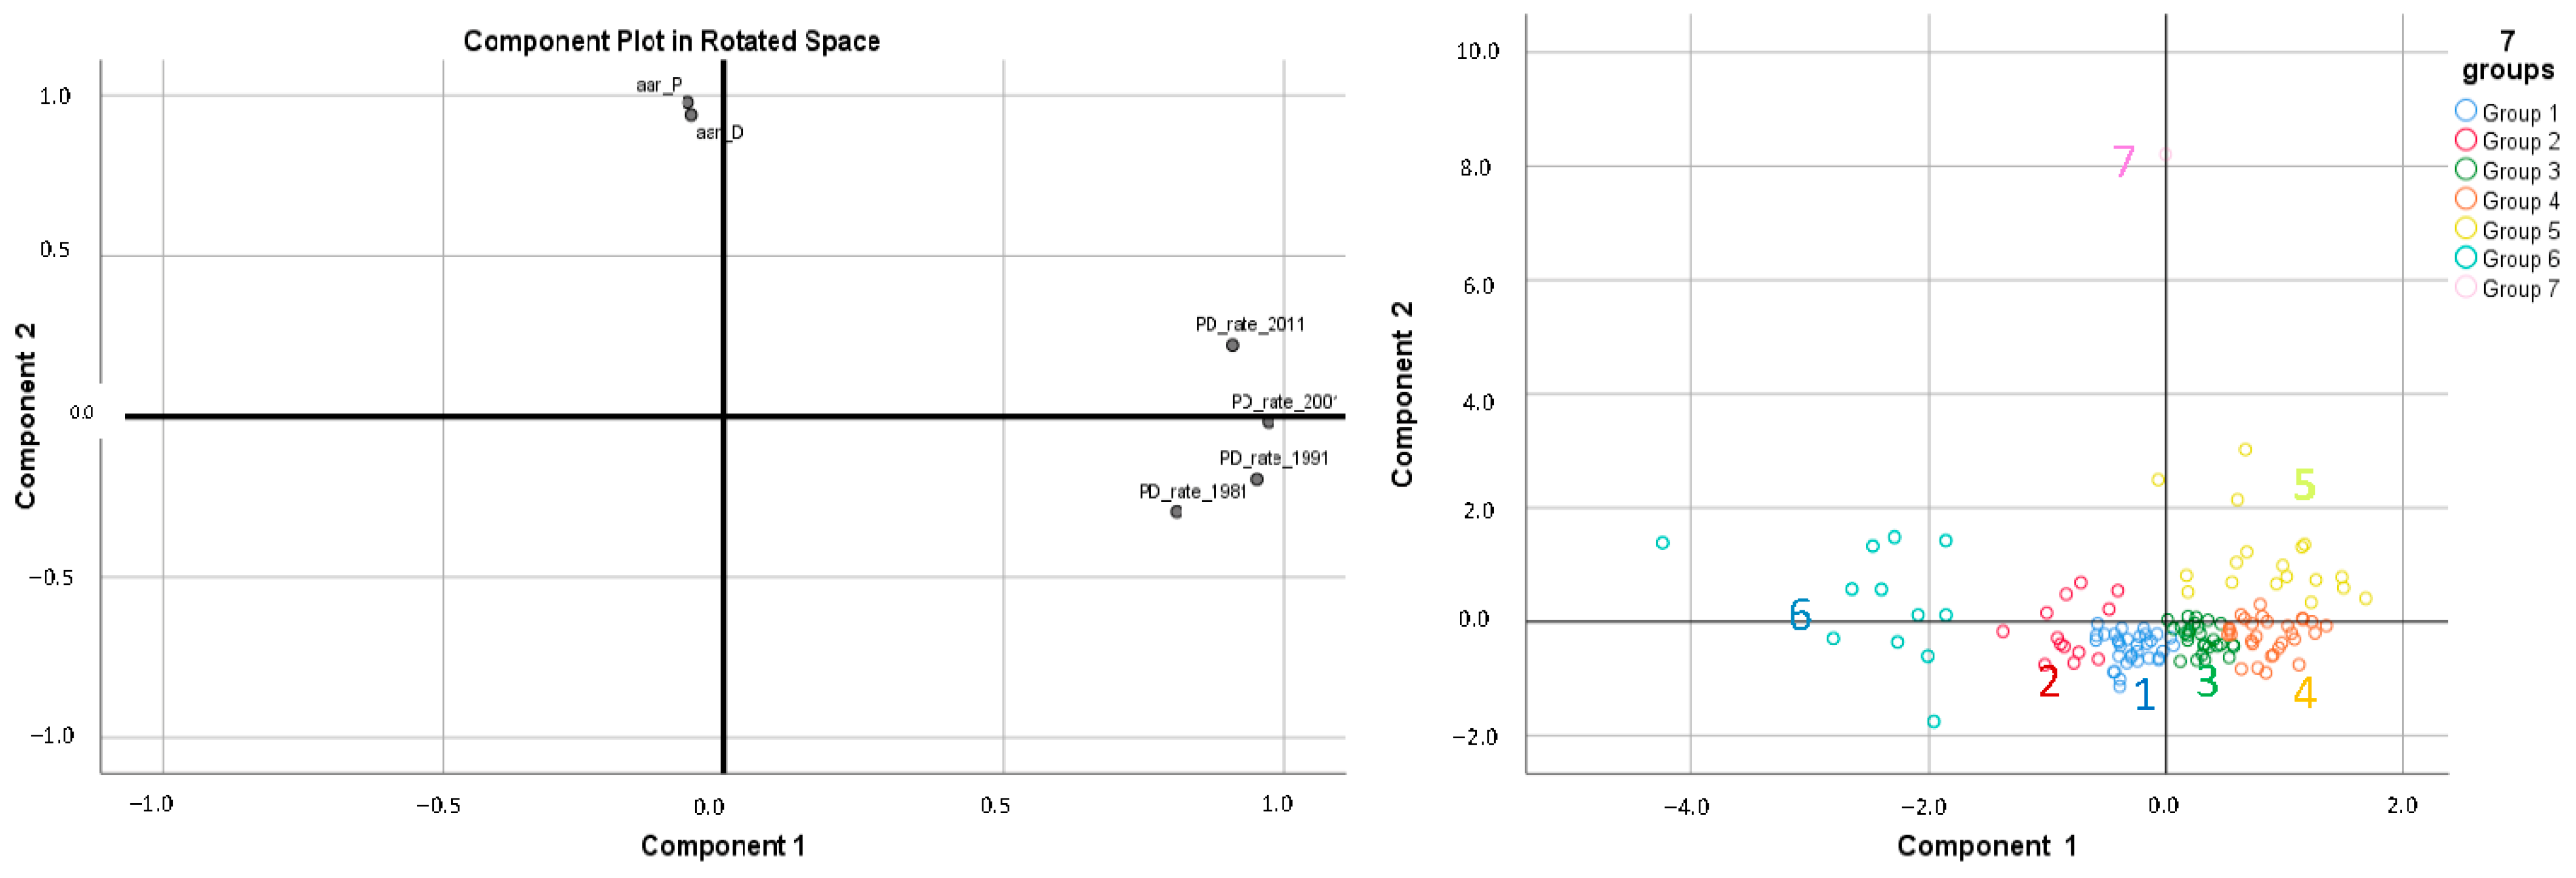
As a result of applying the Principal Component Analysis (PCA) with varimax rotation, 2 dimensions are retained that explain almost 90% of the original information, as shown in Table 1 (left). According to the factor loadings (Table 1 left), the population–dwelling (PD) rate defines component 1, which explains 55.50% of the information. This is, therefore, the main dimension for classifying cities: cities with a lower real estate effect will present a more extreme position in the positive part of this component. Component 2 is defined as population and housing dynamics: the higher the relative population growth rate, the higher the relative growth rate of the number of dwellings, and the more extreme positions in the positive part of this component.
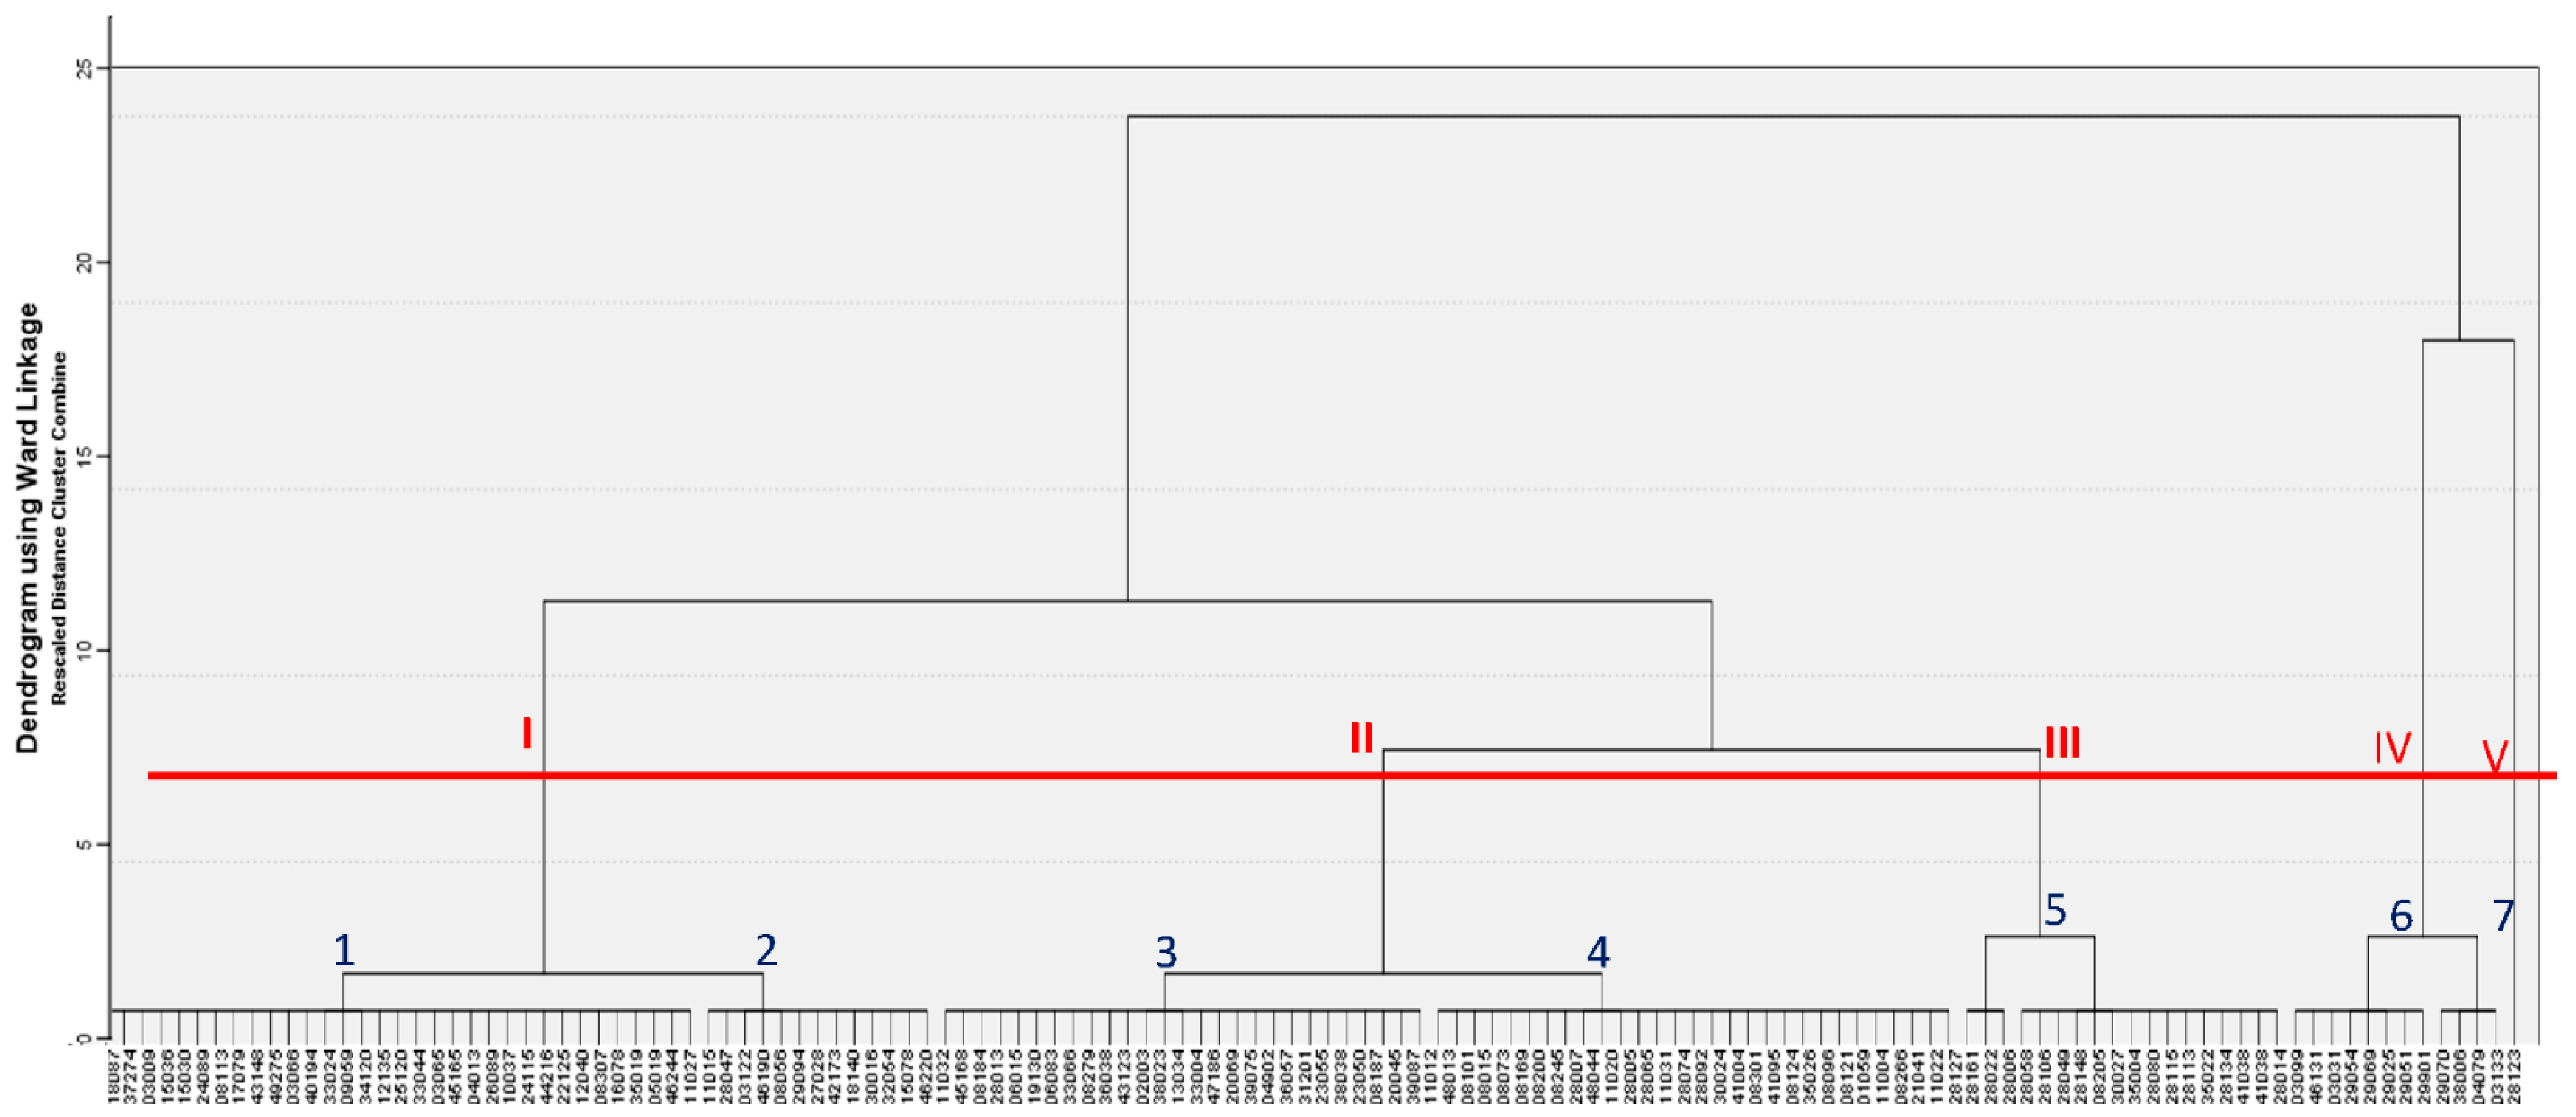
Taking the two dimensions, the application of the Cluster Analysis (hierarchical method: Ward’s algorithm, squared Euclidean distance) obtains a dendrogram presented in the annex (Appendix A Figure A1) in which each individual is identified with their National Statistics Institute code. This code, the name of the municipality and the classification group are included in the annex (Appendix A Table A1).
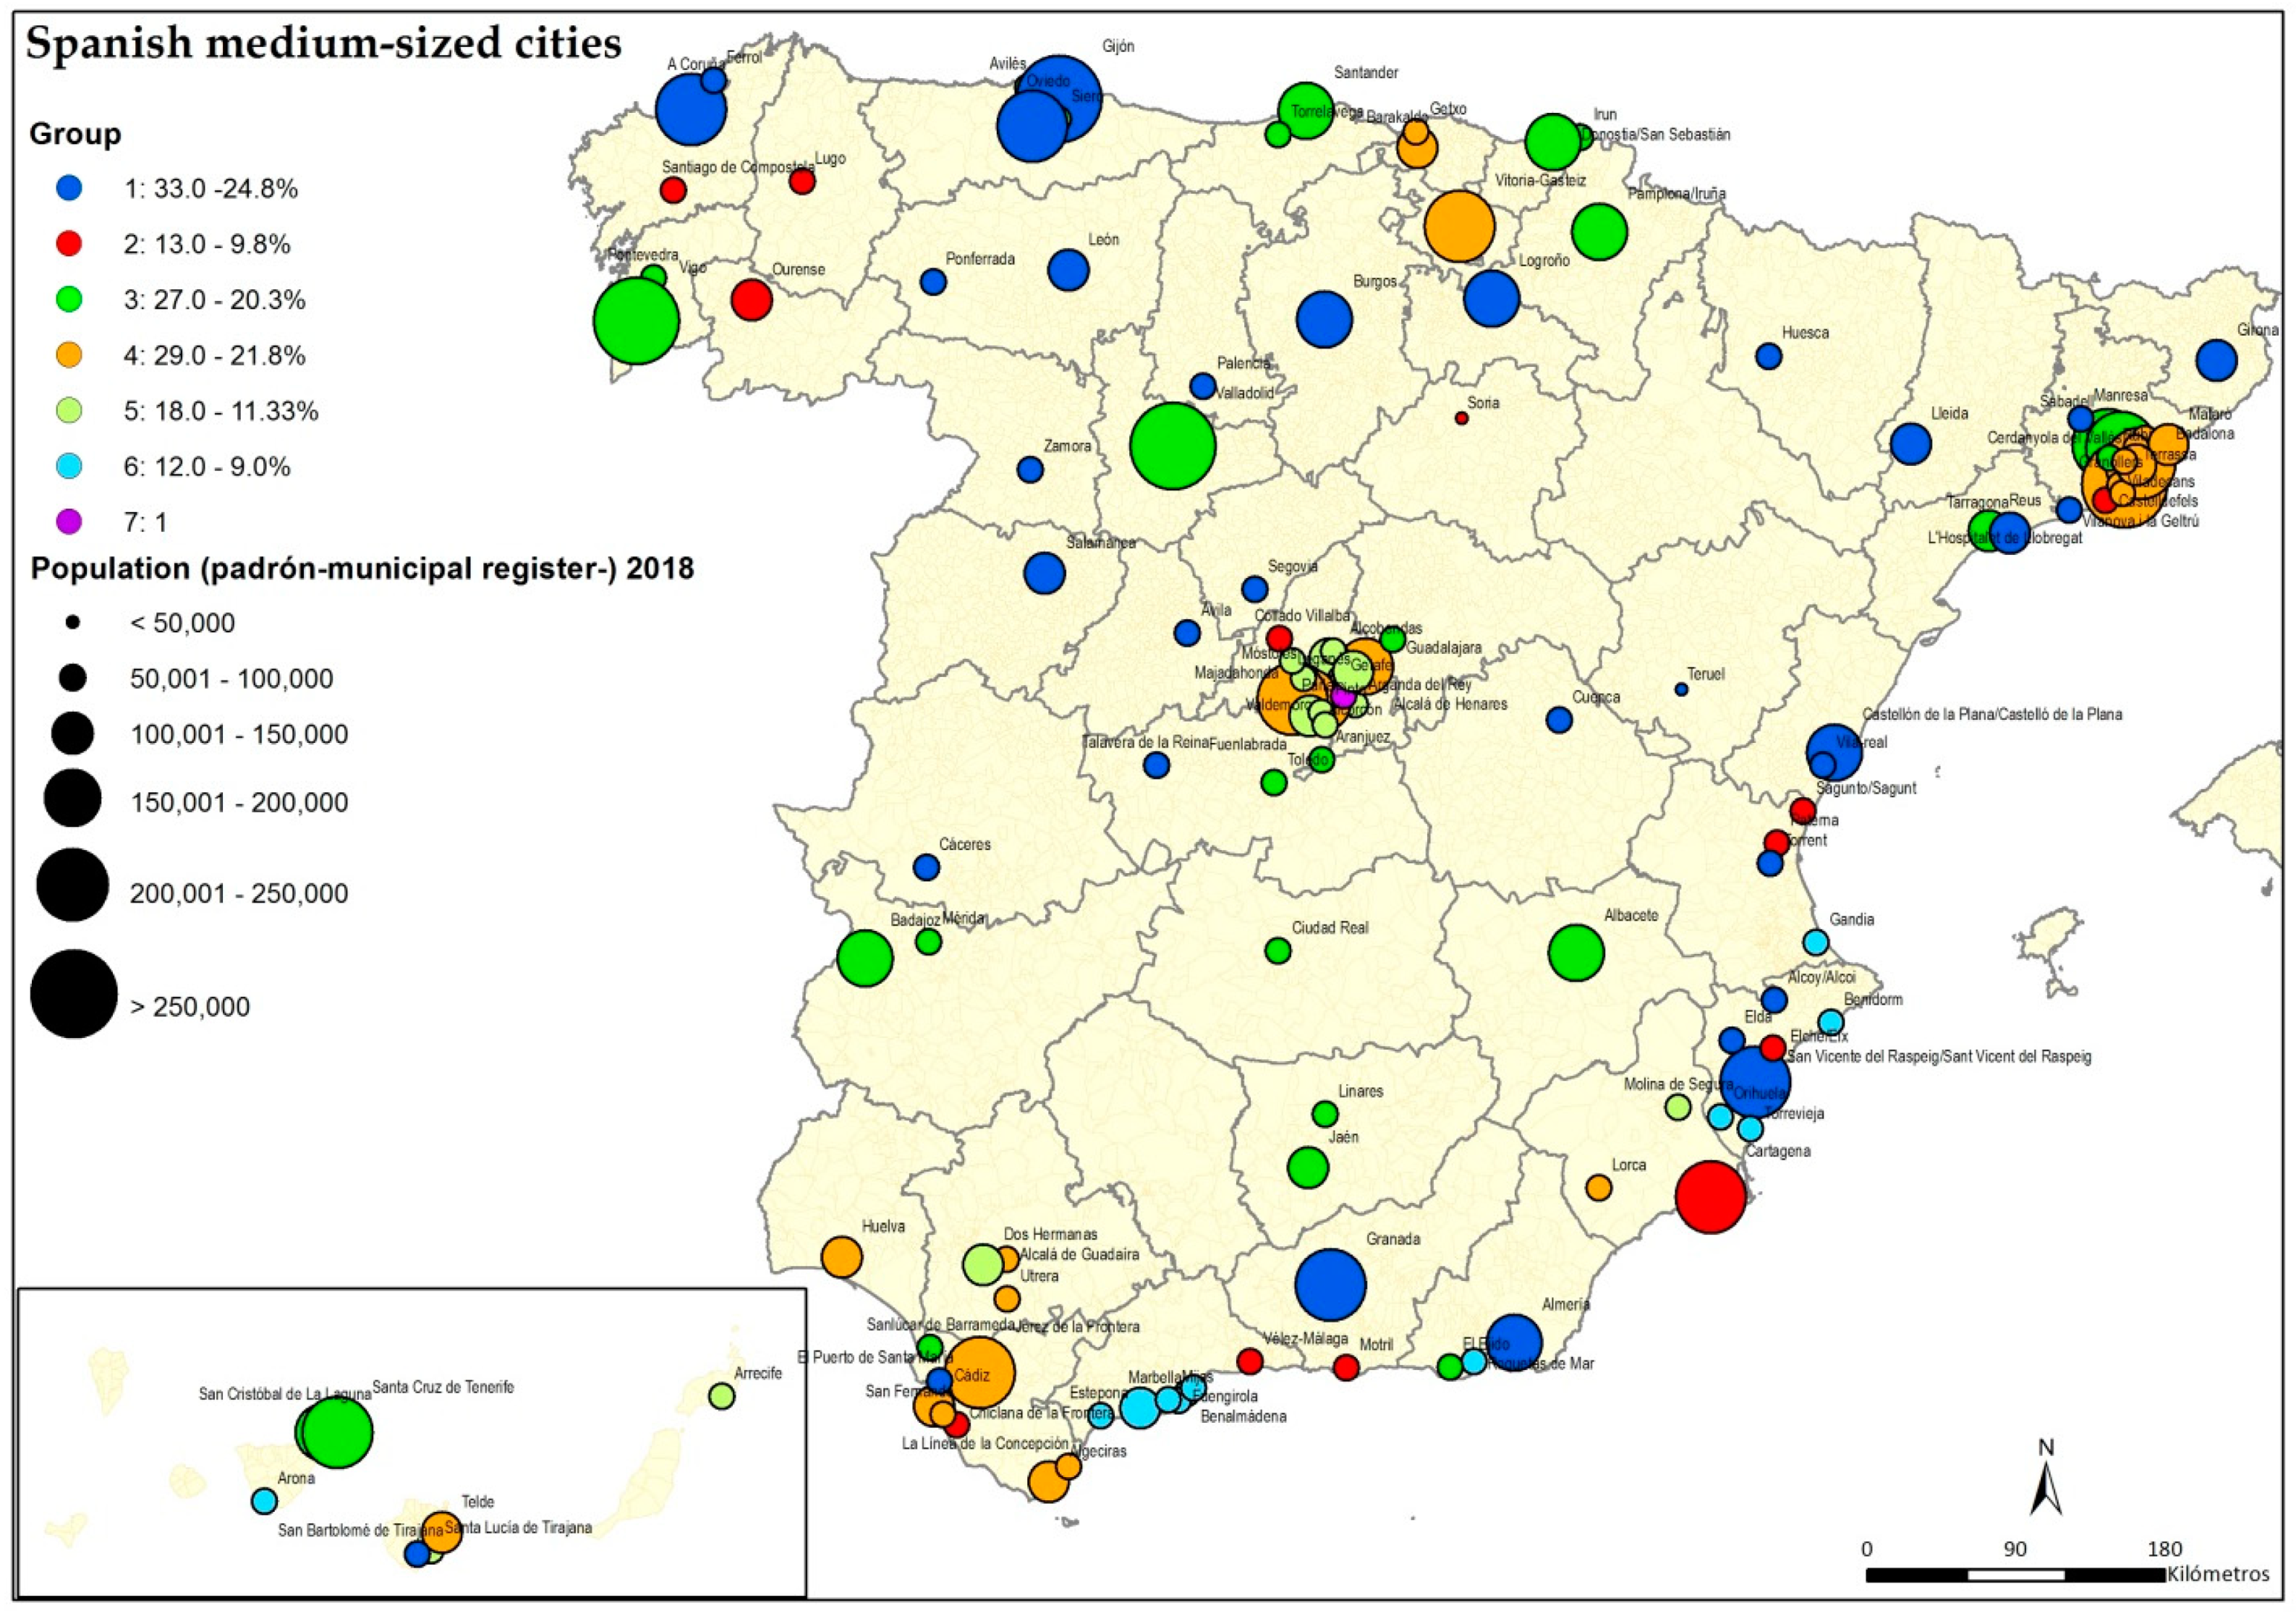
According to Hair et al. [45] (p. 424), the partition indicated with the horizontal red line identifies 5 groups: group 1 (46 cities, 34.5%), group 2 (56 cities, 42.1%), group 3 (18 cities, 13.5%), group 4 (12 cities, 9%) and group 5 (1 city). As a consequence, groups 1 and 2 are very numerous. However, it is possible to distinguish smaller groups within them. Therefore, the final classification identifies 7 groups: group 1 (33 cities, 24.8%), group 2 (13 cities, 9.8%), group 3 (27 cities, 20.3%), group 4 (29 cities, 21.8%), group 5 (18 cities, 11.33%), group 6 (12 cities, 9%), and finally, group 7 formed by only one city (Appendix A Table A1), with smaller group within them. Appendix A Figure A2 (right side) shows that the identified groups are quite homogeneous (with hardly any overlaps) and can be perfectly distinguished from each other by their different position in the plane. The characterization of each of the subgroups will therefore allow us to identify the variables responsible for these differences.
4.1. Characterization of the Cities
Taking into account the close positions of some groups in Appendix A Figure A2, the characterization of some of them will be done jointly, in order to understand their differences. This situation occurs between group 1 and group 2, on the one hand, and between group 3 and group 4, on the other.
Group 1 is made up of cities that are relatively larger than the average of the total of cities analysed (according to data in Figure 4), close, on average, to 100,000 inhabitants in the 1981 census, and that have not experienced rates of increases above the annual average (central position in the graph in Appendix A Figure A1), so that in the 2011 census they exceeded 120,000 inhabitants (in average values). The number of homes has also grown relatively more than average, driven by population growth and also by the urban boom, which has caused the population–housing ratio (PD rate) to fall significantly, especially between the 1981 and 2001 censuses. Therefore, it is a group of relatively large cities—with a moderate–high real estate effect (Figure 4, left). In medium-sized cities with a more industrial profile and a larger dimension, urban expansion has been more relevant and definitive. In recent decades, the generation of areas of urban influence has started beyond the traditional urban centre, such as Burgos, Lleida, Palencia or Gijón.
As shown in Figure 4, the main difference between groups 1 and 2 is the size of the cities (population) that comprise them. Group 2 is made up of smaller cities than the average of those analysed. However, population growth has been slower in group 1 (blue bars indicate the faster-growing population). This population growth has brought with it an increase in the number of houses, but it has also been driven by the real estate effect, since the value of the PD rate has fallen. Comparing the values of that ratio in Figure 4, the ratio corresponding to this group of cities was already below the average, making it a group of relatively small cities with a previous moderate real estate effect (Figure 4, right).
These cities are initially more closely linked to regions with a basically agrarian function. Their dynamics have been reduced and are very irregular, generating considerably limited urban growth, which, however, has meant in some cases small samples of integration of these nuclei with their surroundings, such as Lugo, Soria or Sagunto. A decrease in, and possible destruction of agricultural areas and rustic land has occurred, delimiting an entire peri-urban belt in transformation, in which rents from agricultural land cannot compete with those for potential urban uses. Competitive efforts have been increased between municipalities to obtain investments, improving their facilities or residential or industrial land provisions, but without normally coordinating actions and, on occasions, unnecessarily doubling the provision of some uses which, as a result, have been undervalued, underused or directly wasted. There is a potentially significant impact on the loss of the sustainability of cities and especially the loss of ecosystems services.
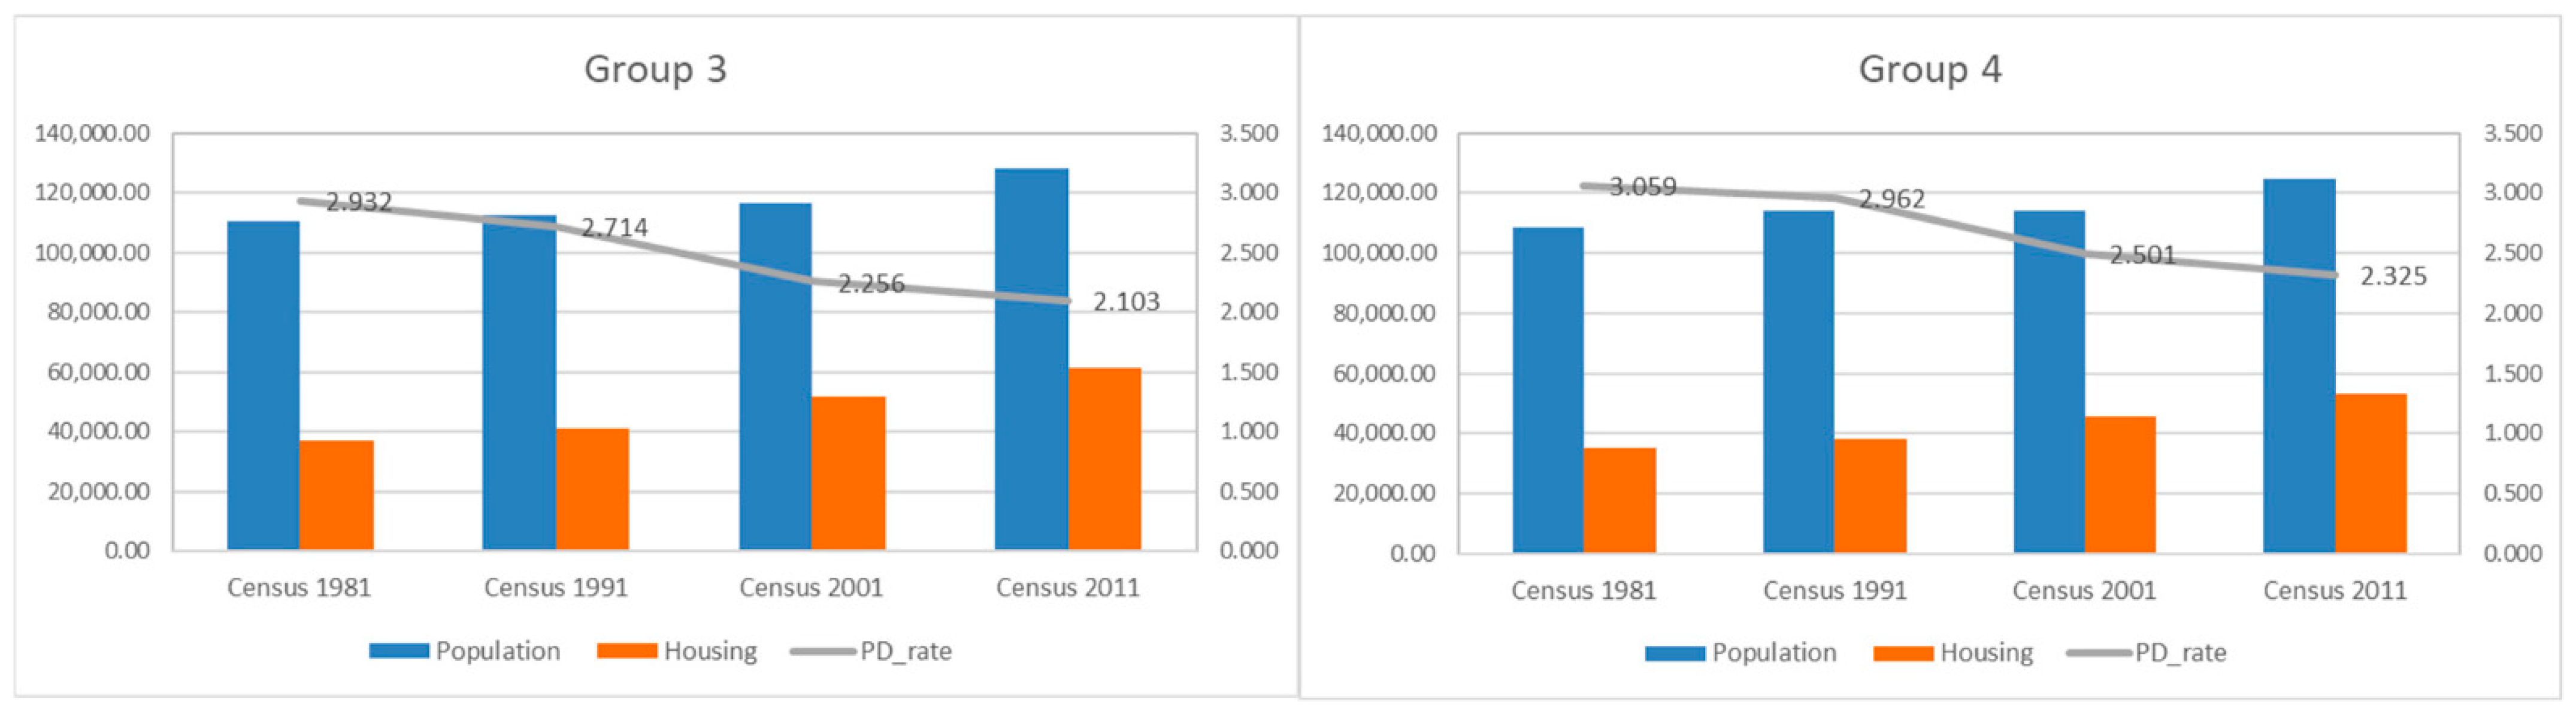
Groups 3 and 4 contain the largest cities of the total of Spanish average cities (average population values above the general average), already exceeding 100,000 inhabitants in the 1981 census and 120,000 in the 2011 census. The number of dwellings has also been growing, somewhat faster in group 3 than in group 4 (observing the orange bars of both groups). The real estate effect is similar, being slightly more marked in the case of group 3. This fact translates into the main difference between both groups: group 4 brings together the set of cities that has a PD ratio in all censuses above average. Group 3 can be identified as larger medium-sized cities with a moderate real estate effect and group 4 as larger medium-sized cities with a moderate–low real estate effect (Figure 5).
The proliferation of suburbs, commercial areas and industrial zones around cities has led not only to the modification of their urban landscapes and forms, but also to the systematic modification of their role in the urban hierarchy, taking into account their functional provisions and connection with other territories. Thus, cities in group 3 such as Badalona, Vitoria or Algeciras show moderate growth, while those in group 4, including Ciudad Real or Guadalajara, show little growth. As in the previous cases, the description of group 5 will allow us to characterize it (Figure 6, left).
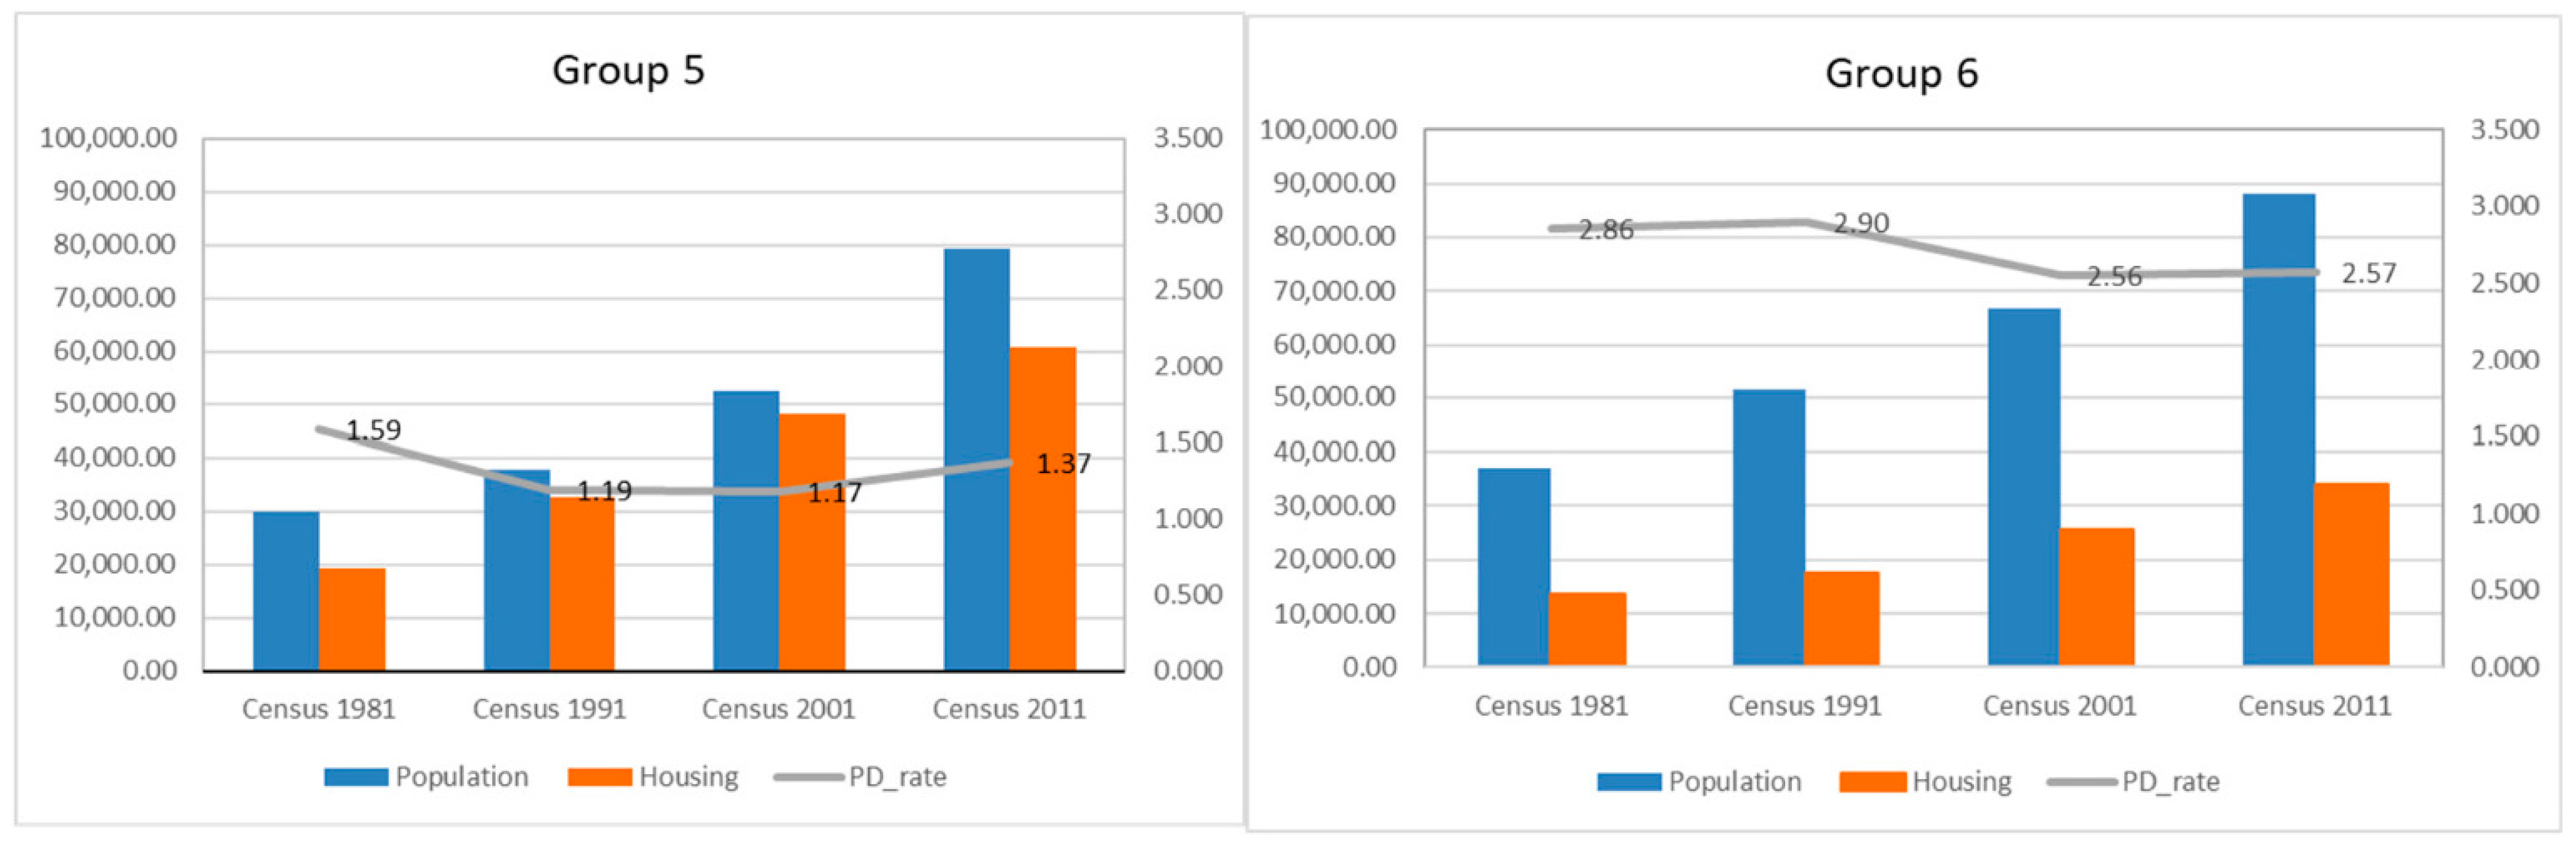
This group is made up of smaller cities than in the previous groups, in which the population grew more noticeably between the 2001 and 2011 censuses. In addition, they are populations with a large number of dwellings (since the census of 1981). As can be seen in Figure 6, the bars representing the number of dwellings are above half of the population blue bars. Consequently, the fundamental characteristic of the group is its low population-housing ratio, being especially low between the 1991 and 2001 censuses. Group 5 has been labelled as medium-sized cities with high growth and a very high real estate effect.
Indeed, many of these medium-sized cities of structural rank in the national urban system had been especially dynamic since the mid-1960s and 1970s, doubling their population and size, even with growth rates higher than those of cities of more than a million inhabitants. At the time, they showed natural growth rates higher than the national averages, as a result of younger demographic structures, reflecting a process of socioeconomic transformation accelerated by Spanish developmentalism. In this context, migratory dynamics were formed with interregional movements that consolidated some of the classic imbalances in the distribution of urban settlements, such as Torrejón, Valdemoro or Fuenlabrada.
Figure 6 (right) shows the means relative to group 6 for which the label of high growth-low real estate effect has been chosen. The justification lies in the behaviour of its population (it has multiplied by approximately 2.5 in average terms) and population-housing ratio, which is above the global average, with intermediate periods with almost no variation (between the 1981 and 1991 censuses, on the one hand, and the 2001 and 2011 censuses on the other).
Growth trends emerging in some of these nuclei have sometimes generated uncontrolled suburbanization processes, characteristic of spontaneous growth, in a context, however, apparently regulated by consolidated planning. These cities, located for the most part in interior regions of the Peninsula and defined by the provincial functions of articulation of their most immediate territories, have only begun to extend beyond their municipal limits in a context marked by the dynamics of the economic and constructive boom that led to the bursting of the housing bubble. From this perspective, conflicts of use have been generated and the debate opened in these cities about the inconvenience of the diffuse city and the preservation of the compact one, such as Benidorm, Benalmadena or Torremolinos, which have undergone spectacular growth due to the population of second-residence owners who spend practically all year there.
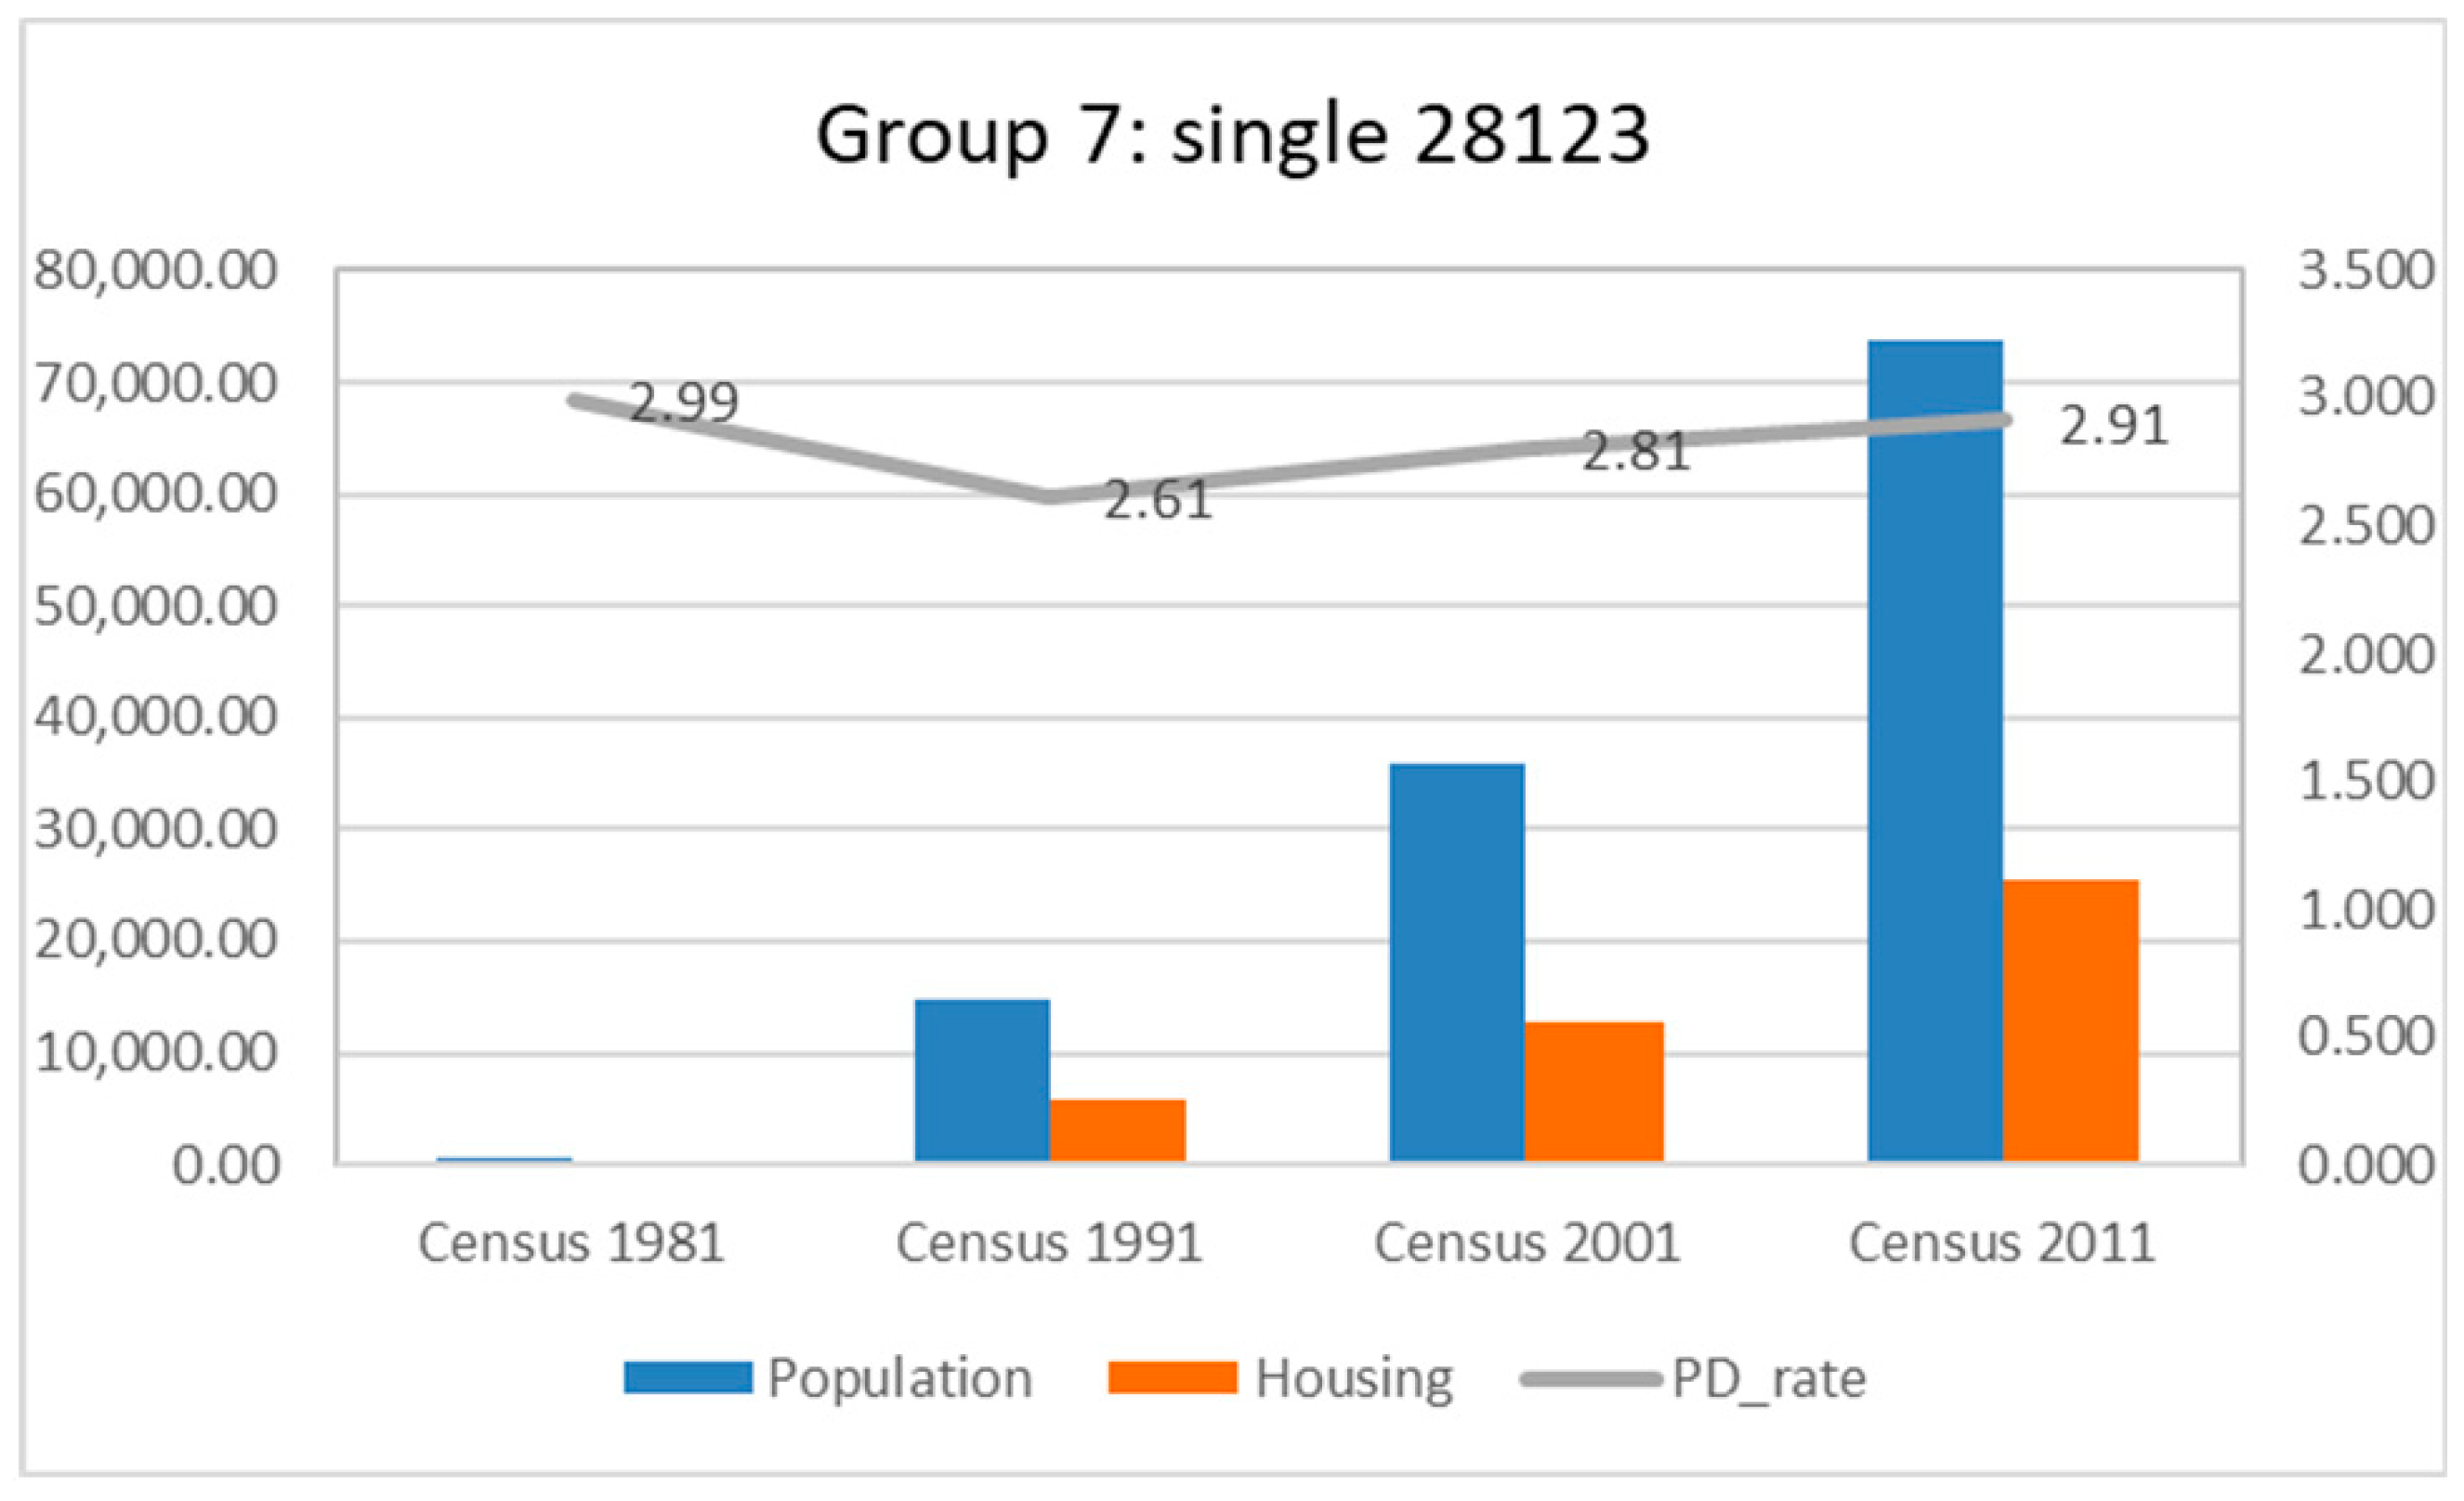
Finally, the description of the groups ends with the analysis of group 7, which identifies with a single city (Rivas-Vaciamadrid), taking into account its peculiar characteristics (Figure 7).
The average annual variation in population and dwellings was similar and very marked, exceeding average increases in both indicators, especially since the 1991 census. In fact, it is now a city with a population exceeding 73,000 inhabitants. The rate of housing construction was also very high, but in general at a slower rate than the growth of its population, given that the population-housing ratio has been increasing since the 1991 census.
4.2. Demographic Behavior of Groups
In order to complete the study, other demographic and urban variables have been evaluated for each of the defined groups. These variables are:
- -
- Those relating to the population of cities in 2008 and 2018.
- -
- The aging index for 2001, 2008 and 2018, defined as the quotient between people aged 65 and over, with respect to people under 15 years of age, multiplied by 100. According to Preedy and Watson, the aging index refers to the number of elders per 100 persons younger than 15 years old in a specific population. This index increases as the population ages [53].
- -
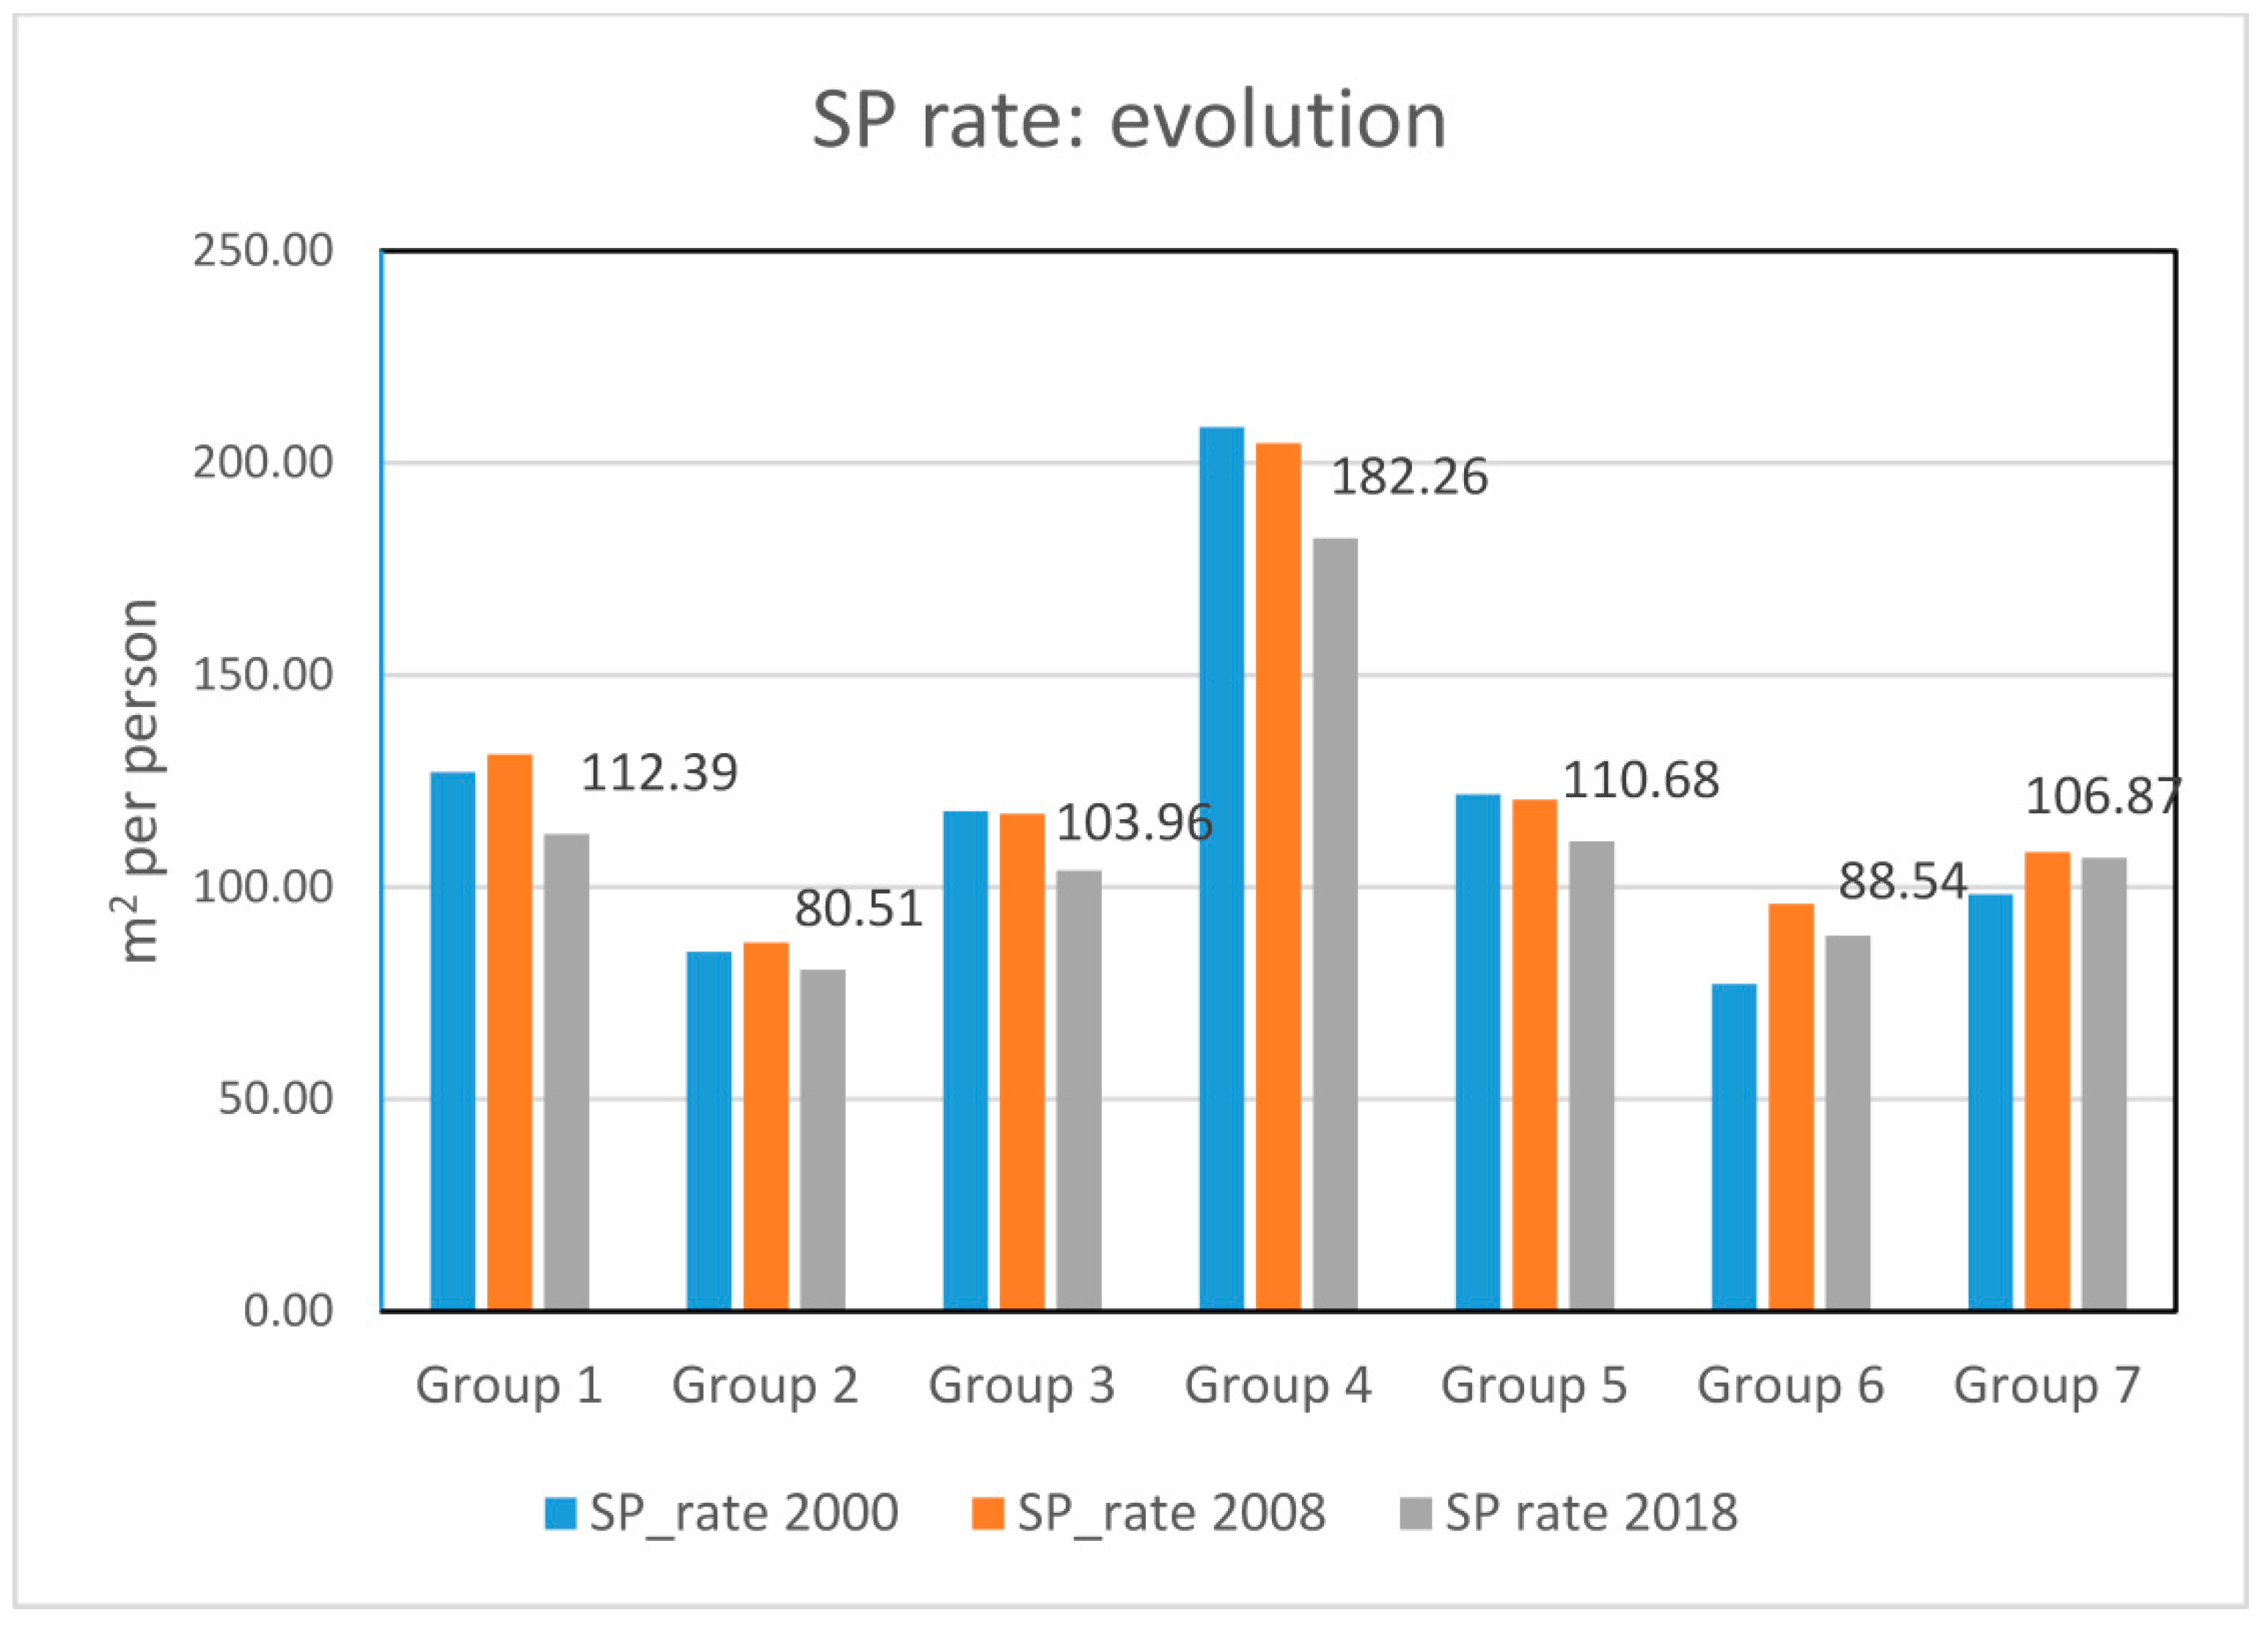
- The ratio of built area to total inhabitants: this quotient represents the square meters that, on average, correspond to each person in the population. These data are available for 2000, 2008 and 2018.
We now comment on the previous results, starting by specifying some questions related to the variables not taken into account to establish the typology of cities:
- -
- The variables corresponding to the population in 2008 and 2018 come from the administrative register (census) of each municipality and are not significantly different from the census data analysed.
- -
- The variables for the age of the population, with which the aging index has been elaborated show population structure in comparison with age.
- -
- The variables for the built-up area (and therefore the ratio defined as the ratio between area and population).
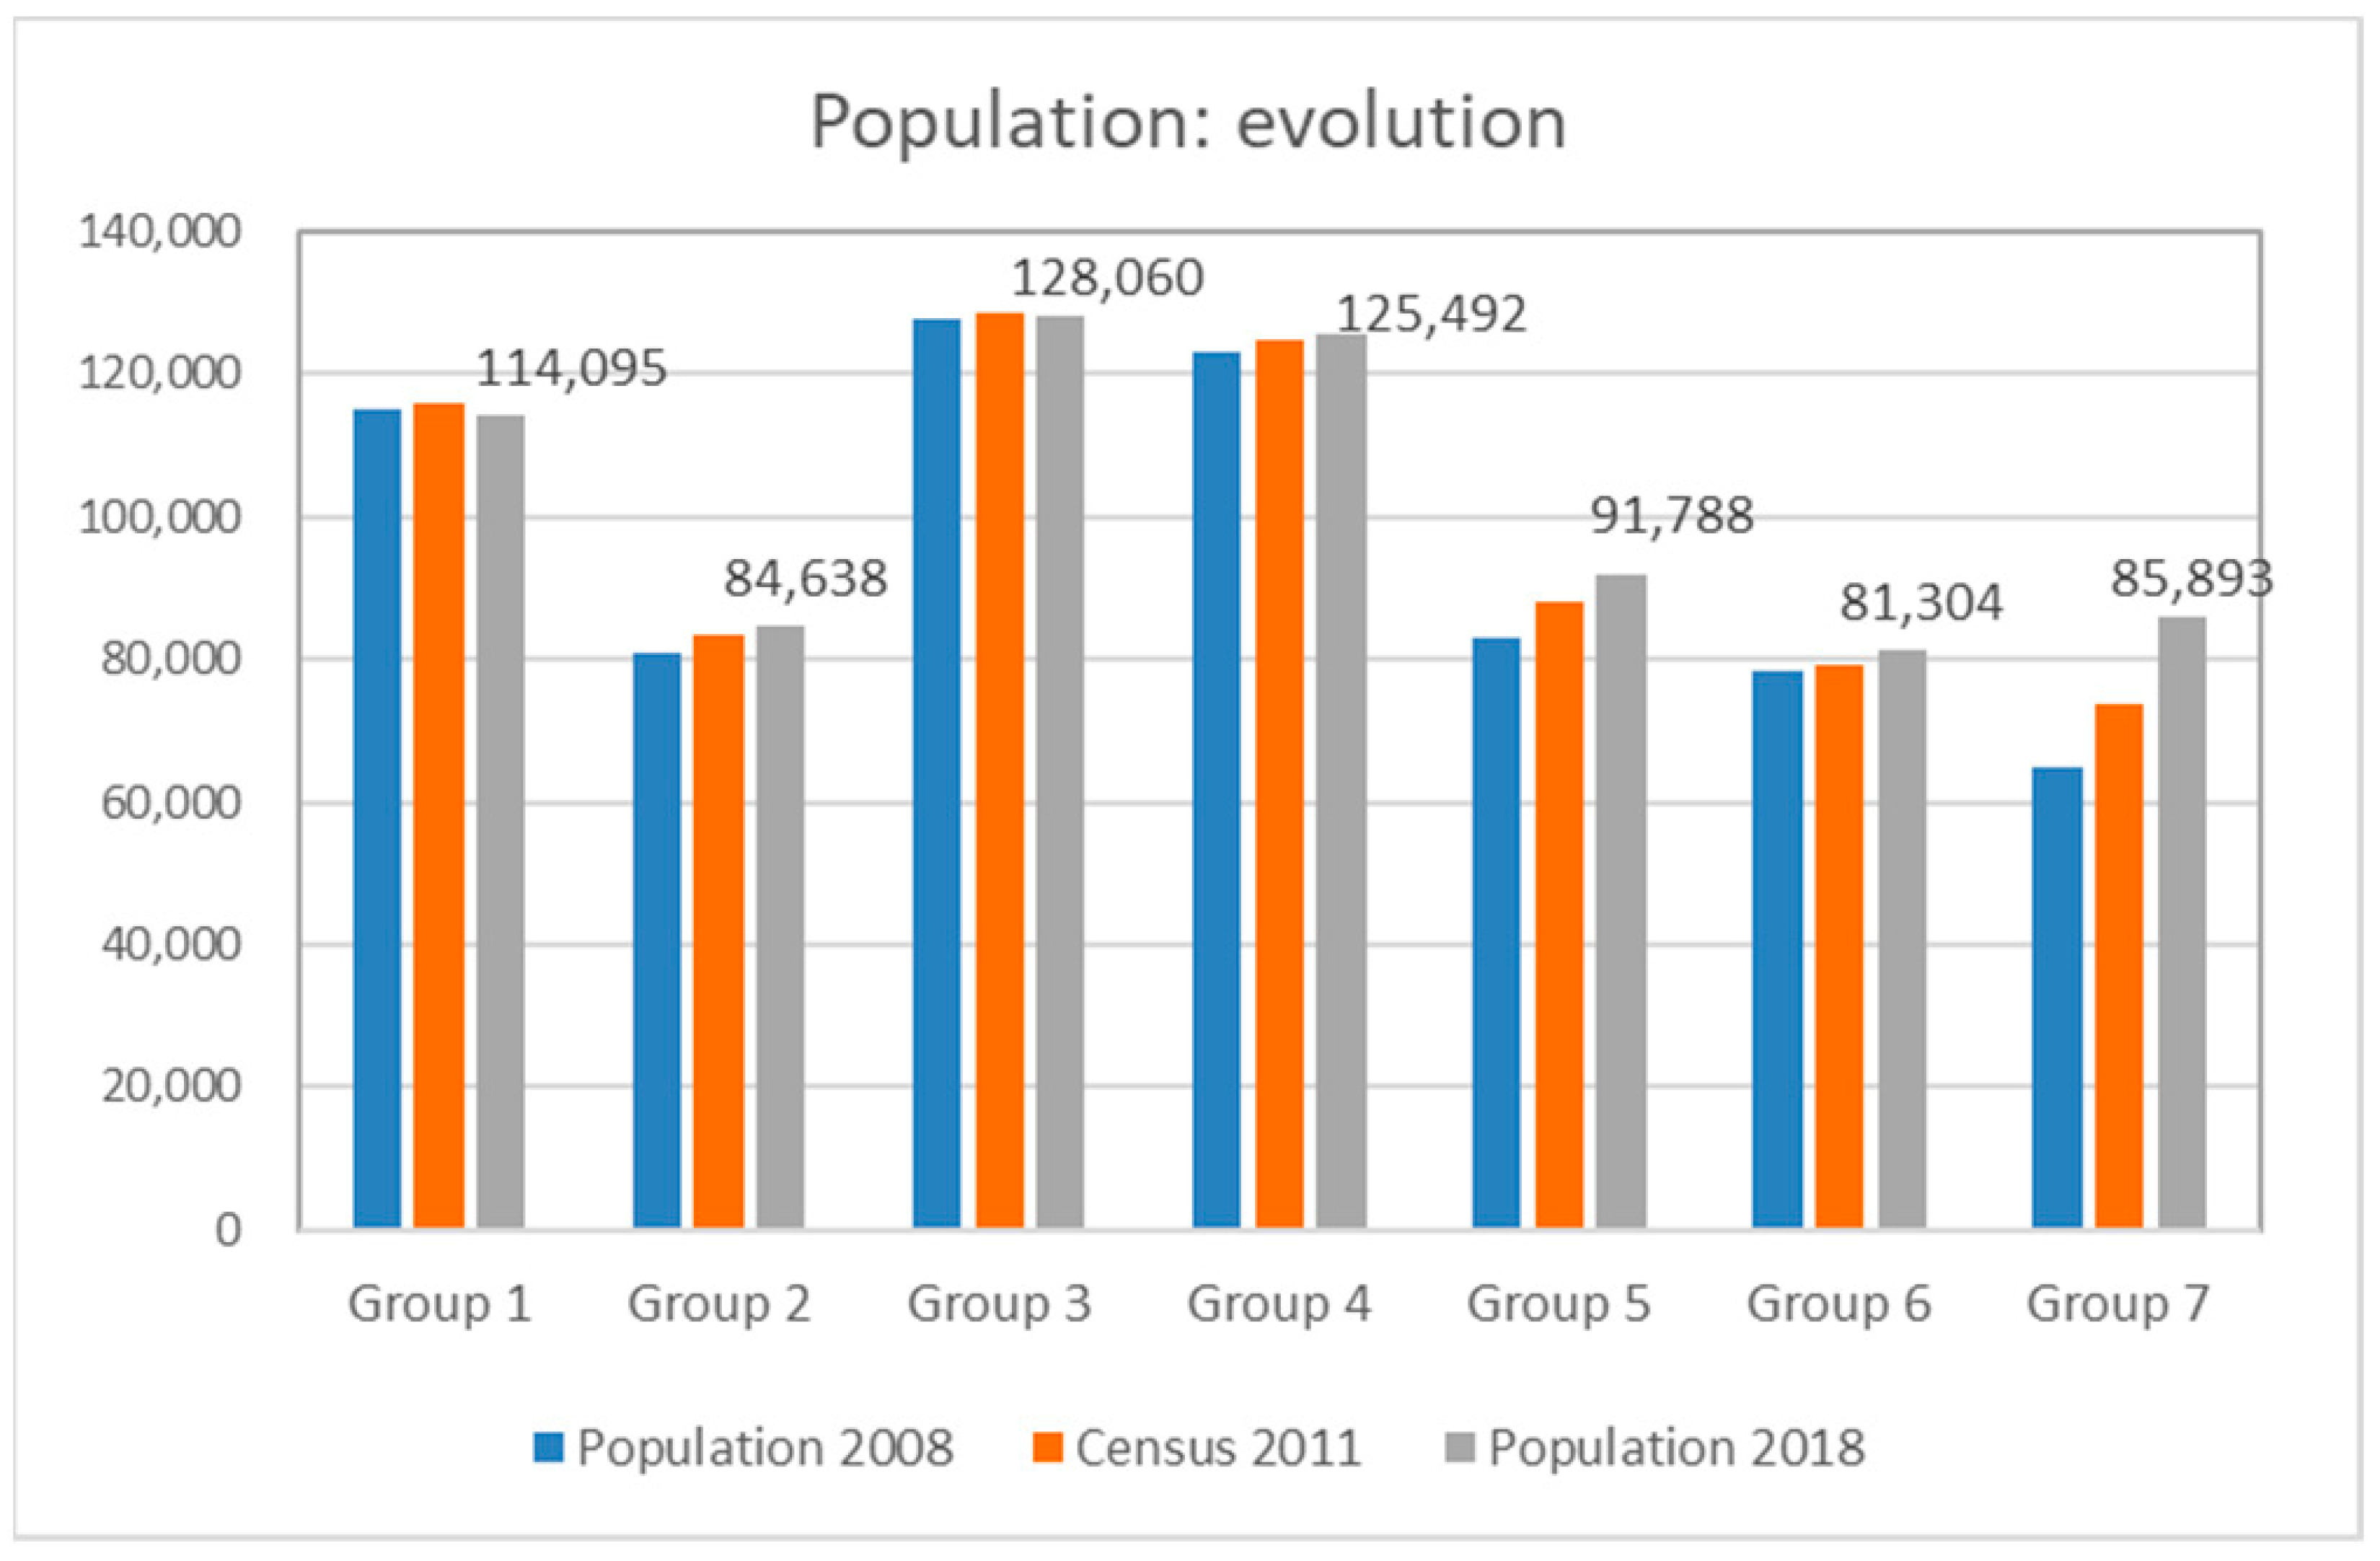
The analysis of these variables according to the defined groups enriches the results obtained. Figure 8 shows the values for group 7 (a single city) and the mean values for other groups in the population for 2008, 2011 (census) and 2018.The census year considered for the classification (year 2011) shows that the two years analysed only underline what has already been indicated for the different groups. Groups 2, 4, 5, 6 and 7 show population growth (especially group 7). On the other hand, stagnation is observed in groups 1 and 3, and even a decline in population in the cities forming these groups.
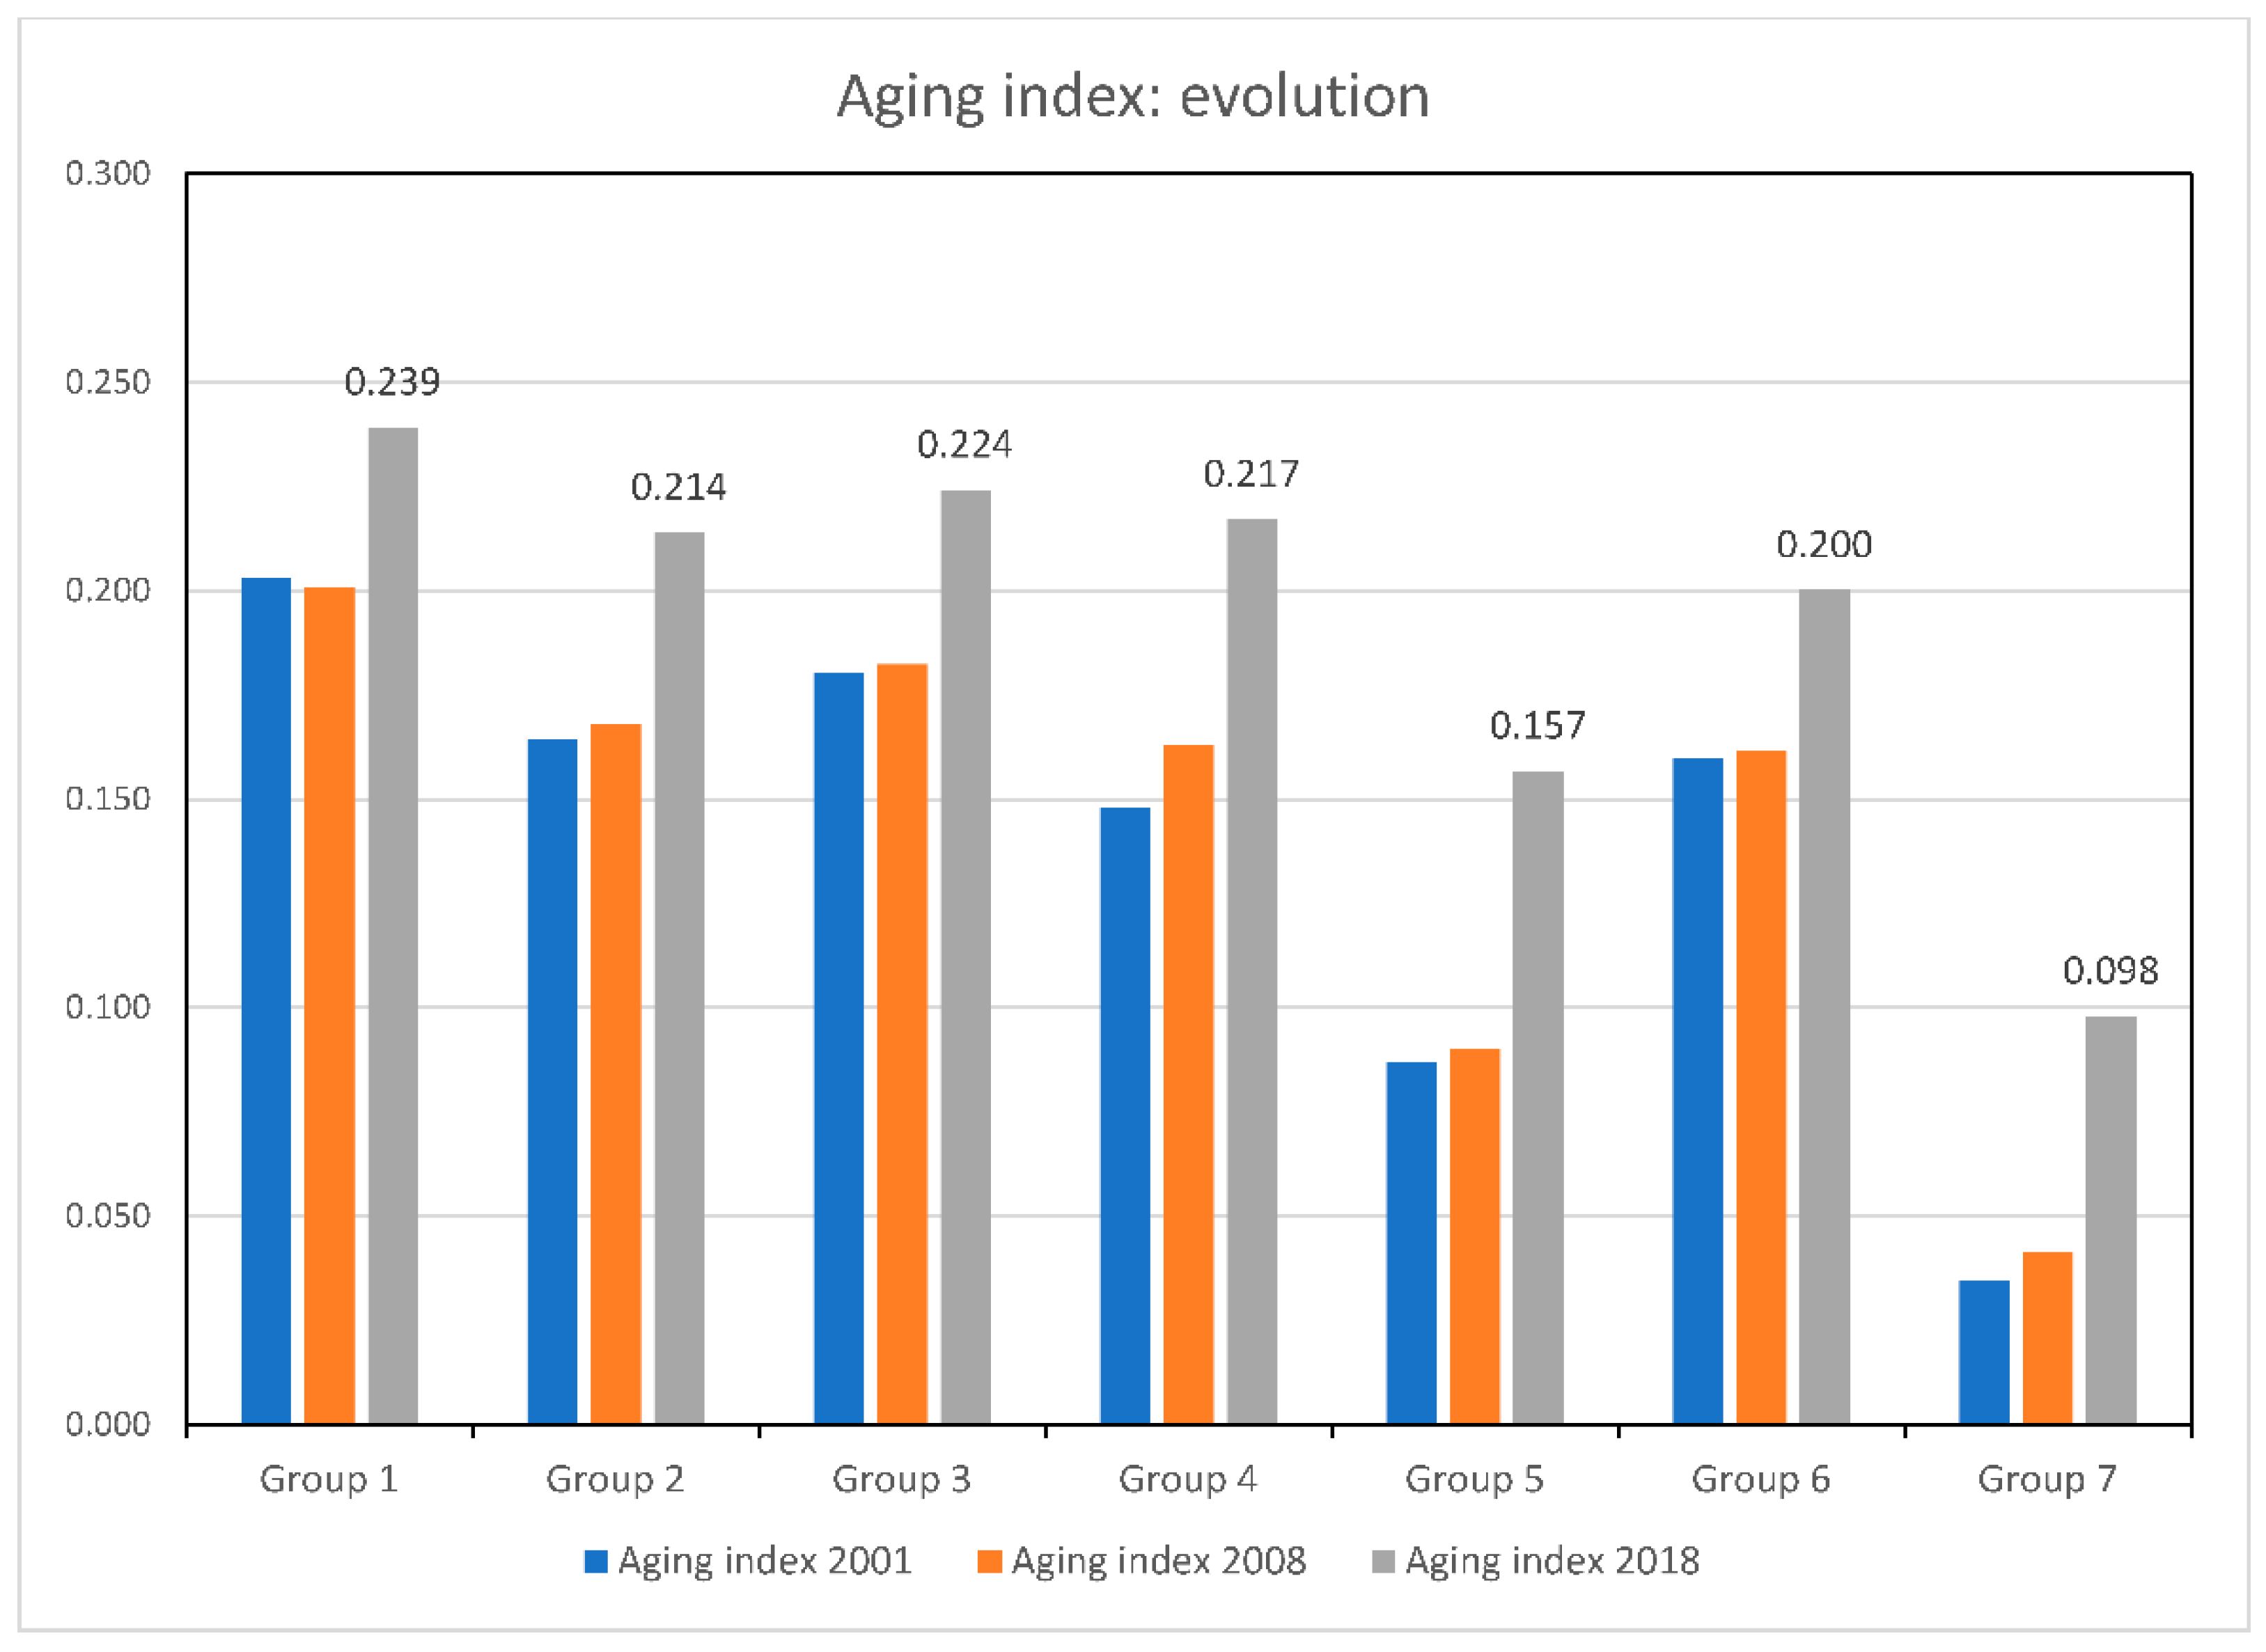
Figure 9 analyses the aging index in 2001, 2008 and 2018.
A higher value of this indicator expresses an older population. The oldest groups correspond to 1, 2, 3 and 4, and 6, 5 and 7 to the less-aged groups. This circumstance is maintained for all the study years, observing a clear trend in aging in all groups, and that figures for 2018 were clearly the highest. The built-up area expressed per person, in the years for which the cadastre information is available, is shown in Figure 10.
As can be seen, differences between years are not very relevant, although in all groups there is a decrease in the indicator in 2016 (grey bar). Differences are clearly seen between the defined groups: group 4 includes the largest built-up area per person, whereas group 2 has lower values.
5. Discussion
The conceptual debate on the definition of medium-sized cities remains open, and there is no consensus on the functional or demographic criteria required to define and characterise this type of city. In the case of Spain, medium-sized cities play an important role. There are many challenges and questions to be answered. The existence of rural–urban structures in the immediate surroundings of the studied cities is a good example of how difficult it is to integrate these peri-urban areas. The growth of residential areas and inconsistent planning of urban areas and industrial estates shows singular contrasts.
Within the European context determined by the Lisbon Agenda (2000), the debate on these cities includes new approaches and factors that increase the leadership of previous periods, with a marked trend towards economic survival in a globalised world, with the hope of establishing the population and increasing employment with a good standard of living: the addition of knowledge, innovation and creativity to increase competitiveness [54,55] and understanding at multiple levels amongst the different actors, led by strategic planning [56]; specialisation in functions, services, new centralities and use of advanced transport infrastructures and access to improve territorial cohesion [57]; greater social justice, territorial capital and treatment of environmental issues to improve citizens’ standard of living [18]; or the classification and characterisation of these cities. The advantage is that different groups can be established according to these variables, which would not be possible without this methodology due to the large volume of data involved.
One of the disadvantages is that how useful this method is depends on the capacity of the researchers to compile a sufficient set of attributes. If important attributes are excluded or overlooked, the value of the procedure is reduced.
5.1. Alternative Scenarios
In this context, it should be noted that globalization and directed decentralization have promoted new centralities, especially through service activities [58], altering the functionality of intermediate cities. Horizontal relationships with other urban centres of the same hierarchical level have assumed a growing role. The latter shows that the traditional hierarchical reading of urban networks is changing, more horizontal vision and functional complementarity with other cities being incorporated [35,59]. Medium-sized cities are now understood to be centres of social facilities and specialized services that generate economies of scale and territorial competitiveness and have a greater capacity to control social and economic costs [60]. The importance of innovation processes, territorial competitiveness and creativity are also incorporated to take advantage of their traditional strengths in outdated activities [61].
These cities have characteristics linked to their relationship with the immediate territory (more fluid and balanced than in large metropolitan environments), and to forms of governance and participation that are closer to the citizen or to better environmental conditions, sometimes associated with quality of life, as they have a pleasant social and environmental setting with diverse service facilities that contribute to increasing their residential function [62].
Nevertheless, this study underlines the complexity and diversity of questions that currently revolve around the debate on Spanish medium-sized cities. The major contribution is methodological as a correlation between population and housing is established which determines a typology of cities proven to be correlated. Also, 7 groups of cities have been created according to these variables.
In relation to their dynamics, some are characterized by high demographic growth and a reduced labour market (for dormitory cities), or a high level of centrality, associated with certain specialized functions. In the last two decades, processes linked to global logics and local responses have been accentuated.
5.2. Limitations
Globalization is reinforcing the idea of the need for networked territories, as a mandatory requirement to guarantee certain competitiveness, determined by the logic of capital [55]. Activities and equipment are decentralized and relocated. Some of these procedures are reflected in metropolisation processes. In the surroundings of metropolitan areas, new urban spaces have been reorganized under the label of “relief cities” [24]. Some medium-sized cities have reproduced the same processes in their urban areas as those that have characterised larger cities in recent decades [48]. In less favourable scenarios, they appear marked by the loss of competitiveness and centrality, becoming part of the collective of shrinking cities.
The reality is that, from this perspective, the last twenty years have meant for these cities an important change in their expectations of a repositioning in the urban network at all scales. Distances with larger urban centres have been greatly shortened in terms of their facilities and capacities, transport and communications networks that bring them closer to national metropolises. They are potentially areas of growth and, at the same time, decongestion of neighbouring urban agglomerations. Their urban growth has improved facilities and enabled the arrival of new infrastructures, although urbanization has not always been continuous, as in many cases, it has occurred irregularly, with multiple problems, mainly derived from their accessibility. Thus, this type of urban area has increased functional competition between the urban centre and potential new commercial or recreational–commercial surfaces that have been installed on the outskirts, affecting new municipalities.
The problems detected are not the object of this study, but should be researched in the future.
6. Conclusions
This study of Spanish medium-sized cities was carried out from an analytical and diachronic perspective, based on a set of indicators that allow us to evaluate their behaviour in the long term (four decades). Population and housing variables were used to gain an understanding of this behaviour. Although this type of study has been used in previous work, in this case, statistical and cartographic processes were used to identify changes in both variables that synthesise urban dynamics. The use of Principal Component Analysis (PCA) produced homogenous groups of cities which, together with cartography, contributed to linking the resulting spatial structure. This study also links each group with the demographic size of the cities comprising them.
The methodology used has enabled these cities to be identified within the thresholds of 50,000 to 300,000 inhabitants (133 cities). It is clear that the municipal scale is insufficient to cope with planning and formulas that examine the possibility of intramunicipal collaboration are required. Demographic growth in these cities, from the 2008 crisis onwards, has generally been very weak. They have been grouped together in seven categories according to their population and housing dynamics, explained by their location, position in the communications network, functional specialisation, capacity to act as an intermediary, their innovation and territorial organisation, or level of complementarity/integration with other cities of the same or higher hierarchic level.
Group 1 is mainly composed of coastal cities located far from large Spanish urban centres, with a relatively weak demographic and housing dynamic, and a certain level of functional specialisation towards different activities (industrial, port, administrative or university city). Group 2 is formed by smaller cities that are usually situated close to a larger one, but which have been more dynamic than in the previous case. Group 3 represents cities with a larger population, a certain level of functional diversification, located relatively far from large cities, and with the capacity to organise functional areas at the provincial level. Groups 4 and 5 are formed by cities that participate directly in the dynamics of the metropolitan area in which they are integrated. Their level of organisation is the same as the governing elements of the Spanish urban system. Group 6 comprises coastal cities with a functional social and economic specialisation of urban areas in sun and beach tourism, with population and housing dynamics associated with these activities. Finally, in group 7, there is only one city, characterised by abnormal growth dynamics due to its high level of commercial specialisation and proximity to Madrid (Appendix A Figure A3).
The vision of Spanish medium-sized cities as a whole brings to light a dynamic with its own personality. Medium-sized cities cannot be seen merely as administrative centres. They are much more complex, participating in networks, cooperating actively at all levels (institutional, financial, social…) with specialised productive profiles. They also interact with other very diverse territories and can even constitute innovative spaces.
The group of medium-sized cities as a whole comprises approximately half of the population of large cities. From the perspective of dynamics, they are attractive and competitive because their growth rate is above the average (in particular in comparison with larger cities). They also participate in the debate on sustainable urban development, which supports cities that are more sustainable and fit to live in, as well as being the driving force in the circular economy. This makes their role more important both generally and, specifically, in the case of Spain, where new urban agendas insist on more sustainable cities built with the aim of improving their citizens’ quality of life (social and environmental).
As a final conclusion, the defined indicators, applied methodology and typology of medium-sized Spanish cities, identified based on population and housing dynamics, constitute an excellent starting point for further studies. Each defined group can be analysed based on the dynamics of the municipalities and surroundings, and requires different strategies for addressing and applying the concept of circular economy. The analysis of these indicators over time will allow the maintenance or non-maintenance of the groups identified in this paper to be addressed. During recent years, the transformation of peri-urban spaces in medium-sized cities has been one of the most interesting dilemmas of recent Spanish urbanism. The debate on the dynamics of medium-sized cities and their typologies remains open and is essential for developing directives in strategic planning or infrastructure, as it provides a comprehensive reality and enriches the debate on national, regional or local public policies.
Author Contributions
Conceptualization, F.C.-A.; M.-J.G.-G. and M.-E.V.-P.; methodology, F.C.-A.; M.-J.G.-G. and M.-E.V.-P.; formal analysis, F.C.-A.; M.-J.G.-G. and M.-E.V.-P.; writing—review and editing, F.C.-A.; M.-J.G.-G. and M.-E.V.-P. All authors have read and agreed to the published version of the manuscript.
Funding
This research received no external funding.
Institutional Review Board Statement
Not applicable. The study did not require ethical approval.
Informed Consent Statement
Informed consent was obtained from all subjects involved in the study.
Data Availability Statement
The data presented in this study are available on request from the corresponding author.
Acknowledgments
Spanish medium-sized cities: urbanization and urban policies. Forty years of democratic city councils RTI2018-096435-B-C21 + C22. Subproject: “Processes of change in the urbanization of medium-sized cities and their urban areas: 1979–2019. Project—RTI2018-096435-B-C22. Ministry of Science, Innovation and Universities.
Conflicts of Interest
The authors declare no conflict of interest.
Appendix A
Figure A1.
Dendrogram and the final partition of clusters (7 groups). Source: Authors’ own.

Figure A2.
Indicators on the factorial plane (left side). The 7 groups on the factorial plane (right side). Source: Authors’ own.
Figure A2.
Indicators on the factorial plane (left side). The 7 groups on the factorial plane (right side). Source: Authors’ own.


Table A1.
Medium-sized cities and their groups. Source: Authors’ own. NSI: National Statistics Institute.
Table A1.
Medium-sized cities and their groups. Source: Authors’ own. NSI: National Statistics Institute.

Figure A3.
Typology of medium-sized cities in Spain. Source: Authors’ own.

References
- Carrillo, D.N. Patrimonio y Ciudad. Barriadas Residenciales en Ciudades Medias del Litoral: Un Análisis Comparado entre Andalucía, Portugal y los Países Bajos (Heritage and City. Mass Housing Neighbourhoods in Medium-Sized Coastal Cities: A Comparative Analysis among Andalusia, Portugal and the Netherlands); Universidad de Sevilla: Sevilla, Spain, 2020; Available online: https://hdl.handle.net/11441/95697 (accessed on 20 July 2020).
- Olsson, D. Walkability Index Implementation and Analasys of Valhallavägen; KTH: Stockholm, Sweden, 2014. [Google Scholar]
- Monteiro, P. Pedestrian Accessibility and Attractiveness Indicators for Walkability Assessment; Universidad Técnica de Lisboa: Lisboa, Portugal, 2012. [Google Scholar]
- Campos Sánchez, F.S. Ciudades medias españolas siglo XXI. Revisión y análisisbibliométrico (Medium-sized Spanish cities XXI century. Bibliometric review and analysis). Cuadernos Geográficos 2017, 56, 217–241. [Google Scholar]
- UNCHS. An Urbanizing world. In Global Report on Human Settlements; United Nations Centre for Human Settlements (Habitat); Oxford University Press: Oxford, UK, 1996. [Google Scholar]
- ESPON. Espon (European Spatial Planning Observation Network) 1.4.1. In The Role of Small and Medium-Sized Towns (SMESTO); Final report; European Community: Luxembourg, 2006. [Google Scholar]
- Ellen Macarthur Foundation. Cities and the Circular Economy. 2020. Available online: https://www.ellenmacniarthurfoundation.org/explore/cities-and-the-circular-economy (accessed on 20 May 2020).
- Kirchherr, J.; Reike, D.; Hekkert, M. Conceptualizing the circular economy: An analysis of 114 definitions. Resour. Conserv. Recycl. 2017, 127, 221–232. [Google Scholar] [CrossRef]
- Suarez-Eiroa, B.; Fernández, E.; Méndez-Martínez, G.; Soto-Oñate, D. Operational principles of circular economy for sustainable development: Linking theory and practice. J. Clean. Prod. 2019, 214, 952–961. [Google Scholar] [CrossRef]
- Casas, J.G.; Ibarz, J.V. Ciudades Medias en España: Posición en la Red Urbana y Procesos Urbanos Recientes (Medium Cities in Spain: Position in the Urban Network and Recent Urban Processes); Caja Rural Intermediterránea: Barcelona, Spain, 2003. [Google Scholar]
- Sassen, S. The Global City; Princenton University Press: New York, NY, USA, 2001. [Google Scholar]
- Brunet, R. Les Villes Européennes; Rapport pour la DATAR; GIP RECLUS: Montpellier, France, 1989; p. 85. [Google Scholar]
- Brunet, R. Des villes comme Lleida. Place et perspectives des villes moyennes en Europe. In Ciudades Intermedias. Urbanización y Sostenibilidad (Intermediatecities. Urbanization and Sustainability); Bellet, C., Llop, J.M., Eds.; Editorial Milenio: Lleida, Spain, 2000; pp. 109–124. [Google Scholar]
- Amen, M.M.; Archer, K.; Boman, M.M. (Eds.) Relocating Global Cities: From the Centre to the Margins; Rowman and Littlefielf: Lanham, MD, USA, 2006. [Google Scholar]
- Kuzmman, K. Medium-sized Towns, Strategic Planning and Creative Governance in the South Baltic Arc. 2009. Available online: http://midsizecities.blogspot.com/ (accessed on 30 July 2020).
- Arbelaitz, O.; Gurrutxaga, I.; Muguerza, J.; Pérez, J.M.; Perona, I. An extensive comparative study of cluster validity indices. Pattern Recognit. 2013, 46, 243–256. [Google Scholar] [CrossRef]
- Ross, C.L. Mega Regions, Planning for Global Competitiviness; Island Press: Washington, DC, USA, 2009. [Google Scholar]
- Kuzmman, K. Mid-sized cities. Challenge in Europe and in the USA. 2010. Available online: http://midsizecities.blogspot.com/ (accessed on 20 July 2020).
- Burriel, E. La década prodigiosa del urbanismo español (1997–2006) (The prodigious decade of Spanish urbanism (1997–2006). Scripta Nova 2008, 12, 64. [Google Scholar]
- Pumain, D.; Gyerois, M.; Pulus, F. L’etalement urbain en France. GeoInnova 2003, 8, 81–102. [Google Scholar]
- Puissant, S.; Lacour, C. Mid-sized French cities and their niche competitiveness. Cities 2011, 28, 433–443. [Google Scholar] [CrossRef]
- Galeone, P. Mid-sized cities in Italy. Mid-size cities in the Knowledge economy IUFA. In Proceedings of the IUFA 2009 Conference, Bologna, Italy, 13–17 June 2009. [Google Scholar]
- Czerny, M. La ciudad de Plock y el proceso de diffusion urbana en la realidad de Polonia (The city of Plock and the urban diffusion process in the reality of Poland). In Ciudades Medias. Formas de Expansión Urbana; Cebrián, F., Panadero, M., Eds.; Editorial Biblioteca Nueva: Madrid, Spiain, 2013. [Google Scholar]
- Brigitte, A. Medium-sized cities in urban regions. Eur. Plan. Stud. 2007, 14, 547–555. [Google Scholar]
- Eurostat Methodological Manual on Territorial Typologies. 2018. Available online: https://ec.europa.eu/eurostat/documents/3859598/8012444/KS-GQ-17-006-EN-N.pdf/a3f1004f-cfae-4cc4-87da-81d588d67ae2 (accessed on 20 July 2020).
- Cruz, M. El contexto de la ciudad difusa desde la realidad de las ciudades medias y pequeñas (The context of the diffuse city from the reality of medium and small cities). In Ciudades Medias. Formas de Expansión Urbana; Cebrián, F., Panadero, M., Eds.; Biblioteca Nueva: Madrid, Spain, 2013; pp. 39–48. [Google Scholar]
- Vapñarsky, C.A.; Gorojovsky, N. El Crecimiento Urbano en la Argentina (Urban Growth in Argentina); Grupo Editor Latinoamericano-IIED: Buenos Aires, Argentina, 1990. [Google Scholar]
- Sassone, M.S. Reestructuración territorial y ciudades intermedias en Argentina (Territorial restructuring and médium-sized cities in Argentina). Ciudad Territ. Estud. Territ. 2000, 123, 57–92. [Google Scholar]
- Ruiz, D.G.; Cuevas, P.D.; Braçe, O.; Garrido-Cumbrera, M. Developing an Index to Measure Sub-municipal Level Urban Sprawl. Soc. Indic. Res. 2018, 140, 929–952. Available online: https://doi.org/10.1007/s11205-017-1801-3 (accessed on 30 July 2020). [CrossRef]
- Martínez, J.M.S. La distribución espacial en España de las ciudades de tamaño intermedio, 25.000-50.000 habitantes (The spatial distribution in Spain of médium-sized cities, 25,000-50,000 inhabitants). Estud. Territ. 1986, 20, 139–160. [Google Scholar]
- Esteban, A.; López, A. El papel de las ciudades medias en España. Presente y futuro (The role of medium sized cities in Spain. Present and future.). Urbanismo 1989, 6, 6–16. [Google Scholar]
- Andrés López, G. Geografía y ciudades medias en España ¿a la búsqueda de una definición innecesaria? (Geography and medium cities in Spain, in search of an unnecessary definition?). Scripta Nova 2008, 270, 1–18. Available online: http://www.ub.edu/geocrit/sn/sn-270/sn-270 49.htm (accessed on 30 July 2020).
- Bellet, C.; Olazábal, E. Formas de crecimiento urbano de las ciudades medias españolas en las últimas décadas (Forms of urban growth in Spanish middle cities in recent decades). Terraplural 2020, 14, 1–19. [Google Scholar] [CrossRef]
- Ministerio de Fomento. Áreas Urbanas en España, 2018. 40 Años de las Ciudades Españolas (Urban Areas in Spain, 2018. 40 years of Spanish Cities). Available online: //apps.fomento.gob.es/CVP/handlers/pdfhandler.ashx?idpub=BAW058 (accessed on 20 July 2020).
- Ledo, A.P. La estructura terciaria del sistema de ciudades en España (The tertiary structure of the city system in Spain). Estud. Territ. 1987, 24, 53–76. [Google Scholar]
- Generalitat Valenciana. Metas + Propuestas de la Estrategia Territorial de la Comunidad Valenciana (Goals + Proposals of the Territorial Strategy of the Valencian Community); Generalitat Valenciana: Valencia, Spain, 2009. Available online: http://www.cma.gva.es/web/indice.aspx?nodo=65589&idioma=C (accessed on 20 July 2020).
- Bono, G.C. El caso de Andalucía (The case of Andalusia). VII Semana de Estudios Urbanos. In Ciudades Intermedias y Urbanización Mundial; Milenio: Lleida, Spain, 1998. [Google Scholar]
- García, A.A.; Angulo, J.V.; Jiménez, A.M. Propuesta de tipología para las ciudades españolas de tipo medio (Typology proposal for medium-sized Spanish cities). Rev. Estud. Geográficos 1978, 39, 285–306. [Google Scholar]
- Baigorri, A. De la ciudad intermedia a la mesópolis (From médium-sized city the intermediate city to the mesopolis). In Hacia la Urbe Global. Badajoz. Mesópolis Fronteriza; Editora Regional Extremeña: Badajoz, Spain, 2000; pp. 97–107. [Google Scholar]
- Vilagrasa, A. Las ciudades medias y pequeñas en España (Small and médium sized cities in Spain). In La Ciudad. Tamaño y Crecimiento. III Coloquio de Geografía Urbana; Universidad de Malaga: Málaga, Spain, 1999; pp. 17–49. [Google Scholar]
- Ledo, A.P.; Iglesias, A.M. Las Ciudades Medias en la Globalización (The Médium-Sized Cities in Globalization); Síntesis: Madrid, Spain, 2014. [Google Scholar]
- Cebrián, F. La red urbana (The urban network). In Geografía de Castilla-La Mancha; Pillet, F., Ed.; Biblioteca Añi: Ciudad Real, Spain, 2007. [Google Scholar]
- Linacero, J.J. Sistemas urbanos y ciudades medias en el arco atlántico (Urban systems and médium-cities in the Atlanticarc). VII Semana de Estudios Urbanos. In Ciudades Intermedias y Urbanización Mundial; Milenio: Lleida, Spain, 1998; pp. 143–168. [Google Scholar]
- Sanfeliú, C.B.; Torné, J.M.L.; Vilalta, M.J. Ciudades Intermedias. Urbanización y Sostenibilidad (Medium Sized City. Urbanization and Sustainability). 1999. Available online: https://www.amazon.es/Ciudades-intermedias-Urbanización-sostenibilidad-estudios/dp/848979085X (accessed on 20 July 2020).
- Méndez, R.; Michelini, J.; Romeiro, P. Redes socio-institucionales e innovación para el desarrollo de las ciudades intermedias (Socio-institutional networks and innovation for the development of medium-sized cities). Ciudad Territ. Estud. Territ. 2006, 148, 377–396. [Google Scholar]
- Caravaca, I.; González, G.; Mendoza, A. Indicadores De Dinamismo, Innovacion y Desarrollo. Su aplicación en ciudades pequeñas y medias de Andalucia (Indicators of Dynamism, Innovation and Development. Its application in small and medium cities of Andalusia). Boletín AGE 2007, 43, 131–154. [Google Scholar]
- Abellán, F.C. (Ed.) Dinámicas de Urbanización en Ciudades Medias Interiores: ¿Hacia un Urbanismo Más Urbano? (Urbanization Dynamics in Inland Middle Cities: Towards A More Urban Urbanism?); Tirant lo Blanch: Madrid, Spain, 2020. [Google Scholar]
- Unión Europea. Ciudades del Mañana. Retos, Visiones y Caminos A Seguir; Dirección General de Política Territorial; Unión Europea: Brussels, Belgium, 2011. [Google Scholar]
- Salvati, L.; Gargiulo Morelli, V.; Rontos, K.; Sabbi, A. Latent exurban development: City expansion along the rural to urban gracient in growing and declining regions of Southern Europe. Urban Geography 2013, 3, 376–394. [Google Scholar] [CrossRef]
- Lebart, L.; Morineau, A.; Piron, M. Statistique Exploratoire Multidimensionnelle; Dunod Publishers: Paris, France, 1995. [Google Scholar]
- Hair, J.F.; Black, W.C.; Banbin, B.J.; Anderson, R.E. Multivariate Analysis; Pearson Education Limited: London, UK, 2014. [Google Scholar]
- Anderson, T.W. An Introduction to Multivariate Statistical Analysis; John Wiley and Sons, Inc.: New York, NY, USA, 2004. [Google Scholar]
- Preedy, V.R.; Watson, R.R. (Eds.) Handbook of Disease Burdens and Quality of Life Measures; Springer: New York, NY, USA, 2010. [Google Scholar] [CrossRef]
- Caravaca, I.; González, G.; García, A.; Fernández, V.; Mendoza, A. Conocimiento, innovación y estrategias públicas de desarrollo: Análisis comparado de tres ciudades medias de Andalucía (España). Eure 2014, 40, 49–74. Available online: http://www.scielo.cl/pdf/eure/v40n119/art03.pdf (accessed on 20 July 2020). [CrossRef] [Green Version]
- Méndez, R. Estrategias de innovación para el desarrollo y la resiliencia de ciudades medias. Documents Anàlisi Geogràfica 2013, 59, 481–499. Available online: http://www.raco.cat/index.php/DocumentsAnalisi/article/view/291433/379906 (accessed on 30 July 2020). [CrossRef] [Green Version]
- Prada, J. Local strategies and networks as keys for reversing urban shrinkage: Challenges and responses in two medium-size Spanish cities. Nor. J. Geogr. 2014, 68, 238–247. [Google Scholar] [CrossRef]
- Trapiello, E.S.; Sanz, I.M.; De Ureña Francés, J.M. Global metropolitan-regional scale in evolution: Metropolitan intermediary cities and metropolitan cities. Eur. Plan. Stud. 2015, 23, 568–596. [Google Scholar] [CrossRef]
- Lacourt, C.; Puissant, S. Medium sized cities and the dynamics of creative services: An empirical overview. In Proceedings of the North American Science Council, Savannah, GA, USA, 7–10 November 2007; Cited in Puissant, S.; Lacour, C. Mid-sized French cities and their niche competitiveness. Cities 2011, 28, 433–443. [Google Scholar]
- Van Winden, W.; Van den Berg, L.; Pol, P.M.J. Europan cities in the knowlegde economy: Towars a typology. Urban Stud. 2007, 44, 525–549. [Google Scholar] [CrossRef]
- Mendez, R. Crisis, vulnerabilidad y nuevas desigualdades territoriales en España (Crisis, vulnerability and new territorial inequalities). Sist. Rev. Cienc. Soc. 2015, 239, 45–63. [Google Scholar]
- Ledo, A.P. Nuevas realidades territoriales para el siglo XXI. In Desarrollo Local, Identidad Territorial y Ciudad Difusa; Editorial Síntesis: Madrid, Spain, 2004. [Google Scholar]
- Hall, P. Cities of Tomorrow: An Intellectual History of Urban. Planning and Design Since 1880; John Willey Sons: London, UK, 2014. [Google Scholar]
Figure 1.
Outline of the empirical analysis carried out for the identification and characterisation of 7 groups of medium-sized cities in Spain. Source: Authors’ own.
Figure 1.
Outline of the empirical analysis carried out for the identification and characterisation of 7 groups of medium-sized cities in Spain. Source: Authors’ own.

Figure 2.
Population and housing dynamics. Source: National Statistics Institute. Authors’ own.

Figure 3.
Population-housing ratio (population-dwelling (PD) rates). Source: National Statistics Institute. Authors’ own.
Figure 3.
Population-housing ratio (population-dwelling (PD) rates). Source: National Statistics Institute. Authors’ own.

Figure 4.
Group 1 (left side) and Group 2 (right side)—means. Source: National Statistics Institute. Authors’ own.
Figure 4.
Group 1 (left side) and Group 2 (right side)—means. Source: National Statistics Institute. Authors’ own.

Figure 5.
Group 3 (left side) and Group 4 (right side)—means. Source: National Statistics Institute. Authors’ own.
Figure 5.
Group 3 (left side) and Group 4 (right side)—means. Source: National Statistics Institute. Authors’ own.

Figure 6.
Group 5 (left side) and Group 6 (right side). Source: National Statistics Institute. Authors’ own.
Figure 6.
Group 5 (left side) and Group 6 (right side). Source: National Statistics Institute. Authors’ own.

Figure 7.
Group 7. Source: National Statistics Institute. Authors’ own.

Figure 8.
Evolution of the population with data for 2008 and 2018. Source: National Statistics Institute. Authors’ own.
Figure 8.
Evolution of the population with data for 2008 and 2018. Source: National Statistics Institute. Authors’ own.

Figure 9.
Evolution of the Aging Index (2001, 2008 and 2018). Source: National Statistics Institute. Authors’ own.
Figure 9.
Evolution of the Aging Index (2001, 2008 and 2018). Source: National Statistics Institute. Authors’ own.

Figure 10.
Evolution of surface per population (SP rate). 2001, 2008 and 2018. Source: National Statistics Institute. Authors’ own.
Figure 10.
Evolution of surface per population (SP rate). 2001, 2008 and 2018. Source: National Statistics Institute. Authors’ own.

Table 1.
Numerical results of PCA. Source: Authors’ own.
| Varimax Rotation | Factor Loadings | Components | ||||
|---|---|---|---|---|---|---|
| Component | Eigenvalue | Percentage of Variance | Cumulative Percentage of Variance | 1 | 2 | |
| 1 | 3.33 | 55.5 | 55.5 | PD_rate_2001 | 0.971 | −0.016 |
| 2 | 2.02 | 33.58 | 89.08 | PD_rate_1991 | 0.951 | −0.196 |
| PD_rate_2011 | 0.907 | 0.222 | ||||
| PD_rate_1981 | 0.807 | −0.297 | ||||
| aar_P | −0.064 | 0.978 | ||||
| aar_V | −0.058 | 0.939 | ||||
Publisher’s Note: MDPI stays neutral with regard to jurisdictional claims in published maps and institutional affiliations. |
© 2021 by the authors. Licensee MDPI, Basel, Switzerland. This article is an open access article distributed under the terms and conditions of the Creative Commons Attribution (CC BY) license (http://creativecommons.org/licenses/by/4.0/).
Share and Cite
MDPI and ACS Style
Cebrián-Abellán, F.; González-González, M.-J.; Vallejo-Pascual, M.-E. Typology of Medium-Sized Cities in Spain Using PCA (Principal Component Analysis). Sustainability 2021, 13, 2456. https://doi.org/10.3390/su13052456
AMA Style
Cebrián-Abellán F, González-González M-J, Vallejo-Pascual M-E. Typology of Medium-Sized Cities in Spain Using PCA (Principal Component Analysis). Sustainability. 2021; 13(5):2456. https://doi.org/10.3390/su13052456
Chicago/Turabian StyleCebrián-Abellán, Francisco, María-Jesús González-González, and María-Eva Vallejo-Pascual. 2021. "Typology of Medium-Sized Cities in Spain Using PCA (Principal Component Analysis)" Sustainability 13, no. 5: 2456. https://doi.org/10.3390/su13052456
Note that from the first issue of 2016, this journal uses article numbers instead of page numbers. See further details here.