
Assessment of the Overall Efficiency in WPT Stations for Electric Vehicles

 ,
,  , , ,
, , ,  , , , and
Abstract
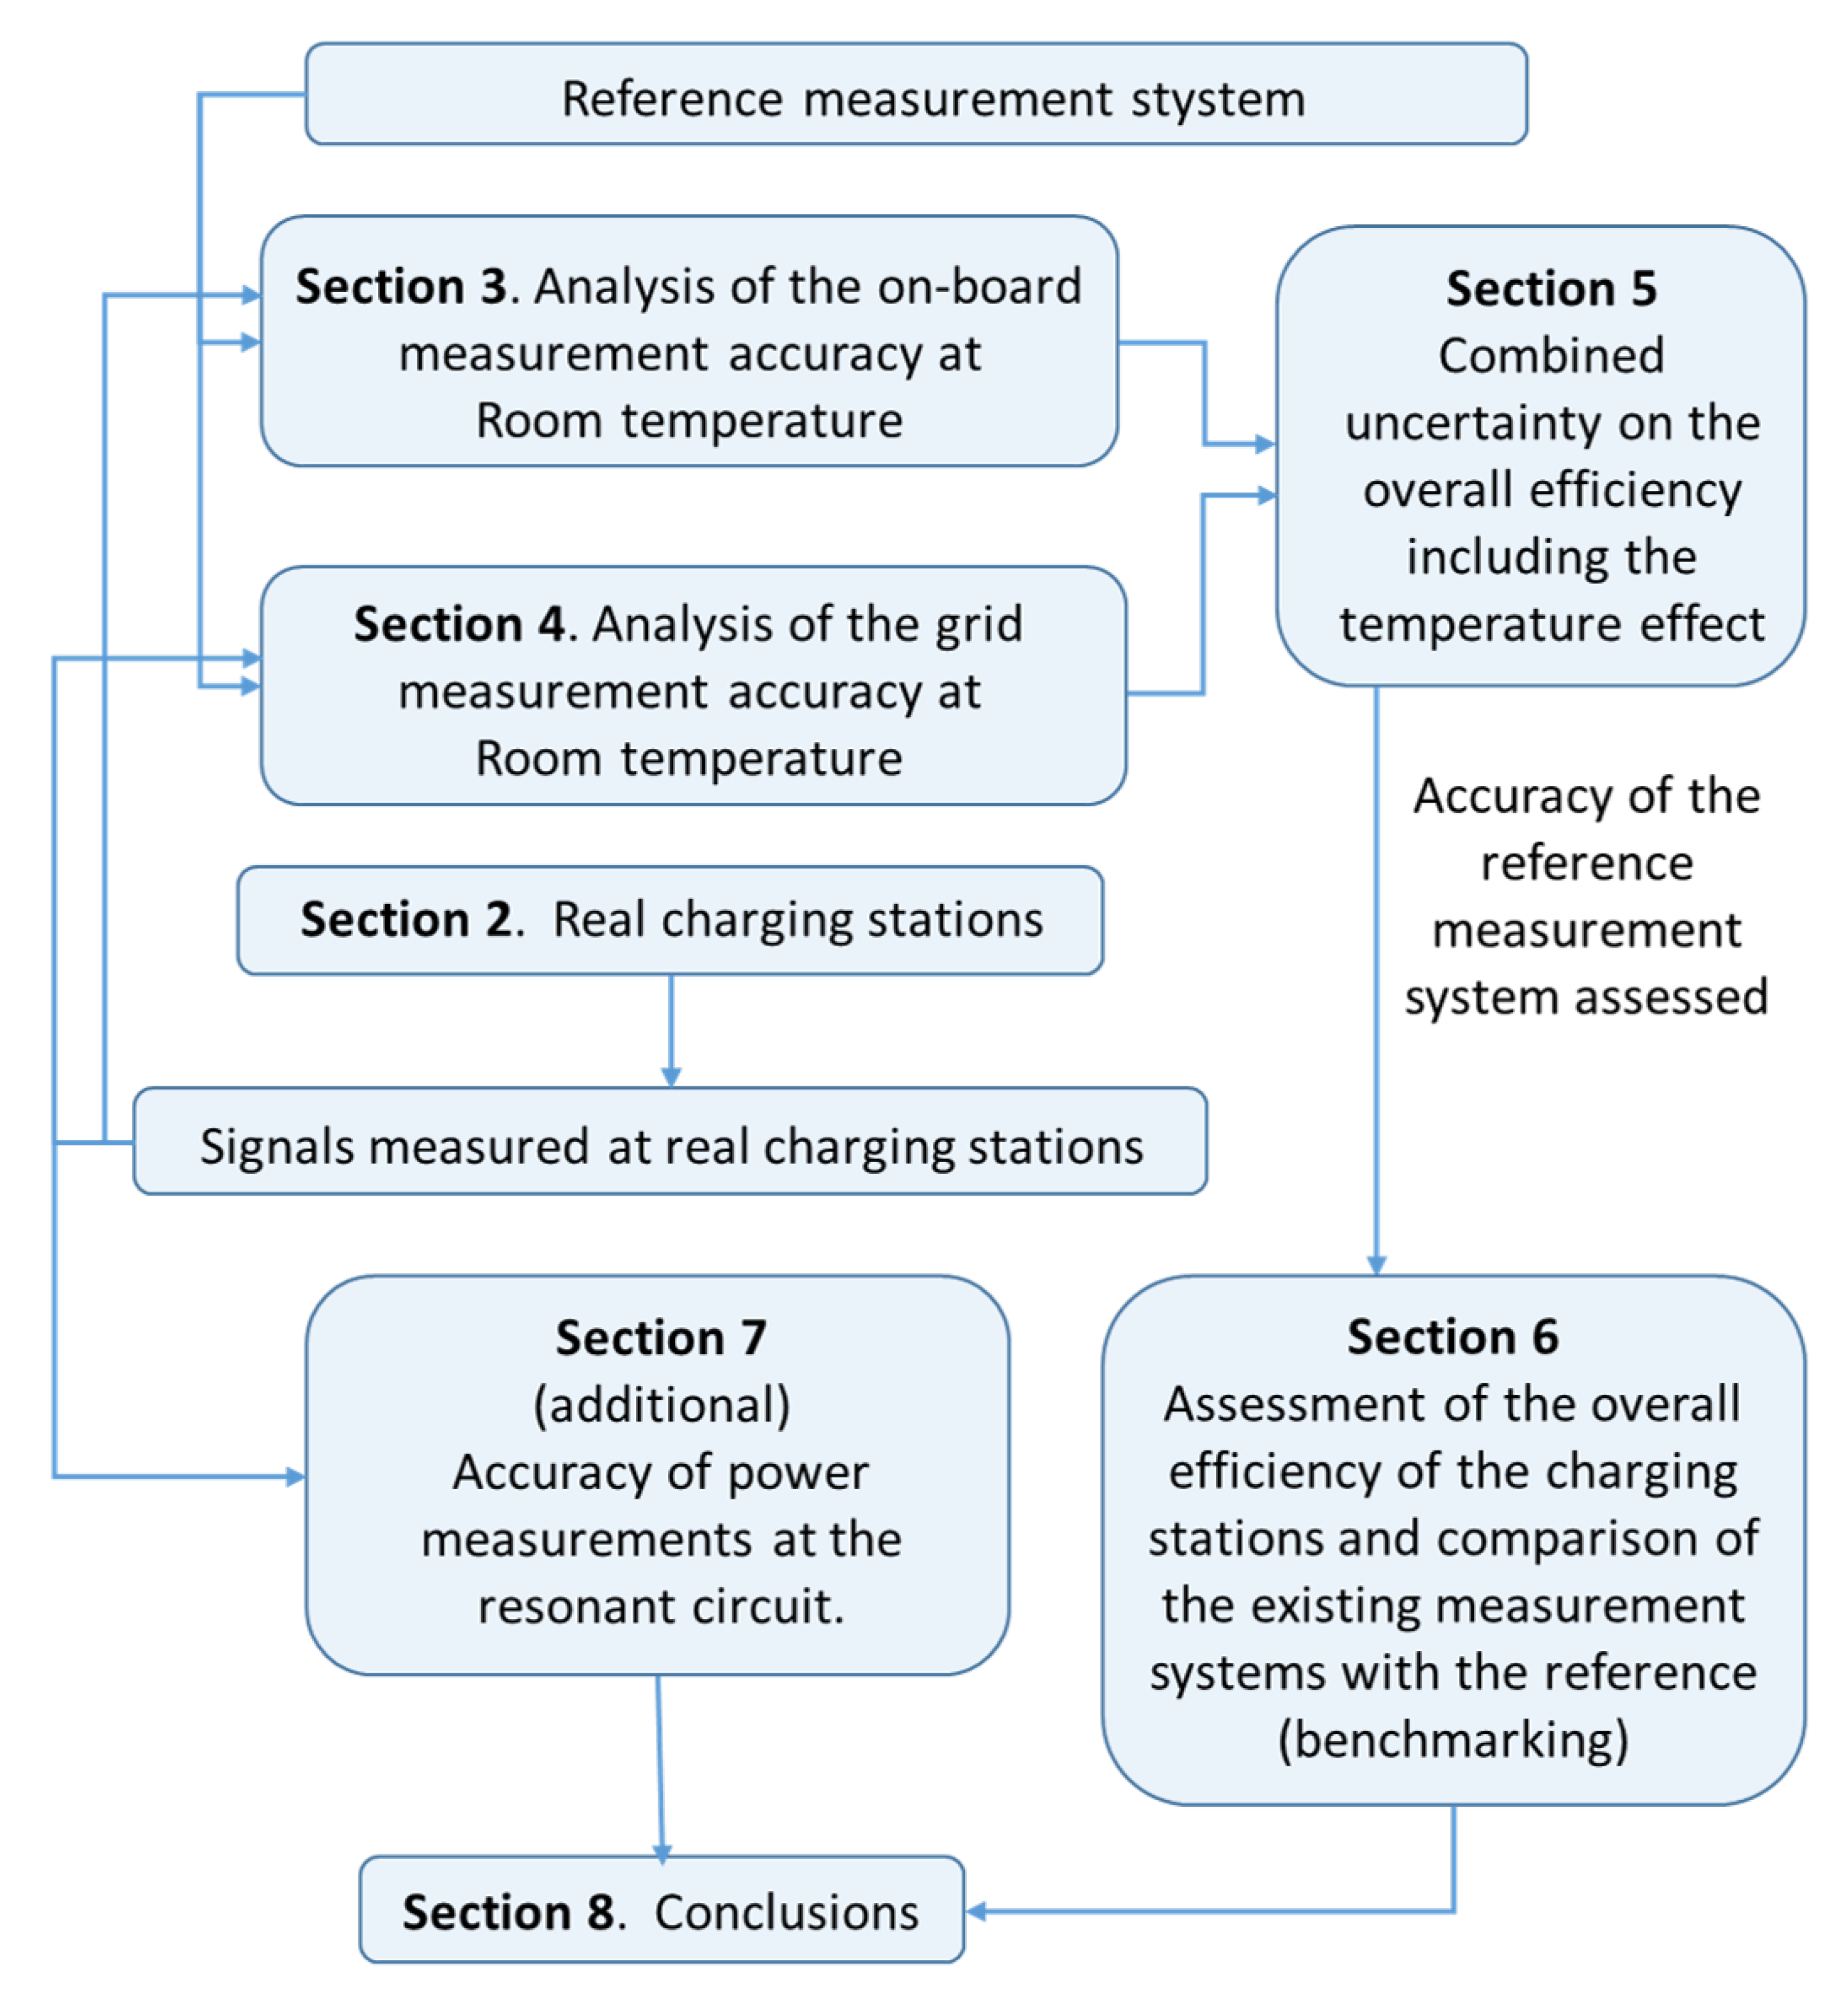
:1. Introduction
2. Test EVSE and Efficiency
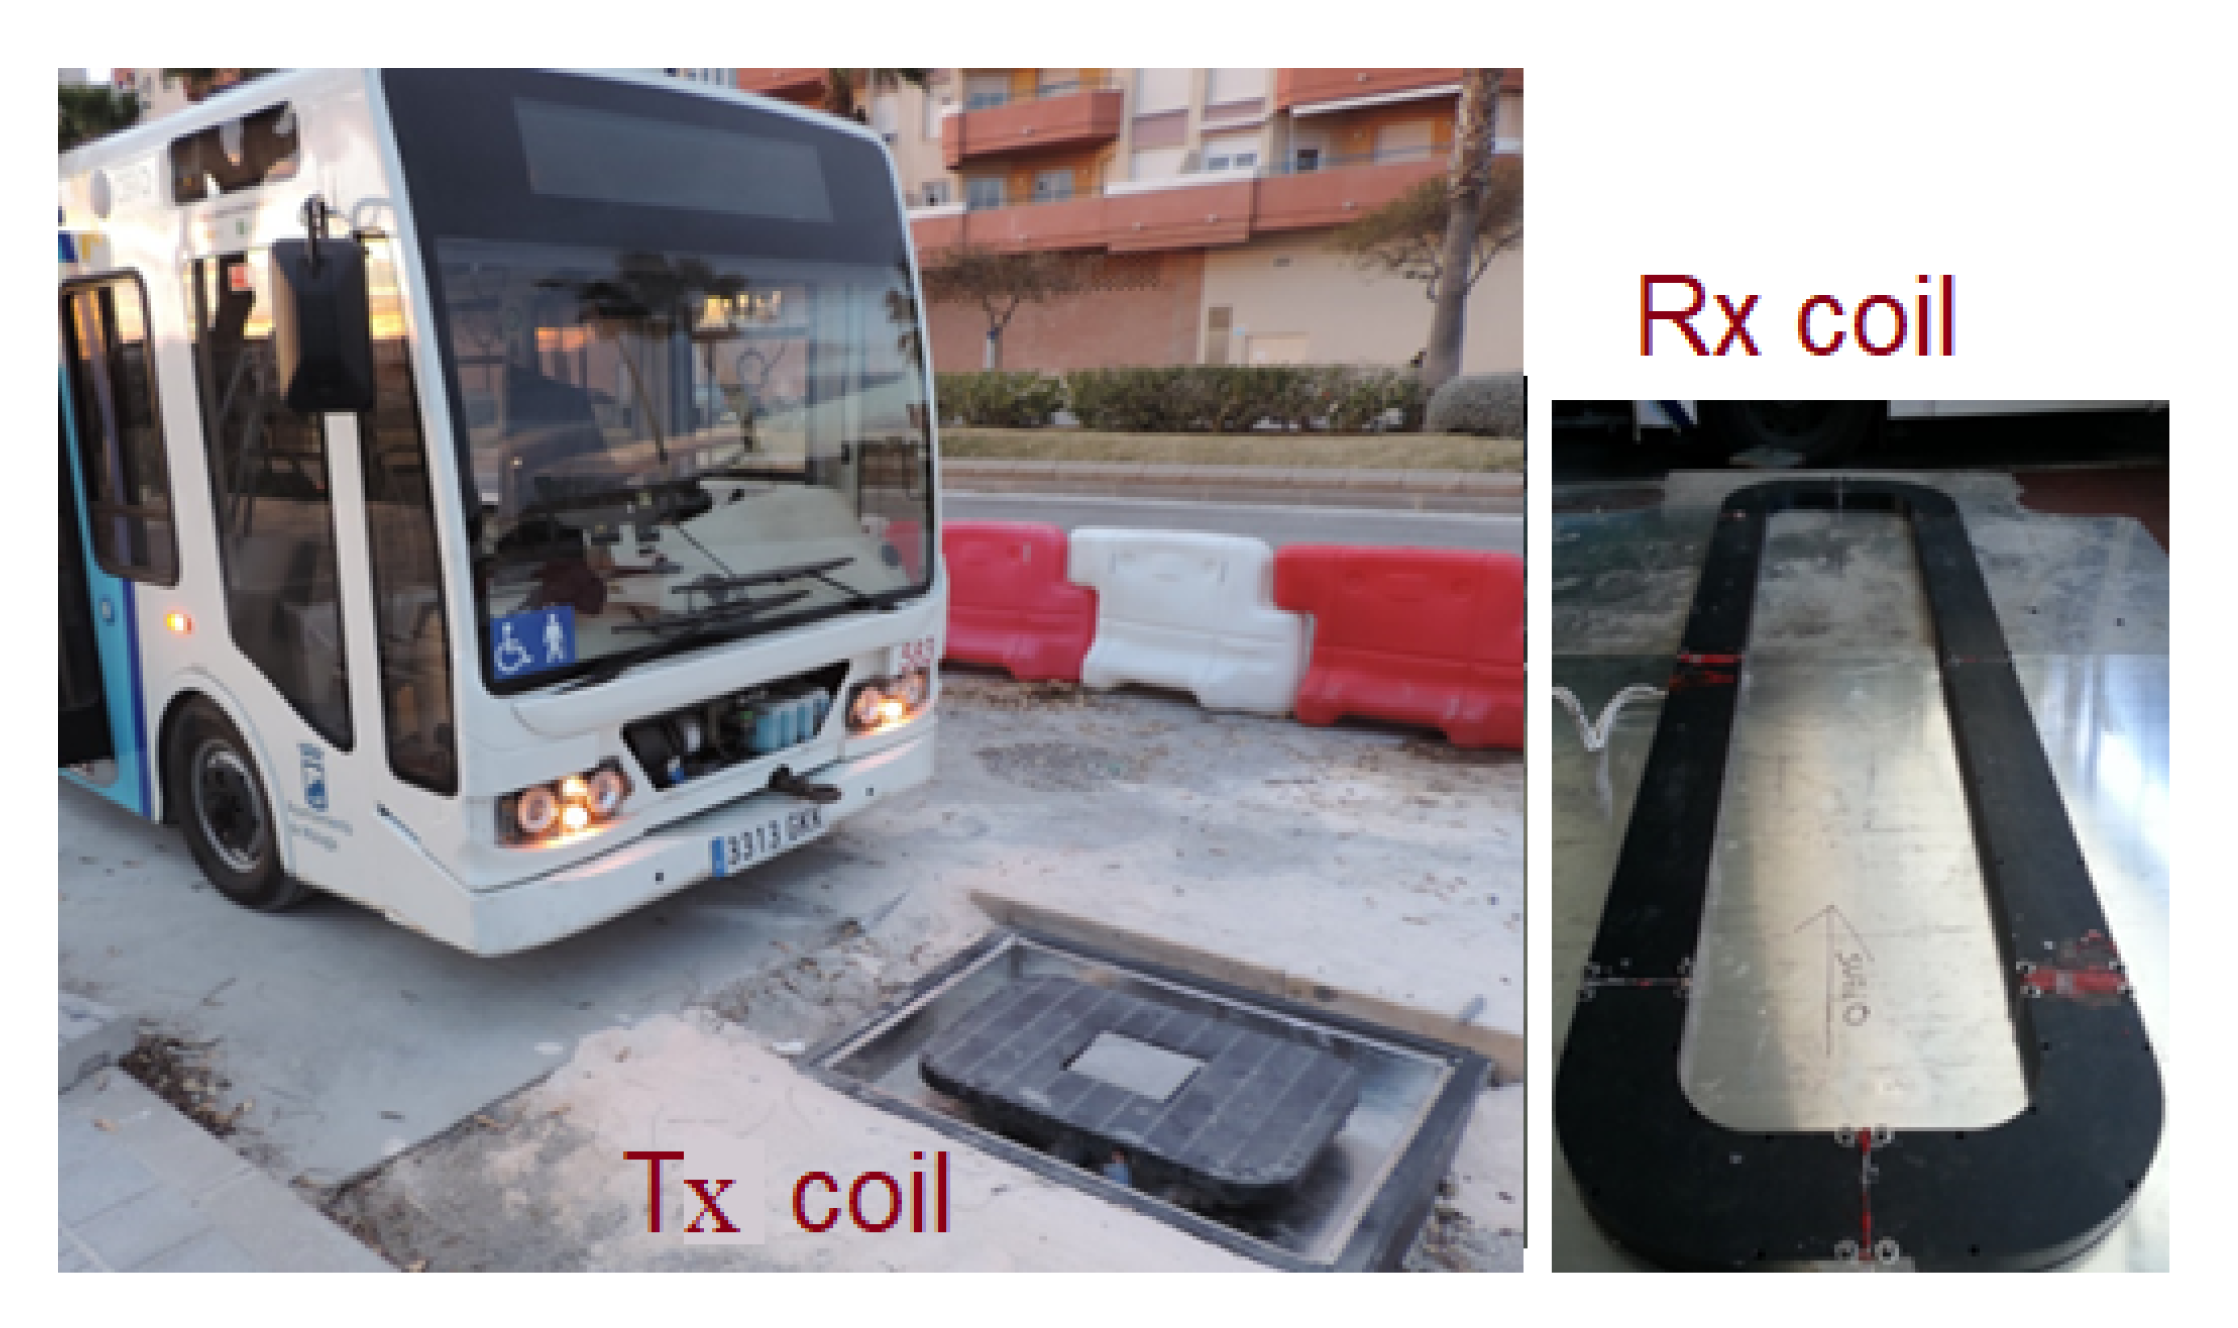
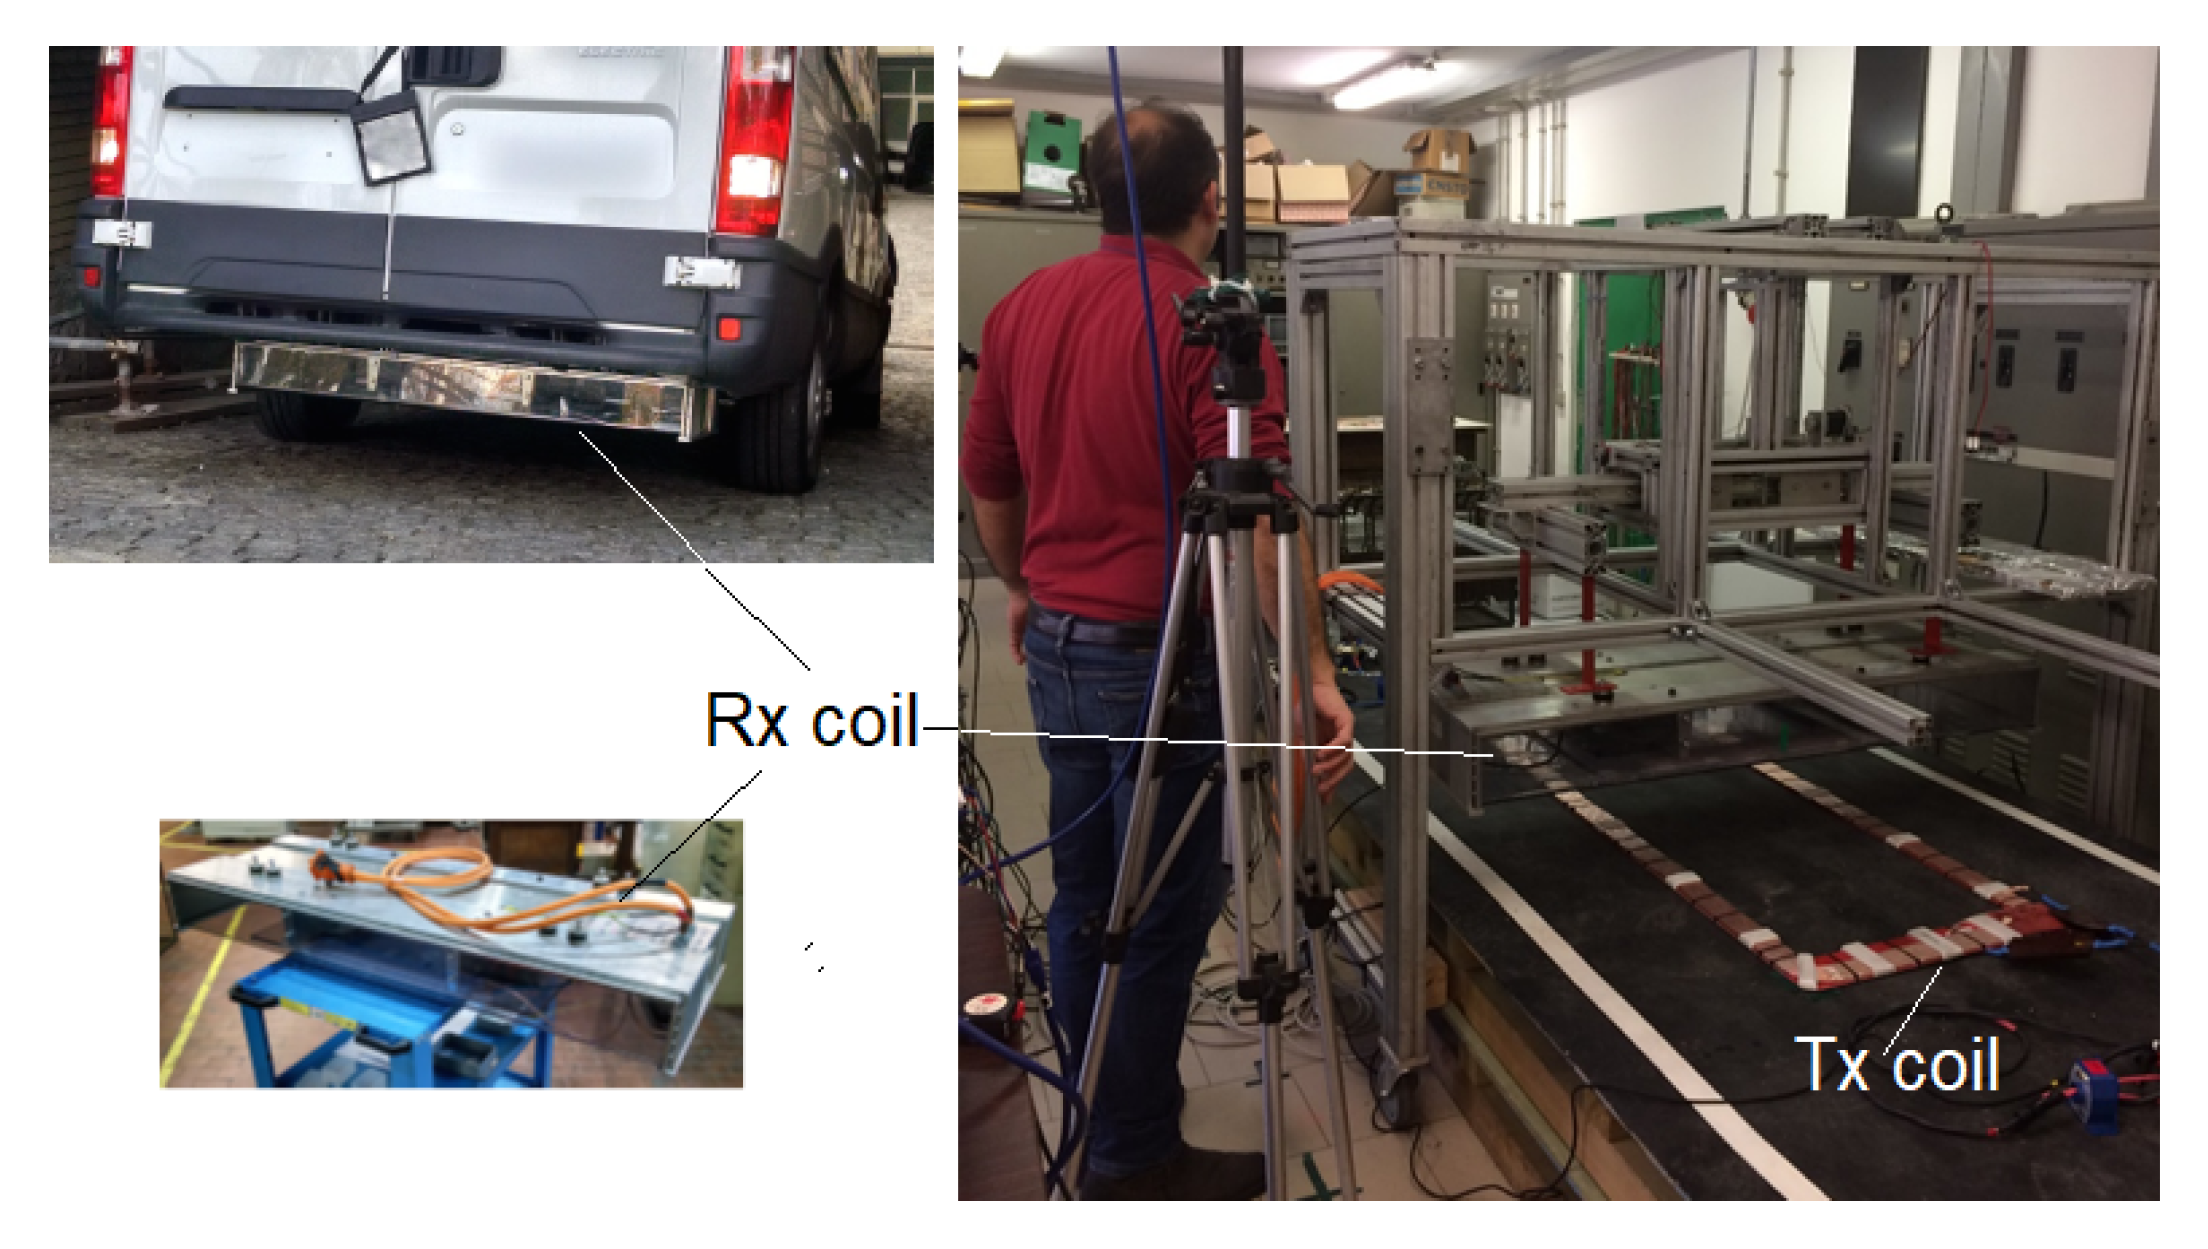
2.1. Test EVSE
2.2. Measurement Points and Efficiency
3. DC Measurements On-Board and Parameters of Uncertainty
3.1. DC Measurements
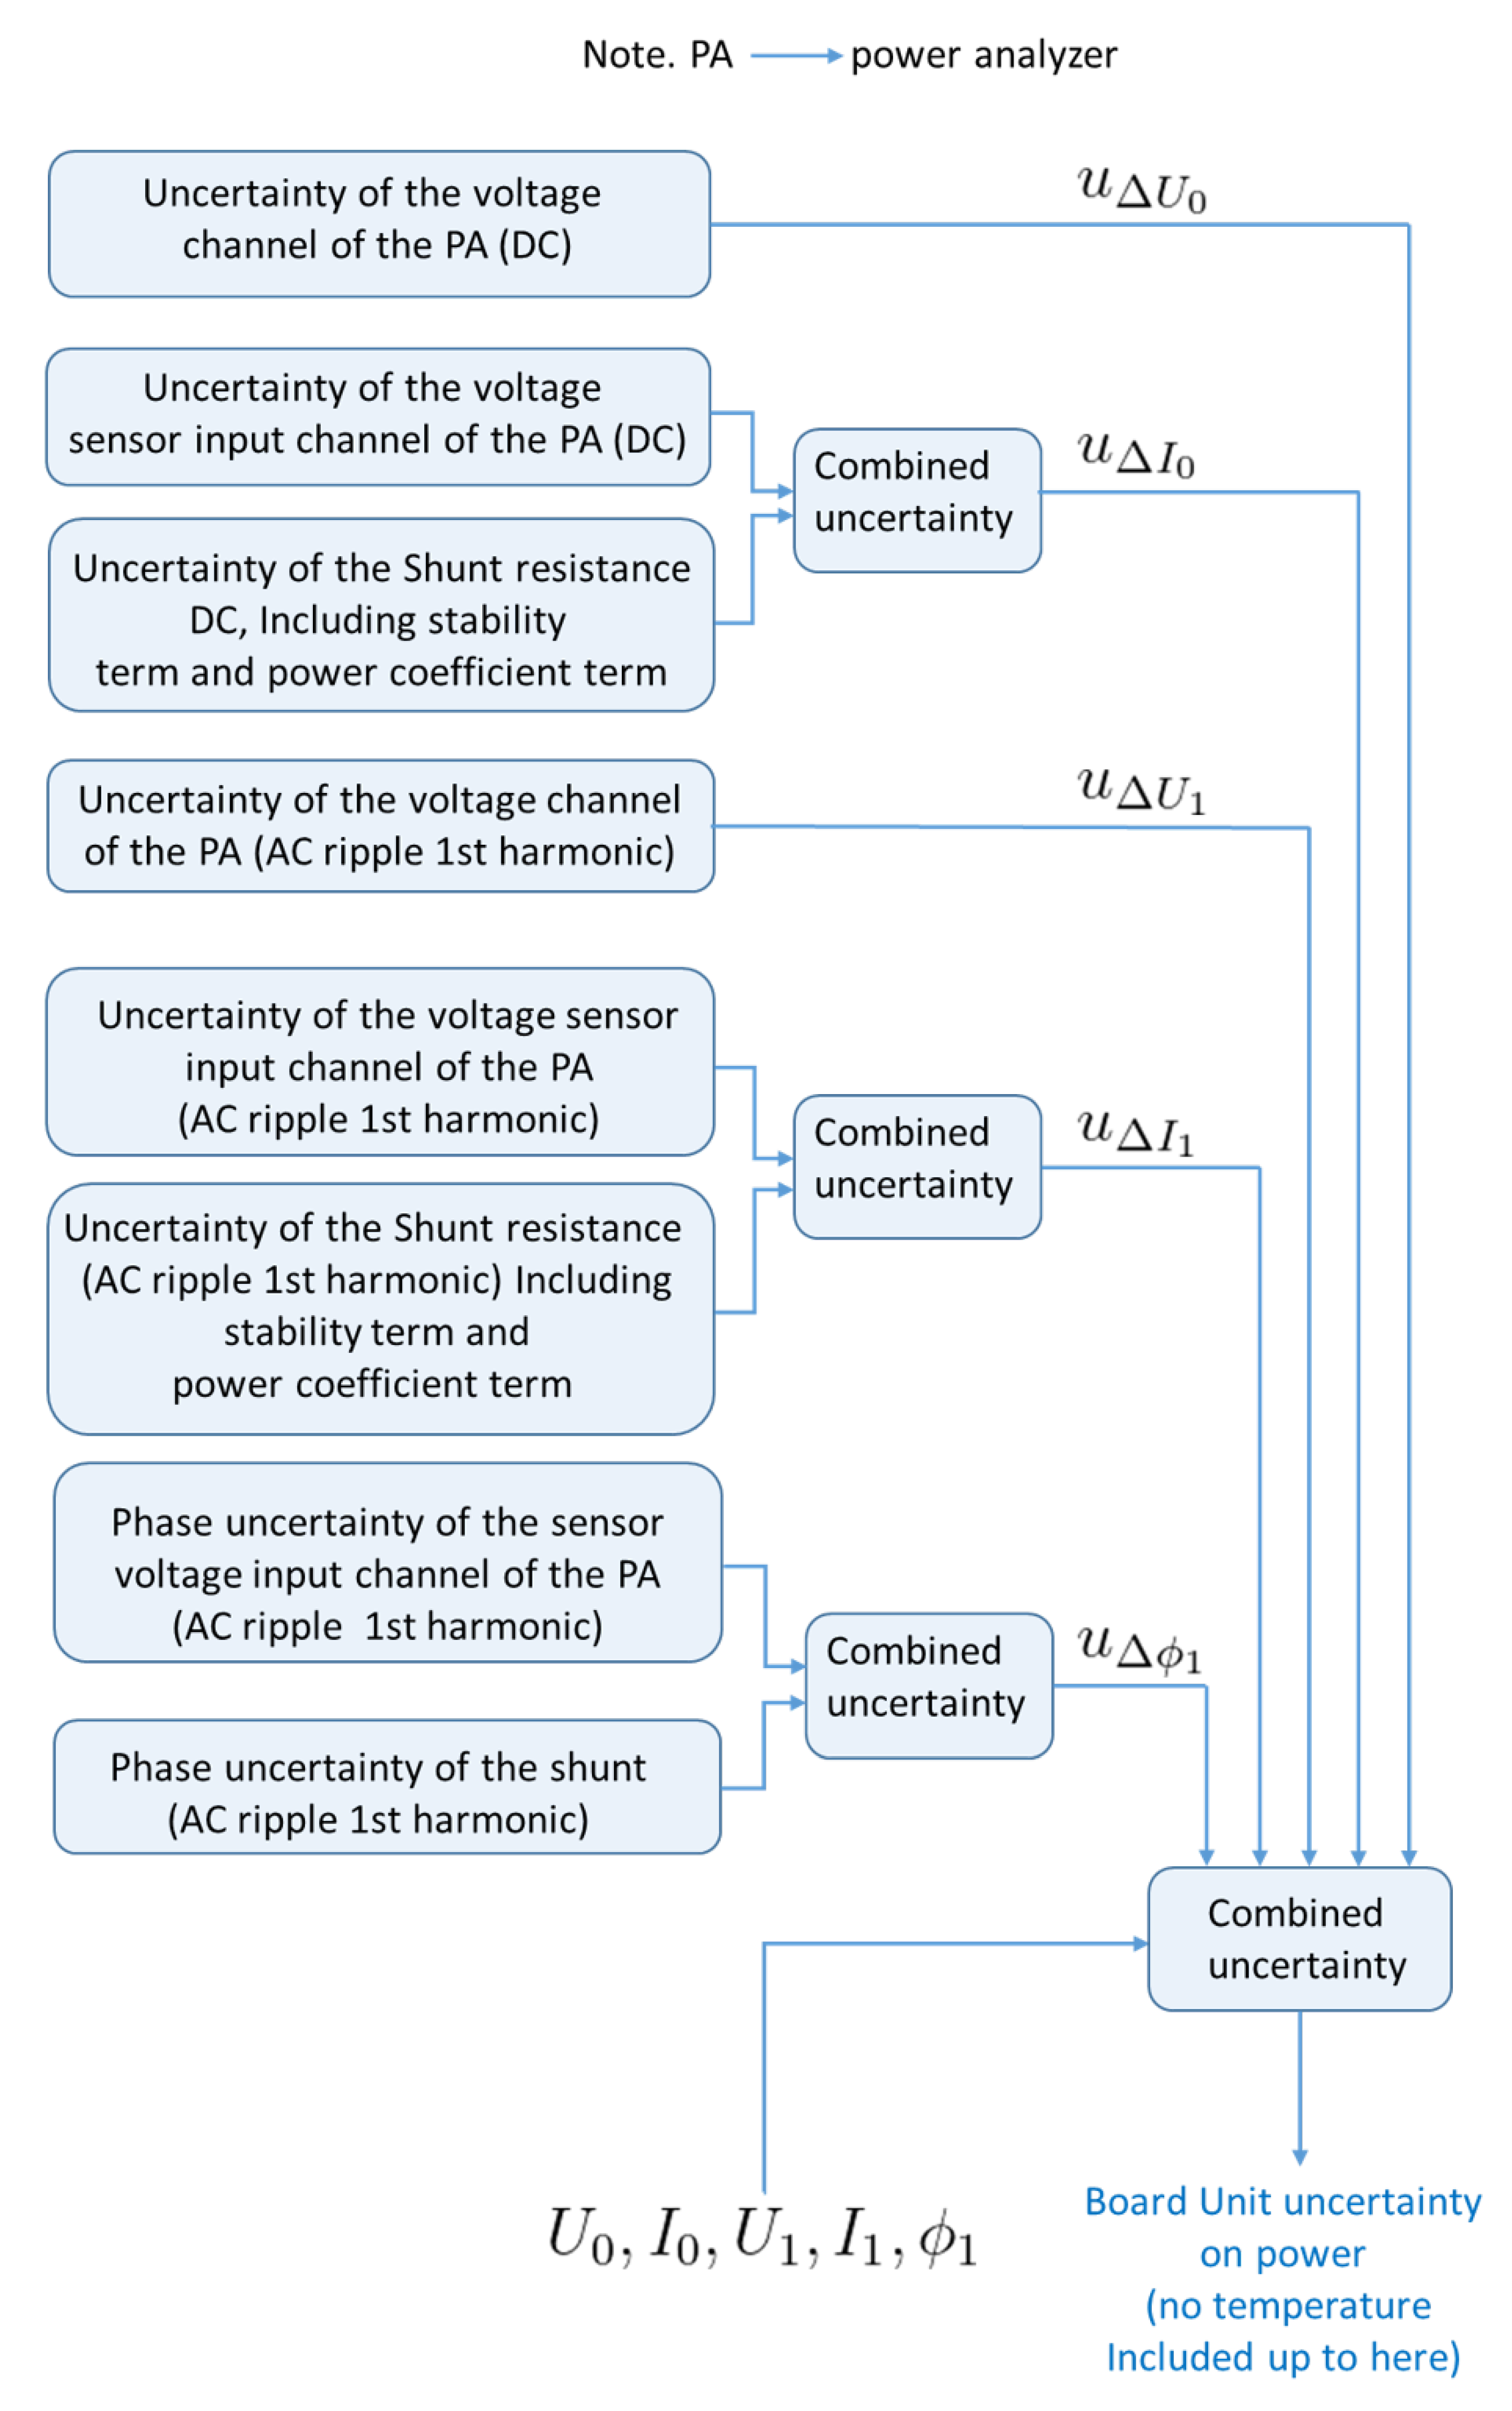
3.2. Parameters of Uncertainty
- is the relative uncertainty on the DC voltage;
- is the relative uncertainty on the measured voltage in AC at the frequency fx expressed in kHz;
- is the relative uncertainty on the measured voltage due to temperature coefficient.
- is the relative uncertainty on the voltage measured at the current sensor input in DC;
- is the relative uncertainty on the voltage measured at the current sensor input in AC at the frequency fx expressed in kHz;
- is the relative uncertainty on the voltage measured at the current sensor input due to temperature coefficient.
- is the DC relative standard uncertainty of the coaxial shunt;
- is the standard uncertainty related to the DC stability of the shunt;
- is the standard uncertainty related to the ac stability of the shunt at the fx frequency in kHz;
- is the standard uncertainty related to the power coefficient R being the shunt resistance.
4. Grid Side Measurements and Parameters of Uncertainty
5. Overall Efficiency Measurement Uncertainty and Temperature Effect
5.1. The Grid Side Temperature Effect
5.2. The On-Board Side Temperature Effect
5.3. The Overall Efficiency Uncertainty
6. Charging Stations Bench-Marking
7. Measurements at the Resonant Circuit
8. Conclusions
Author Contributions
Funding
Data Availability Statement
Acknowledgments
Conflicts of Interest
References
- Ding, X.; Wang, Z.; Zhang, L. Hybrid Control-Based Acceleration Slip Regulation for Four-Wheel-Independently-Actuated Electric Vehicles. IEEE Trans. Transp. Electrif. 2020. [Google Scholar] [CrossRef]
- Wang, C.; Wang, Z.; Zhang, L.; Cao, D.; Dorrell, D.G. A Vehicle Rollover Evaluation System Based on Enabling State and Parameter Estimation. IEEE Trans. Ind. Inform. 2020. [Google Scholar] [CrossRef]
- Ding, X.; Wang, Z.; Zhang, L.; Wang, C. Longitudinal Vehicle Speed Estimation for Four-Wheel-Independently-Actuated Electric Vehicles Based on Multi-Sensor Fusion. IEEE Trans. Veh. Technol. 2020, 69, 12797–12806. [Google Scholar] [CrossRef]
- Ghosh, A. Possibilities and Challenges for the Inclusion of the Electric Vehicle (EV) to Reduce the Carbon Footprint in the Transport Sector: A Review. Energies 2020, 13, 602. [Google Scholar] [CrossRef]
- Sayed, K.; Kassem, A.; Saleeb, H.; Alghamdi, A.S.; Abo-Khalil, A.G. Energy-Saving of Battery Electric Vehicle Powertrain and Efficiency Improvement during Different Standard Driving Cycles. Sustainability 2020, 12, 10466. [Google Scholar] [CrossRef]
- Kishan, D.; Nayak, P.S.R. Wireless power transfer technologies for electric vehicle battery charging—A state of the art. In Proceedings of the 2016 International Conference on Signal Processing, Communication, Power and Embedded System (SCOPES), Odisha, India, 3–4 October 2016; pp. 2069–2073. [Google Scholar]
- Cirimele, V.; Diana, M.; Freschi, F.; Mitolo, M. Inductive Power Transfer for Automotive Applications: State-of-the-Art and Future Trends. IEEE Trans. Ind. Appl. 2018, 54, 4069–4079. [Google Scholar] [CrossRef]
- Amin, A.; Tareen, W.U.K.; Usman, M.; Memon, K.A.; Horan, B.; Mahmood, A.; Mekhilef, S. An Integrated Approach to Optimal Charging Scheduling of Electric Vehicles Integrated with Improved Medium-Voltage Network Reconfiguration for Power Loss Minimization. Sustainability 2020, 12, 9211. [Google Scholar] [CrossRef]
- Ferwerda, R.; Bayings, M.; van der Kam, M.; Bekkers, R. Advancing E-Roaming in Europe: Towards a Single Language for the European Charging Infrastructure. World Electr. Veh. J. 2018, 9, 50. [Google Scholar] [CrossRef] [Green Version]
- Ma, C.T. System planning of grid-connected electric vehicle charging stations and key technologies: A review. Energies 2019, 12, 4201. [Google Scholar] [CrossRef] [Green Version]
- Knez, M.; Zevnik, G.K.; Obrecht, M. A review of available chargers for electric vehicles: United States of America, European Union, and Asia. Renew. Sustain. Energy Rev. 2019, 109, 284–293. [Google Scholar] [CrossRef]
- Kim, J.D. Insights into residential EV charging behavior using energy meter data. Energy Policy 2019, 129, 610–618. [Google Scholar] [CrossRef]
- Stoychev, I.; Tebbe, J.; Oehm, J. A measurement system for electric car charging stations utilising a FPGA board for flexibility in configuration. In Proceedings of the IEEE International Symposium on Circuits and Systems (ISCAS), Montréal, QC, Canada, 22–25 May 2016; pp. 630–633. [Google Scholar]
- Rajendran, G.; Vaithilingam, C.A.; Naidu, K. Energy-efficient converters for electric vehicle charging stations. SN Appl. Sci. 2020, 2, 1–15. [Google Scholar] [CrossRef] [Green Version]
- Lodetti, S.; Bruna, J.; Sanz, J.F.; Melero, J.J. Characterization of the Emission of an Electric Bus Inductive Charging in the 2 kHz to 150 kHz Range. In Proceedings of the AEIT International Conference of Electrical and Electronic Technologies for Automotive (AEIT AUTOMOTIVE), Turin, Italy, 2–4 July 2019; pp. 1–6. [Google Scholar]
- Chu, S.Y.; Avestruz, A.-T. Transfer-power measurement: A non-contact method for fair and accurate metering of wireless power transfer in electric vehicles. In Proceedings of the IEEE 18th Workshop on Control and Modeling for Power Electronics, Stanford, CA, USA, 9–12 July 2017; pp. 1–8. [Google Scholar]
- Zucca, M.; Squillari, P.; Pogliano, U. A measurement system for the characterization of wireless charging stations for electric vehicles. In Proceedings of the 2020 Conference on Precision Electromagnetic Measurements (CPEM), Denver, CO, USA, 24–28 August 2020; pp. 1–2. [Google Scholar] [CrossRef]
- Zucca, M.; Squillari, P.; Pogliano, U. A measurement system for the characterization of wireless charging stations for electric vehicles. IEEE Trans. Instrum. Meas. 2021, 70, 1–10. [Google Scholar] [CrossRef]
- Lucas, A.; Trentadue, G.; Scholz, H.; Otura, M. Power quality performance of fast-charging under extreme temperature conditions. Energies 2018, 11, 2635. [Google Scholar] [CrossRef] [Green Version]
- Zucca, M. Metrology for Inductive Charging of Electric Vehicles (MICEV). In Proceedings of the AEIT International Conference of Electrical and Electronic Technologies for Automotive (AEIT AUTOMOTIVE), Turin, Italy, 2–4 July 2019; pp. 1–4. [Google Scholar]
- Zucca, M. Electrical measurements at inductive charging stations for electric vehicles. An outcome from Micev project. In Proceedings of the Conference on Precision Electromagnetic Measurements (CPEM 2020), Denver, CO, USA, 24–28 August 2020; pp. 1–2. [Google Scholar]
- Ahmad, A.; Alam, M.S.; Chabaan, R. A Comprehensive Review of Wireless Charging Technologies for Electric Vehicles. IEEE Trans. Transp. Electrif. 2018, 4, 38–63. [Google Scholar] [CrossRef]
- VICTORIA Project. Available online: https://www.fcirce.es/en/smart-mobility-en-en/victoria-2 (accessed on 23 February 2021).
- Cirimele, V. The Fabric ICT Platform for Managing Wireless Dynamic Charging Road Lanes. IEEE Trans. Veh. Technol. 2020, 69, 2501–2512. [Google Scholar] [CrossRef]
- Bucci, G.; Ciancetta, F.; Fiorucci, E.; Ometto, A. Uncertainty Issues in Direct and Indirect Efficiency Determination for Three-Phase Induction Motors: Remarks About the IEC 60034-2-1 Standard. IEEE Trans. Instrum. Meas. 2016, 65, 2701–2716. [Google Scholar] [CrossRef]
- Möller, F.; Müller, S.; Meyer, J. Impact of Electric Vehicles on Power Quality in Central Charging Infrastructures. In Proceedings of the 1st E-Mobility Power System Integration Symposium, Berlin, Germany, 24–27 October 2017. [Google Scholar]
- Liorni, I. Assessment of Exposure to Electric Vehicle Inductive Power Transfer Systems: Experimental Measurements and Numerical Dosimetry. Sustainability 2020, 12, 4573. [Google Scholar] [CrossRef]


| n | |||||||||||||||
|---|---|---|---|---|---|---|---|---|---|---|---|---|---|---|---|
| LVCS | #1 | 27.40 | 97.53 | 1.28 | 0.81 | 2672.50 | 0.9989 | 5.138 | 4.910 | 4.931 | 381.52 | 383.40 | 384.85 | 3003.5 | 0.9064 |
| LVCS | #2 | 8.65 | 349.76 | 0.70 | 0.81 | 3027.14 | 0.9967 | 5.143 | 4.915 | 4.953 | 382.22 | 384.81 | 385.47 | 3015.9 | 0.9060 |
| HVCS | #1 | 65.8 | 156.8 | 0.80 | 1.78 | 10,321.1 | 0.9999 | 20.44 | 20.05 | 19.81 | 234.04 | 235.44 | 233.21 | 14,111.9 | 0.9990 |
| HVCS | #2 | 76.2 | 182.4 | 6.94 | 1.96 | 13,891.8 | 0.9959 | 26.66 | 25.50 | 25.35 | 232.79 | 233.87 | 232.76 | 17,814.45 | 0.9987 |
| Location at Point E | LVCS | HVCS |
|---|---|---|
| Power at the load | 3 kW | 21 kW |
| DC currents at the load r.m.s. | 30 A | 93.8 A |
| DC voltages at load r.m.s. | 100 V | 225 V |
| Source | Voltage Input Uncertainty Value | Probability Distribution | Coverage Factor | Voltage Input Standard Uncertainty | Voltage Input Standard Uncertainty Value |
|---|---|---|---|---|---|
| Uncertainty DC/ppm | 100 | Normal | 2 | 50 | |
| Uncertainty AC /ppm | 200 | Normal | 2 | 100 | |
| Uncertainty AC /ppm | 370 | Normal | 2 | 185 | |
| Uncertainty AC /ppm | 450 | Normal | 2 | 225 | |
| Temperature coefficient /ppm/°C | 100 | Normal | 2 | 50 |
| Uncertainty Source | Shunt Expanded Uncertainty | Probability Distribution | Standard Uncertainty Parameter | Standard Uncertainty Value |
|---|---|---|---|---|
| DC/ppm | 17 | Normal | 8.5 | |
| AC 40 kHz/ppm | 47 | Normal | 23.5 | |
| AC 85 kHz/ppm | 80 | Normal | 40 | |
| AC 150 kHz/ppm | 130 | Normal | 65 | |
| Temp. coeff. /ppm/C | 4.5 | Normal | 2.25 | |
| Power coeff. /ppm/W | 6 | Normal | 3 | |
| Long term stability @DC/ppm | Normal | 8 | ||
| Long term stability @40 kHz/ppm | Normal | 70 | ||
| Long term stability @85 kHz/ppm | Normal | 140 | ||
| Long term stability @150 kHz/ppm | Normal | 185 | ||
| Phase shift (rad) @40 kHz | Rectangular | |||
| Phase shift (rad) @85 kHz | Rectangular | |||
| Phase shift (rad) @150 kHz | Rectangular |
| Parameter | Value | Sensitivity Coefficient | Sensitivity Coefficient Value | Contribution (W) |
|---|---|---|---|---|
| 0.26723 | ||||
| 0.27012 | ||||
| V | ||||
| A | ||||
| 0.04862 |
| Station | Load Condition | Expanded Uncertainty/ppm |
|---|---|---|
| LVCS | #1 | 300 |
| LVCS | #2 | 300 |
| HVCS | #1 | 300 |
| HVCS | #2 | 320 |
| Location at Point A | LVCS | HVCS |
|---|---|---|
| Power absorbed from the grid | ||
| Phase currents r.m.s. | ||
| Phase voltages r.m.s. |
| Uncertainty Factor | Uncertainty Source | Expanded Uncertainty /ppm | Coverage Factor | Current Input Standard Uncertainty | Standard Uncertainty /ppm |
|---|---|---|---|---|---|
| Power analyzer accuracy | Calibration certificate | 50 | 2 | 25 | |
| Uncertainty variation vs temperature | WT3000 and LEM specifications | 202/C | 116.6/C | ||
| Uncertainty due to harmonic content | Computed |
| T/°C | T/°C | On-Board SU | Grid SU | Efficiency SU | Expanded Uncertainty |
|---|---|---|---|---|---|
| 5 | 41 | 1235 | 1994 | 2087 | 4.17 |
| 6 | 40 | 1154 | 1879 | 1963 | 3.93 |
| 10 | 36 | 831 | 1417 | 1462 | 2.92 |
| 11 | 35 | 750 | 1302 | 1337 | 2.67 |
| 14 | 32 | 513 | 959 | 968 | 1.94 |
| 15 | 31 | 435 | 846 | 847 | 1.69 |
| 16 | 30 | 360 | 735 | 728 | 1.46 |
| 17 | 29 | 287 | 625 | 612 | 1.22 |
| 18 | 28 | 222 | 518 | 502 | 1.00 |
| 20 | 26 | 150 | 324 | 318 | 0.64 |
| 21 | 25 | 150 | 253 | 262 | 0.52 |
| 23 | 24 | 150 | 225 | 241 | 0.48 |
| n | LVCS | Standard | Relative Difference | Relative Difference | Relative Difference |
|---|---|---|---|---|---|
| 1 | 73.736 | 73.506 | 0.43 | 0.15 | 0.31 |
| 2 | 73.817 | 73.531 | 0.34 | 0.04 | 0.39 |
| 3 | 73.587 | 73.413 | 0.29 | 0.06 | 0.24 |
| 4 | 89.232 | 88.978 | 0.01 | 0.27 | 0.29 |
| 5 | 89.378 | 89.117 | 0.19 | 0.46 | 0.29 |
| 6 | 89.414 | 89.131 | 0.12 | 0.42 | 0.32 |
| n | LVCS | Standard | Relative Difference | Relative Difference | Relative Difference |
|---|---|---|---|---|---|
| 1 | 66.098 | 65.857 | −0.39 | 0.06 | 0.37 |
| 2 | 66.052 | 65.788 | −0.25 | 0.12 | 0.40 |
| 3 | 66.548 | 66.284 | −0.35 | 0.04 | 0.40 |
| 4 | 85.825 | 85.648 | −0.01 | 0.19 | 0.21 |
| 5 | 85.785 | 85.572 | −0.13 | 0.11 | 0.25 |
| 6 | 85.777 | 85.523 | −0.10 | 0.18 | 0.30 |
| n | LVCS | Standard | Relative Difference | Relative Difference | Relative Difference |
|---|---|---|---|---|---|
| 1 | 71.955 | 73.507 | 2.51 | 0.41 | 2.11 |
| 2 | 71.387 | 73.137 | 2.70 | 0.31 | 2.39 |
| 3 | 71.585 | 73.465 | 2.78 | 0.19 | 2.56 |
| 4 | 73.451 | 77.298 | 5.15 | 0.18 | 4.98 |
| 5 | 73.118 | 76.898 | 5.12 | 0.21 | 4.92 |
| 6 | 73.030 | 76.850 | 5.12 | 0.16 | 4.97 |
Publisher’s Note: MDPI stays neutral with regard to jurisdictional claims in published maps and institutional affiliations. |
© 2021 by the authors. Licensee MDPI, Basel, Switzerland. This article is an open access article distributed under the terms and conditions of the Creative Commons Attribution (CC BY) license (http://creativecommons.org/licenses/by/4.0/).
Share and Cite
Zucca, M.; Cirimele, V.; Bruna, J.; Signorino, D.; Laporta, E.; Colussi, J.; Tejedor, M.A.A.; Fissore, F.; Pogliano, U. Assessment of the Overall Efficiency in WPT Stations for Electric Vehicles. Sustainability 2021, 13, 2436. https://doi.org/10.3390/su13052436
Zucca M, Cirimele V, Bruna J, Signorino D, Laporta E, Colussi J, Tejedor MAA, Fissore F, Pogliano U. Assessment of the Overall Efficiency in WPT Stations for Electric Vehicles. Sustainability. 2021; 13(5):2436. https://doi.org/10.3390/su13052436
Chicago/Turabian StyleZucca, Mauro, Vincenzo Cirimele, Jorge Bruna, Davide Signorino, Erika Laporta, Jacopo Colussi, Miguel Angel Alonso Tejedor, Federico Fissore, and Umberto Pogliano. 2021. "Assessment of the Overall Efficiency in WPT Stations for Electric Vehicles" Sustainability 13, no. 5: 2436. https://doi.org/10.3390/su13052436