Article

Economic, Social, and Ecological Impact Evaluation of Traffic Network in Beijing–Tianjin–Hebei Urban Agglomeration Based on the Entropy Weight TOPSIS Method

1
School of Geography and Information Engineering, China University of Geosciences, Wuhan 430078, China
2
Key Laboratory of the Ministry of Natural Resources for Research on Rule of Law, Wuhan 430074, China
3
China Transport Telecommunications and Information Center, Beijing 100011, China
4
School of Geophysics and Spatial Information, China University of Geosciences, Wuhan 430074, China
*
Author to whom correspondence should be addressed.
Sustainability 2021, 13(4), 1862; https://doi.org/10.3390/su13041862
Submission received: 25 December 2020 / Revised: 29 January 2021 / Accepted: 1 February 2021 / Published: 9 February 2021

Abstract

:
In recent years, with the rapid development of urban transportation network in China, many problems have been exposed, especially in the Beijing–Tianjin–Hebei (BTH) region. Under the call of sustainable development, it is of great significance to evaluate the economic, social, and ecological (ESE) impact of transportation network in BTH urban agglomeration for promoting the sustainable development of transportation ESE in BTH urban agglomeration. In this paper, 12 indicators in the field of transportation are selected to build the evaluation index system of ESE effects of transportation network in BTH urban agglomeration. By using entropy weight TOPSIS (Technique for Order Preference by Similarity to Ideal Solution) model and the Jenks natural breaks classification method, the ESE impacts of transportation network in 13 cities of BTH from 2013 to 2017 are analyzed from the temporal and spatial dimensions. The research shows that: (1) From 2013 to 2017, the economic impact degree of traffic network shows an annual fluctuation trend, the social impact degree increases year by year, and the ecological impact degree decreases year by year; (2) For the cities of BTH, the ESE impact assessment results of transportation network from 2013 to 2017 can be divided into seven clusters. Except Handan City, the ESE impact assessment categories of other cities’ transportation network have been improved, but the proportion of cities in the transition period is still large, especially the “Low-Low-Low” cities. The types of cities in the transitional period need to be focused. It is still a heavy burden to realize the ESE coordination and sustainable development of BTH urban agglomeration transportation network.

1. Introduction

As the basic regional unit for the country to participate in global competition and international division of labor, the development of urban agglomerations is inseparable from the support of transportation network, which establishes the spatial-temporal relationship between cities in urban agglomerations and promotes the flow of information and material [1]. As the largest urban group in northern China, with the rapid development of transportation infrastructure, the impact of the transportation network on the economy and society of BTH and the ecological and environmental problems is increasingly apparent. Against the background of sustainable development of urban agglomeration, it is of great significance to evaluate the ESE impact of the transportation network of BTH urban agglomeration and understand the differences in the development of different urban transportation networks, to promote the sustainable development of the transportation ESE of BTH urban agglomeration and realize the transportation integration of BTH urban agglomeration as soon as possible.
The relationship between transportation and urban development has always been the focus of academic circles. In recent years, the research on the relationship between transportation and urban development mainly focuses on the impact of transportation infrastructure on urban development and the evaluation of urban transportation sustainable development. The impact of transportation infrastructure on urban development mainly involves its ESE impact [2]. In the aspect of economic impact, it focuses on the spatial spillover effect of urban development on economic growth and the coupling coordination between urban development and economic development [3,4,5,6]; In terms of social impact, it focuses on the analysis of regional industrial structure, urbanization level, population structure and employment [7]; In the aspect of ecological impact, scholars pay attention to the research of air pollution, noise pollution and biodiversity [8,9,10]. The sustainability of urban transportation network needs to be sustainable in many aspects such as economy, society, and ecology. The research on the sustainability of urban transportation network includes the research on the evaluation index system of sustainable development and the research on the evaluation methods. Considering the different statistical standards of different countries and the conflicting natures of indicators, developing an overall evaluation index system of traffic sustainable development as a difficult but required task [11]. A handful of researchers have put forward a variety of indicators, but generally from the ESE indicators for specific areas [12,13,14], such as economic indicators include transportation added value, transportation freight intensity, transportation costs, etc.; social indicators include urban traffic accident rate, transportation employees, etc.; ecological indicators include mean value of transportation trunk noise, traffic pollution gas emissions [1], road greening rate, etc. There are many methods to evaluate the sustainability of urban transportation network [11,15,16,17,18], including the system dynamics model (describing the relationships among the elements of the system by examining time-varying flows and feedback mechanisms), data analysis method, fuzzy comprehensive evaluation method and multi-criteria decision analysis (MCDA) methods, etc. MCDA methods are probably the most common approaches used for sustainability evaluation in the transportation field [19]. The attributes are summarized by TOPSIS (Technique for Order Preference by Similarity to Ideal Solution), VIKOR (Vise Kriterijumska Optimizacija Kompromisno Resenje), COPRAS (Complex Proportional Assessment) and PROMETHEE (Preference Ranking Organization Method for Enrichment Evaluation) methods, and the most appropriate method is selected according to the data and ranking type [15,20,21,22,23]. Table 1 provides the main information of these methods [21]. In these methods, TOPSIS and VIKOR methods, based on the distance from the ideal solution, have become very popular in the MCDA field. TOPSIS takes into consideration both the positive (i.e., best) and the negative (i.e., worst) solutions, and easy to compute and implement procedure. Its basic principle has to do with the fact that the chosen alternative should have the shortest distance from the positive ideal solution and the farthest from the negative ideal solution, compared to the others [13]. The weakness of the TOPSIS is that being not able to deal with decisionmakers’ ambiguities and uncertainties in determining weights of criterion and sub criterion, this weakness is overcome by estimation of criterion weights using an entropy approach (Entropy weight method) [15,24]. In recent years, this method has been applied to the study of sustainability evaluation. For example, to evaluate urban sustainable development in China [13]; to evaluate sustainable road rating systems in Hungary [20]; to evaluate sustainable forest and air quality management in Europe [18]. The VIKOR method, similarly to the TOPSIS method, is based on distance measurements. In this approach a compromise solution is sought [23]. However, it focuses on ranking and selecting from a set of alternatives in the presence of conflicting criteria. VIKOR also requires the determination of criterion weight coefficient and criterion value, which is difficult to achieve in actual decision making. In Table A1, which shows that we can obtained very similar rankings using TOPSIS and VIKOR. In the aspect of sustainable development evaluation of urban transportation network, because the influence of traffic network on urban agglomeration involves many factors, the best form of sustainable development of transportation network is the level of ESE development and traffic resource allocation of urban agglomeration, which is close to the optimal state and far away from the worst state. TOPSIS is more suitable for the systematic analysis of the gap between the economic, social, and ecological environmental status and the ideal state caused by the traffic network, and truly reflects the impact of the traffic network on the urban agglomeration.
In addition, due to the differences in the measurement units, internal attributes and orders of magnitude of each index, it cannot be used directly. Therefore, in order to unify the standard and eliminate the dimensional impact, data normalization is the key link in the sustainable development evaluation. The most common normalization methods in MCDA methods include the minimum-maximum method, the vector method, the sum method, the maximum method, and the minimum method [25,26,27]. However, in much of the literature, there is no clear assignment to which decisionmakers’ methods of data normalization are used. This situation poses a problem, as it is necessary to consider the influence of particular normalizations on the result [28].
However, because the influence of traffic network on urban agglomeration involves many factors, the best form of sustainable development of transportation network is the level of ESE development and traffic resource allocation of urban agglomeration, which is close to the optimal state and far away from the worst state. TOPSIS (Technique for Order Preference by Similarity to Ideal Solution) is a comprehensive analysis method, which makes a ranking through a positive ideal solution and a negative ideal solution [15,20]. It is suitable for the systematic analysis of the gap between the economic, social, and ecological environmental status and the ideal state caused by the traffic network, and truly reflects the impact of the traffic network on the urban agglomeration. The entropy weight method is an objective weighting method, which can avoid the influence of subjective factors on index weight [13].
In this paper, we take the transportation network of BTH urban agglomeration as the research object, 12 indicators in the field of transportation are selected from the three levels of economy, society, and ecology. Then, implements the ESE impact assessment of the transportation network of the urban agglomeration based on the Entropy weight TOPSIS model, and uses the Jenks natural breaks classification method to divide the city categories, then we can understand the ESE sustainable development status of different urban transportation networks in BTH from 2013 to 2017, to serve the transportation integration and coordinated development of BTH urban agglomeration.
The rest of this paper is organized as follows. Section 2 introduces the study area, data sources and methodology. Section 3 analyzes the results and provides a discussion. Section 4 presents the conclusions and suggestions.

2. Study Area, Data Sources and Methodology

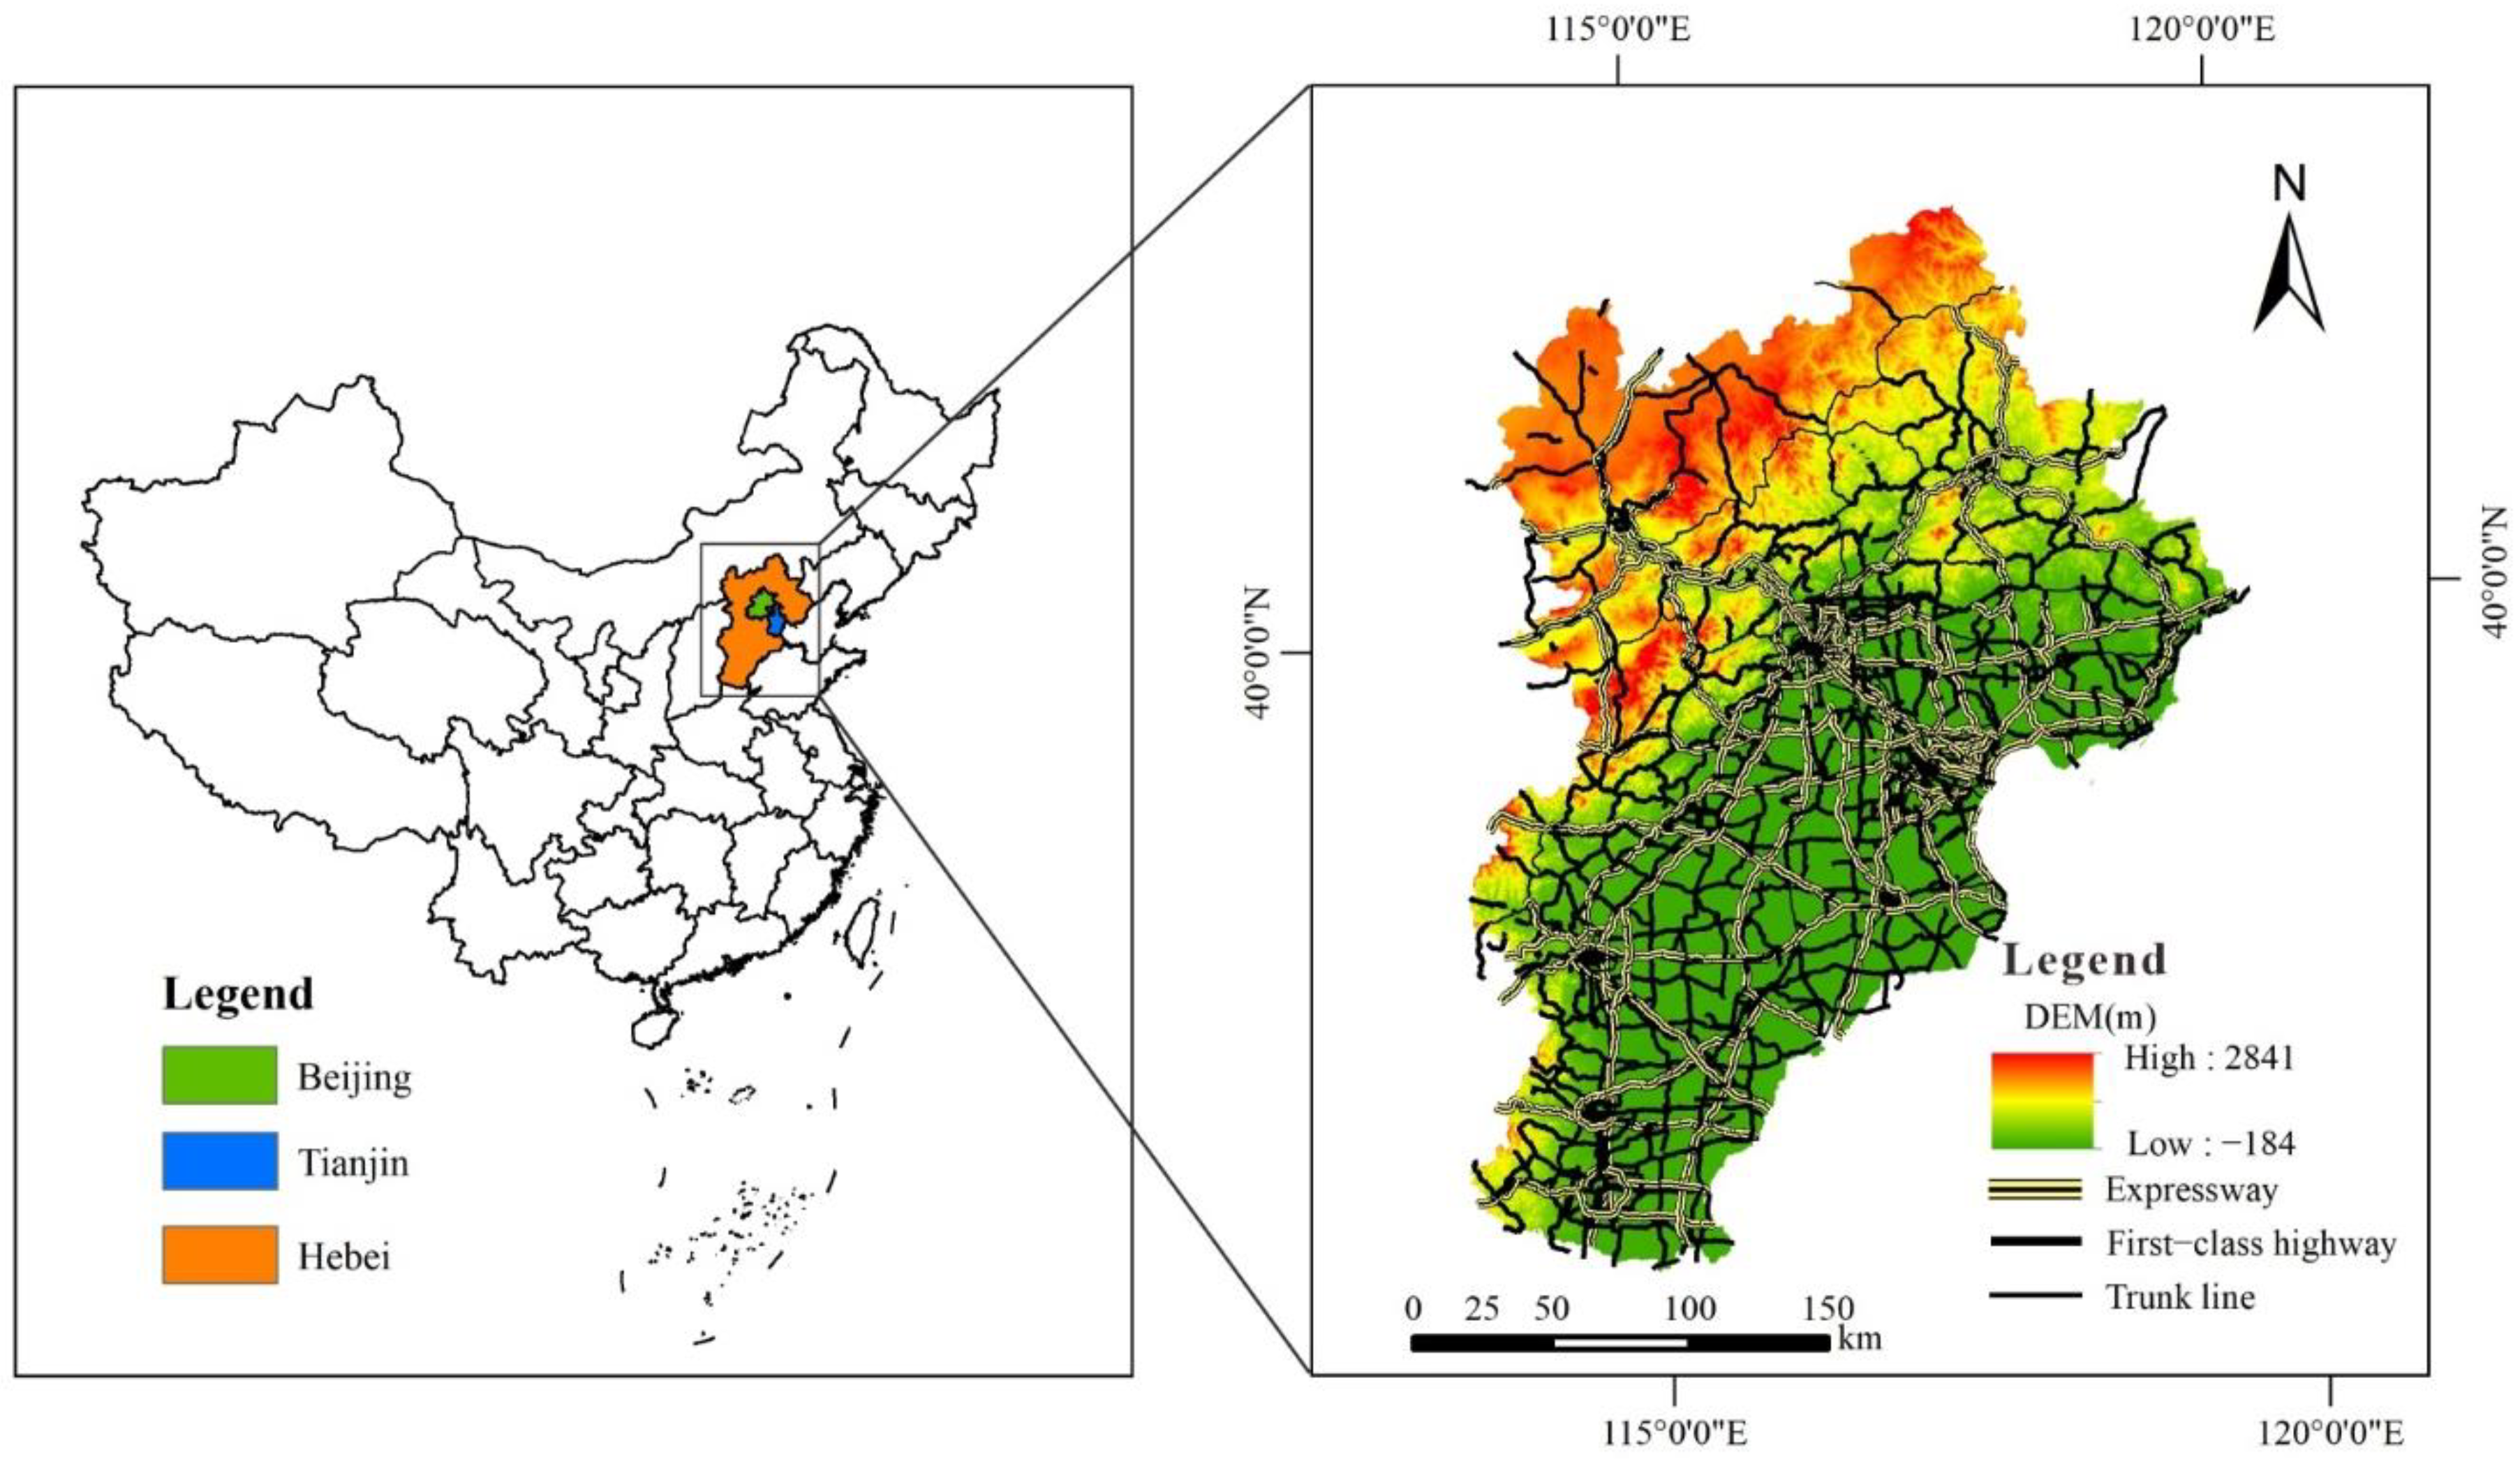
2.1. Study Area and Data Sources

The BTH region (36°01′–42°37′ N, 113°04′–119°53′ E) is located in the center of Bohai economic circle, which is an important node area connecting northwest, northeast and North China. The region includes Beijing and Tianjin, as well as Shijiazhuang, Tangshan, Qinhuangdao, Chengde, Langfang, Handan, Xingtai, Cangzhou, Baoding, Zhangjiakou, Hengshui and other cities in Hebei Province, with a total area of 215,400 km2. The terrain is high in the northwest and low in the southeast. According to the traffic network spatial distribution data of BTH urban agglomeration in 2017, the road network in the core area of Beijing and Tianjin is dense, while the road network in the northern and southeastern edge areas of Hebei Province is sparse (Figure 1). The urban transportation network construction level had significant regional difference.
The data used in this study are from Beijing Municipal Bureau of statistics [29], Beijing Municipal Bureau of ecological environment [30], Tianjin Bureau of Statistics [31], Tianjin Ecological Environment Bureau [32], Hebei Provincial Bureau of Statistics [33] and Department of ecological environment of Hebei Province [34] Including Beijing Statistical Yearbooks (2014–2018), Beijing Environmental Status Bulletin (2013–2017); Tianjin Statistical Yearbooks (2014–2018), Tianjin Environmental Status Bulletin (2013–2017); Statistical Yearbooks of Hebei Province (2014–2018), Environmental Status Bulletin of Hebei Province (2013–2017). In this study, the weight of each indicator was calculated by programming in python language. All spatial analysis and mapping were made by the software of ArcGIS 10.2.

2.2. Methodology Specification

2.2.1. Construction of the Indicator System

Urban traffic indicators are variables which used to reflect the development and influence of urban traffic network. Therefore, indicators selection is the first step in traffic network impact assessment. This study refers to the relevant indicators in the field of transportation in the past, the indicators are screened from three aspects of transportation network ESE. However, the indicators in the past research literature are not fully applicable, and the selection of indicators also needs some criteria (Table 2). Screening by selection criteria, 12 indicators of transportation network ESE of BTH urban agglomeration are determined (Table 3).
The economic indicators are marked as EC, including fixed assets investment in transport, storage, and post (EC1); gross output value of transport, storage, and post industry (EC2); passenger traffic (EC3) and freight traffic (EC4). These indicators can well reflect the economic development level of urban transportation network. EC1 represents the asset investment of the transportation industry, which is mainly used for the development of regional transportation infrastructure. EC2 represents the GDP of the transportation industry and reflects the contribution capacity of regional transportation economy. EC3 and EC4 reflect the regional transport capacity of passenger and freight.
Social indicators marked as SC, including population density (SC1); employment in transportation industry (SC2); per capita length of roads (SC3); urbanization rate (SC4). These indicators can well reflect the social development of transportation network. SC1 reflects the size of the city. SC2 reflects the contribution of transportation industry to urban employment. SC3 reflects the construction of urban transportation infrastructure. Traffic construction affects population flow. SC4 is the ratio of urban population to the total population. The higher the ratio is, the higher the urbanization level is. Traffic construction affects population movement, it indirectly reflects the development of urban traffic.
The ecological indicators are marked as EL. They include mean value of transportation trunk noise (EL1), average concentration of PM10 in traffic environment (EL2), average concentration of SO2 (EL3) and average concentration of NO2 (EL4). The damage of traffic infrastructure to urban ecological environment is mainly reflected in noise pollution and air pollution. EL1 reflects the noise pollution along the traffic network. EL2, EL3 and EL4 are the main traffic air pollutants.

2.2.2. Entropy Weight TOPSIS Method

Entropy weight method is an objective weighting method, which can clearly reveal the utility of each index and avoid the interference of subjective factors. Nowadays, this method is widely used in the research of index system evaluation [13]. TOPSIS model is a comprehensive evaluation method based on distance, which was first proposed by Hwang and Yoon in 1981. The model can objectively and comprehensively reflect the degree of ESE impact of transportation network by calculating the closeness degree between evaluation value and ideal solution, and is widely used in MCDA [15,20]. Therefore, this paper calculates the index weight and evaluates the ESE effects of transportation network based on the entropy weight TOPSIS method, as follows:
Step 1. Traffic indicators contain different types of information so there might be some inconsistency in units among indicators. Therefore, after the completion of the original data collection, the data normalization process is necessary. In Table A2 and Table A3, this paper uses Spearman rank correlation coefficient to compare results from different normalization of entropy weight TOPSIS [28]. Finally, the minimum–maximum method is selected as the data normalization method. In this paper, all indicators are normalized to [0,1] based on minimum-maximum method [13].
r i j = ( x i j min i ) / ( max i min i ) ,
where r i j is the standardized value of each index, r i j [ 0 , 1 ] ; x i j is the evaluation index of each city in different years; min i is the minimum value of the index; and max i is the maximum value of the index.
Step 2. To calculate the value of entropy:
p i j = r i j / i = 1 N r i j ( i = 1 , 2 , N ; j = 1 , 2 , T ) ,
e i = j = 1 T p i j × ln p i j / ln T ( i = 1 , 2 , N ; j = 1 , 2 , T ) ,
where e i is the entropy value; p i j is the proportion of the index value of item i of j city in different years; T is the total number of evaluation objects; N is the total number of evaluation indexes.
Step 3. To calculate the index weight w i :
w i = ( 1 e i ) / i = 1 N ( 1 e i ) ( i = 1 , 2 , N ) ,
Step 4. To establish a standardized decision matrix V:
V = ( v i j ) N × T , v i j = w i r i j ( i = 1 , 2 , N ; j = 1 , 2 , T ) ,
Step 5. To determine the positive and negative ideal solutions:
V i + = max j ( v i j , j = 1 , 2 , , T ) ,
V i = min j ( v i j , j = 1 , 2 , , T ) ,
Step 6. To calculate the distance between the positive and negative ideal solutions for each city in different years:
D j + = i = 1 N ( v i j V i + ) 2 ,
D j = i = 1 N ( v i j V i ) 2 ,
where D j + and D j are the distances of the positive and negative ideal solutions, respectively.
Step 7. To calculate the score of comprehensive evaluation:
C j = D j / ( D j + + D j ) ,
where C j is the closeness of the evaluated target object and the optimal solution.

2.2.3. The Jenks Natural Breaks Classification Method

The Jenks natural breaks classification method, also called the Jenks optimization, is one of the standard classification methods of a calculation. It can identify the classification interval, and can group the most appropriate similar values, and maximize the difference between each class. The grouping method divides the data into several classes, and for these classes, the boundary is set at the position where the data values are relatively different [44,45]. In this paper, the method is used to determine the ESE evaluation threshold of transportation network, and to divide the high and low score categories. The principle is as follows.
Step 1. The sum of squared deviations (SDAM) is calculated for the array of a certain class in the classification result:
S D A M = ( X i X ¯ ) 2 ,
where X ¯ represents the mean array.
Step 2. For the combination of each range in the classification results, the sum of squares of total class deviations (SDCM) is calculated, select the smallest SDCM.
S D C M = ( X i Z ¯ c ) 2 ,
Step 3. Calculate the gradient of each classification GVF (goodness of variance fit) to test of the combination value of termination on Natural Break:
G V F = S D A M S D C M / S D A M ,
Range of values between 0 (worst fit) to 1 (perfect fit). GFV value close to 1 then the better the classification.

3. Results and Discussion

In this paper, the entropy weight TOPSIS method is used to calculate the ESE impact value of the traffic network of the BTH urban agglomeration from 2013 to 2017. The impact of the traffic network on the ESE of the BTH urban agglomeration is evaluated from the overall situation and regional differences. The analysis is as follows.

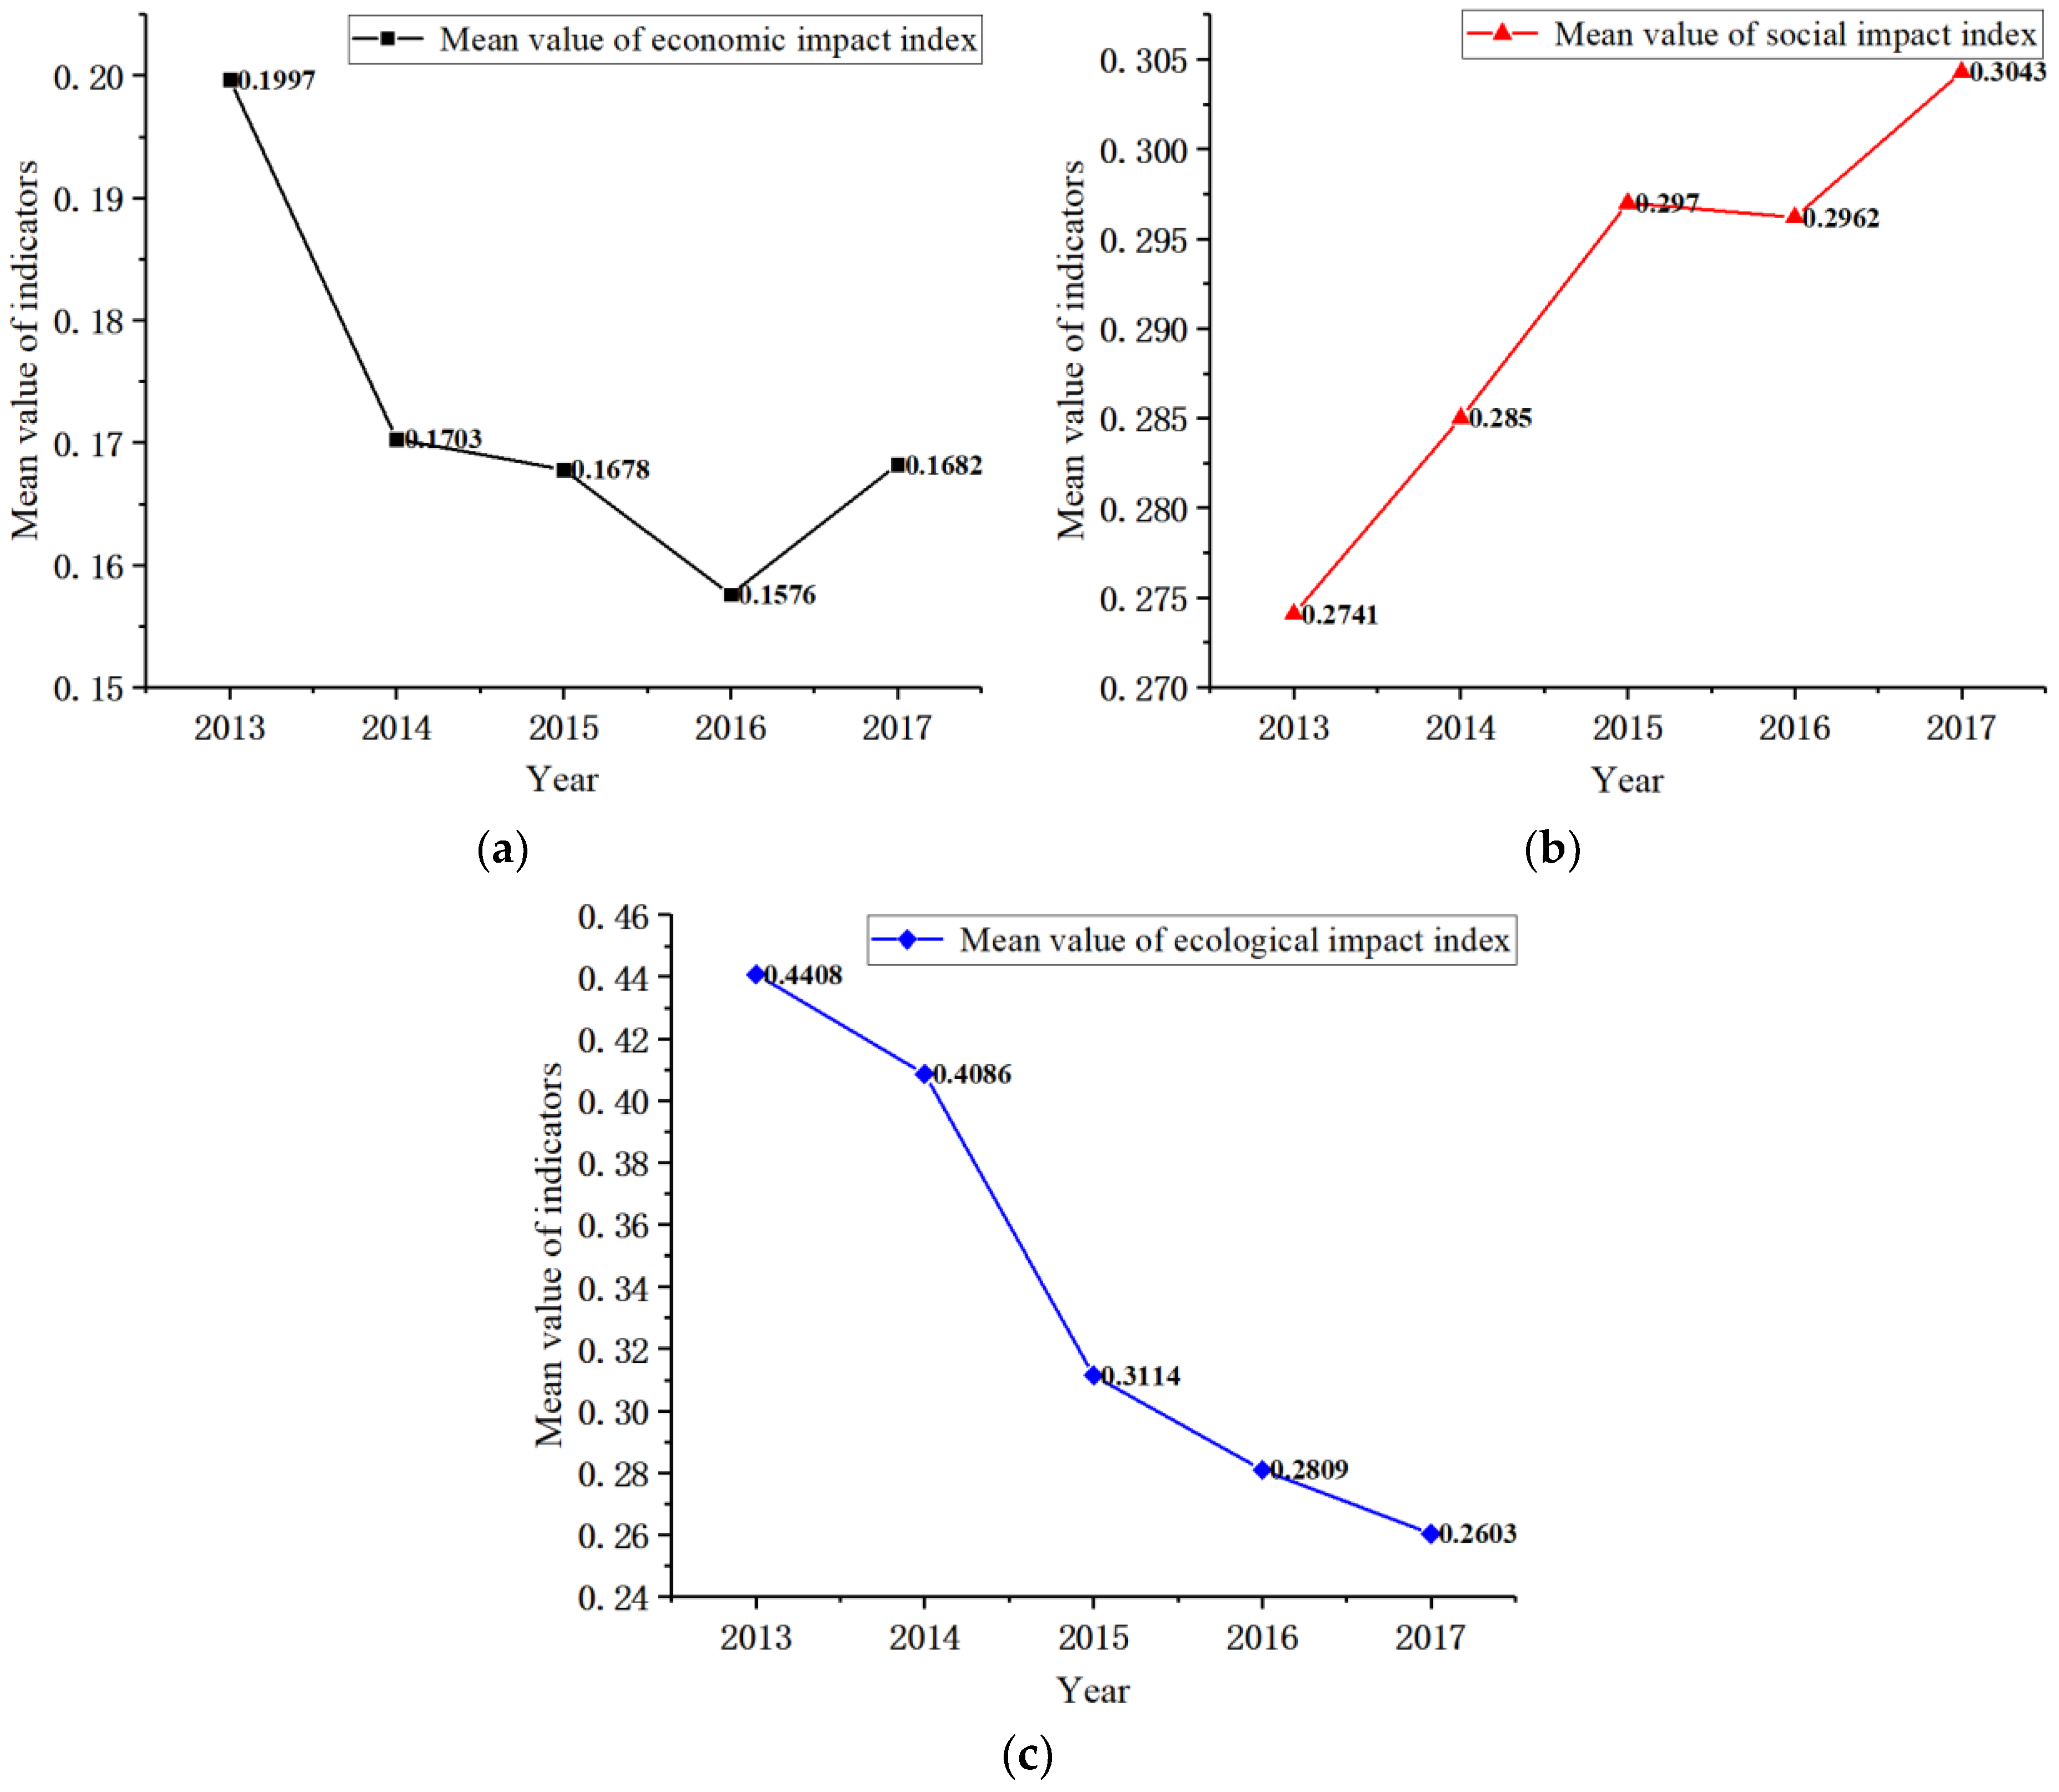
3.1. Analysis on the General Situation of Economic, Social and Ecological Impact of Traffic Network in Beijing–Tianjin–Hebei Urban Agglomeration

It can be seen from the average change of ESE impact index of traffic network in BTH urban agglomeration from 2013 to 2017 (Figure 2). In the past five years, the average annual change of economic impact degree of traffic network in BTH urban agglomeration shows a fluctuating pattern, with a decrease of 15.77% in 2017 year compared with that in 2013 year, indicating that the driving role of transportation network on the overall economic development of BTH urban agglomeration has been weakened and its sustainability has been reduced; In terms of social impact, the average social impact degree of traffic network in BTH urban agglomeration shows a steady upward trend in recent five years, with an increase of 11.02% in 2017 years compared with that in 2013 years, and the interannual change rate is stable, indicating that the traffic network has played a stable role in driving the overall social development of BTH urban agglomeration in the past five years; In terms of ecological impact degree, the average ecological impact degree has continued to decline in the past five years, with a decrease of 40.95% in 2017 compared with 2013. In 2013, the Ministry of environmental protection issued the detailed rules for the implementation of the action plan for the prevention and control of air pollution in BTH and its surrounding areas to jointly rectify the air pollution problem; In 2014, the government put forward the policy of “integration of BTH”; In 2015, it deliberated and passed the outline of the plan for coordinated development of BTH, and required the development of BTH to focus on traffic and environmental protection. Under the promotion of a number of policies of the party and the government, the traffic network construction and ecological protection of BTH urban agglomeration have achieved obvious results, especially the ecological impact change value from 2014 to 2015 accounted for 53.85% of the total five-year change value.

3.2. Analysis on Regional Differences of Economic, Social and Ecological Impacts of Traffic Network in Beijing–Tianjin–Hebei Urban Agglomeration

Due to the differences in the size, functional orientation, geographical location [46] and political and economic status of each city in the BTH urban agglomeration, the impact of the transportation network on the ESE of each city will also be different. In this paper, the Jenks natural breaks classification method in ArcGIS10.2 is used to evaluate the ESE impact scores of the traffic network in the BTH urban agglomeration from 2013 to 2017. Then, based on the division results of the Jenks natural breaks, the cities in different periods of BTH urban agglomeration are divided into seven categories. Finally, according to the classification results, the spatial and temporal differences of ESE impacts of urban traffic networks are analyzed in depth.

3.2.1. Economic, Social, and Ecological Impact Assessment of Urban Traffic Network in Beijing–Tianjin–Hebei Urban Agglomeration

According to the constructed traffic network ESE index system, the entropy weight TOPSIS method was used to obtain the traffic network ESE impact assessment scores of 13 cities in BTH from 2013 to 2017. The specific results are shown in Table A4, Table A5 and Table A6. Then, the Jenks natural breaks classification method in ArcGIS10.2 is used to grade the evaluation results (Table 4).
According to Table 4, the threshold value of economic impact assessment score of BTH urban agglomeration is 0.1860. If the score is greater than 0.1860, the economic impact of transportation network is relatively high, and the sustainable development level of transportation network is relatively good; if the score is less than or equal to 0.1860, the economic impact of transportation network is relatively low, and the sustainable development level of transportation network is relatively poor. It can be seen from Figure 3 that from 2013 to 2015, there were 5 cities with high score in traffic network economic impact assessment, namely Beijing, Tianjin, Tangshan, Shijiazhuang, and Handan, accounting for 38.46% of the cities studied in BTH; From 2016 to 2017, the number of cities with high score in traffic network economic impact assessment was reduced to 4, and the score of traffic network economic impact assessment in Handan decreased significantly. In terms of spatial distribution, the cities with low score in the economic impact assessment of the transportation network of BTH urban agglomeration are generally distributed in the surrounding areas around Beijing–Tianjin–Tangshan, such as Qinhuangdao, Chengde, Zhangjiakou, etc. These cities are generally small in scale, with relatively weak economic and transportation infrastructure.
According to Table 4, the threshold of social impact assessment score of BTH urban agglomeration transportation network is 0.3209. If the score is greater than 0.3209, the social impact degree of transportation network is relatively high, and the social sustainable development level of transportation network is relatively good; if the score is less than or equal to 0.3209, the social impact degree of transportation network is relatively low, and the social sustainable development level of transportation network is relatively low poor. It can be seen from Figure 4 that in 2013, there were only three cities with high scores in the social impact assessment of transportation network, namely Beijing, Tianjin and Handan, accounting for 23.07% of the cities studied in BTH; from 2014 to 2017, there were four cities with high scores in the social impact assessment of transportation network, and one new city was Tangshan. According to the change of social impact degree of traffic network of BTH urban agglomeration in recent five years, we can see that the level of social sustainable development of BTH urban agglomeration is generally low, and there is a large space for improvement. In terms of spatial distribution, the cities with high score in social impact assessment of transportation network are mainly distributed in the central core area and the southernmost part of BTH.
According to Table 4, the threshold of ecological impact assessment score of BTH urban agglomeration transportation network is 0.3691. If the score is greater than 0.3691, the ecological impact degree of transportation network is relatively high and the ecological sustainable development level of transportation network is relatively poor. If the score is less than or equal to 0.3691, the ecological impact degree of transportation network is relatively low and the ecological sustainable development level of transportation network is relatively high. It can be seen from Figure 5 that from 2013 to 2014, there were seven cities with high score in traffic network ecological impact assessment, five cities in 2015, four cities in 2016, and only one city in 2016. During these five years, the number of cities with high score in traffic network ecological impact assessment decreased significantly, indicating that the effect of traffic network ecological environment governance of BTH urban agglomeration was significant. From the perspective of spatial distribution, the cities with high ecological evaluation scores of transportation network are mainly distributed in the southern part of BTH urban agglomeration, which are mainly located on the main traffic roads connecting north and south, and the traffic pollution is relatively serious.

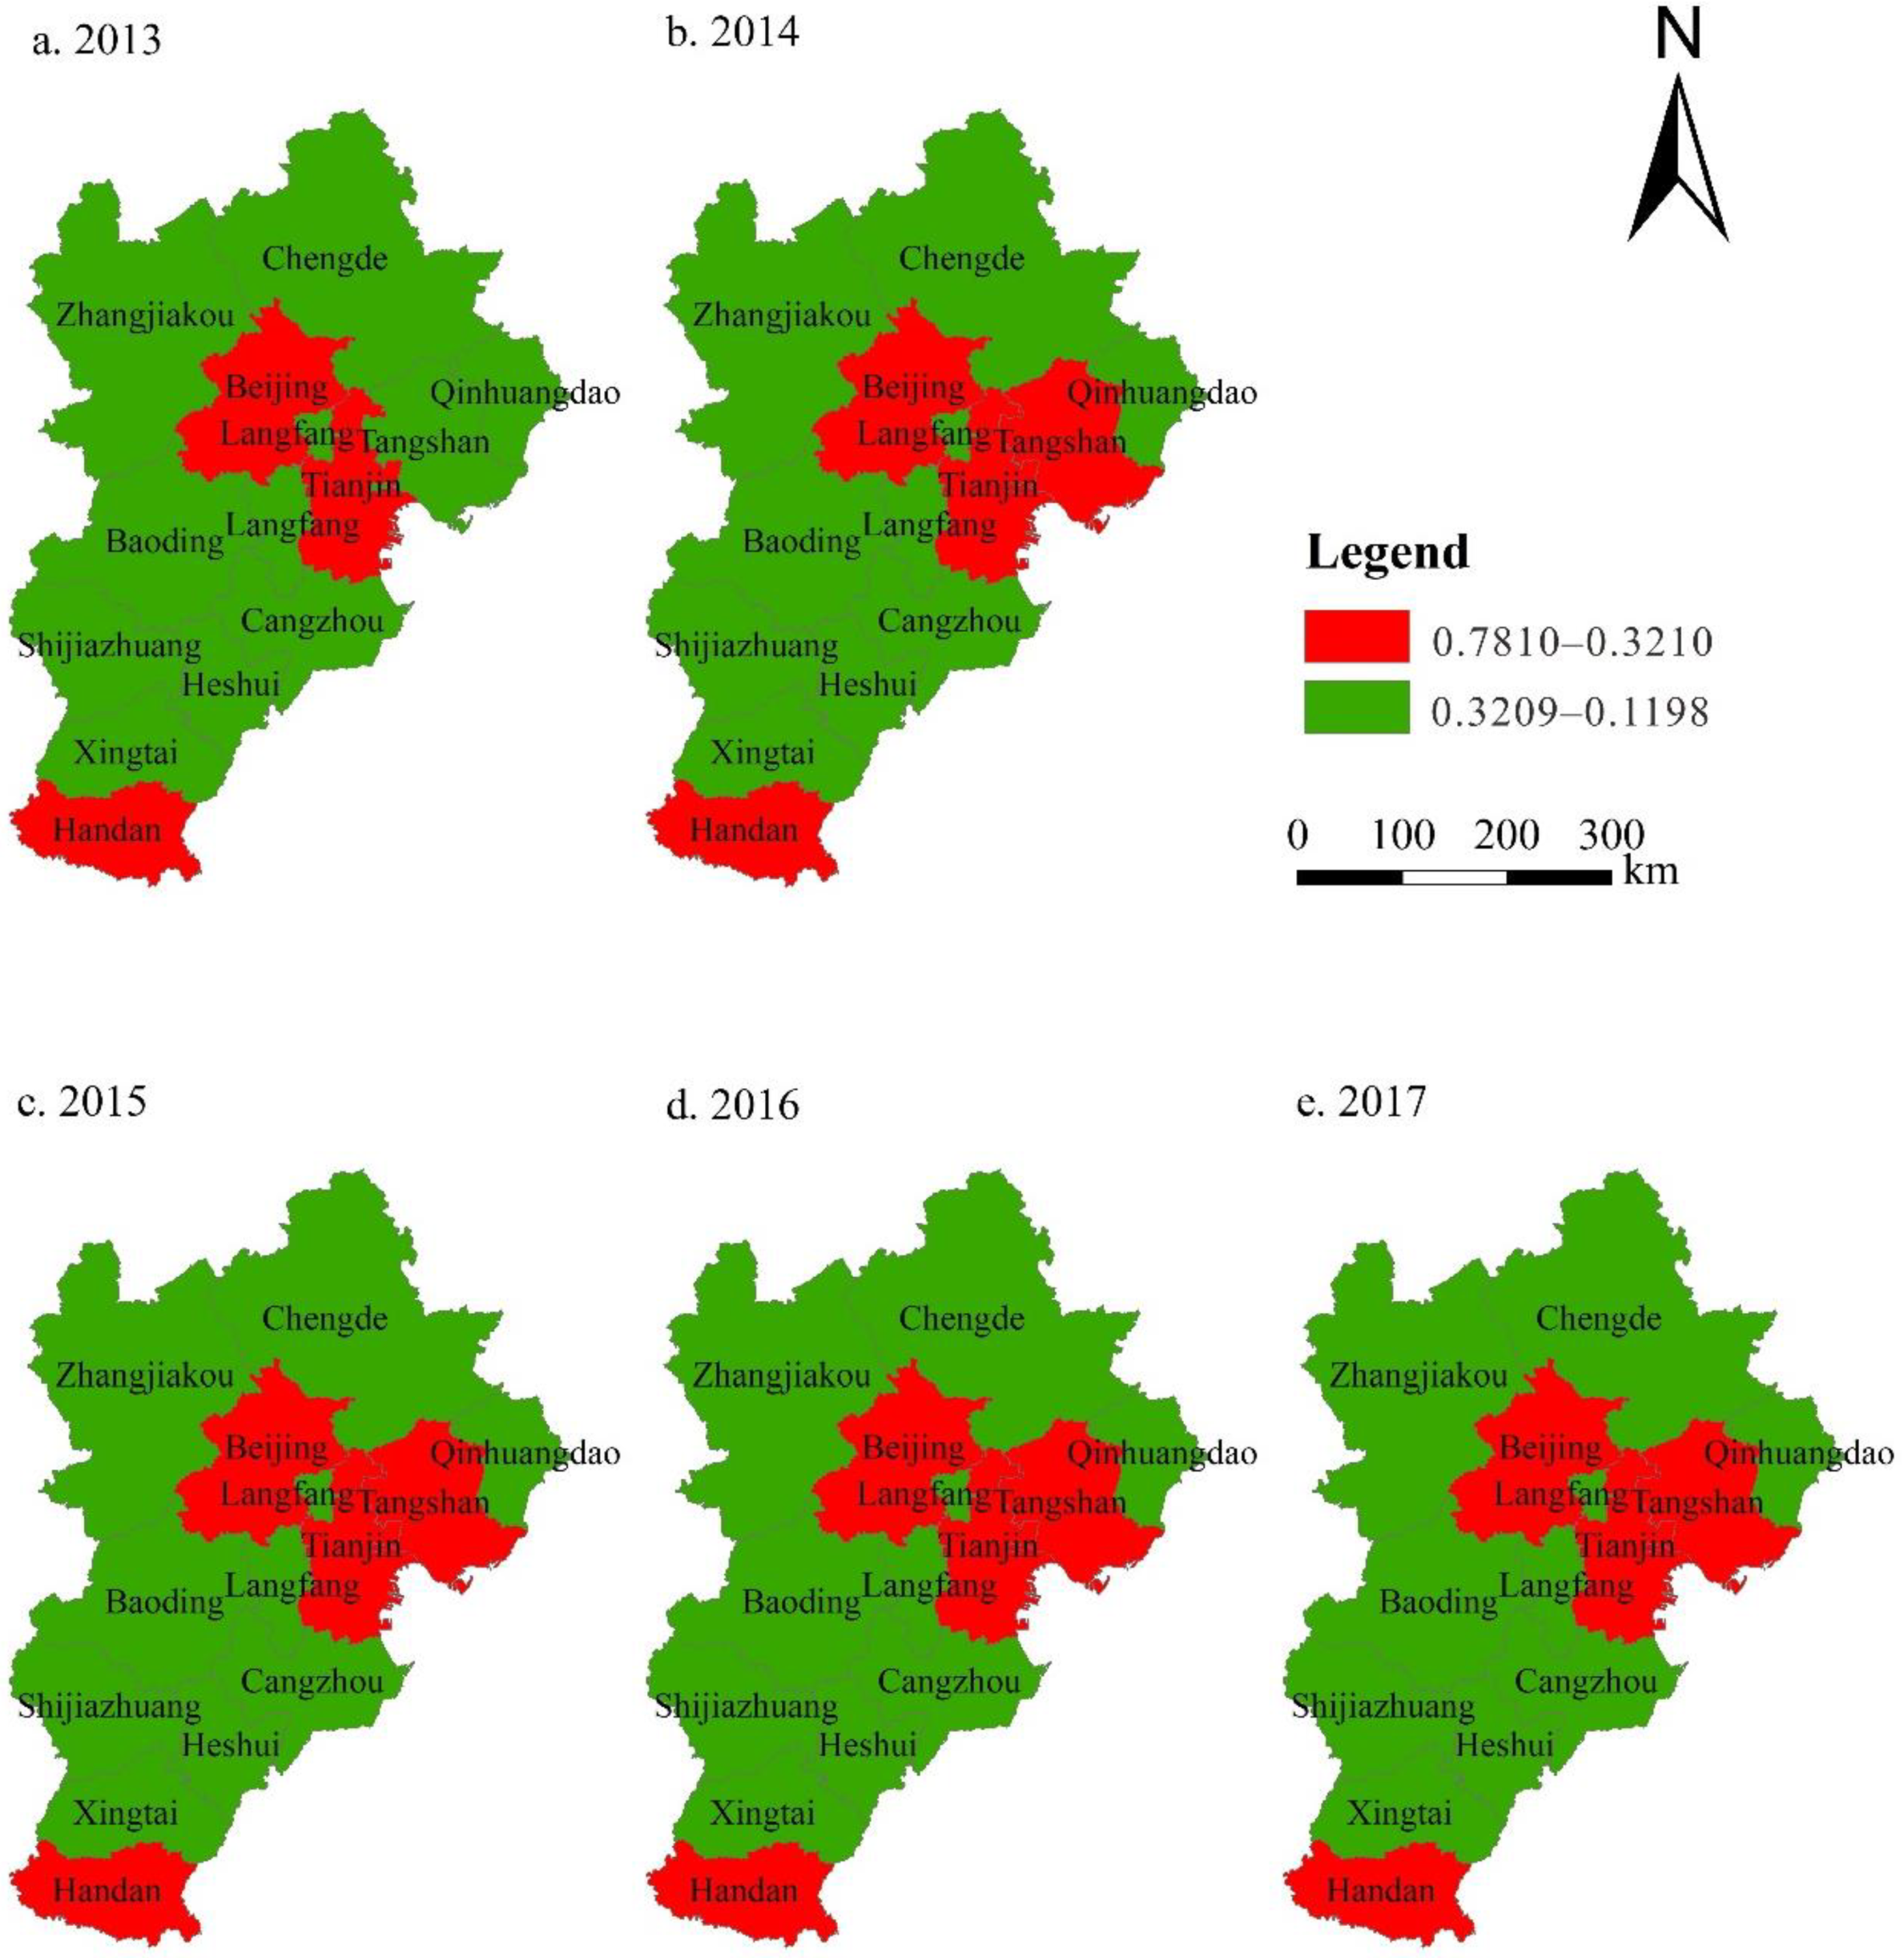
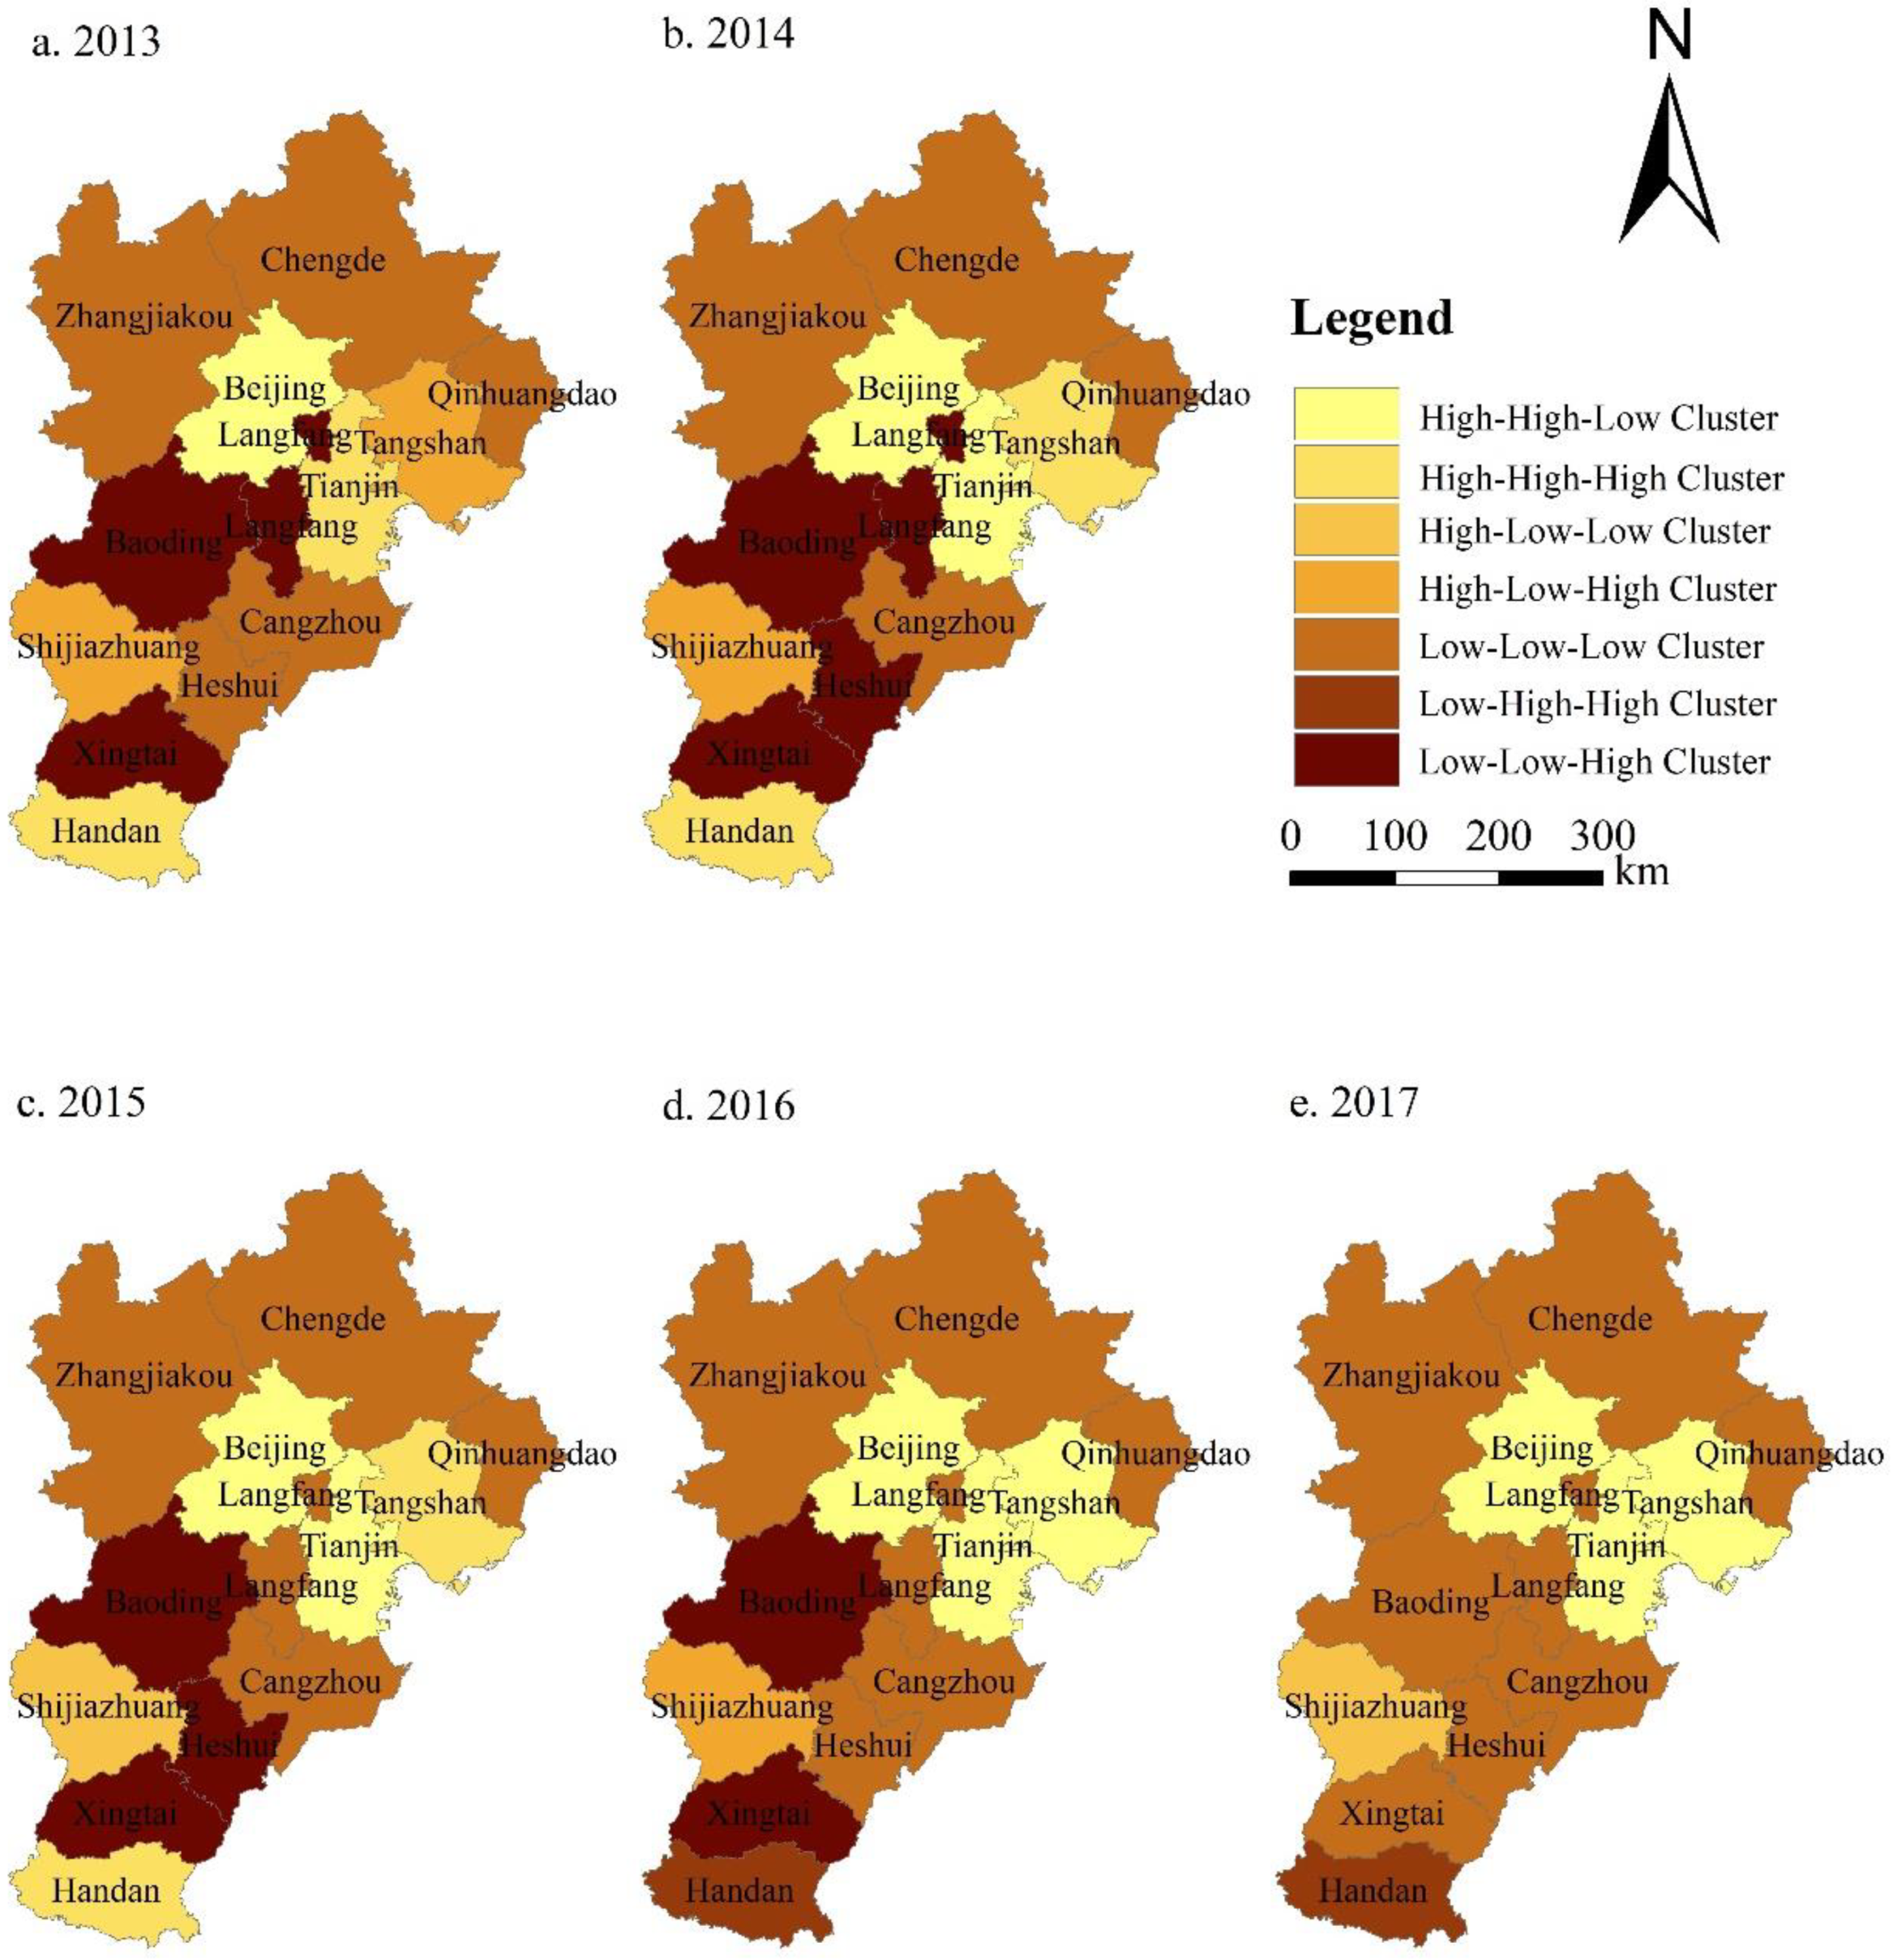
3.2.2. Spatial and Temporal Differences of Economic, Social, and Ecological Impacts of Urban Transportation Network in Beijing–Tianjin–Hebei Urban Agglomeration

According to the results of ESE impact assessment of BTH urban agglomeration transportation network from 2013 to 2017, this study divides the urban types in different periods into seven categories (Table 5). They are “High-High-Low” cluster, “High-High-High” cluster, “High-Low-Low” cluster, “High-Low-High” cluster, “Low-Low-Low” cluster, “Low-High-High” cluster, and “Low-Low-High” cluster. Finally, this paper analyzes the temporal and spatial evolution of different urban types in BTH.
“High-High-Low” cluster city refers to the city with great contribution to the economic and social development of transportation network and better ecological environment management. This type of city follows the principle of sustainable development of transportation, that is, with the rapid development of urban economy and society, the ecological environment can also be well protected, so that the three can achieve coordination, it belongs to the ultimate goal of urban traffic network construction. As shown in Figure 6, this type of cities has increased in the past five years. By 2017, this type of cities include Beijing, Tianjin and Tangshan. In the past five years, Beijing has been a “High-High-Low” cluster city, indicating that Beijing’s transportation network construction pays attention to the coordinated development of ESE; In 2013, Tianjin was classified as a “High-High-High” cluster city, and the environmental problems caused by the transportation network scored high in the BTH urban agglomeration. With the strengthening of governance, the city classification of Tianjin became a “High-High-Low” cluster city after 2014. In 2013, Tangshan city was classified as a “High-Low-High” cluster city, with low social and ecological sustainability of transportation network. With the increase of the permanent resident population and the employment population in the transportation industry in Tangshan, the driving role of the social development of the transportation network has been significantly strengthened. In 2014, the city category of Tangshan city turned to the “High-High-High” cluster. With the increase of environmental governance, after 2016, the city category of Tangshan City has become “High-High-Low” cluster and the transportation network ESE have reached coordination.
“High-High-High” cluster city, “High-Low-Low” cluster city, “High-Low-High” cluster city, “Low-Low-Low” cluster city and “Low-High-High” cluster city belong to the transitional stage of urban transportation network construction, which often have one or two disadvantages in the sustainable development of ESE. There are two trends in the development of transportation network in these cities. One is to solve the disadvantages of transportation network development, while maintaining the advantages of its own transportation network development, and develop towards the direction of transportation network sustainability, such as Tangshan. The other is that it does not solve the disadvantages of its own transportation network development, and does not maintain the advantages of its own transportation network development, leading to the unsustainable development of transportation network, such as Handan. For cities in the transition stage of transportation network construction, more attention should be paid to the planning of their own transportation network development, to realize the comprehensive and sustainable development of transportation network in ESE. In 2017, the main urban type of ESE impact of BTH transportation network was “Low-Low-Low” cluster, accounting for 61.54% of the total research cities in BTH. In terms of space, it was distributed around Beijing Tianjin Tangshan.
“Low-Low-High” cluster city is the worst type of city, and its transportation network of ESE sustainable development is at a low level. In Figure 6, this category of cities is mainly concentrated in 2013–2016, especially Baoding and Xingtai. In 2017, with the improvement of traffic environment, these cities transformed into “Low-Low-Low” cluster.

4. Conclusions and Suggestions

4.1. Conclusions

In this paper, 12 indicators in the field of transportation are selected to build the evaluation index system of ESE effects of transportation network in BTH urban agglomeration. By using entropy weight TOPSIS model and the Jenks natural breaks classification method, the ESE impacts of transportation network in 13 cities of BTH from 2013 to 2017 are analyzed from the temporal and spatial dimensions. Some remarkable findings are that:
  • Overall, the economic impact of BTH transportation network has declined in the past five years, the social impact is increasing year by year, and the ecological impact is decreasing year by year.
  • According to the ESE impact assessment results of the transportation network of BTH urban agglomeration from 2013 to 2017, the city types can be divided into seven categories: “High-High-Low” cluster, “High-High-High” cluster, “High-Low-Low” cluster, “High-Low-High” cluster, “Low-Low-Low” cluster, “Low-High-High” cluster, and “Low-Low-High” cluster. Except Handan City, the ESE impact assessment categories of other cities’ transportation network have been improved, but the proportion of cities in the transition period is still large, especially the “Low-Low-Low” cities. The types of cities in the transitional period need to be focused. It is still a heavy burden to realize the ESE coordination and sustainable development of BTH urban agglomeration transportation network.

4.2. Suggestions

In view of the problems existing in the ESE development of the transportation network of BTH urban agglomeration, this study puts forward some suggestions for the sustainable development of the future transportation network of different cities in BTH urban agglomeration. For the cities around Beijing, Tianjin, and Tangshan, while ensuring the regional ecological environment, it is necessary to strengthen the driving role of transportation network on regional economic and social development, speed up the construction of transportation infrastructure, and create a convenient commuter circle around Beijing and Tianjin. As the core of BTH urban agglomeration, Beijing and Tianjin need to strengthen the radiation role of surrounding cities and transfer some urban functions to the surrounding cities. For Shijiazhuang, the social impact of the transportation network is relatively weak, so we need to focus on the function of the provincial capital, formulate and implement the talent introduction policy, increase the employment in the transportation industry, and promote the urbanization process. For Handan, we need to summarize the problems existing in the development of transportation network, strengthen environmental governance, promote the revitalization of regional transportation industry, and revive regional economy.

Author Contributions

X.Z. guided the research method, content and writing of the paper; L.Z. performed the experiments; K.W. provided the data; S.Y. contributed analysis tools; and L.Z. wrote the paper. All authors have read and agreed to the published version of the manuscript.

Funding

This research was supported by the National Key R&D Program of China (Grant No: 2017YFB0503804), the Key Project from National Social Science Foundation of China (Grant No: 18ZDA053), the Fundamental Research Funds for the Central Universities, China University of Geosciences (Wuhan) (Grant No: 26420180053) and the Youth Science Fund Project (Grant No: 41901388).

Institutional Review Board Statement

The study did not require ethical approval.

Informed Consent Statement

Informed consent was obtained from all subjects involved in the study.

Data Availability Statement

The detailed data and code of the article can be downloaded from the following website (https://github.com/wantime/Entropy-weight-TOPSIS-code-and-data.git).

Conflicts of Interest

The authors declare no conflict of interest.

Appendix A

Table A1. Economic evaluation score and rank of different MCDA methods for traffic network of BTH urban agglomeration in 2017.
CitiesTOPSISVIKOR
C j RankQRank
Beijing0.531110.0001
Tianjin0.427820.1572
Shijiazhuang0.326030.7243
Tangshan0.287240.7834
Qinhuangdao0.053290.97210
Handan0.157750.8345
Xingtai0.0391100.9469
Baoding0.080380.8626
Zhangjiakou0.0302110.98812
Chengde0.0277120.97511
Cangzhou0.099570.8857
Langfang0.104060.9188
Hengshui0.0225131.00013
Spearman(r)0.967 **
Note: ** means the significant level of correlation coefficient is 0.01.
Table A2. Economic evaluation score and rank of different normalization methods for traffic network of BTH urban agglomeration in 2017, where r(A)-scoring and ranking by using TOPSIS with minimum–maximum method; r(B)-scoring and ranking by using TOPSIS with vector method; r(C)-scoring and ranking by using TOPSIS with sum method; r(D)-scoring and ranking by using TOPSIS maximum method; r(E)-scoring and ranking by using TOPSIS minimum method.
Citiesr(A)r(B)r(C)r(D)r(E)
C j Rank C j Rank C j Rank C j Rank C j Rank
Beijing0.531110.334010.381410.523810.37321
Tianjin0.427820.253220.273020.419720.26482
Shijiazhuang0.326030.134030.118330.316630.09133
Tangshan0.287240.118940.100440.278940.07814
Qinhuangdao0.053290.0136100.0215100.052290.02249
Handan0.157750.068050.060650.153250.05185
Xingtai0.0391100.020290.023790.0379100.020410
Baoding0.080380.051660.048470.078680.04647
Zhangjiakou0.0302110.0033130.0144110.0301110.016711
Chengde0.0277120.0104110.0142120.0275120.015812
Cangzhou0.099570.027880.049860.097770.04946
Langfang0.104060.029170.041580.101660.03968
Hengshui0.0225130.0087120.0069130.0217130.004313
Table A3. Spearman coefficient values for all considered rankings, where r(A)-scoring and ranking by using TOPSIS with minimum-maximum method; r(B)-scoring and ranking by using TOPSIS with vector method; r(C)-scoring and ranking by using TOPSIS with sum method; r(D)-scoring and ranking by using TOPSIS maximum method; r(E)-scoring and ranking by using TOPSIS minimum method. R is the degree of compatibility. The higher the degree of compatibility, the more effective the normalization method is.
r(A)r(B)r(C)r(D)r(E)
r(A)10.962 **0.978 **10.984 **
r(B)0.962 **10.967 **0.962 **0.962 **
r(C)0.978 **0.967 **10.978 **0.995 **
r(D)10.962 **0.978 **10.984 **
r(E)0.984 **0.962 **0.995 **0.984 **1
R0.9810.9630.9790.9810.981
Note: ** means the significant level of correlation coefficient is 0.01.
Table A4. Economic impact assessment scores of traffic network in BTH urban agglomeration from 2013 to 2017.
Cities20132014201520162017
C j Rank C j Rank Rank C j Rank C j Rank
Beijing0.766310.499910.495110.503110.53111
Tianjin0.378720.387120.410320.414320.42782
Shijiazhuang0.290640.276240.287230.295130.32603
Tangshan0.317430.278530.276240.284840.28724
Qinhuangdao0.0240130.0248120.0335110.039390.05329
Handan0.236550.247850.261850.149850.15775
Xingtai0.0530100.0519100.0522100.0367100.039110
Baoding0.186060.138160.071280.073280.08038
Zhangjiakou0.0453110.0352110.0261120.0217120.030211
Chengde0.079090.058890.058690.0364110.027712
Cangzhou0.104170.100870.105660.084670.09957
Langfang0.086480.088680.088870.090960.10406
Hengshui0.0284120.0259130.0152130.0184130.022513
Table A5. Social impact assessment scores of traffic network in BTH urban agglomeration from 2013 to 2017.
Cities20132014201520162017
C j Rank C j Rank C j Rank C j Rank C j Rank
Beijing0.781110.682010.689110.681910.67451
Tianjin0.401330.394030.398330.396740.39294
Shijiazhuang0.208960.221770.228270.242170.25457
Tangshan0.200180.390340.387840.398330.39783
Qinhuangdao0.1487110.1581100.1772110.1769110.184611
Handan0.470820.469920.581120.497720.55592
Xingtai0.232850.237860.243660.264160.27546
Baoding0.1198130.1206130.1256130.1335130.140913
Zhangjiakou0.175090.1821110.191690.199890.20729
Chengde0.208970.212880.217280.224380.22758
Cangzhou0.312640.320950.291950.288850.28045
Langfang0.1705100.178690.1868100.1958100.206010
Hengshui0.1331120.1365120.1429120.1508120.157812
Table A6. Evaluation scores of traffic network ecological impact of BTH urban agglomeration from 2013 to 2017.
Cities20132014201520162017
C j Rank C j Rank C j Rank C j Rank C j Rank
Beijing0.2825100.2994110.237290.217680.20319
Tianjin0.392370.335080.2198110.2071110.198610
Shijiazhuang0.776510.567130.369160.413410.36142
Tangshan0.610440.478350.381140.338150.31495
Qinhuangdao0.307080.3044100.2344100.215290.193111
Handan0.714220.508440.430830.395320.37781
Xingtai0.685730.630310.460120.385040.35413
Baoding0.601950.581820.470910.389830.33354
Zhangjiakou0.2291110.2219120.1634120.1582130.20918
Chengde0.1985130.2198130.1613130.1641120.162613
Cangzhou0.2142120.318790.283170.264170.25136
Langfang0.424260.419870.259180.2135100.177212
Hengshui0.294690.427460.378350.290260.24697

References

  1. Medlol, S.G.; Alwash, A.A.A. Economic, Social, and Environmental Sustainable Operation of Roadways within the Central Business District (CBD) sector at Hilla City Incorporated with Public Transport. IOP Conf. Ser. Mater. Sci. Eng. 2020, 928, 22100. [Google Scholar] [CrossRef]
  2. Liu, R.C.; Ding, S.B.; Wang, C.X.; Sun, J.J. The Impact Assessment System of Expressway on Regional Development: A Case Study of Shandong Province. Sci. Geogr. Sin. 2012, 32, 798–806. (In Chinese) [Google Scholar]
  3. Chen, Z.; Haynes, K.E. Regional Impact of Public Transportation Infrastructure: A Spatial Panel Assessment of the U.S. Northeast Megaregion. Econ. Dev. Q. 2015, 29, 519–520. [Google Scholar] [CrossRef]
  4. Li, J.; Wen, J.; Jiang, B. Spatial Spillover Effects of Transport Infrastructure in Chinese New Silk Road Economic Belt. Int. J. e-Navigation Marit. Econ. 2017, 6, 1–8. [Google Scholar] [CrossRef]
  5. Meng, D.Y.; Shen, J.H.; Lu, Y.Q. Spatial Coupling between Transportation Superiority and Economy in Central Plain Economic Zone. Econ. Geogr. 2012, 32, 7–14. (In Chinese) [Google Scholar]
  6. Jin, W.P.; Hua, L.C.; Wang, J.J. Evolvement of the Coordination between Transportation Superiority and Economy Development Level in Hunan, China. Econ. Geogr. 2017, 2, 33–38. (In Chinese) [Google Scholar]
  7. Fiorello, D.; Maffii, S. The Impact of Transport Networks on Regional Development and Employment. In World Conference on Transport Research; The World Conference on Transport Research Society: Berkeley, CA, USA, 2007. [Google Scholar]
  8. Gao, J.; Tian, G.; Sorniotti, A.; Karci, A.E.; Palo, R.D. Review of thermal management of catalytic converters to decrease engine emissions during cold start and warm up. Appl. Therm. Eng. 2018, 147, 177–187. [Google Scholar] [CrossRef]
  9. Gao, J.; Tian, G.; Sorniotti, A. On the emission reduction through the application of an electrically heated catalyst to a diesel vehicle. Energy Sci. Eng. 2019, 7, 1–15. [Google Scholar] [CrossRef] [Green Version]
  10. Zhou, X. Study on atmospheric environmental impact assessment during operation of urban roads. Environ. Dev. 2017, 137, 36–38. (In Chinese) [Google Scholar]
  11. Kolaka, O.İ.; Akın, D.; Birbil, Ş.İ.; Feyziŏglu, O.; Noyan, N. Multicriteria Sustainability Evaluation of Transport Networks for Selected European Countries. Lect. Notes Eng. Comput. Sci. 2011, 2190, 117–122. [Google Scholar]
  12. Reisi, M.; Aye, L.; Rajabifard, A.; Ngo, T. Transport sustainability index: Melbourne case study. Ecol. Indic. 2014, 43, 288–296. [Google Scholar] [CrossRef]
  13. Ding, L.; Shao, Z.F.; Zhang, H.C.; Xu, C.; Wu, D. A Comprehensive Evaluation of Urban Sustainable Development in China Based on the TOPSIS-Entropy Method. Sustainability 2016, 8, 746. [Google Scholar] [CrossRef] [Green Version]
  14. Li, Y.C.; Yang, J.; Shi, H.W.; Li, Y.J. Assessment of sustainable urban transport development based on entropy and unascertained measure. PLoS ONE 2017, 12, e0186893. [Google Scholar] [CrossRef]
  15. Li, X.W. TOPSIS Model for Urban Transport Network Optimization Based on AHP and Entropy. In Proceedings of the 2011 International Conference on Transportation, Mechanical, and Electrical Engineering (TMEE), Changchun, China, 16–18 December 2011. [Google Scholar]
  16. Lv, T.; Wang, Y.; Deng, X.; Zhan, H.; Siskova, M. Sustainability transition evaluation of urban transportation using fuzzy logic method-the case of Jiangsu Province. J. Intell. Fuzzy Syst. 2020, 39, 1–16. [Google Scholar]
  17. Rossi, R.; Gastaldi, M.; Gecchele, G. Sustainability Evaluation of Transportation Policies: A Fuzzy-Based Method in a “What to” Analysis. Adv. Intell. Syst. Comput. 2013, 223, 315–326. [Google Scholar]
  18. Ozkaya, G.; Erdin, C. Evaluation of Sustainable Forest and Air Quality Management and the Current Situation in Europe through Operation Research Methods. Sustainability 2020, 12, 10588. [Google Scholar] [CrossRef]
  19. Chen, X.G.; Li, Z.J.; Zhu, Z.T. A general multi criteria and multi attribute comprehensive evaluation method for urban traffic. Math. Pract. Theory 2018, 48, 176–184. (In Chinese) [Google Scholar]
  20. Szpotowicz, R.; Tóth, C. Revision of Sustainable Road Rating Systems: Selection of the Best Suited System for Hungarian Road Construction Using TOPSIS Method. Sustainability 2020, 12, 8884. [Google Scholar] [CrossRef]
  21. Zlaugotne, B.; Zihare, L.; Balode, L.; Kalnbalkite, A.; Khabdullin, A.; Blumberga, D. Multi-Criteria Decision Analysis Methods Comparison. Environ. Clim. Technol. 2020, 24, 454–471. [Google Scholar] [CrossRef]
  22. Wątróbski, J.; Jankowski, J.; Ziemba, P.; Karczmarczyk, A.; Zioło, M. Generalised framework for multi-criteria method selection: Rule set database and exemplary decision support system implementation blueprints. Data Brief 2019, 22, 639–642. [Google Scholar] [CrossRef]
  23. Shekhovtsov, A.; Saabun, W. A comparative case study of the VIKOR and TOPSIS rankings similarity. Procedia Comput. Sci. 2020, 176, 3730–3740. [Google Scholar] [CrossRef]
  24. Kaneesamkandi, Z.; Rehman, A.U.; Usmani, Y.S.; Umer, U. Methodology for Assessment of Alternative Waste Treatment Strategies Using Entropy Weights. Sustainability 2020, 12, 6689. [Google Scholar] [CrossRef]
  25. Opricovic, S.; Tzeng, G.H. Compromise solution by MCDM methods: A comparative analysis of VIKOR and TOPSIS. Eur. J. Oper. Res. 2004, 156, 445–455. [Google Scholar] [CrossRef]
  26. Piegat, A.; Sababun, W. Identification of a Multicriteria Decision-Making Model Using the Characteristic Objects Method. Appl. Comput. Intell. Soft Comput. 2014, 14, 96–109. [Google Scholar] [CrossRef] [Green Version]
  27. Piegat, A.; Saabun, W. Comparative Analysis of MCDM Methods for Assessing the Severity of Chronic Liver Disease. In International Conference on Artificial Intelligence and Soft Computing; Springer: Cham, Switzerland, 2015. [Google Scholar]
  28. Shekhovtsov, A.; Koodziejczyk, J. Do distance-based multi-criteria decision analysis methods create similar rankings? Procedia Comput. Sci. 2020, 176, 3718–3729. [Google Scholar] [CrossRef]
  29. Beijing Municipal Bureau of Statistics. Available online: http://tjj.beijing.gov.cn/tjsj_31433/ (accessed on 5 November 2018).
  30. Beijing Municipal Bureau of Ecological Environment. Available online: http://sthjj.beijing.gov.cn/ (accessed on 16 May 2018).
  31. Tianjin Municipal Bureau of Statistics. Available online: http://stats.tj.gov.cn/ (accessed on 12 June 2018).
  32. Tianjin Municipal Bureau of Ecological Environment. Available online: http://sthj.tj.gov.cn/ (accessed on 5 June 2018).
  33. Hebei Provincial Bureau of Statistics. Available online: http://tjj.hebei.gov.cn/ (accessed on 10 May 2019).
  34. Department of Ecological Environment of Hebei Province. Available online: http://hbepb.hebei.gov.cn/ (accessed on 5 July 2018).
  35. Zuo, D.; Ma, Y. Evaluation of the Sustainable Development of Integrated Transportation Based on the Entropy Weight TOPSIS Method. In Proceedings of the 15th COTA International Conference of Transportation Professionals, Beijing, China, 25–27 July 2015. [Google Scholar]
  36. Luo, W.H.; Dong, B.T. Research on evaluation model of regional economy and transportation development coordination. Highw. Transp. Technol. 2017, 11, 155–162. (In Chinese) [Google Scholar]
  37. Zou, Y. Grey Relational Analysis of the Correlation between the Road Transportation and the National Economy. In Proceedings of the 2015 International Conference on Electromechanical Control Technology and Transportation, Guangdong, China, 31 October 2015. [Google Scholar]
  38. Sun, H.; Fan, Z.Q.; She, Y. Research on comprehensive evaluation of urban public transportation competitiveness in Hebei province based on TOPSIS. In Proceedings of the International Conference on Logistics Systems and intelligent Management (ICLSIM), Harbin, China, 9–10 January 2010. [Google Scholar]
  39. Jiang, Y.M.; Guo, H.C.; Huang, K.; Yu, Y.J.; Liu, Y. Comprehensive evaluation method and application of urban ecological transportation system. Environ. Sci. Res. 2007, 20, 158–163. (In Chinese) [Google Scholar]
  40. Dang, V.T.; Wang, D. An Integrated Fuzzy AHP and Fuzzy TOPSIS Approach to Assess Sustainable Urban Development in an Emerging Economy. Int. J. Environ. Res. Public Health 2019, 16, 2902. [Google Scholar] [CrossRef] [PubMed] [Green Version]
  41. Lv, T.X.; Wu, X. Using Panel Data to Evaluate the Factors Affecting Transport Energy Consumption in China’s Three Regions. Int. J. Environ. Res. Public Health 2019, 16, 555. [Google Scholar] [CrossRef] [PubMed] [Green Version]
  42. Ruiz-Padillo, A.; Ruiz, D.P.; Torija, A.J.; Ramos-Ridao, A. Selection of suitable alternatives to reduce the environmental impact of road traffic noise using a fuzzy multi-criteria decision model. Environ. Impact Assess. Rev. 2016, 61, 8–18. [Google Scholar] [CrossRef] [Green Version]
  43. Fensterer, V.; Küchenhoff, H.; Maier, V.; Wichmann, H.E.; Breitner, S.; Peters, A.; Gu, J.; Cyrys, J. Evaluation of the Impact of Low Emission Zone and Heavy Traffic Ban in Munich (Germany) on the Reduction of PM10 in Ambient Air. Int. J. Environ. Res. Public Health 2014, 11, 5094–5112. [Google Scholar] [CrossRef] [PubMed] [Green Version]
  44. Balcerzak, A.P. Europe 2020 Strategy Implementation. Grouping the Countries with the Application of Natural Breaks Method. Chapters 2015, 1, 172–181. [Google Scholar]
  45. Fariza, A.; Rusydi, I.; Hasim, J.A.N.; Basofi, A. Spatial flood risk mapping in east Java, Indonesia, using analytic hierarchy process—Natural breaks classification. In Proceedings of the 2017 2nd International conferences on Information Technology, Information Systems and Electrical Engineering (ICITISEE), Yogyakarta, Indonesia, 1–3 November 2017. [Google Scholar]
  46. Lu, D.D. Function orientation and coordinating development of subregions within the Jing-Jin-Ji Urban Agglomeration. Prog. Geogr. 2015, 34, 265–270. (In Chinese) [Google Scholar]
Figure 1. The location of study area. On the right of the figure is the superposition data of DEM (Digital Elevation Model) and road network in the study area, in which the road network includes expressways, first−class highways and trunk line (national and provincial roads).
Sustainability 13 01862 g001
Figure 2. Average change trend of ESE impact index of transportation network in Beijing–Tianjin–Hebei (BTH) urban agglomeration from 2013 to 2017; (a) Interannual variation of economic impact index of transportation network; (b) Interannual variation of social impact index of transportation network; (c) Interannual variation of traffic network ecological impact index.
Sustainability 13 01862 g002
Figure 3. Scores division of traffic network economic impact assessment of BTH urban agglomeration from 2013 to 2017.
Sustainability 13 01862 g003
Figure 4. Scores division of traffic network social impact assessment of BTH urban agglomeration from 2013 to 2017.
Sustainability 13 01862 g004
Figure 5. Scores division of traffic network ecological impact assessment of BTH urban agglomeration from 2013 to 2017.
Sustainability 13 01862 g005
Figure 6. The change chart about ESE classification of BTH from 2013 to 2017.
Sustainability 13 01862 g006
Table 1. Comparison of multi-criteria decision analysis (MCDA) methods.
TOPSISVIKORCOPRASPROMETHEE
InputsIndel and anti-ideal option weightsBest and worst option weightsBest and worst option weightsIndifference and preference thresholds weights
OutputsComplete ranking with closeness score to ideal and distance to anti-idealComplete ranking with closeness score to best optionComplete rankingPartial and complete ranking
Preference functionDistance metricDistance metricMin MaxLinear
Ranking scale0~1Positive valuesPositive values−1~1
Best alternativeMax valueMin valueMax valueMax value
SuitabilityIt requires minimal input data and results are easy to understand and it is with shortest geometrical distance to ideal resultIt focuses on ranking and selecting from a set of alternatives in the presence of conflicting criteriaIt takes into account performance of the alternatives with best and worst values which affect the resultIt is based on the computation of preference degrees
and it shows which alternative would be more appropriate to solve the problem and how criteria weight impact alternative position
Table 2. Criteria for indicators selection [12].
CriteriaDescription
RelevanceEach indicator must properly hold the definition of traffic network.
MaturityThe indicator system should contain ESE aspects of traffic network.
Data availabilityNeeded data must be available easily and at a reasonable cost.
QuantifiableIndicators must be quantifiable.
IndependentIndicators should be independent of each other.
PredictabilityAs indicators can be used to model future policy impacts, it is essential that indicators values can be forecasted for the future.
Table 3. Evaluation indices system of ESE effects of urban agglomeration transportation network.
Evaluation ObjectIndicatorsWeightIndicator DirectionLiterature Support
Economic impact assessment of transportation network (EC)EC1 Fixed assets investment in transport, storage, and post (100 million yuan)0.171+[14,35] *
EC2 Gross output value of transport, storage, and post industry (100 million yuan)0.240+[36] *
EC3 Passenger traffic (10 thousand persons)0.405+[15,36,37,38] *
EC4 Freight traffic (10 thousand ton)0.184+[36,37,39]
Society impact assessment of transportation network (SC)SC1 Population density (person/km2)0.164+[13,35,38,39,40] *
SC2 Employment in transportation industry(person)0.460+[35,38]
SC3 Per capita length of roads (km/10 thousand person)0.150+[13,14,38] *
SC4 Urbanization rate (%)0.226+[36,41]
Ecology impact assessment of transportation network (EL)EL1 Mean value of transportation trunk noise (dB)0.127-[14,35,39,42]
EL2 ρ(PM10) (mg/m3)0.440-[12,35,39,43]
EL3 ρ(SO2) (mg/m3)0.168-[12,39]
EL4 ρ(NO2) (mg/m3)0.265-[12,35,39]
Explain: This type of indicator is used in the above references. * Represents a similar indicator.
Table 4. Determining the score threshold of ESE by the Jenks natural breaks.
ClassificationEC RangeSC RangeEL Range
Demarcation linesLow0.0152–0.18600.1198–0.32090.1613–0.3691
High0.1861–0.76630.3210–0.78110.3692–0.7765
Table 5. Classification of cities in different periods of BTH.
NumberClassificationIntroduction
1High-High-Low ClusterThe score of economic and social impact of the transportation network is high, and the score of ecological impact is low. The sustainability of urban transportation network is the best.
2High-High-High ClusterThe sustainable level of economic and social development of urban transportation network is good, but the ecological sustainable level is poor.
3High-Low-Low ClusterThe economic and ecological sustainability of transportation network is high, but the social sustainability is low.
4High-Low-High ClusterThe sustainable development level of transportation network economy is high, but the social and ecological sustainable development level is low.
5Low-Low-Low ClusterThe level of ecological sustainable development of transportation network is high, but the level of economic and social sustainable development is low.
6Low-High-High ClusterThe level of social sustainable development of transportation network is high, but the level of economic and ecological sustainable development is low.
7Low-Low-High ClusterThe economic, social, and ecological sustainability of urban transportation network is low.
Publisher’s Note: MDPI stays neutral with regard to jurisdictional claims in published maps and institutional affiliations.

