
Fuzzy Inference Model for Decision Support in Sustainable Production Planning Processes—A Case Study


1
Faculdade de Ciencias e Tecnologia, Campus Caparica, Universidade Nova de Lisboa, 2829-516 Caparica, Portugal
2
Department of Mechanical Engineering, University of Applied Sciences Emden/Leer, 26723 Emden, Germany
3
Mecânica e Industrial (UNIDEMI), Campus de Caparica, Unidade de Investigação em Engenharia, 2829-516 Caparica, Portugal
*
Author to whom correspondence should be addressed.
Sustainability 2021, 13(3), 1355; https://doi.org/10.3390/su13031355
Submission received: 26 December 2020
/
Revised: 18 January 2021
/
Accepted: 22 January 2021
/
Published: 28 January 2021
(This article belongs to the Collection Industrial Symbiosis and Sustainability)
Abstract
:Due to crises (e.g., climate crisis, extinction of species, shortage of natural resources, human health crisis), customer requirements for conventionally produced products shift to more sustainably produced products, reducing and avoiding negative environmental and social impacts. Circular thinking in production systems offers new opportunities to meet these new customer expectations. However, it enlarges new challenges for production planning too. Research gaps exist in production planning approaches, considering all three sustainability aspects (economic, environmental, and social) simultaneously. This paper presents a concept of a fuzzy inference model (FIM) to assess the sustainability of production programs. The FIM concept is demonstrated and tested using a single case study considering lab production schedules. The model’s outcome indicates the most significant opportunities to improve production programs’ sustainability using experts’ knowledge.
1. Introduction
German industrial manufacturing of goods accounts for over 80% of the country’s exports. This large number of exports lies at the heart of the German economy [1]. Moreover, it is also responsible for several environmental crises, such as climate change, extinction of species, and shortage of natural resources in Germany [2]. After nearly half a century of intensive efforts and financial investments, Germany, as well as the global community, is still far from solving sustainability problems in our time [3]. If creating sustainable value means maintaining our current and future living standards [4], current production modes have to change massively. In the current economic and political environment, the shift from linear thinking (production, consumption, and disposal) to circular manufacturing by closing material and energy loops becomes an important and challenging task, achieving national and global sustainable development goals [5]. The circular economy’s research topic seeks to address this challenge by improving the exchange of resources (materials and energy) between production units and local industry networks.
The implementation of circular thinking in production systems and local industrial networks offers new opportunities to exchange materials and energy, which can be recovered from, e.g., by-products, waste, and effluent [6]. The synchronization of processes for the generation and demand of these resources among production units within a factory or industry park is a challenging production planning task [7]. Additionally, covering other sustainability aspects in the production planning process increases the challenge. Several problems in assessing sustainability need to be solved, such as combining qualitative and quantitative sustainability variables and solving several objective functions simultaneously [8,9]. Existing sustainable production planning approaches consider single variables only, which leads to an incomplete sustainability assessment [8]. The social-sustainability dimension, in particular, has been neglected in previous studies for sustainable production planning [8,10,11].
In general, sustainability as a planning objective is a vague and complex problem and cannot be described by a single measure [12]. For example, the sustainability of a production system can be determined by variables considering, e.g., value added, use of materials, and number of occupational accidents [13]. Therefore, sustainability needs to be determined through a composition of functions of several variables for a specific evaluation goal and scope [12,14]. Another issue is that mathematical models require input- and output measurements to validate a model’s performance. Sustainability assessment models consider several input measures, but the models lack output measures, e.g., production sustainability [14]. Fuzzy logic provides opportunities to combine multiple qualitative and quantitative input variables to determine the sustainability state of a system [15]. The relevance of fuzzy logic for sustainability decision making is also shown in previous literature reviews for, e.g., green supply chain [16], energy management [17], sustainability system assessment [18].
This paper presents a concept of a fuzzy inference model (FIM) to support production planning processes and indicates the most significant opportunities to improve production programs’ sustainability using experts’ knowledge. The FIM combines multiple variables for the economic, environmental, and social aspects of sustainability to overcome the presented challenges and issues. The model’s outcome can support decision-making in production planning processes considering the exchange and demand of resources following different objectives, such as decreasing production costs, saving resources, and improving employees’ wellbeing.
The paper’s research methodology uses a single case study to demonstrate and test the concept of the FIM for sustainable production planning. For this approach, first, a narrative literature review has been performed to define the context and theoretical background of the paper and the scope of the FIM. Second, the general mathematical formulation of the FIM and a procedure to develop the FIM is presented. Third, the FIM parameter and operators are tested in a single case study using simulation data for a lab job shop learning factory for digitalization and sustainability [19].
Based on this research methodology, the structure of the paper is as follows. Section 2 presents the theoretical background and related literature about definitions for sustainable development, sustainable production planning, and examples of how fuzzy logic is already used to evaluate systems according to sustainability aspects. The FIM’s general scope is explained in Section 3, followed by the FIM’s general mathematical formulation and procedure to develop the FIM in Section 4. Section 5 shows the single case study results in developing and executing the FIM. Finally, the paper discusses challenges and opportunities using the model in local manufacturing systems located in industrial networks, improving the overall sustainability to achieve national and global sustainable development goals in Section 6.
2. Theoretical Background and Methods
This section presents the theoretical background and related literature to evaluate production programs according to sustainable aspects using fuzzy logic. For this approach, the first subsection presents definitions of sustainable development and sustainable production planning. The second section shows fuzzy logic basics and examples of how fuzzy logic is already used to evaluate enterprise management processes according to sustainability aspects.
2.1. Production Planning from a Sustainable Development Perspective
Sustainable production planning is rarely defined in the scientific landscape [20]. Therefore, the authors develop a definition using common definitions for sustainable (system) development, sustainable manufacturing, and production planning.
Sustainable development is widely defined as “development that meets the needs of the present without compromising the ability of future generations to meet their own needs” [4]. This definition of sustainable development has become very familiar, while the meaning of sustainable development, especially for manufacturing systems, has remained vague. In general, to develop something means, first, to determine the potential of a system to a fuller, higher, or better state and, second, to elaborate possible actions to reach this better state [21].
From a production perspective, production planning tools are used to determine and improve the state of future manufacturing systems. Production planning is already well described in standards and literature for production management. It is defined as a decision-making process to schedule the timely acquisition, utilization, and allocation of production resources (machines, labor, and production inputs) to specific production activities in the short term [22]. Conventional production planning aims to reach a manufacturing state that satisfies customer requirements in the most efficient way in terms of product quantity and quality [22,23].
Due to crises (e.g., climate crisis, extinction of species, shortage of natural resources, health crisis) [2], the customer requirements for conventionally produced products shift to more sustainably produced products that avoid negative environmental and social impacts [24]. Therefore, the goal of production planning needs to be extended by an environmental and social perspective [25]. For this approach, several definitions exist to describe a sustainable state of manufacturing systems [26] that needs to be reached with the aid of production planning tools. For example, the American Environmental Protection Agency (EPA) proposed the following widely used definition for sustainable manufacturing: “The creation of manufactured products through economically-sound processes that minimize negative environmental impacts while conserving energy and natural resources. Sustainable manufacturing also enhances employee, community, and product safety” [27]. However, conventional production planning is already a complex task because many factors of a production system contribute to its planning processes, such as large production systems, changing product portfolio, unpredictable events, and machine breakdown. Addressing sustainability objectives, such as limits for emissions and resources, the health status of employees in manufacturing operations scheduling, in addition to classical production objectives for quantity and quality, makes production scheduling much more complex [8,10].
From the presented and widely used definitions for sustainable development, sustainable manufacturing, and production planning, sustainable production planning for this research contribution is defined as the planning of production activities to achieve a set of production (output) goals by securing the operation of the production and achieving a set of sustainability goals avoiding economic losses, environmental damage, and social issues.
2.2. Fundamentals for Sustainability Evaluation of Enterprise Systems Using Fuzzy Logic
Mathematical models require input and output measurements to validate the performance of a model [28]. The sustainability assessment of systems lacks output data because sustainability cannot be directly determined or measured. Assessing the degree of sustainability of a system is a complex problem requiring expert knowledge and evaluation of multiple input variables [12,14]. Fuzzy set theory is one opportunity to overcome this problem, for several reasons.
In general, the fuzzy set theory was developed by Zadeh to take into account the inherent uncertainty and complexity involved in the process of modeling a real-world problem [15]. For this approach, fuzzy logic provides appropriate mathematical models to access the state of systems using expert knowledge, which can be represented in various ways, such as mathematical functions, linguistic rules, numerical values, or linguistic expressions [15]. Moreover, quantitative and qualitative variables can be normalized to evaluate systems using soft thresholds [15].
In general, a fuzzy model consists of the following three key steps [29]:
- The fuzzification step fuzzifies selected variables (x) into fuzzy values (µx) in an interval between zero and one using membership functions.
- The aggregation step aggregates the fuzzy values to a single membership value using single or multiple fuzzy operators.
- The defuzzification step converts the aggregated membership value into a crisp value determining the fuzzy model’s output.
This general procedure is used to categorize the following literature review results, which present existing approaches using fuzzy models for sustainability assessment (see Table 1). The narrative literature review is focused on sustainability assessment models that evaluate enterprise systems and included sub-systems, such as the production system and product system. Other target systems, such as countries, households, and supply chains, are not considered in the literature review.
The literature results state that fuzzy models are one opportunity in the decision-making processes for product and process design and strategic enterprise planning, considering sustainability aspects. These models consider, for example, various design uncertainties [30], process alternatives [31], and product alternatives [32,33,34]. Moreover, several studies support the strategic decision-making of the enterprises using different sustainability variable frameworks, e.g., Global Reporting Initiative [35], ISO 26000 [36], and individual frameworks [13,37,38].
However, existing fuzzy models for decision support in sustainable product and process design and strategic enterprise planning cannot be directly adopted for operative production planning, which is a focus of this paper. These models consider variables that are not applicable for operative planning. The developed fuzzy models analyze variables considering, for example, ergonomic design of workplaces and design of renewable energy plants, which affect the production system in the long term. For operative sustainable production planning, the model must consider variables that analyze the production system in the short term (e.g., day-to-day schedule), such as accumulated physical stress on the worker and renewable energy availability. Moreover, the developed inference engines are applicable for specific products and processes only. Operative production planning needs flexible and generic inference engines that can be easily adapted for different production situations producing different amounts and kinds of products [39]. Another problem is that existing approaches for sustainable production planning consider single sustainability aspects only. A decision-making process needs to be developed that is applicable independently of the nature of the variable accessing the state of sustainability.

Table 1.
Existing approaches for the evaluation of systems according to sustainability aspects.
| Reference | Goal of the Model | Target System | Input Variables (Membership Function) | Aggregation | Defuzzification |
|---|---|---|---|---|---|
| [36] | Ranking of relevant sustainability issues for strategic decision-making | Enterprise |
|
| Centroid defuzzification |
| [35] | Corporate sustainability evaluation of an enterprise | Enterprise |
|
| Centroid defuzzification |
| [40] | Ranking of GRI indicators for sustainability reporting | Enterprise |
|
| |
| [37] | Social performance of an enterprise | Enterprise |
|
| Average score |
| [41] | Corporate sustainability evaluation of an enterprise | Enterprise |
|
| Height method |
| [13] | Sustainable evaluation of a chemical plant | Enterprise |
|
| Score |
| [31] | Sustainability evaluation of renewable energy plants | Production |
|
| Singleton defuzzification |
| [33] | Sustainable electrical power generation | Production |
|
| Centroid defuzzification |
| [42] | Production planning of an assembly line | Production |
|
| Genetic algorithm to maximize aggregated value |
| [34] | Ranking of pavement options | Products |
|
| |
| [32] | Sustainable product design | Product |
|
| Weighted score |
3. General Scope of the Fuzzy Inference Model Evaluating Production Programs According to Sustainability Aspects
The definition of the scope is an essential element of sustainability assessment procedures. The scope includes a description of the system boundaries, relevant processes, and corresponding input and output flows [43]. Figure 1 presents the generally applicable presentation of the system boundaries (red dashed line) of a production system for production planning.
The production system contains different processes (containers) and input and output flows (arrows) that differ depending on the manufactured products and company philosophy for sustainable manufacturing. As mentioned above, production planning aims to achieve a set of production (output) goals by securing the operation of the production. In general, the following key process categories exist to secure the basic operation of the production system [22]:
- The production process converts production inputs (raw materials, energy, workforce, and information) into production outputs (products, by-products, emissions) with the required quality, safety, and timeliness.
- The inventory process coordinates, directs, controls, and tracks inventory and resources (material and energy) movements within the production system.
- The maintenance process maintains the equipment and tools to secure their availability for production processes and to ensure scheduling for periodic or preventive maintenance.
- The quality process coordinates, directs, and tracks the processes that test materials and equipment to measure and verify quality measures.
However, the presented FIM for sustainable production planning is focused on the production processes. Inventory, maintenance, and quality processes are not considered for the FIM in this paper because further research is required to implement these processes in the FIM for the sustainability assessment. The presented production process needs to be extended by processes enabling sustainable production.
The following sub-production processes are relevant for sustainable production planning [7]:
- The on-site generation of energy process provides energy to the production process. The energy can be generated by, e.g., renewable energy plants, heating boilers, and energy recovery systems.
- The water and material reuse process returns effluent and used materials in the production process, so long as the effluent and used materials still have an acceptable quality level.
- The product refurbishment process returns products from the customer in the production system. The product is repaired, cleaned, and sold as a second-hand product to customers.
- The product remanufacturing process returns products from the customer in the production system, too. The product is dismantled, repaired, cleaned, and sold as a new product to customers.
However, the presented FIM for sustainable production planning is focused on the on-site generation and recovery of (renewable) energy and reuse of materials (see also green marked processes and flows in Figure 1). Product refurbishment and remanufacturing are not considered for the FIM in this paper because further research is required to implement these processes in the FIM for the sustainability assessment.
4. General Procedure and Mathematical Formulation of the Fuzzy Inference Model
Based on the general model scope, the following general procedure has been followed to develop the FIM:
- 1.
- Selection of suitable variables for sustainable production planning,
- 4.
- Definition of membership function for the fuzzification process,
- 5.
- Selection of a rules engine and suitable fuzzy operator,
- 6.
- Definition of a function for the defuzzification process, and
- 7.
- Decision-making procedure for sustainable production planning.
The author expects readers of this paper are working in the scientific field of production planning and sustainability assessment. Therefore, the following subsections describe the procedure steps in a deductive methodology. First, general information is given about the fuzzy set theory. Second, the fuzzy model’s mathematical formation is presented to evaluate production programs according to sustainability aspects. Third, examples are presented to explain the mathematical formulation.
4.1. Selection of Suitable Variables for Sustainable Production Planning
The formulation of the FIM requires a selection of suitable variables for sustainable production planning. The selection of suitable variables is an individual process that depends on the goal for production and sustainability (see Section 2.1), and the model scope (see Section 3). As mentioned above, sustainable production planning aims to achieve a set of production (output) goals by securing the operation of the production and achieving a set of sustainability goals avoiding economic losses, environmental damage, and social issues. Based on this main goal, Figure 2 presents the general framework of sub-goals and variables for sustainable production planning.
The framework consists of two main categories of goals and variables required for the FIM. First, the FIM considers one or multiple conventional production planning goals. These goals need to be fully achieved (f = 1) to secure the production’s operation. Second, the FIM aims to identify the potential to improve a production program according to sustainability aspects. The potential is determined using a fuzzy model, which expresses production programs’ sustainability as a number between one (µP = 1: high potential to improve sustainability) and zero (µP = 0: low potential to improve sustainability).
The potential is determined by multiple sets of variables consisting of two groups of variables targeting the:
- State of Sustainability (µS) considering economic, social, and environmental aspects of the production system, and
- Flexibility (µF) to implement a defined change of state in a production system through, e.g., shifting the start of production activities, interrupting production activities, using alternative resources for activities, adjusting the process parameter.
Based on this framework, a literature review was performed to create a general list of goals and variables that have already been used for sustainable production planning. Several recently published reviews (2015–2020) have been found for sustainable production planning that have been used to develop the list. These reviews consider sustainability from a fragmented perspective, neglecting at least one sustainability aspect (see Table 2).
Therefore, an analysis of the presented studies in the found reviews has been performed to compile a comprehensive list of sustainable production planning goals and variables considering the economic, environmental, and social sustainability.
For this approach, the following criteria have been used to identify relevant studies:
- Publication date must be between 2000 and 2020.
- Publication must be available in the usual databases (e.g., Science Direct, Scopus).
- The study must consider at least one sustainability aspect of machine scheduling for the manufacturing industry sector. Studies that consider only conventional production planning goals (e.g., reduction of makespan) are not considered.
- Approaches considering product- or machine-related planning problems (e.g., cutting-stock, single machine energy efficiency) are not considered.
Table 3 presents the literature review results for classical production goals and variables. These goals and variables aim to produce a product in a minimal time (makespan) or produce a specific production output. At least one of the presented classical goals and variables has usually been used in sustainable production planning models.
Table 4 presents the literature review results for sustainable production goals and variables. At least one of the presented sustainable goals and variables has usually been combined with classical production goals in sustainable production planning models. However, it is not useful to integrate all presented sustainable goals and variables in a single model. The variables need to be independent of each other, avoiding double-counting sustainability benefits and impacts. For example, the planning goal “reduction of energy costs” can be achieved by reducing the total energy demand [46]. Nevertheless, a reduction of the total energy demand also reduces greenhouse gas (GHG) emissions. Therefore, an additional goal for GHG emissions that also considers the variable total energy demand makes no sense. Another reason is that integrating all presented sustainable goals and variables leads to a highly complex model, which leads to high computational efforts in handling the model.
Finally, Table 5 presents the literature review results for variables considering production flexibility that have been considered to improve production systems sustainability. In general, production flexibility indicates the production system’s ability to adapt to planning goals [47]. However, flexibility variables can be divided into partial flexibilities to describe a production system’s flexibility more accurately [48]. These partial flexibilities can be used for production planning to improve sustainability aspects. Moreover, production flexibility depends on the production process type (job shop, batch, or flow production). Job shop production systems offer the highest flexibility, while flow production systems offer the lowest flexibility [49].
The authors defined the following general criteria to support developers in selecting relevant variables for sustainable production planning in a previous study [50]:
- The variable must be relevant regarding sustainable manufacturing for the considered production system and set system boundaries (model scope).
- The variable for sustainability must be improvable through actions for production planning (e.g., shifting or interrupting of production activities, change of resource types), which is determined by variables for flexibility.
- The variables must be independent of each other. Double counting of benefits or impacts (e.g., decrease in energy consumption, decrease in energy costs, as well as GHG emissions) must be avoided.
- Data must be available and accessible for the selected variables considering production inputs and outputs.
4.2. Fuzzification of the Variables
If suitable goals and variables have been selected for sustainable production planning, the three-step fuzzy model starts (see Section 2.2). For this approach, first, the selected variables need to be fuzzified. In general, the fuzzification process transforms crisp values of the variables (x) into a unitless fuzzy value (µx) with the aid of fuzzy sets. A fuzzy set is used to interpret a selected variable linguistically, e.g., sustainability is low, medium, or high. A fuzzy set is mathematically formulated, where each element of the variable is mapped to a value between zero and one using a membership function [15]. Figure 3 presents an example presentation and mathematical formulation of a triangle membership function. The x-axis represents the selected variable (x), whereas the y-axis represents the fuzzy value (µx) in the [0,1] interval. Similar membership functions exist presenting linear and trapezoidal shapes [51].
Variables for sustainable manufacturing originate in a variety of scales and units. Lower values mean better sustainability performance for some variables but worse sustainability for others. For example, sustainability improves when waste generation decreases, but weakens when renewable energy demand decreases [14]. Therefore, the membership function must be carefully selected regarding the considered goal and the variable’s nature for sustainability and flexibility [13]. In general, there are two methods for the selection of fuzzy sets and their mathematical expression [13]:
- The subjective approach relies on the collection of experience and knowledge from experts in the area of study, where experimental data are incomplete and imprecise (e.g., determination of warm and cold room temperatures).
- The data-driven approach clusters experimental data into subregions that can be linguistically interpreted as, e.g., low and high. Common data-driven methods are data clustering, machine learning, benchmarks, statistical analyses, mathematical models, and simulations.
Sustainability is a vague concept for which assessments always need expert knowledge to determine the sustainability state [52], while production planning is a data-driven approach and requires information and communication technologies [23]. Therefore, a combination of data-driven and subjective approaches is required for sustainable production planning because experts must combine the results of, e.g., data clustering algorithms with knowledge about sustainable production, e.g., knowledge of green and safe working environments.
The proposed fuzzy model uses fuzzy sets that analyze variables between the most desirable and the least desirable values to normalize the variables. According to the goal and variables’ description and meaning, the fuzzy set shape must be carefully selected for each variable. The following three examples are given for the nature of the goals and variables, and the suitable fuzzy set shape:
- For variables that aim to minimize or constrain sustainability impacts (e.g., GHG emissions, production costs), the linear membership function seems most appropriate. For this membership function, the upper limit x1 and lower limit x2 need to be defined for the selected variables. The range between x1 and x2 presents the potential to minimize or constrain sustainability impacts.
- For variables that aim to balance a variable at a specific value (e.g., peak power), the triangle membership function seems most appropriate. For this membership function, the upper limit x2 and lower limits x1 and x3 need to be defined for the selected variables. The range between x1 and x3 presents the potential to minimize or constrain sustainability impacts.
- For variables that aim to balance a variable at a specific range (e.g., recovery time), the trapezoidal membership function seems most appropriate. For this membership function, the upper limits x2 and x3 and lower limits x1 and x4 need to be defined for the selected variables. The range between x1 and x2, and x3 and x4 presents the potential to minimize or constrain sustainability impacts.
4.3. Aggregation of the Fuzzy Values
In the second step of the fuzzy model, the fuzzy values need to be aggregated. In general, the aggregation process combines fuzzy values using rules and fuzzy operators [15]. For this approach, two general fuzzy rule inference engines exist [53]:
- For the individual rule inference engine, the rules are defined individually for a single variable and defined fuzzy sets (e.g., low, medium, high). The number of rules rises exponentially with the number of selected variables and defined fuzzy sets.
- For the composition rule inference engine, the fuzzy set rules are aggregated in one fuzzy membership function for a single variable. Therefore, the number of rules is equal to the number of variables.
Individual rule inference engines are widely used for machine control automatization problems (fuzzy control) because the rules can be set for non-linear process parameters independently. However, individual rule inference engines´ complexity increases with the number of selected variables and defined fuzzy sets. The FIM for sustainable production planning should be easily adaptable for new production situations. Therefore, a composition rule inference engine is applied for the FIM.
Next, an aggregation operator must be selected to combine multiple fuzzy inputs. In general, three types of fuzzy operators exist for the aggregation process [53]: intersect operator (t-Norm), union operator (s-Norm), and average operator. Additionally, parametric operators exist, and multiple fuzzy operators can be combined to form a custom fuzzy operator. However, parametric operators are not considered in this paper. The fuzzy operators have linguistically degrading or linguistically reinforcing effects on the model outcome [53]. The fuzzy operator is crucial in interpreting the FIM results and needs to be selected by experts according to the model’s goal.
Based on the model´s framework for sustainability variables (Figure 2), the aggregation process consists of two steps for the presented FIM:
- The single sustainability potential is determined by combining the variable for the state of sustainability and flexibility.
- The fuzzy values for multiple sustainability potentials are combined to determine the overall sustainability potential to improve the production program.
The expected fuzzy output must be known for both steps related to the fuzzy input identifying the applicable fuzzy operator. Therefore, a heatmap has been developed to present the expected output for combining the state of sustainability and flexibility (see Figure 4).
The heatmap is clustered in three colored areas representing different expected fuzzy outputs for the sustainability potential to improve production programs (µP). The colored areas arise from the combination of the variables for the state of sustainability (x-axis) and flexibility (y-axis). Based on the combination, the following rules can be arrived at for the expected output:
- IF [State of Sustainability] is High THEN [Potential] is Low (µP → 0).
- IF [State of Sustainability] is Low AND [Flexibility] is High THEN [Potential] is High (µP → 1).
- IF [State of Sustainability] is Low AND [Flexibility] is Low THEN Potential Medium (µP → 0.5).
Moreover, four transition zones exist between the three main areas. These areas describe the sustainability potential between low, medium, and high:
- 4.1.
- IF [State of Sustainability] is Low AND [Flexibility] is Medium THEN [Potential] is High-Medium.
- 4.2.
- IF [State of Sustainability] is Medium AND [Flexibility] is High THEN [Potential] is Medium-Low.
- 4.3.
- IF [State of Sustainability] is Medium AND [Flexibility] is Medium THEN [Potential] is Medium.
- 4.4.
- IF [State of Sustainability] is Medium AND [Flexibility] is Low THEN [Potential] is Medium-Low.
Based on the defined fuzzy output, common fuzzy operators are tested, combining values for the state of sustainability (µS) and flexibility (µF). The results are presented as a heatmap as well, to visually compare them with the expected results (see Appendix A). The comparison shows that common fuzzy operators meet the expected results partially for the FIM, only. Therefore, a custom fuzzy operator has been derived that represents the expected outcome for the FIM. For this approach, the following assumptions have been made to select and combine suitable fuzzy operators.
If the state of sustainability is high, the potential is low. Therefore, the complement of the variable () state of sustainability must be calculated (see Equation (1)).
If the state of sustainability is high, no actions are necessary to improve the production program’s sustainability. In this case, the flexibility variable can be ignored. Therefore, an intersect operator () needs to be selected to combine the complement of the state of sustainability and flexibility (see Equation (2)).
If the state of sustainability is low and flexibility is low, actions are necessary to improve the production program’s flexibility. Therefore, an average operator () needs to be selected to combine the complement of the state of sustainability and the intersect of the complement of the state of sustainability and flexibility (see Equation (3)).
Based on these assumptions, Equation (4) presents the custom fuzzy operator to determine the sustainability potential ().
Figure 5 presents the heatmap combining the values for the state of sustainability and flexibility using the custom operator. The comparison of the expected results (see Figure 4) shows that the custom fuzzy operators meet the expected results.
Next, the fuzzy operator needs to be identified to combine multiple variables for the overall potential to improve the production program. This operator is derived from the definition of sustainable production planning (see Section 2.1). According to the definition, all production and sustainability goals need to be achieved. Therefore, a union operator is selected because the union operators have a linguistically reinforcing effect that corresponds to the highest fuzzy value (see Equation (5)). The highest fuzzy value indicates the highest potential to improve the production program, which can be used by the production planner.
Moreover, the sustainability potential fuzzy value needs to be combined with the production goal value. The production goal is a crisp value that describes the production goal as achieved (one) or not achieved (zero). Therefore, the sustainability goal fuzzy value is multiplied by the production goal value to determine the fuzzy model outcome (see Equation (6)).
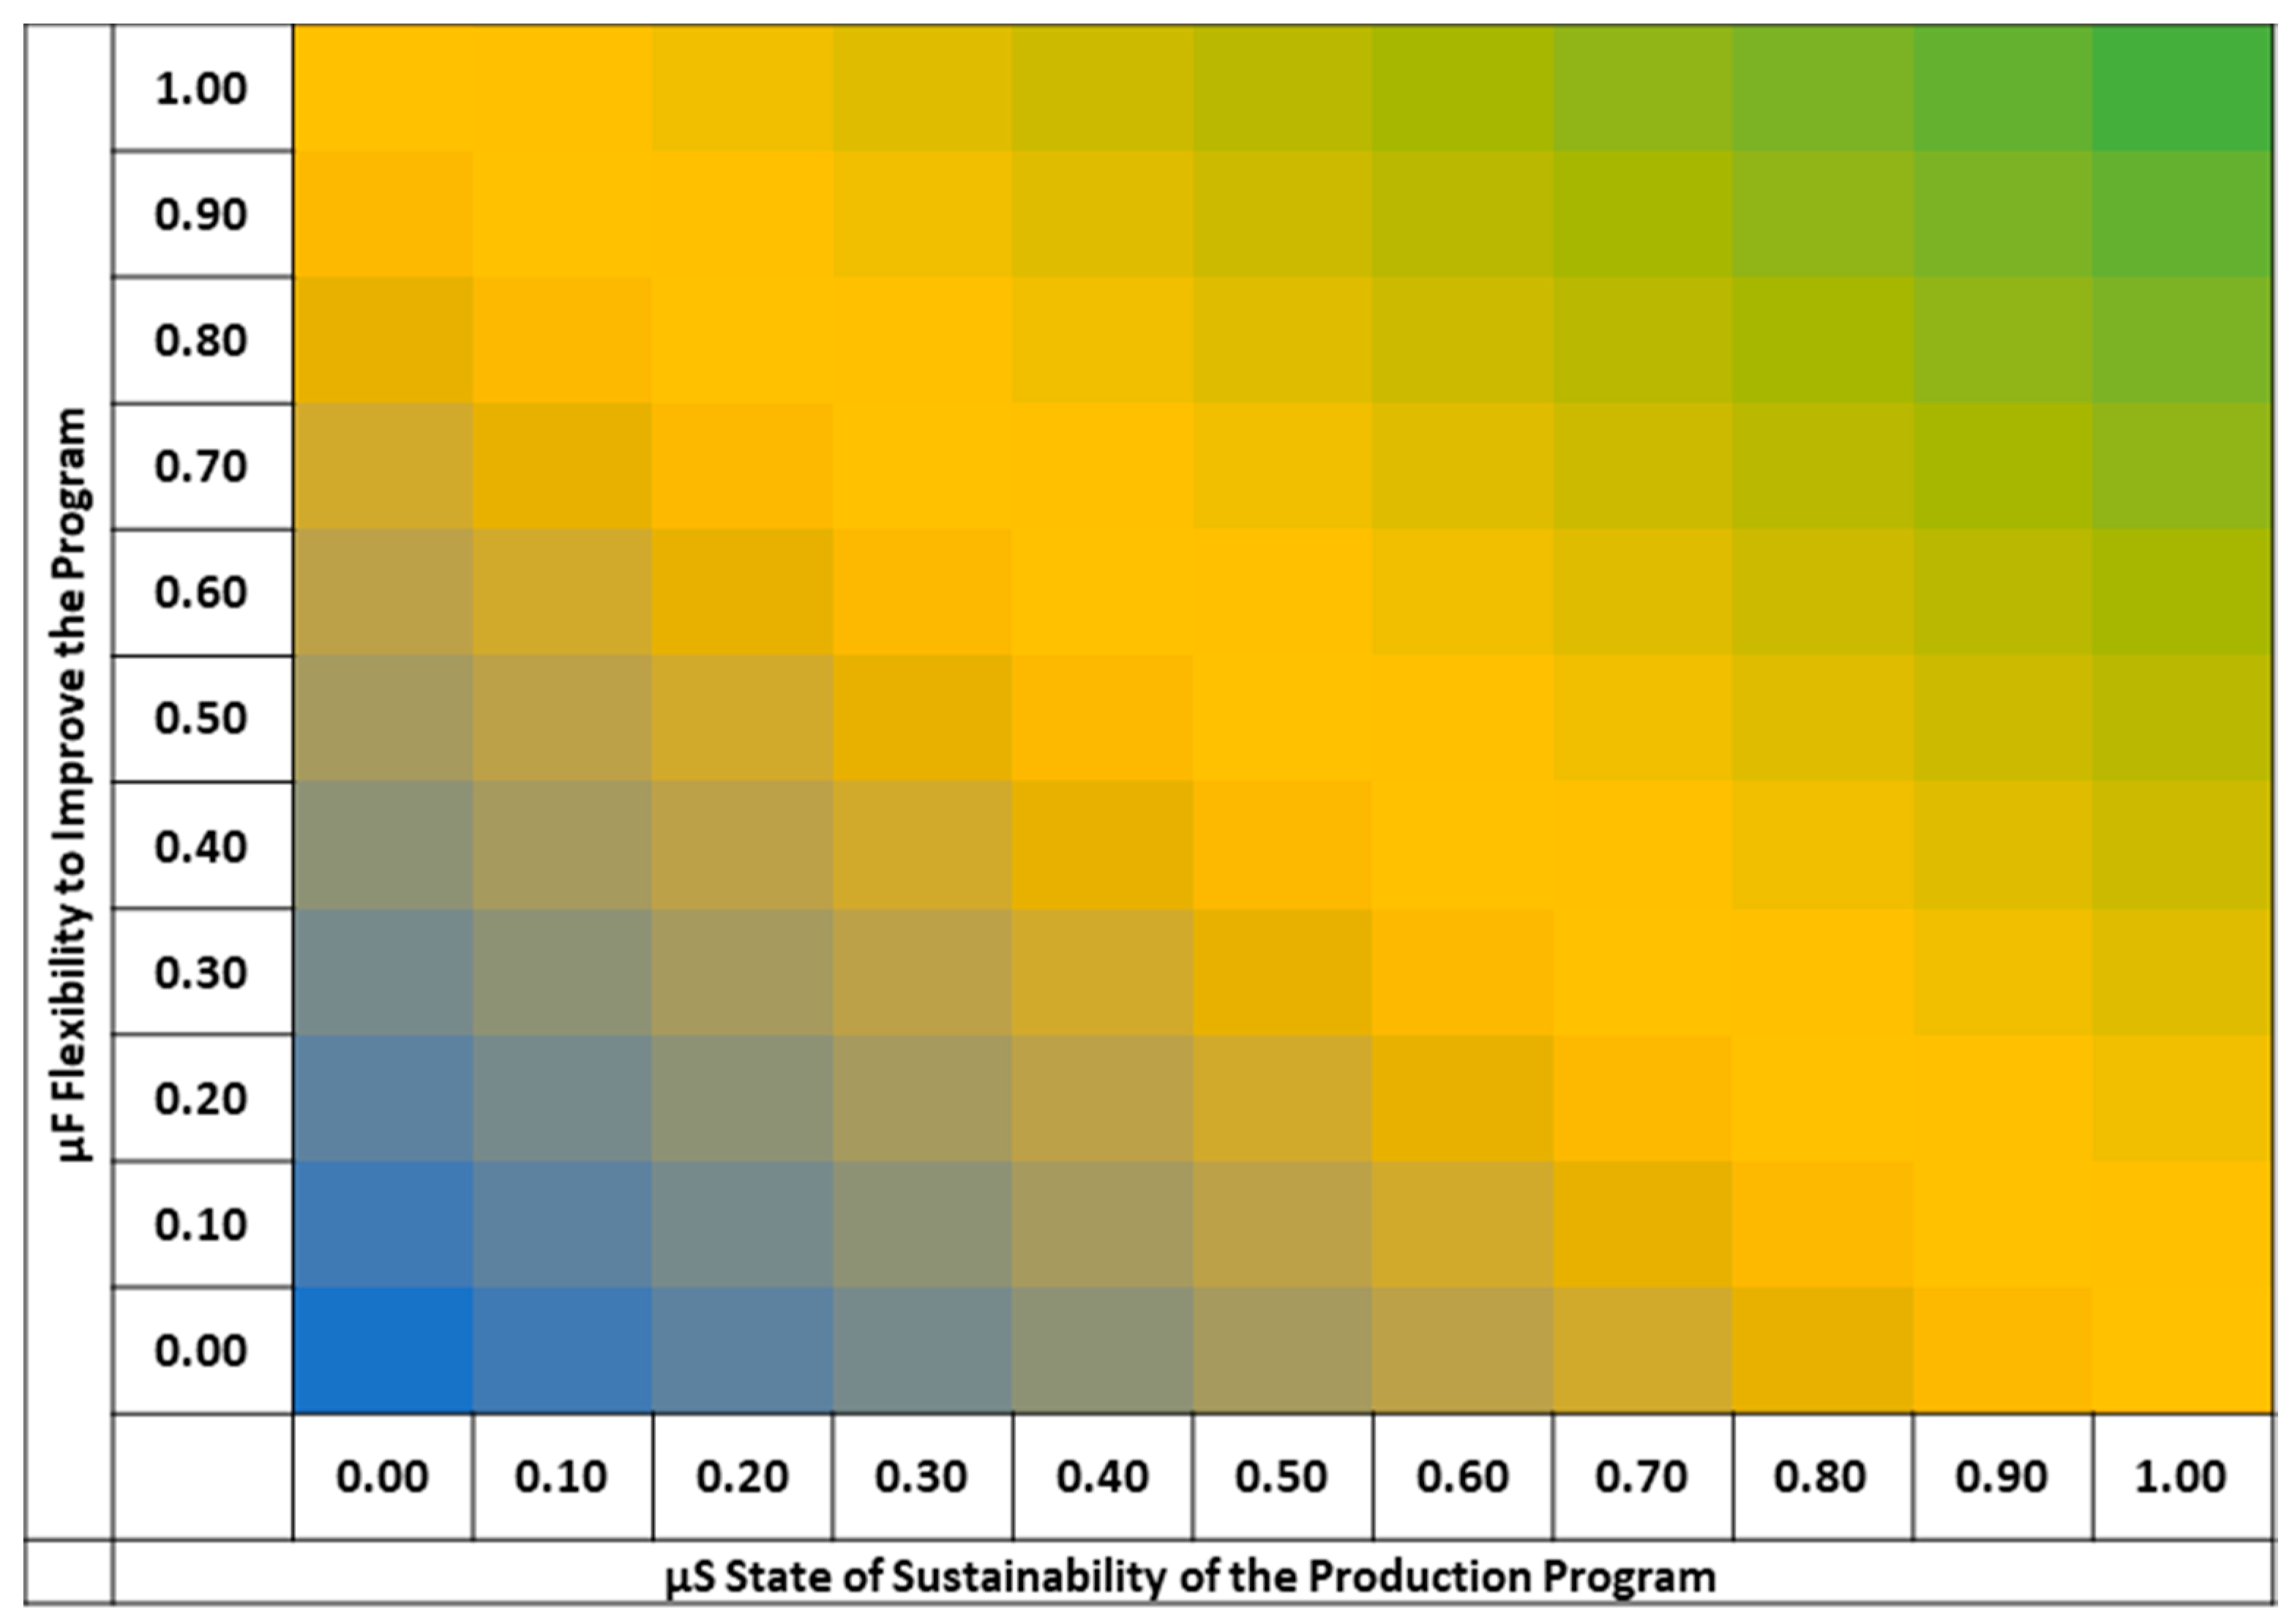
4.4. Defuzzification of the Aggregated Fuzzy Values
In the third step of the fuzzy model, the aggregated fuzzy values are defuzzified. In general, the defuzzification process converts the single fuzzy value back to a crisp value using a function [15]. For this approach, several methods exists [51], e.g., centroid methods, average methods, max membership methods. The height method has been applied for the FIM. This method define a output function to determine the model outcome. For the FIM outcome, three potential states have been defined to interpret the aggregated fuzzy value: Low, Medium, and High. The number of states is arrived at according to expected aggregation output (see Section 4.3). The states have the following meanings and possible ranges:
- Low potential state indicates a high state of sustainability.
- ◦
- Therefore, no more action is required to change the production program.
- ◦
- The range should be as close as required to zero because higher values decrease the planning effort to reach a low sustainability state.
- High potential state indicates a low or medium state of sustainability and high production flexibility.
- ◦
- Therefore, the production program can be adjusted to improve the sustainability.
- ◦
- According to the expected model outcome, the range should be started between 0.55 and 0.75 (see Figure 5).
- Medium potential state indicates a low or medium state of sustainability and low production flexibility.
- ◦
- The production must be adjusted to increase the flexibility.
- ◦
- The range is between low and high potential to improve the production program.
The nature of the functions affects the decision behavior of the model. Figure 6 presents one possible function for the defuzzification process using the height method. The presented function is used for the case study testing the FIM, too. However, the ranges to determine the sustainability state of production programs need to be selected by experts carefully, according to the model’s scope.
4.5. Decision-Making Procedure for Sustainable Production Planning
Finally, the results of the fuzzy model need to be interpreted. For this approach, Figure 7 presents a decision tree analyzing the FIM outcome for sustainable production planning. The decision-making process starts with assessing the sustainability potential according to selected variables and using the FIM. The assessment results are controlled in the following two steps:
- The production goal is controlled:
- ◦
- If the production goal is not achieved (f = 0), the production goal variable needs to be adjusted, and the sustainability assessment is repeated.
- ◦
- If the production goal is achieved, no action is required.
- The sustainability potentials are controlled:
- ◦
- If the sustainability potential is medium or high, the sustainability goal variable needs to be adjusted. For this approach, the sustainability variables are ranked according to their sustainability potential identifying the highest sustainability potential. The related variables need to be further controlled:
- ▪
- If the flexibility variable is low (µF = Low), the flexibility variable needs to be adjusted, and the sustainability assessment is repeated.
- ▪
- If the flexibility variable is medium or high (µF = Low, µF = Medium), the sustainability variable needs to be adjusted, and the sustainability assessment is repeated.
- ◦
- If all production goals are achieved, and the sustainability potential is low, no action is required, and the decision process is finished.
The following general recommendations can typically be given to adjust the production program depending on the FIM outcome:
- Shift specific production activities.
- Interrupt production activities.
- Turn machines off or on.
- Increase the capacity of machines/human workforce.
- Use machines with lower resource demand.
- Use resources with lower sustainability impact.
- Exchange employees for specific production activities.
5. Single Case Analysis of the Fuzzy Inference Model
The single case study aims to test and demonstrate the developed FIM for sustainable production planning. The FIM is tested using different test scenarios. For this approach, the FIM was implemented in a simulation model of the Learning Factory 4.0 [19]. The following methodology is used to perform the case study:
- Definition of the single case studies scope,
- Collection of required data for test scenarios (inventory analysis), and
- Presentation of test scenario results.
5.1. Scope Definition of the Case Study
The case study is performed using an simulation model of the Learning Factory 4.0. In general, the learning factory has been developed in the production-planning lab of the University of Applied Life Sciences Emden/Leer and demonstrates a job shop production system [19]. The physical production system consists of the following typical production stations: a warehouse, four working stations, two transport systems, and a quality control station (see Figure 8a). Moreover, the learning factory is digitally represented in an enterprise resource management (ERP) system to plan and control production activities conventionally. Additionally, the simulation model contains the following processes enabling sustainable production (see Figure 8b): an energy supply system (renewable energy plant and energy supplier) and an additional production process to dispose of or reuse materials for the production process. The production outputs are colored wooden blocks (white, red, and blue). The colored wooden blocks are transported in carriers through the production system. The products have individual production sequences and energy demands.
Figure 9 presents the system boundaries of the production system for the case study. The enterprise system contains four functional units, including input and output flows, which are relevant for sustainable production planning:
The production system transforms materials and energy into finished products. The transformation process is fully automatic and requires no workforce. The production manager can individually set the production output for the three kinds of products.
A renewable energy plant produces renewable energy for the production process. The renewable energy generation depends on weather conditions and cannot be controlled. This leads to the following cases:
- If the renewable energy generation is higher than the energy demand, renewable energy can be sold to other companies.
- If the renewable energy generation is lower than the energy demand, conventional energy is purchased by an external energy supplier, which causes higher energy costs and indirect GHG emissions. Therefore, the demand for renewable energy should always be preferred in the production process.
The carrier disposal and reuse process represents a typical process in circular economies [7] and transforms the used carrier from the production process into a reused carrier for the material preparation process. Not all carriers can be reused for the material preparation process, and external carriers need to be purchased. For this approach, two opportunities exist:
- Reused carriers can be purchased from other companies, which causes higher material costs only.
- If reused carriers from other companies are not available, new carriers are purchased from an external supplier, which causes higher material costs and impacts natural resources. Therefore, internal or external reused carriers should always be preferred for material preparation.
The material preparation transforms new colored wooden blocks and carriers into material for the production process. The material preparation is manual work and causes physical stress on the worker. The physical work stress is modeled and evaluated according to data and knowledge from the reference [54].
The following goals and variables for the FIM are defined based on the functional units’ descriptions (see Table 6).
5.2. Definition of the Fuzzy Sets for the Case Study
Based on the case study scope, data needs to be collected for the selected variables to define the fuzzy sets and to test the FIM. For this approach, the following basic production data have been collected and analyzed: maximal production output, lead time, energy demand, and workload.
Based on these data, the following reference production scenarios simulating the Learning Factory 4.0 have been defined:
- Only White Product
- Only Red Product
- Only Blue Product
- Equal Product Mix (White/Red/Blue)
In these reference scenarios, the production system’s maximal capacity for single products (only white, red, and blue) and an equal product mix is simulated for one hour of production time. Appendix B presents the relevant basic data about the production process.
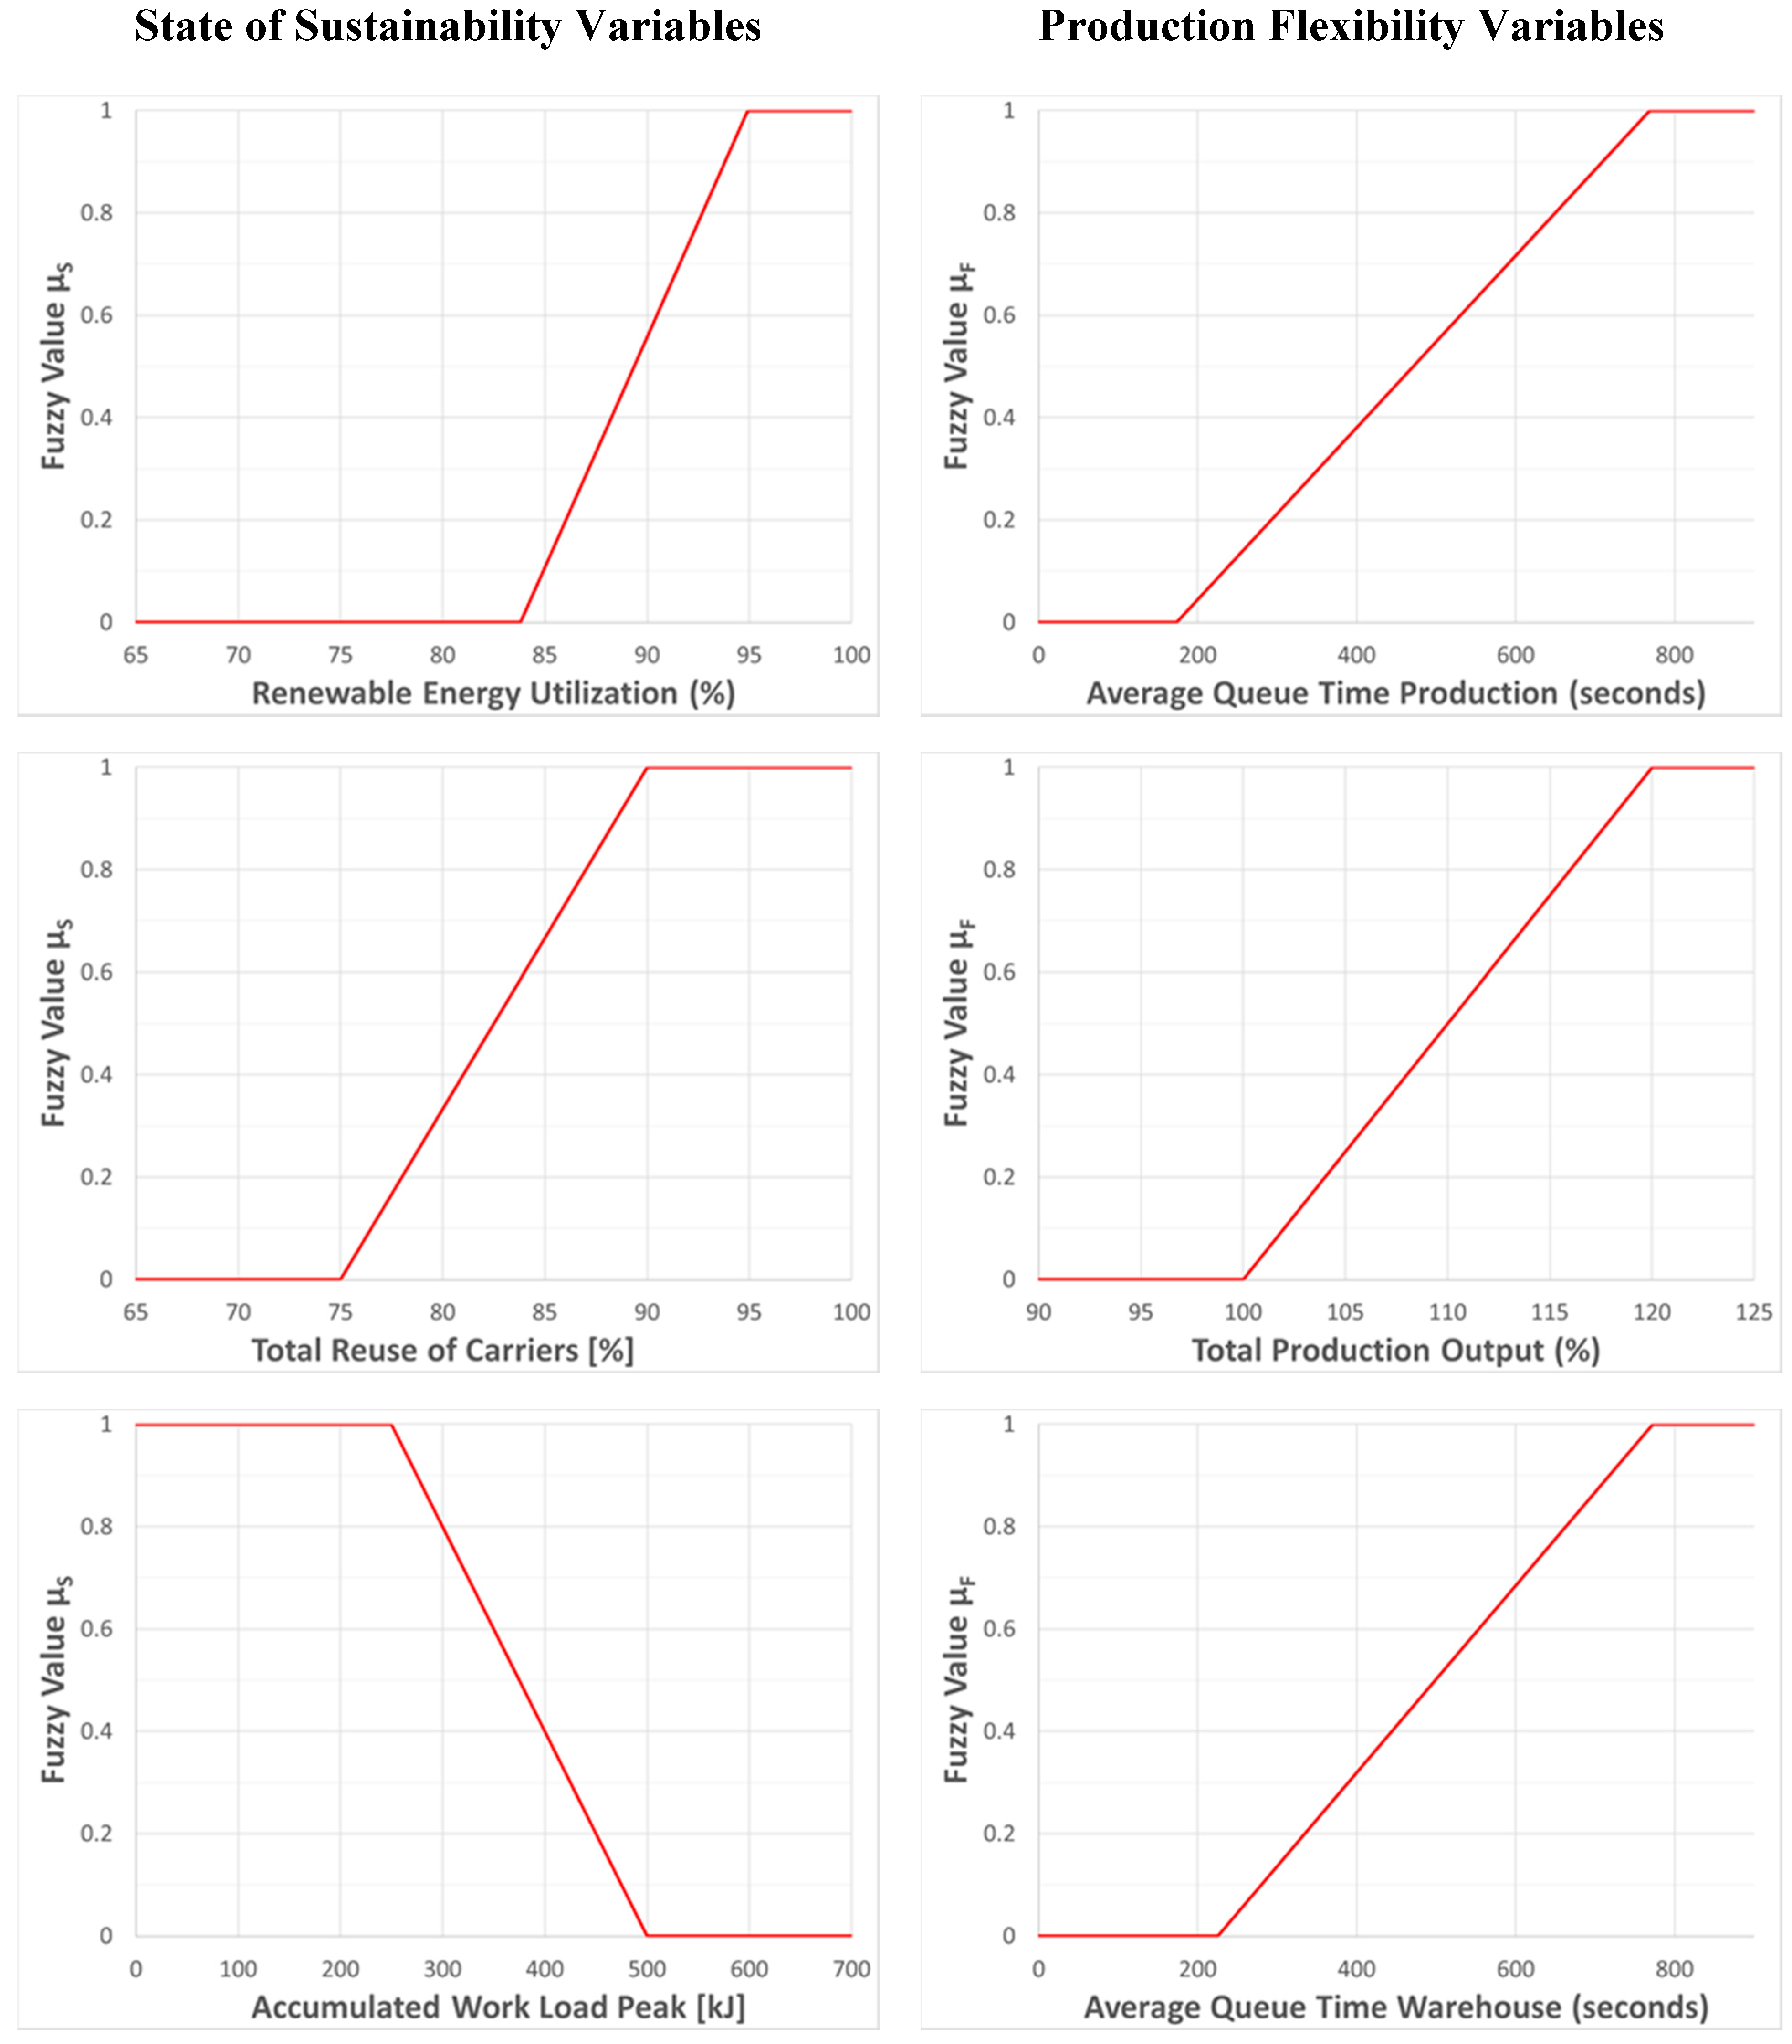
With the aid of the reference scenarios, data are collected and analyzed to define the fuzzy sets. As mentioned in Section 4.2, fuzzy sets analyze variables between the most desirable and the least desirable values using membership functions to determine the state of sustainability and production flexibility. For this approach, Table 7 presents the shape of the membership functions, description of the fuzzy set values, fuzzy set values for the case study, and data source and method to determine the fuzzy set ranges. The resulting fuzzy sets are presented in Appendix C for the case study. However, the procedure to develop a fuzzy set using sensitive analysis is exemplarily presented for the variable renewable energy utilization.
In general, the renewable energy utilization is calculated through the quotient of the renewable energy demand and energy generation (see Equation (7)).
If the total energy demand of the production system is lower than the renewable generation, the calculation of the renewable energy utilization needs to be adjusted as follows (see Equation (8)):
The renewable energy generation depends on the renewable energy plant’s design and the weather conditions, which cannot be controlled. The renewable plant has a maximum net performance of 24 kW (assumption from the author). The energy demand depends on the production process and can be controlled through the production utilization. Based on these framework conditions, the following scenario parameters are set to determine the fuzzy set for the renewable energy utilization variable. The reference scenario product mix is simulated for one hour because it represents an average production of all products and uses the production system’s full capacity. The renewable energy generation varies between 9–24 kW. Based on these parameters, a sensitivity analysis has been performed to determine the low and high state of sustainability.
Figure 10 presents the results of the sensitivity analysis. In the low sustainability state, renewable energy utilization is as low as possible at 18 kW renewable energy generation. A decrease or increase in the renewable energy generation leads to higher renewable energy utilization in this scenario. The high sustainability state is set at 24 kW renewable generation because it provides optimal conditions for sustainability.
Figure 11 presents the resulting fuzzy set for the renewable utilization variable based on the defined low and high states of sustainability. With the aid of the fuzzy set, random conditions for the renewable energy generation and energy demand can be evaluated for sustainable production planning.
5.3. Presentation and Discussion of Test Scenario Results
The following section demonstrates the FIM outcome and decision-making procedure for sustainable production planning. For this approach, a dashboard has been developed to present model outcomes to the production planner (see Appendix D). The dashboard design follows human-centered design standards and is described in more detail in a previous study [55]. The FIM and decision-making process is demonstrated considering two production scenarios varying the production utilization:
- Low utilization (29%, 10 products/hour) of the production system producing a product mix.
- High utilization (94%, 32 products/hour) of the production system producing a product mix.
For this approach, the following simulation parameters are set affecting the sustainability state of the Learning Factory 4.0 simulation model:
- One production hour is simulated.
- The following production goals are set:
- ◦
- Low utilization production scenario: 10 products/hour
- ◦
- High utilization production scenario: 30 products/hour
- The net performance of the renewable energy generation is 15 kW.
- An external company provides ten external reused carriers for material preparation.
- The accumulated work stress starts at zero.
- The presented function Figure 6 is used for the defuzzification process.
- One iteration step is performed according to the decision-making procedure.
Table 8 presents the simulation results for the low utilization production scenario. The model outcome indicates a medium potential to improve the production program´s sustainability. Medium potential means that the set production goal has been achieved, the state of sustainability is low or medium, and the production flexibility is low. With the aid of the decision-making procedure (see Figure 7), the simulation model identifies the renewable energy utilization variable as the main reason. Due to less material in progress, the queue times are short at the resources, which leads to low production flexibility. Therefore, the simulation model recommended that the production planner increase the queue time at the resources, shifting production at the workstation and warehouse. The sustainability goals for the carrier reuse and workload already reached a low potential, and no actions are required. However, the considered production scenario offers the opportunity to provide non-reused carriers and consumed renewable energy to other companies. Based on the production plan, the information about time-related renewable energy availability and reused carriers can be provided to other companies for their production planning processes.
Table 9 presents the simulation results for the high utilization production scenario. The model outcome indicates a high potential to improve the production program´s sustainability. High potential means that the set production goal has been achieved, the state of sustainability is low or medium, and the production flexibility is high. With the aid of the decision-making procedure (see Figure 7), the simulation model identifies the carrier reuse variable as the main reason. Due to the high production output, the demand for carriers is high, which leads to a shortage of reused carriers. Therefore, the simulation model recommended that the production planner increase the carrier reuse process’s capacity and/or purchase more external reused carriers from other companies (if possible). The sustainability goals for the carrier reuse and workload are in a high and medium state, and further actions are required to improve the production plan´s sustainability.
6. Conclusions and Outlook
The paper presents a general mathematical formulation and a single case study of an FIM for sustainable production planning. The presented FIM can be easily adapted to different production situations considering multiple economic, environmental, and social variables. The model’s outcome indicates the most significant opportunities to improve production programs’ sustainability using experts’ knowledge. Moreover, the model results support decision-making in sustainable production planning processes considering the exchange and demand for materials and energy between production systems as well as other enterprises to close material and energy loops. The FIM and decision-making procedure is tested and demonstrated in a single case study using a simulation model from a lab Learning Factory 4.0 at the University of Applied Life Sciences Emden/Leer.
However, sustainable production planning is still a complex process, and several requirements and assumptions exist for the presented FIM. First, a running production planning system must already be implemented. The planning system must contain all basic information about the production processes to produce a specific production output, such as required production steps and resources (materials, labor, machines). Second, sustainability strategic enterprise planning needs to be already well implemented and performed. For example, investments must be made for additional production processes, enabling sustainable production, such as energy plants for the on-site renewable energy supply, processes for the reuse, recycling, or remanufacturing of materials and products, and ergonomic design of human workplaces. Third, digital infrastructure is required to collect and analyze production data for sustainable production planning purposes. Such a requirement implies well-implemented information and communication technologies and middleware solutions to share collected data between production management tools. However, the collection and analysis of data, information, and knowledge for sustainable production planning processes are complex and time-consuming. Therefore, the author suggests a focused procedure of applying detailed sustainable production planning. The implemented planning system should consider the most relevant sustainability aspects in the production system only, where the sustainability impact of decision-making is most beneficial. Finally, as the user of the model, the production scheduler needs experience in conventional production planning. Moreover, the production scheduler needs knowledge about the economic, social, and environmental consequences of improving the production program´s sustainability.
The presented FIM provides several opportunities for future work based on set assumptions and limitations. The FIM’s scope is focused on typical production and sustainability processes and neglects management processes for inventory, maintenance, quality control, and product refurbishment and remanufacturing. Additional research is required to implement these processes in the FIM for sustainable production planning, too. Next, the developed inference engine of the FIM uses equal weights of importance for the selected variables. A procedure can be developed to weigh variables according to their importance for production planning. Moreover, the case study is limited to a single case considering a lab learning factory representing a lab job shop production system. The case study needs to be extended to other cases considering different production systems (job shop, batch, flow production) and scenarios to test and validate the decision-model. Moreover, the case study needs to be scaled to industry cases and scopes for sustainable manufacturing to prove its practical use in an industrial environment. For this approach, the FIM should be implemented in a generic simulation environment (see, e.g., [56]), which can easily be adapted to new production scenarios.
Author Contributions
Conceptualization, M.Z.; methodology, M.Z.;. investigation, M.Z.; writing—original draft preparation, M.Z.; writing—review and editing, M.Z., A.P., I.L.N.; All authors have read and agreed to the published version of the manuscript.
Funding
This research received no external funding.
Institutional Review Board Statement
Not applicable.
Informed Consent Statement
Not applicable.
Data Availability Statement
Not applicable.
Conflicts of Interest
The authors declare no conflict of interest.
Appendix A
Figure A1.
Combination of values for the state of sustainability and flexibility using a union operator.
Figure A1.
Combination of values for the state of sustainability and flexibility using a union operator.
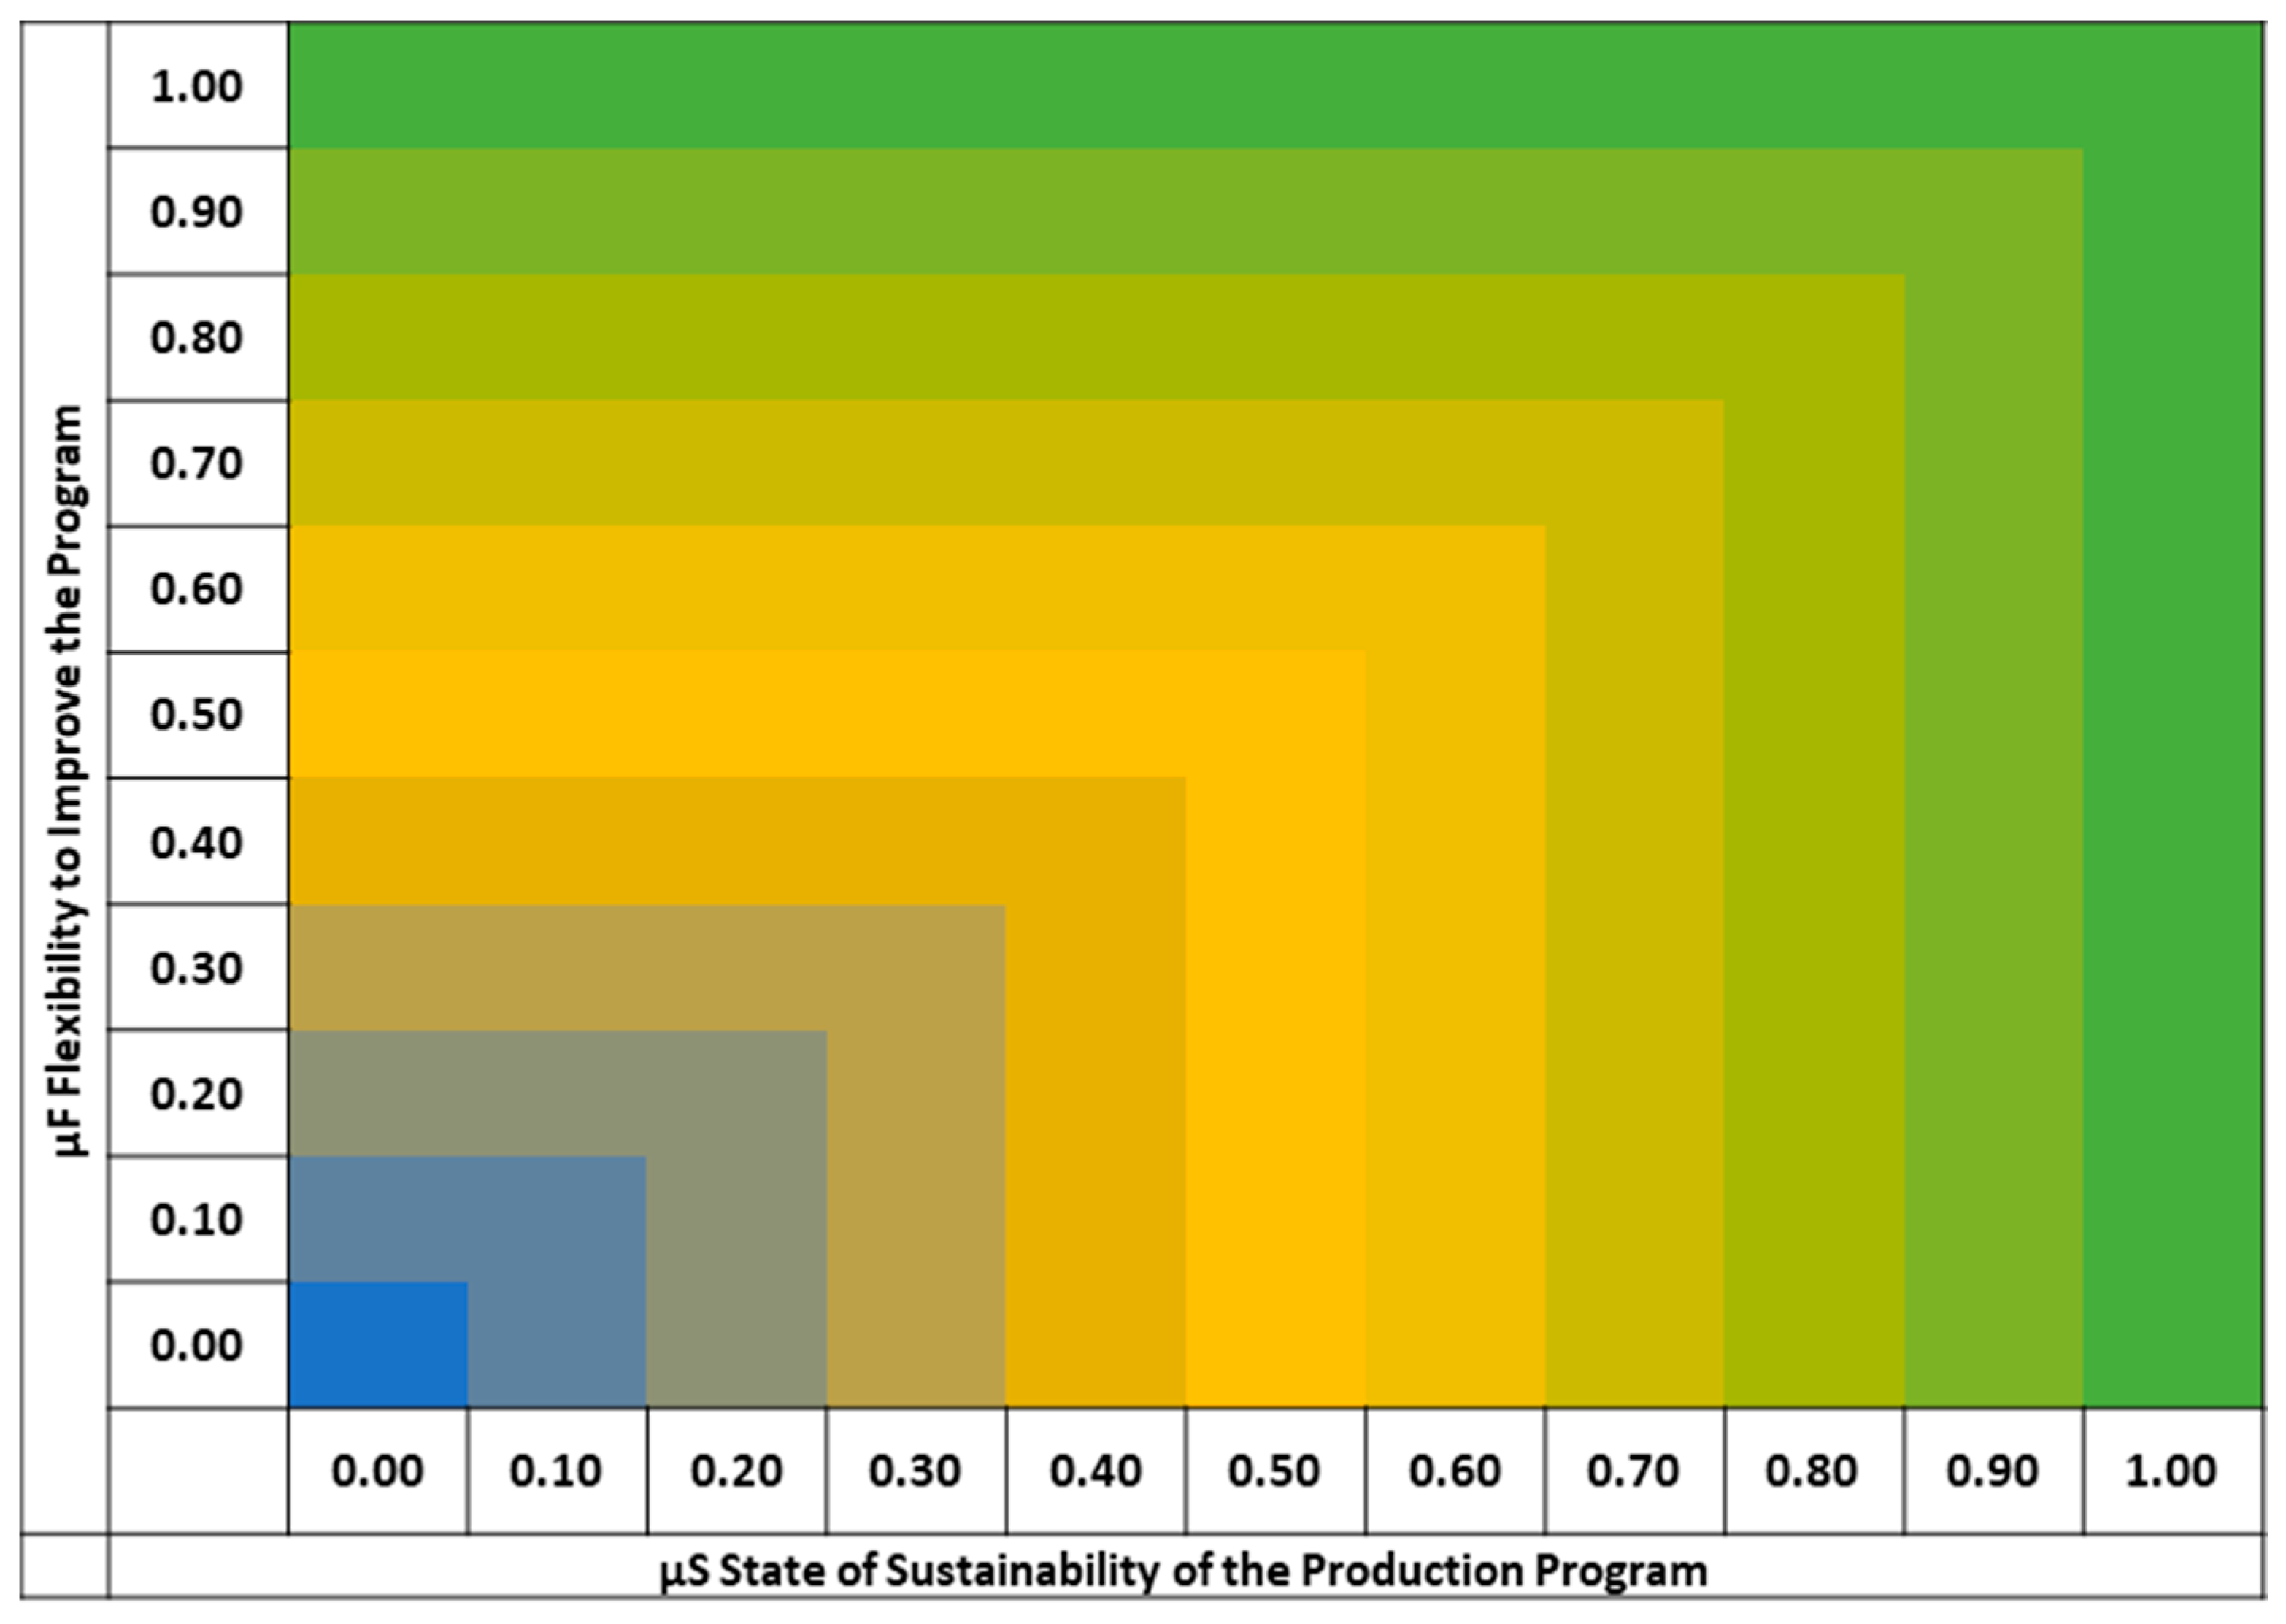
Figure A2.
Combination of values for the state of sustainability and flexibility using an intersect operator.
Figure A2.
Combination of values for the state of sustainability and flexibility using an intersect operator.
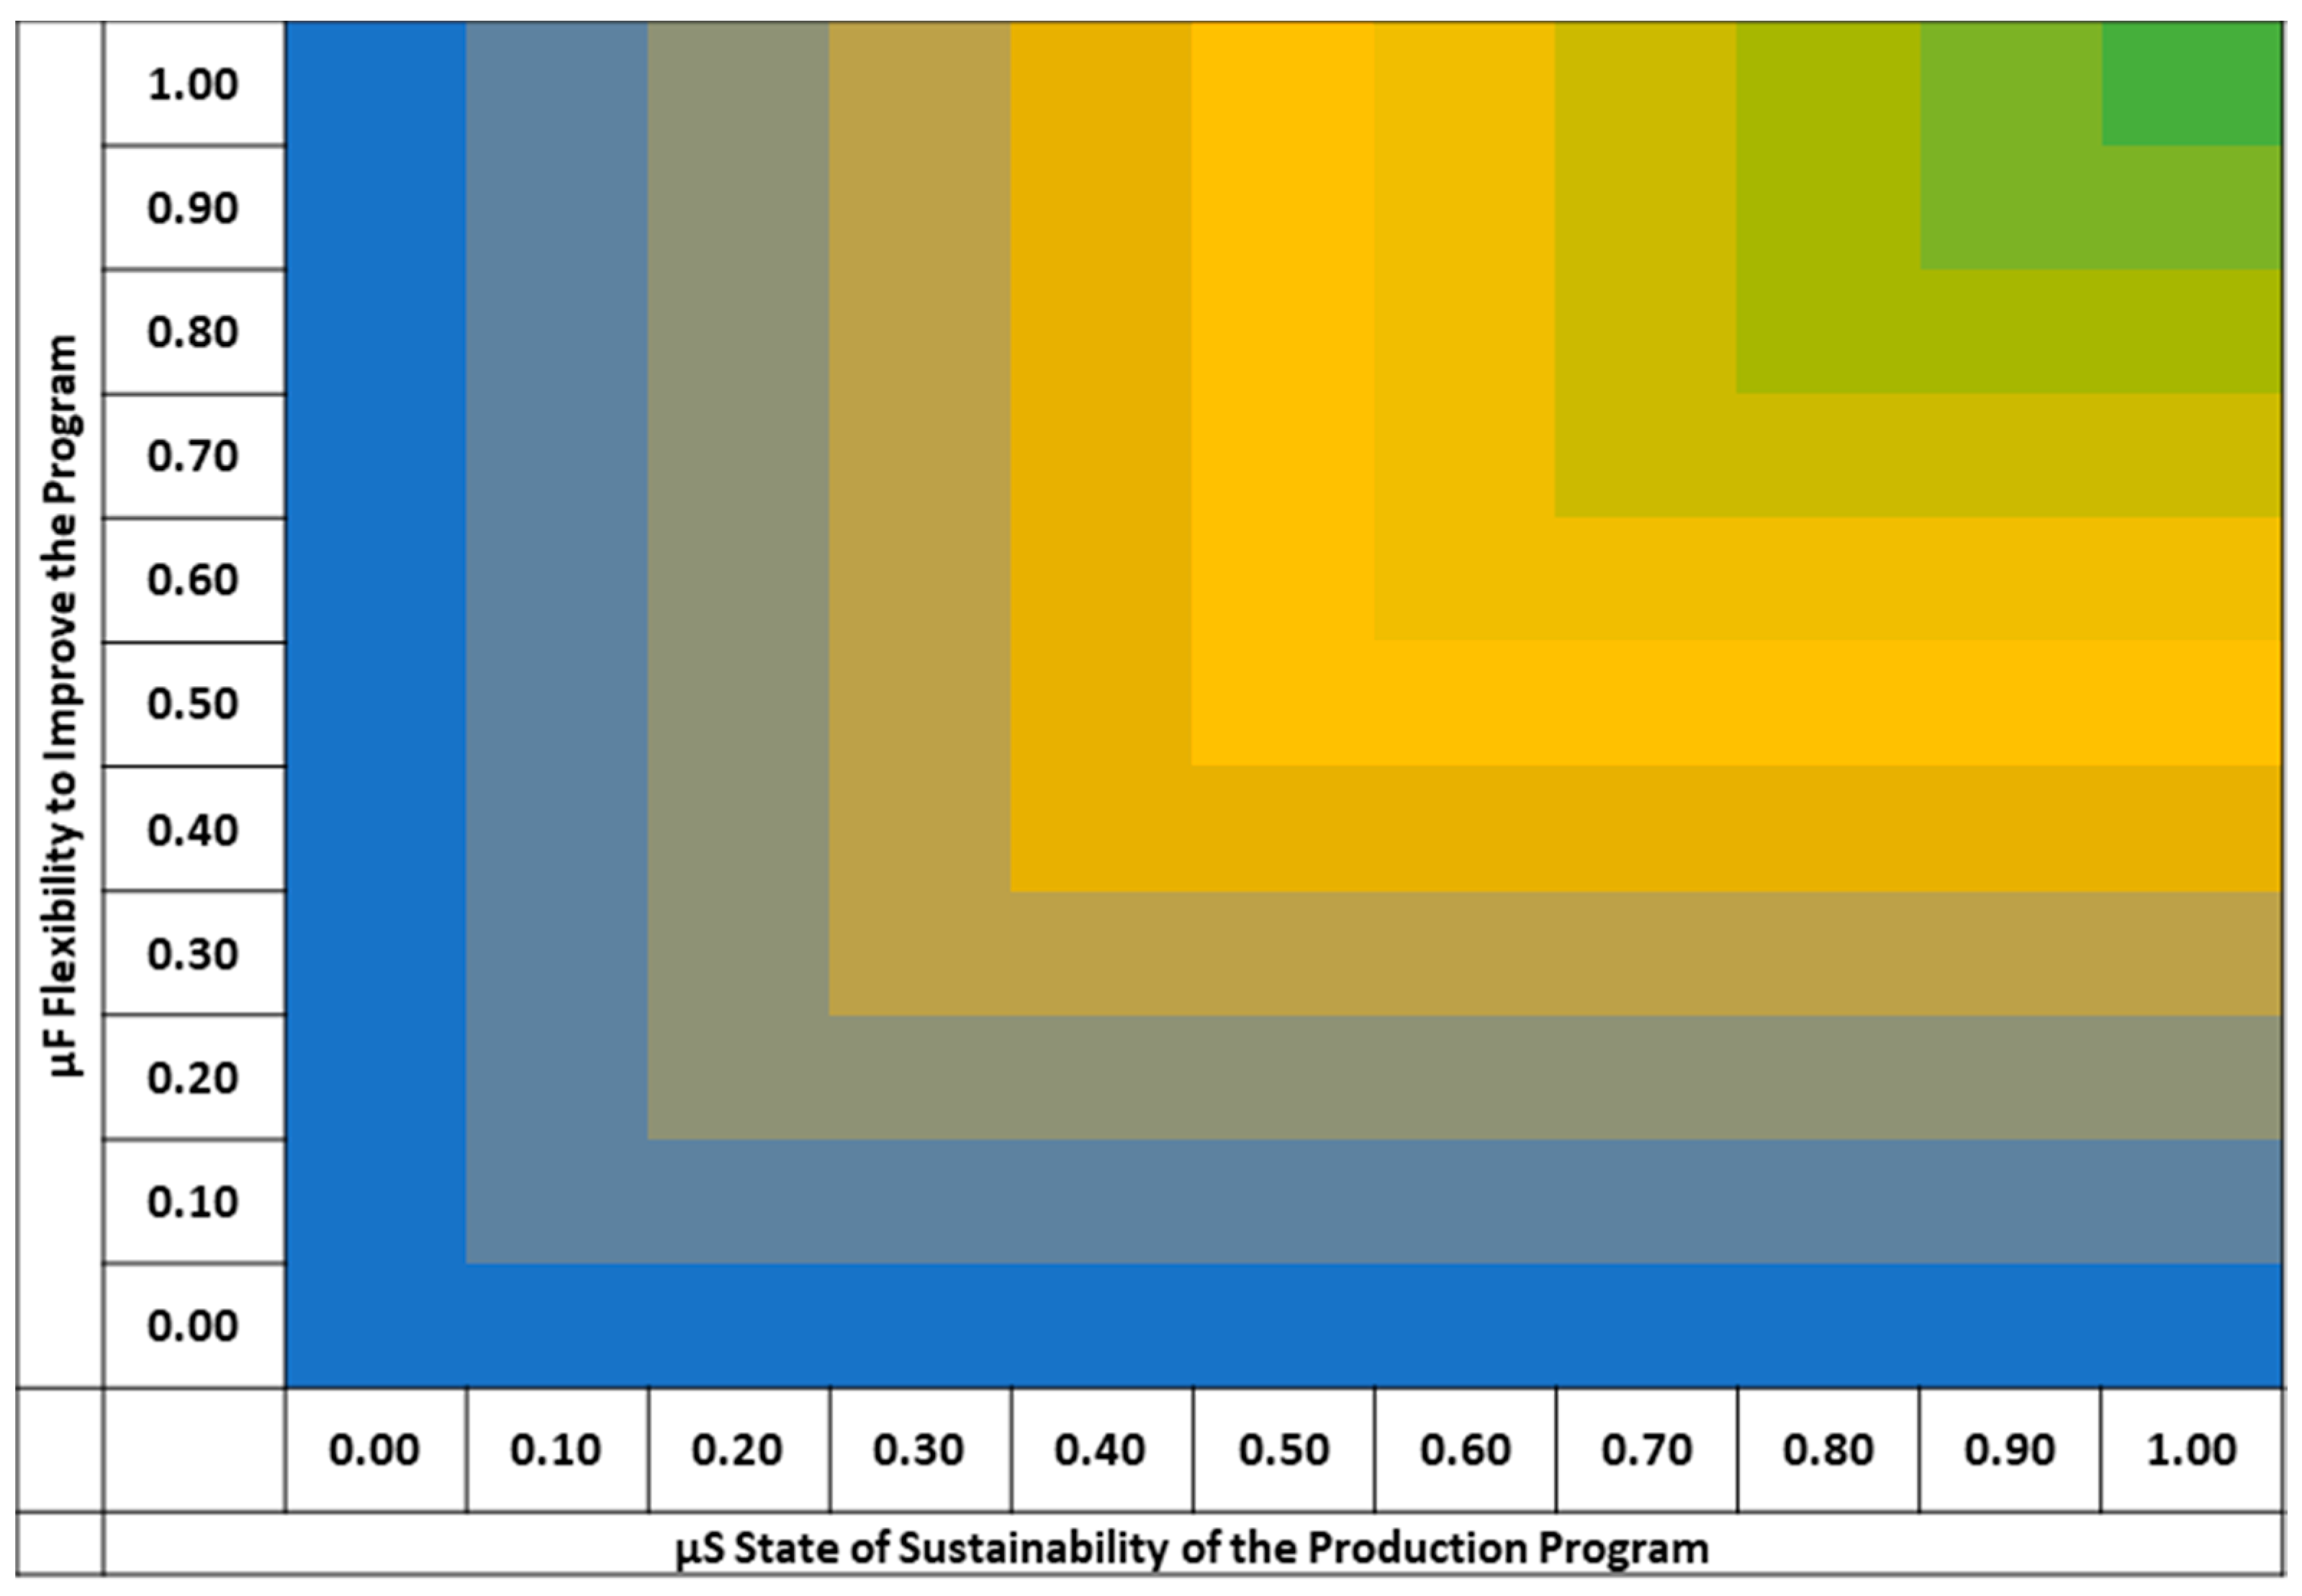
Figure A3.
Combination of values for the state of sustainability and flexibility using an average operator.
Figure A3.
Combination of values for the state of sustainability and flexibility using an average operator.
Appendix B
Table A1.
Overview of basic production data from the Learning Factory simulation model.
| Only Product White | Only Product Red | Only Product Blue | Product Mix | |
|---|---|---|---|---|
| Product Ratio (White/Red/Blue) | 1/0/0 | 0/1/0 | 0/0/1 | 1/1/1 |
| Max. Product Output | 31 Products/hour | 38 Products/hour | 31 Products/hour | 33 Products/hour |
| Minimal Lead Time | 242.6 s | 214.4 s | 243.9 | |
| Energy Demand | 0.62 kWh/Product | 0.44 kWh/Product | 0.53 kWh/Product | 0.55 kWh/Product |
| Power Peak at Max. Production Output | 45 kW | 29 kW | 37.5 kW | 37 kW |
| Workload Material Preparation | 10.94 kJ/Product | 10.94 kJ/Product | 10.94 kJ/Product | 10.94 kJ/Product |
| Workload Peak at Max. Production Output in 1 Working Hour. | 413.34 kJ | 496.81 kJ | 407.83 kJ | 419.66 kJ |
Appendix C
Figure A4.
Overview of the fuzzy sets for the case study.
Appendix D
Figure A5.
Design of the dashboard for sustainable production planning.

References
- Bundesministerium für Wirtschaft und Energie. Fakten zum Deutschen Außenhandel. Available online: https://www.bmwi.de/Redaktion/DE/Publikationen/Aussenwirtschaft/fakten-zum-deuschen-aussenhandel.html (accessed on 27 January 2021).
- Bundesministerium für Umwelt, Naturschutz und Nukleare Sicherheit. Umweltbericht der Bundesregierung 2019: Umwelt und Natur als Fundament des sozialen Zusammenhaltes. Available online: https://www.bmu.de/download/umweltberichte/ (accessed on 14 October 2020).
- Meadows, D.H.; Randers, J.; Meadows, D.L. Limits to Growth. The 30-Year Update; Chelsea Green Publishing Company: White River Junction, VT, USA, 2004; ISBN 9781931498586. [Google Scholar]
- Brundtland Commission. World Commission on Environment and Development. Our Common Future; Oxford Paperbacks; Oxford University Press: Oxford, UK, 1987. [Google Scholar]
- United Nations. Sustainable Development Goals. Available online: https://sdgs.un.org/goals (accessed on 26 October 2020).
- Neves, A.; Godina, R.; Azevedo, S.G.; Matias, J.C.O. A comprehensive review of industrial symbiosis. J. Clean. Prod. 2020, 247, 119113. [Google Scholar] [CrossRef]
- Suzanne, E.; Absi, N.; Borodin, V. Towards circular economy in production planning: Challenges and opportunities. Eur. J. Oper. Res. 2020. [Google Scholar] [CrossRef]
- Giret, A.; Trentesaux, D.; Prabhu, V. Sustainability in manufacturing operations scheduling: A state of the art review. J. Manuf. Syst. 2015, 37, 126–140. [Google Scholar] [CrossRef]
- Sutherland, J.W.; Richter, J.S.; Hutchins, M.J.; Dornfeld, D.; Dzombak, R.; Mangold, J.; Robinson, S.; Hauschild, M.Z.; Bonou, A.; Schönsleben, P.; et al. The role of manufacturing in affecting the social dimension of sustainability. CIRP Ann. 2016, 65, 689–712. [Google Scholar] [CrossRef] [Green Version]
- Akbar, M.; Irohara, T. Scheduling for sustainable manufacturing: A review. J. Clean. Prod. 2018, 205, 866–883. [Google Scholar] [CrossRef]
- Trost, M.; Forstner, R.; Claus, T.; Herrmann, F.; Frank, I.; Terbrack, H. Sustainable Production Planning and Control: A systematic Literature Review. In Proceedings of the European Conference on Modelling and Simulation, Caserta, Italy, 11–14 June 2019; Volume 33. [Google Scholar]
- Al-Sharrah, G.; Elkamel, A.; Almanssoor, A. Sustainability indicators for decision-making and optimisation in the process industry: The case of the petrochemical industry. Chem. Eng. Sci. 2010, 65, 1452–1461. [Google Scholar] [CrossRef]
- Piluso, C.; Huang, J.; Liu, Z.; Huang, Y. Sustainability Assessment of Industrial Systems under Uncertainty: A Fuzzy Logic Based Approach to Short-Term to Midterm Predictions. Ind. Eng. Chem. Res. 2010, 49, 8633–8643. [Google Scholar] [CrossRef]
- Phillis, Y.A.; Kouikoglou, V.S. Fuzzy Measurement of Sustainability; Nova Science Publishers: New York, NY, USA, 2009; ISBN 978-1-60741-900-6. [Google Scholar]
- Zadeh, L.A. Fuzzy sets. Inf. Control 1965, 8, 338–353. [Google Scholar] [CrossRef] [Green Version]
- Taticchi, P.; Garengo, P.; Nudurupati, S.S.; Tonelli, F.; Pasqualino, R. A review of decision-support tools and performance measurement and sustainable supply chain management. Int. J. Prod. Res. 2015, 53, 6473–6494. [Google Scholar] [CrossRef]
- Biel, K.; Glock, C.H. Systematic literature review of decision support models for energy-efficient production planning. Comput. Ind. Eng. 2016, 101, 243–259. [Google Scholar] [CrossRef]
- Diaz-Balteiro, L.; González-Pachón, J.; Romero, C. Measuring systems sustainability with multi-criteria methods: A critical review. Eur. J. Oper. Res. 2017, 258, 607–616. [Google Scholar] [CrossRef]
- Zarte, M.; Wermann, J.; Heeren, P.; Pechmann, A. Concept, Challenges, and Learning Benefits Developing an Industry 4.0 Learning Factory with Student Projects. In Proceedings of the IEEE 17th International Conference on Industrial Informatics (INDIN), Helsinki, Finland, 22–25 July 2019; pp. 1133–1138. [Google Scholar] [CrossRef]
- Zarte, M.; Pechmann, A.; Nunes, I.L. Decision support systems for sustainable manufacturing surrounding the product and production life cycle—A literature review. J. Clean. Prod. 2019, 219, 336–349. [Google Scholar] [CrossRef]
- Daly, H.E. Toward some operational principles of sustainable development. Ecol. Econ. 1990, 2, 1–6. [Google Scholar] [CrossRef]
- Deutsche Kommission Elektrotechnik Elektronik Informationstechnik. Enterprise-Control System Integration—Part 1: Models and Terminology; CEN: Frankfurt, Germany, 2013. [Google Scholar]
- Graves, S.C. Manufacturing Planning and Control; Massachusetts Institute of Technology: Cambridge, MA, USA, 1999. [Google Scholar]
- World Business Council for Sustainable Development. Sustainable Consumption Facts and Trends: The Business Role Focus Area. Available online: https://www.wbcsd.org/Programs/People/Sustainable-Lifestyles/Resources/Sustainable-consumption-facts-trends (accessed on 2 December 2020).
- Elkington, J. Partnerships fromcannibals with forks: The triple bottom line of 21st-century business. Environ. Qual. Manag. 1998, 8, 37–51. [Google Scholar] [CrossRef]
- Moldavska, A.; Welo, T. The concept of sustainable manufacturing and its definitions: A content-analysis based literature review. J. Clean. Prod. 2017, 166, 744–755. [Google Scholar] [CrossRef]
- U.S. Environmental Protection Agency. Sustainable Manufacturing. Available online: https://www.epa.gov/sustainability/sustainable-manufacturing (accessed on 14 February 2020).
- Bungartz, H.-J.; Buchholz, M.; Pflüger, D.; Zimmer, S. Modellbildung und Simulation. Eine Anwendungsorientierte Einführung; Springer: Berlin/Heidelberg, Germany, 2009; ISBN 978-3-540-79809-5. [Google Scholar]
- Cornelissen, A.M.G.; van den Berg, J.; Koops, W.J.; Grossman, M.; Udo, H.M.J. Assessment of the contribution of sustainability indicators to sustainable development: A novel approach using fuzzy set theory. Agric. Ecosyst. Environ. 2001, 86, 173–185. [Google Scholar] [CrossRef]
- Inoue, M.; Lindow, K.; Stark, R.; Tanaka, K.; Nahm, Y.-E.; Ishikawa, H. Decision-making support for sustainable product creation. Adv. Eng. Inform. 2012, 26, 782–792. [Google Scholar] [CrossRef]
- Bitter, J.; Printz, S.; Lahl, K.; Vossen, R.; Jeschke, S. Fuzzy Logic Approach for Sustainability Assessment Based on the Integrative Sustainability Triangle. In Proceedings of the 2016 World Congress on Sustainable Technologies (WCST), London, UK, 12–14 December 2016; pp. 64–69. [Google Scholar] [CrossRef]
- Ghadimi, P.; Azadnia, A.H.; Mohd Yusof, N.; Mat Saman, M.Z. A weighted fuzzy approach for product sustainability assessment: A case study in automotive industry. J. Clean. Prod. 2012, 33, 10–21. [Google Scholar] [CrossRef]
- Hemdi, A.R.; Saman, M.Z.M.; Sharif, S. Sustainability evaluation using fuzzy inference methods. Int. J. Sustain. Energy 2013, 32, 169–185. [Google Scholar] [CrossRef]
- Kucukvar, M.; Gumus, S.; Egilmez, G.; Tatari, O. Ranking the sustainability performance of pavements: An intuitionistic fuzzy decision making method. Autom. Constr. 2014, 40, 33–43. [Google Scholar] [CrossRef]
- Pislaru, M.; Herghiligiu, I.V.; Robu, I.-B. Corporate sustainable performance assessment based on fuzzy logic. J. Clean. Prod. 2019, 223, 998–1013. [Google Scholar] [CrossRef]
- Calabrese, A.; Costa, R.; Levialdi, N.; Menichini, T. Integrating sustainability into strategic decision-making: A fuzzy AHP method for the selection of relevant sustainability issues. Technol. Forecast. Soc. Chang. 2019, 139, 155–168. [Google Scholar] [CrossRef]
- Rajak, S.; Vinodh, S. Application of fuzzy logic for social sustainability performance evaluation: A case study of an Indian automotive component manufacturing organization. J. Clean. Prod. 2015, 108, 1184–1192. [Google Scholar] [CrossRef]
- Elysia, C.; Nugeraha Utama, D. Decision support model for optimal decision in strategic production planning based-on product life cycle. Int. J. Electr. Comput. Eng. 2018. [Google Scholar] [CrossRef]
- Kreimeier, D. Ressourcenorientierte Bewertung und Optimierung von Prozessketten; VDMA-Verl.: Frankfurt am Main, Germany, 2012; ISBN 3816306276. [Google Scholar]
- Calabrese, A.; Costa, R.; Levialdi, N.; Menichini, T. A fuzzy analytic hierarchy process method to support materiality assessment in sustainability reporting. J. Clean. Prod. 2016, 121, 248–264. [Google Scholar] [CrossRef]
- Kouikoglou, V.S.; Phillis, Y.A. Application of a fuzzy hierarchical model to the assessment of corporate social and environmental sustainability. Corp. Soc. Responsib. Environ. Manag. 2011, 18, 209–219. [Google Scholar] [CrossRef]
- Rajabalipour Cheshmehgaz, H.; Haron, H.; Kazemipour, F.; Desa, M.I. Accumulated risk of body postures in assembly line balancing problem and modeling through a multi-criteria fuzzy-genetic algorithm. Comput. Ind. Eng. 2012, 63, 503–512. [Google Scholar] [CrossRef]
- Normenausschuss Grundlagen des Umweltschutzes. Environmental Management—Life Cycle Assessment—Principles and Framework; CEN: Berlin, Germany, 2009. [Google Scholar]
- Le Hesran, C.; Ladier, A.-L.; Botta-Genoulaz, V.; Laforest, V. Reducing waste in manufacturing operations: A mixed integer linear program for bi-objective scheduling on a single-machine with coupled-tasks. IFAC-PapersOnLine 2018, 51, 1695–1700. [Google Scholar] [CrossRef]
- Grosse, E.H.; Calzavara, M.; Glock, C.H.; Sgarbossa, F. Incorporating human factors into decision support models for production and logistics: Current state of research. IFAC-PapersOnLine 2017, 50, 6900–6905. [Google Scholar] [CrossRef]
- Liu, Y.; Dong, H.; Lohse, N.; Petrovic, S.; Gindy, N. An investigation into minimising total energy consumption and total weighted tardiness in job shops. J. Clean. Prod. 2014, 65, 87–96. [Google Scholar] [CrossRef]
- REFA—Verband für Arbeitsstudien und Betriebsorganisation. Planung und Gestaltung komplexer Produktionssysteme; 2. Aufl; Hanser: München, Germany, 1990; ISBN 3446159673. [Google Scholar]
- Marks, P.; Yu, Q.; Weyrich, M. Survey on Flexibility and Changeability Indicators of automated Manufacturing Systems. In Proceedings of the 2018 IEEE 23rd International Conference on Emerging Technologies and Factory Automation (ETFA), Turin, Italy, 4–7 September 2018; pp. 516–523. [Google Scholar] [CrossRef]
- Chapman, S.N. The Fundamentals of Production Planning and Control; Pearson/Prentice Hall: Upper Saddle River, NJ, USA, 2006; ISBN 0-13-017615-X. [Google Scholar]
- Zarte, M.; Pechmann, A.; Nunes, I.L. Indicator framework for sustainable production planning and controlling. Int. J. Sustain. Eng. 2019, 12, 149–158. [Google Scholar] [CrossRef]
- Ross, T.J. Fuzzy Logic with Engineering Applications, 3rd ed.; John Wiley: Chichester, West Sussex, 2010; ISBN 978-0-470-74376-8. [Google Scholar]
- Saad, M.H.; Nazzal, M.A.; Darras, B.M. A general framework for sustainability assessment of manufacturing processes. Ecol. Indic. 2019, 97, 211–224. [Google Scholar] [CrossRef]
- Becker, W.-J.; Börcsök, J. (Eds.) Fuzzy Control. Theorie und Industrieeinsatz; 1. Aufl.; Verl. Technik: Berlin, Germany, 2000; ISBN 3341012373. [Google Scholar]
- Koether, R.; Kurz, B.; Seidel, U.A. Betriebsstättenplanung und Ergonomie. Planung von Arbeitssystemen; 1. Aufl.; Carl Hanser Fachbuchverlag: München, Germany, 2010; ISBN 3446210741. [Google Scholar]
- Zarte, M.; Pechmann, A.; Nunes, I.L. Design of a Platform for Sustainable Production Planning and Controlling from an User Centered Perspective. In Advances in Human Factors and Systems Interaction: Proceedings of the AHFE 2018 International Conference on Human Factors and Systems Interaction, July 21–25, 2018, Loews Sapphire Falls Resort at Universal Studios, Orlando, FL, USA; Nunes, I.L., Ed.; Springer: Cham, Switzerland, 2019; pp. 396–407. ISBN 978-3-319-94333-6. [Google Scholar]
- Zarte, M.; Wunder, U.; Pechmann, A. Concept and first case study for a generic predictive maintenance simulation in AnyLogic™. In Proceedings of the IECON 2017—43rd Annual Conference of the IEEE Industrial Electronics Society, Beijing, China, 29 October–1 November 2017; pp. 3372–3377. [Google Scholar] [CrossRef]
Figure 1.
General system boundaries for production systems.
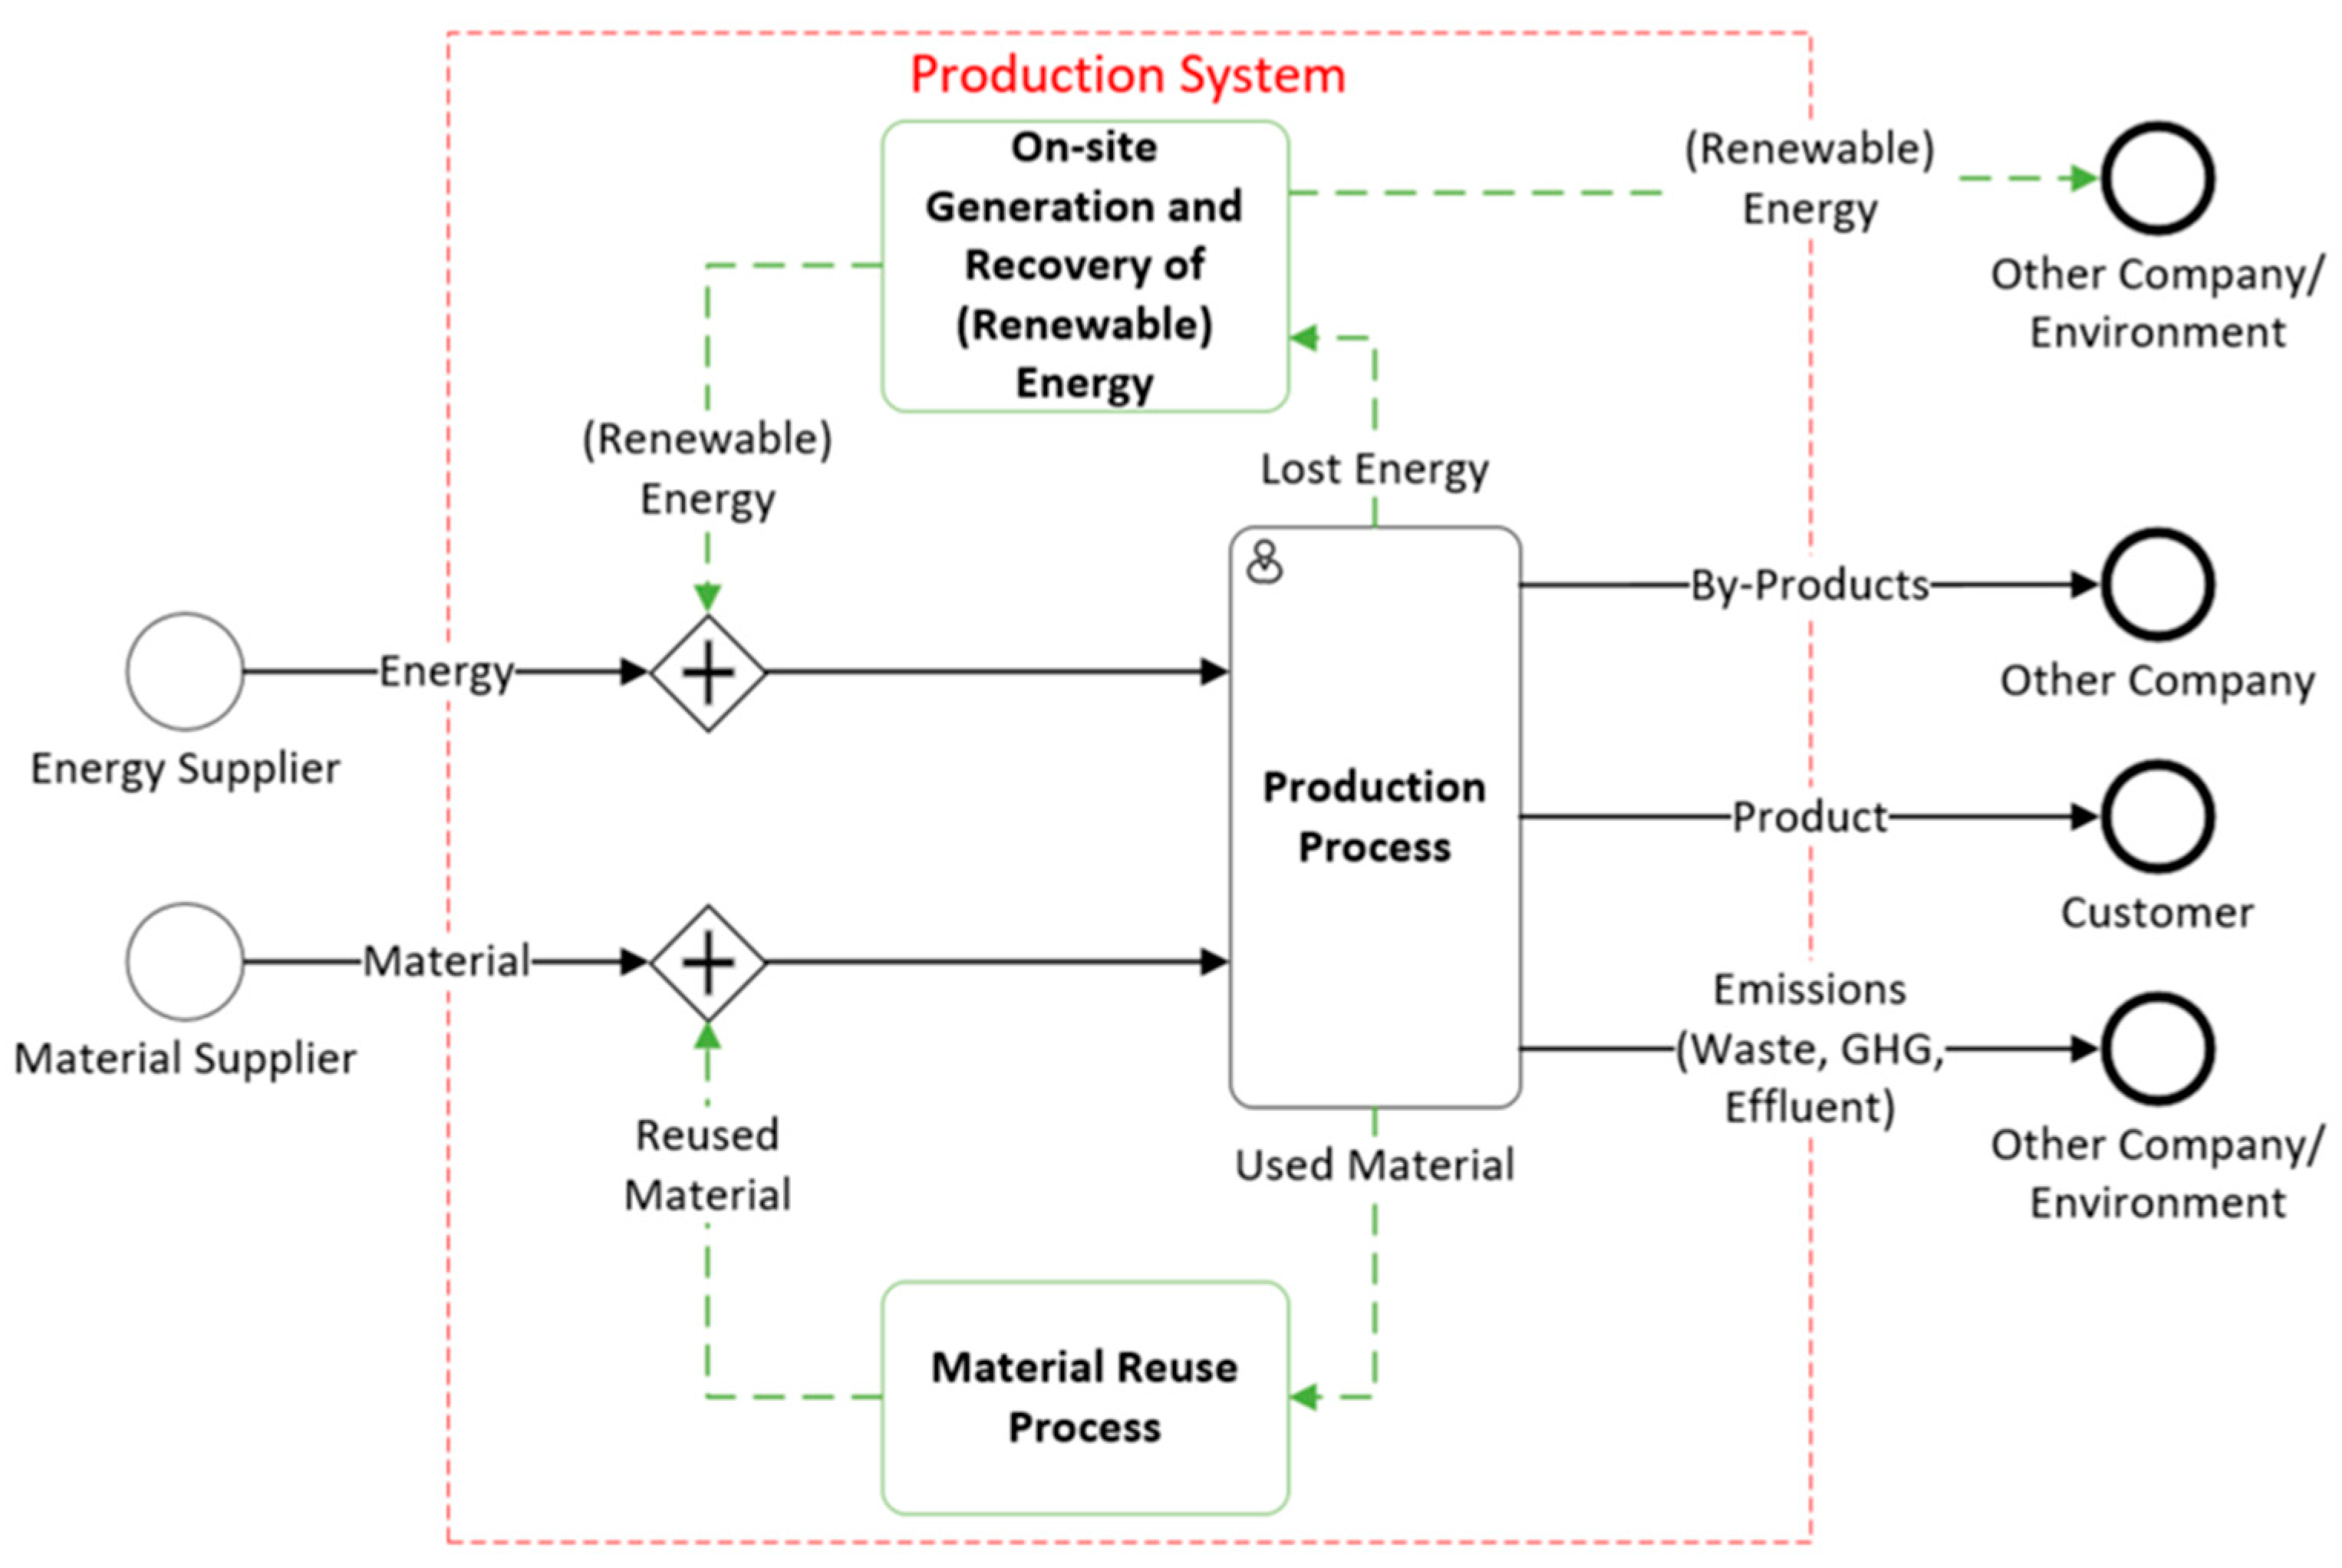
Figure 2.
Framework of the goals and variables for sustainable production planning and controlling.

Figure 3.
Presentation and mathematical formulation of a triangle membership function.

Figure 4.
Expected fuzzy output for the combination of the state of sustainability and flexibility.

Figure 5.
Combination of values for the state of sustainability and flexibility using the custom operator.
Figure 5.
Combination of values for the state of sustainability and flexibility using the custom operator.
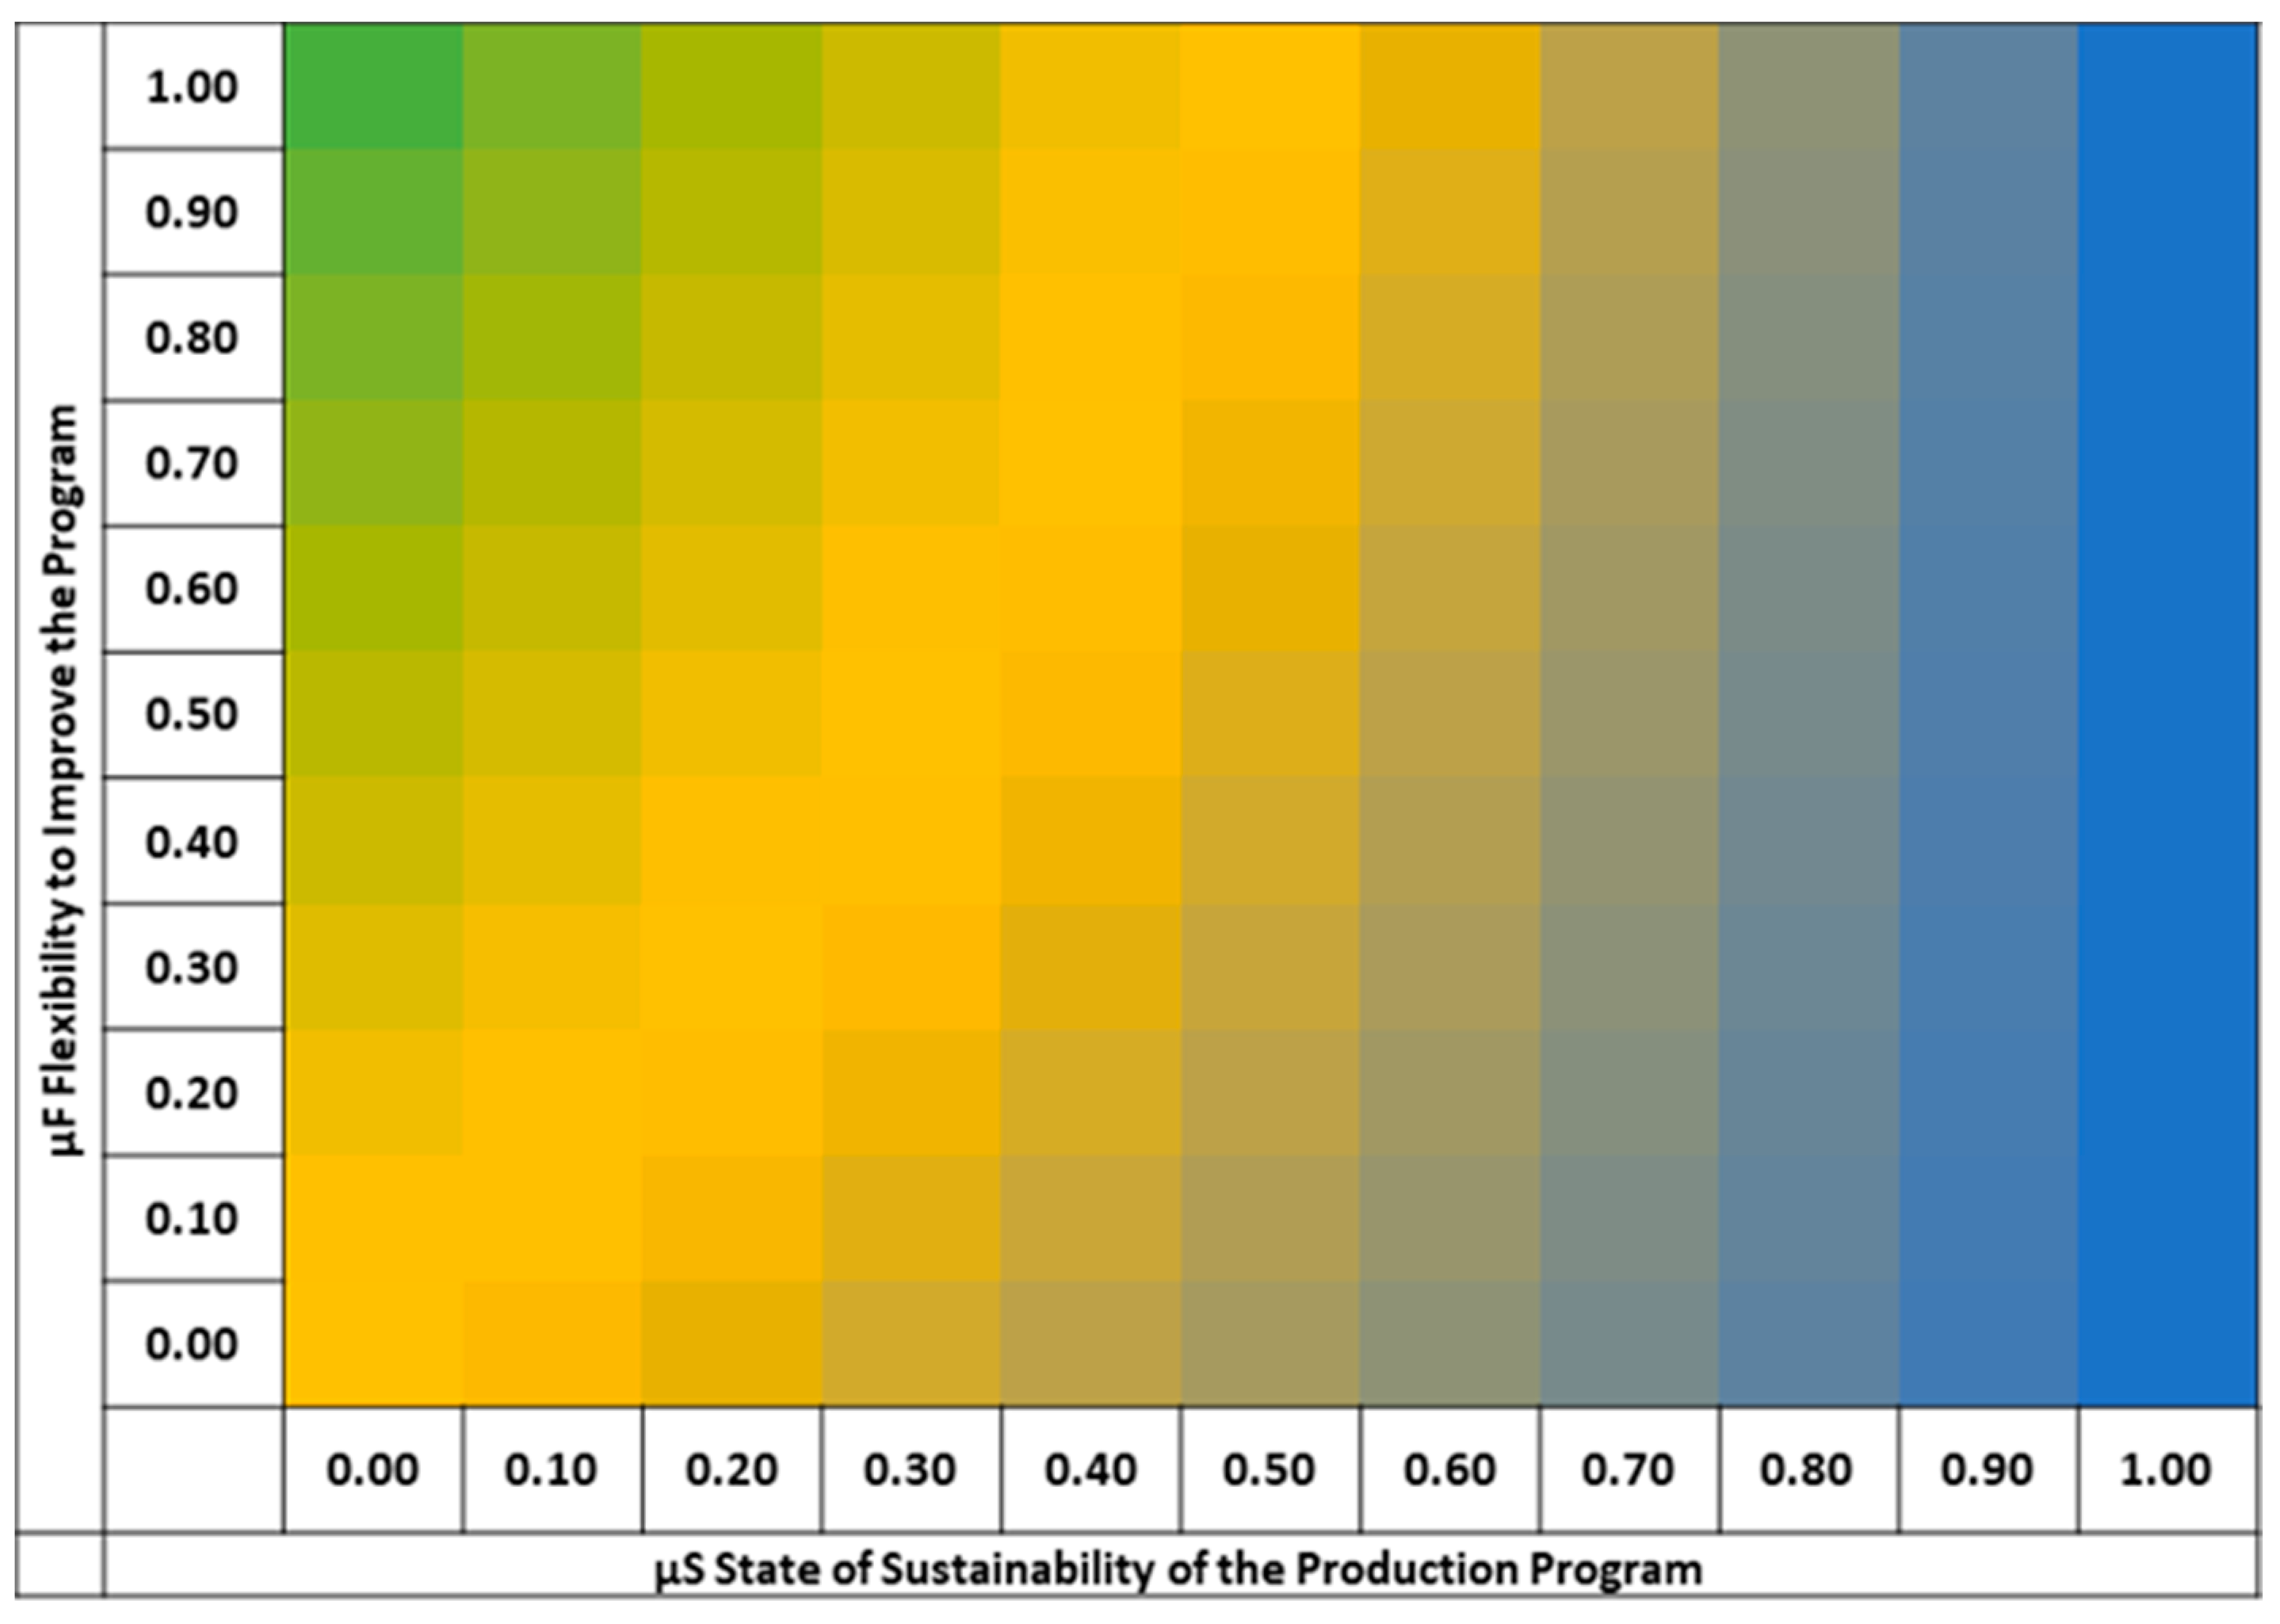
Figure 6.
Function for defuzzification of the aggregated membership values.

Figure 7.
Decision-making process for sustainable production planning and controlling.

Figure 8.
Assembling of the Learning Factory 4.0: Physical System (a) and 3D simulation model (b).
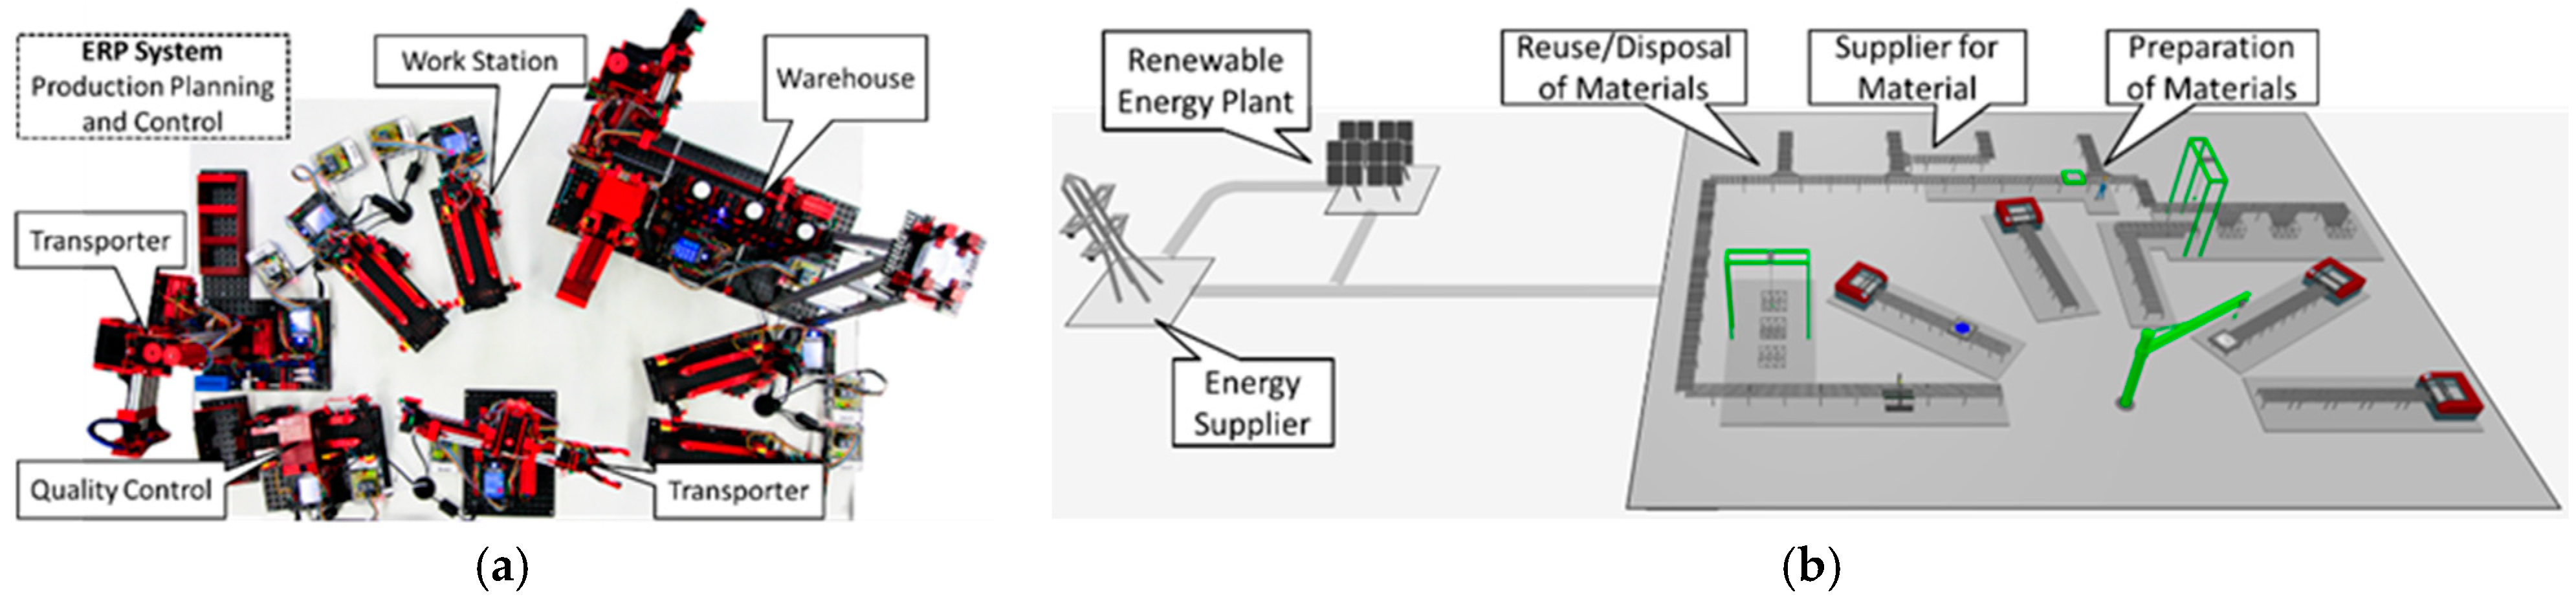
Figure 9.
System boundaries as a nested hierarchy of the systems for sustainable production planning.
Figure 9.
System boundaries as a nested hierarchy of the systems for sustainable production planning.
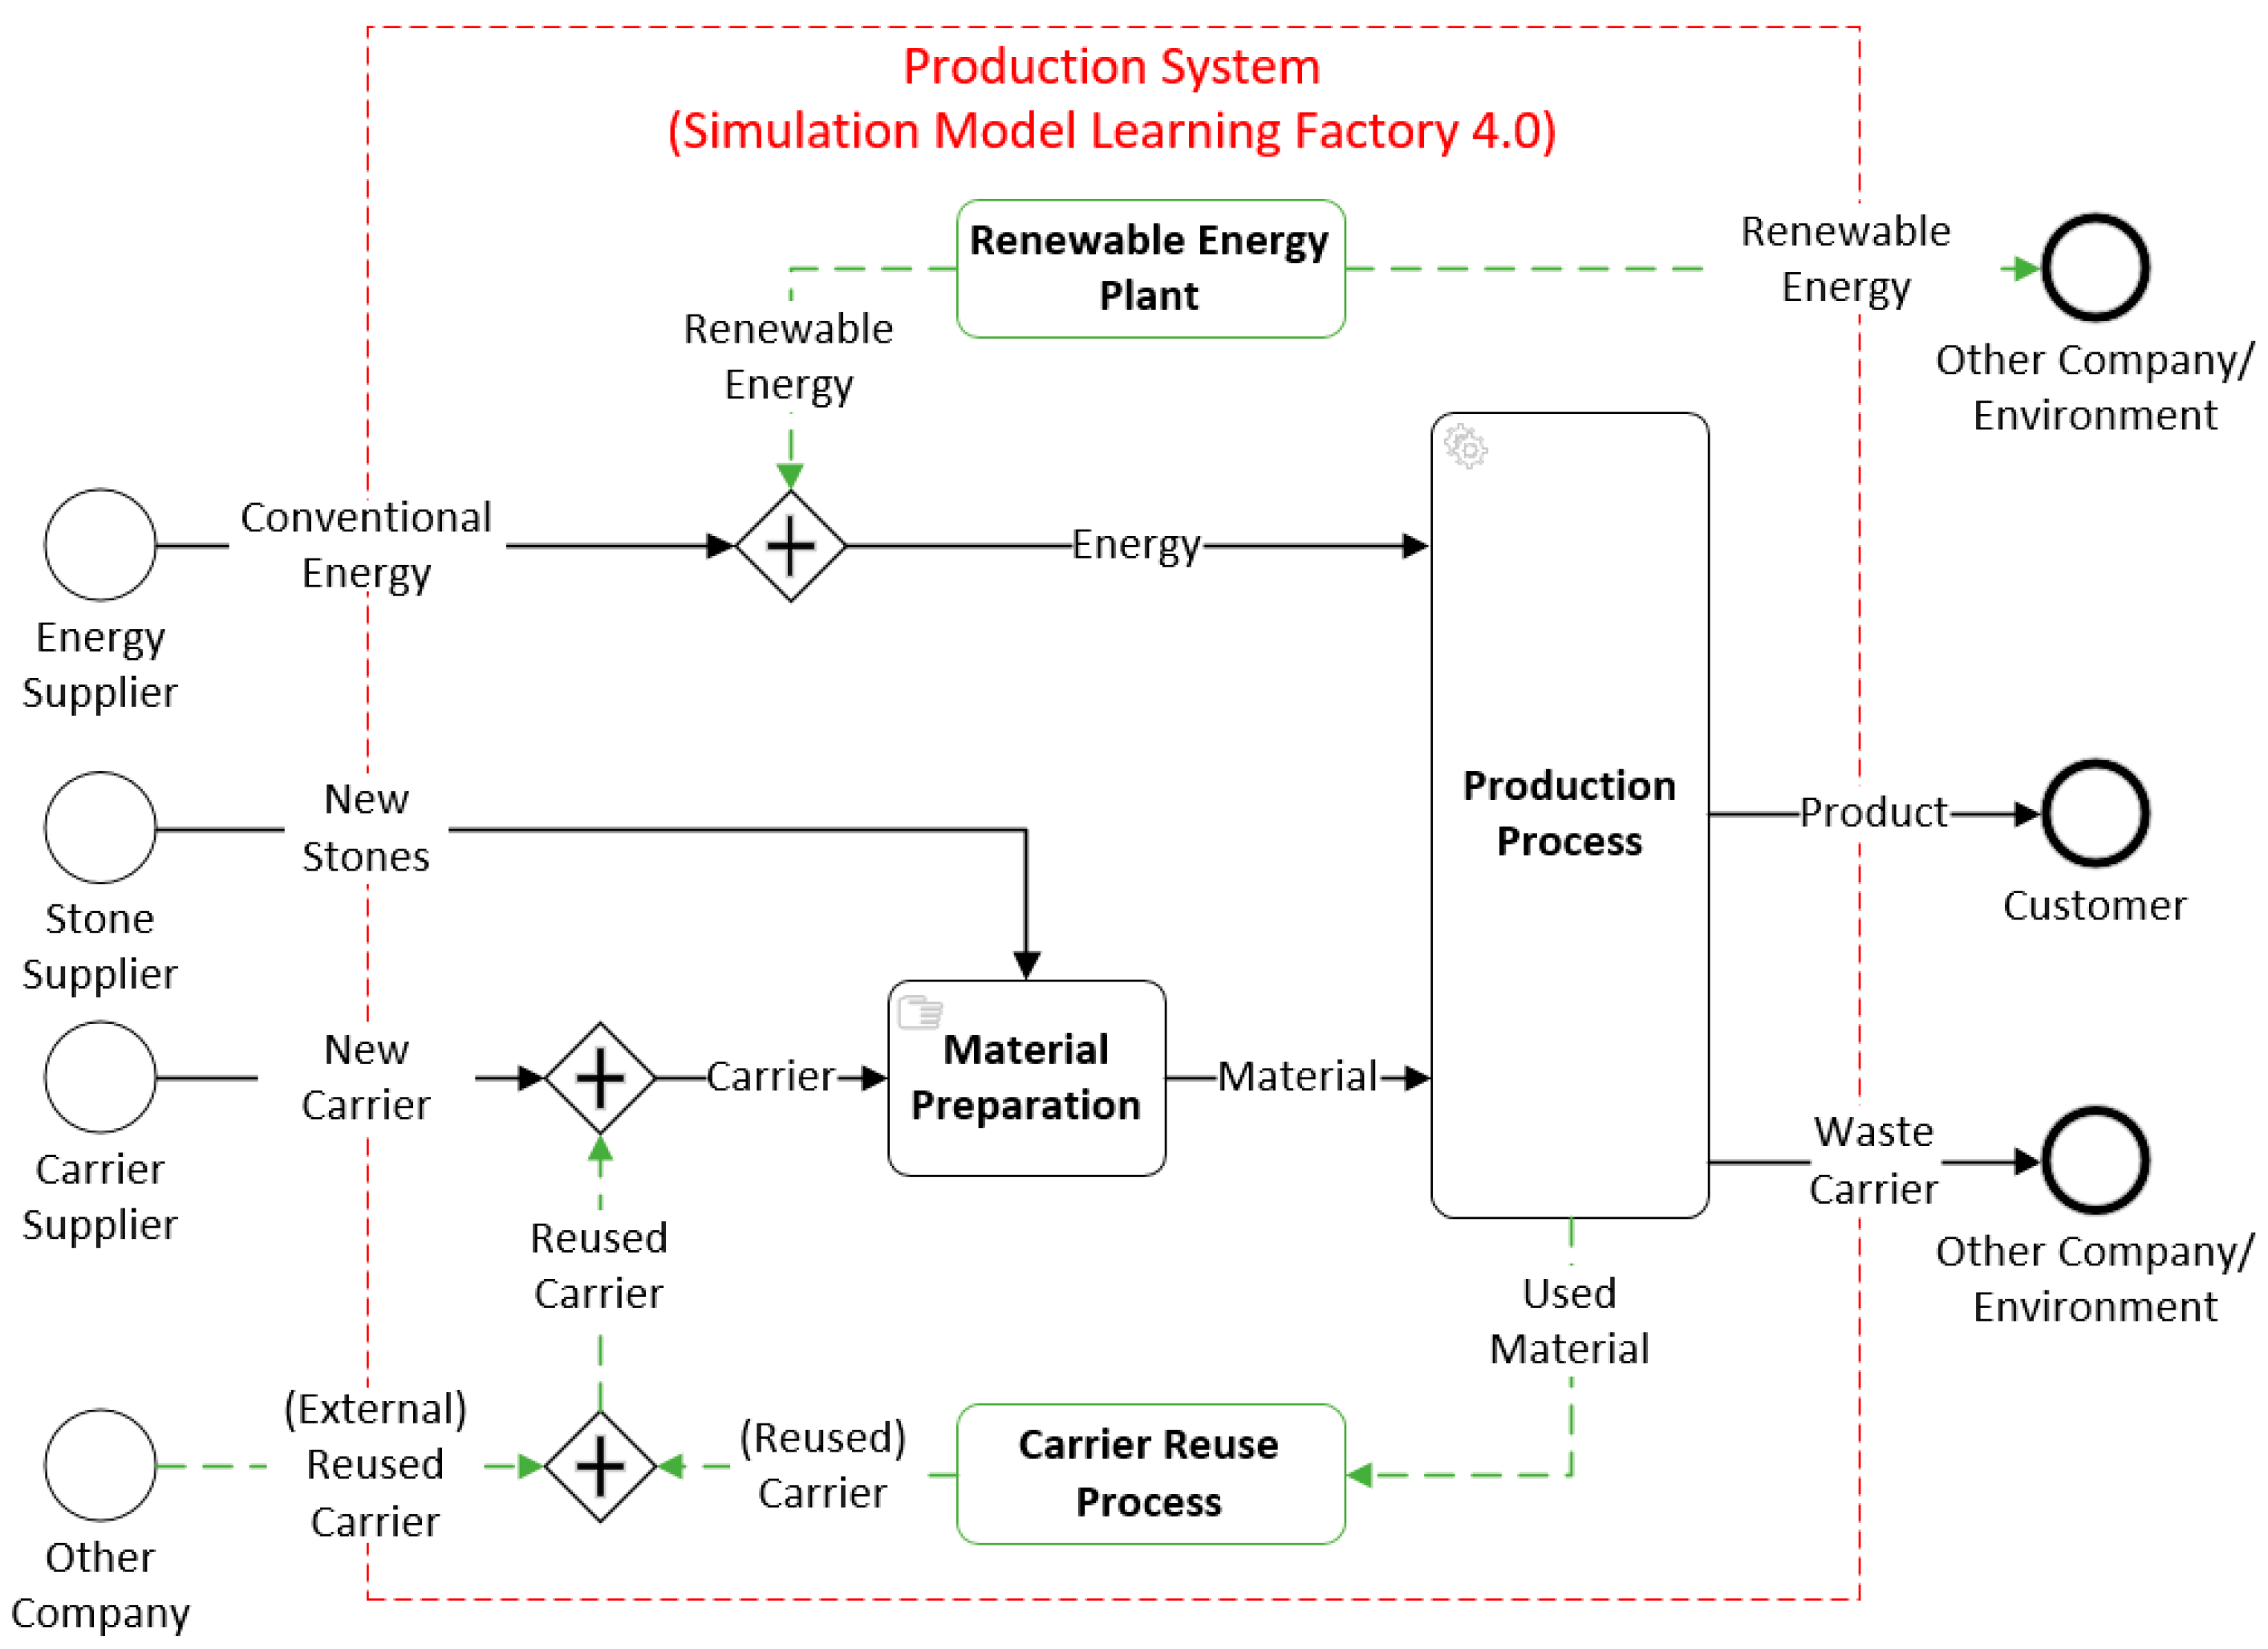
Figure 10.
Sensitive analysis of the renewable energy generation for the standard production scenario product mix.
Figure 10.
Sensitive analysis of the renewable energy generation for the standard production scenario product mix.
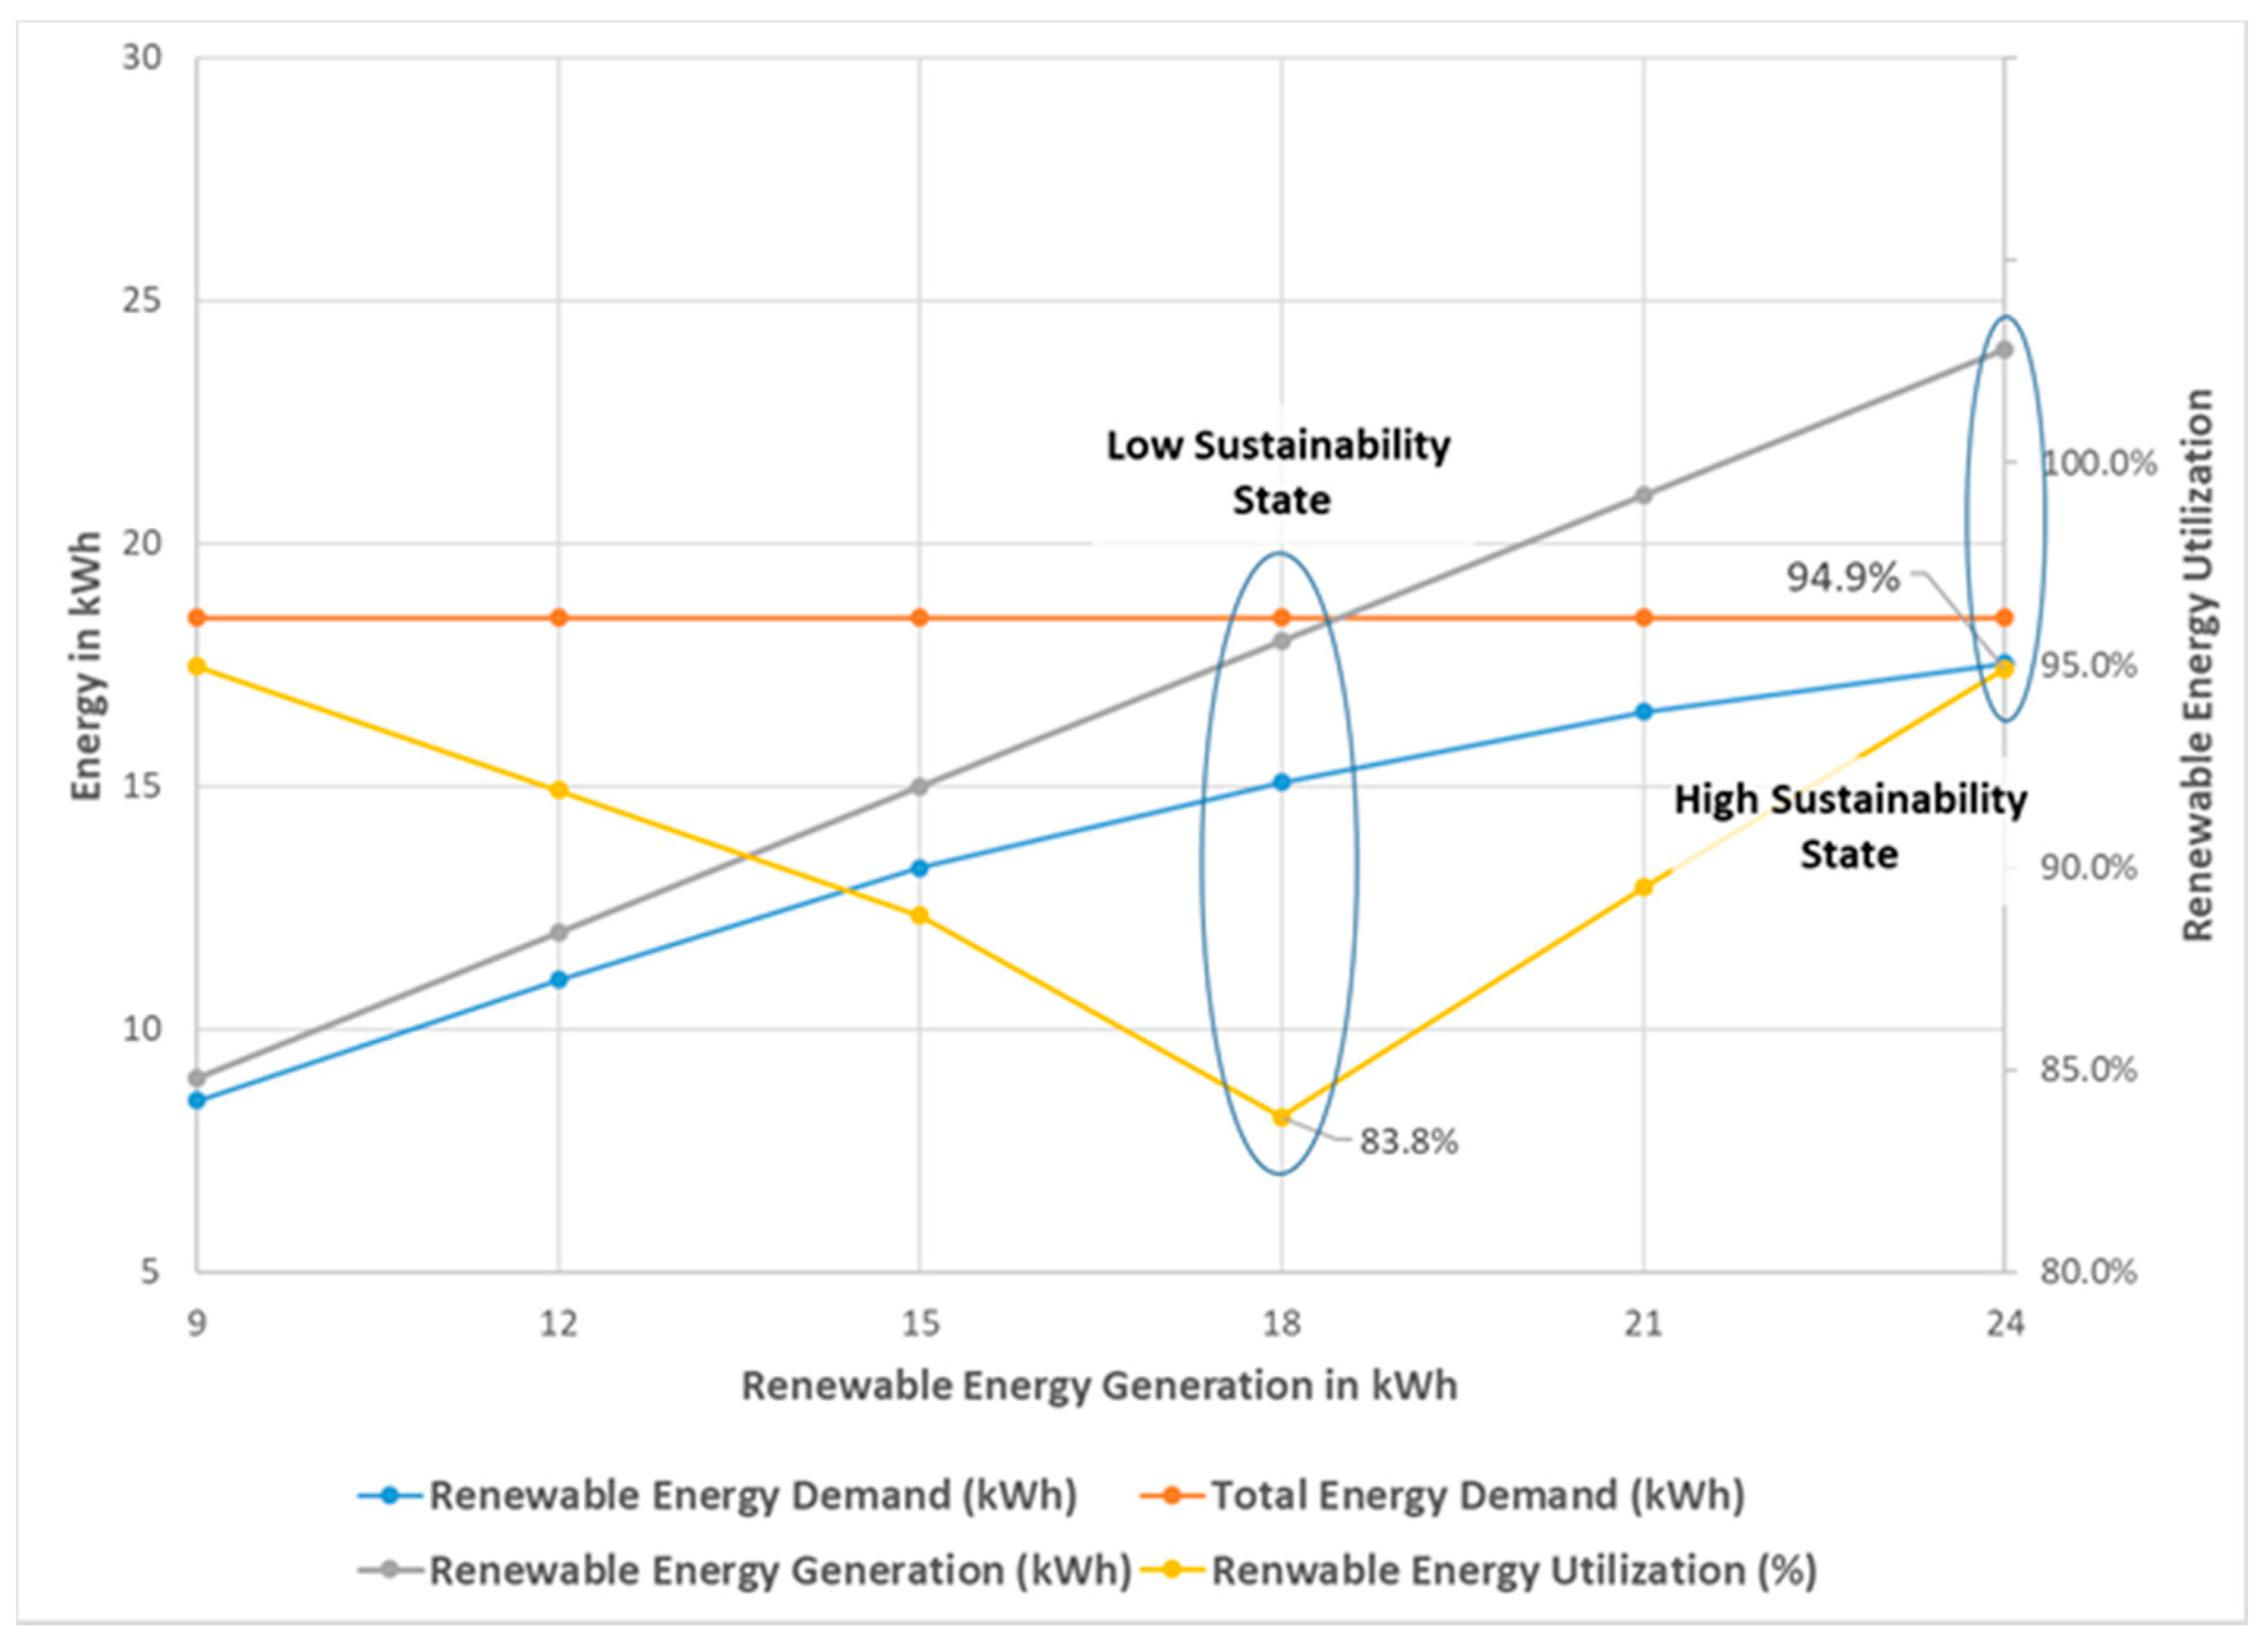
Figure 11.
Fuzzy set for the renewable energy utilization variable.
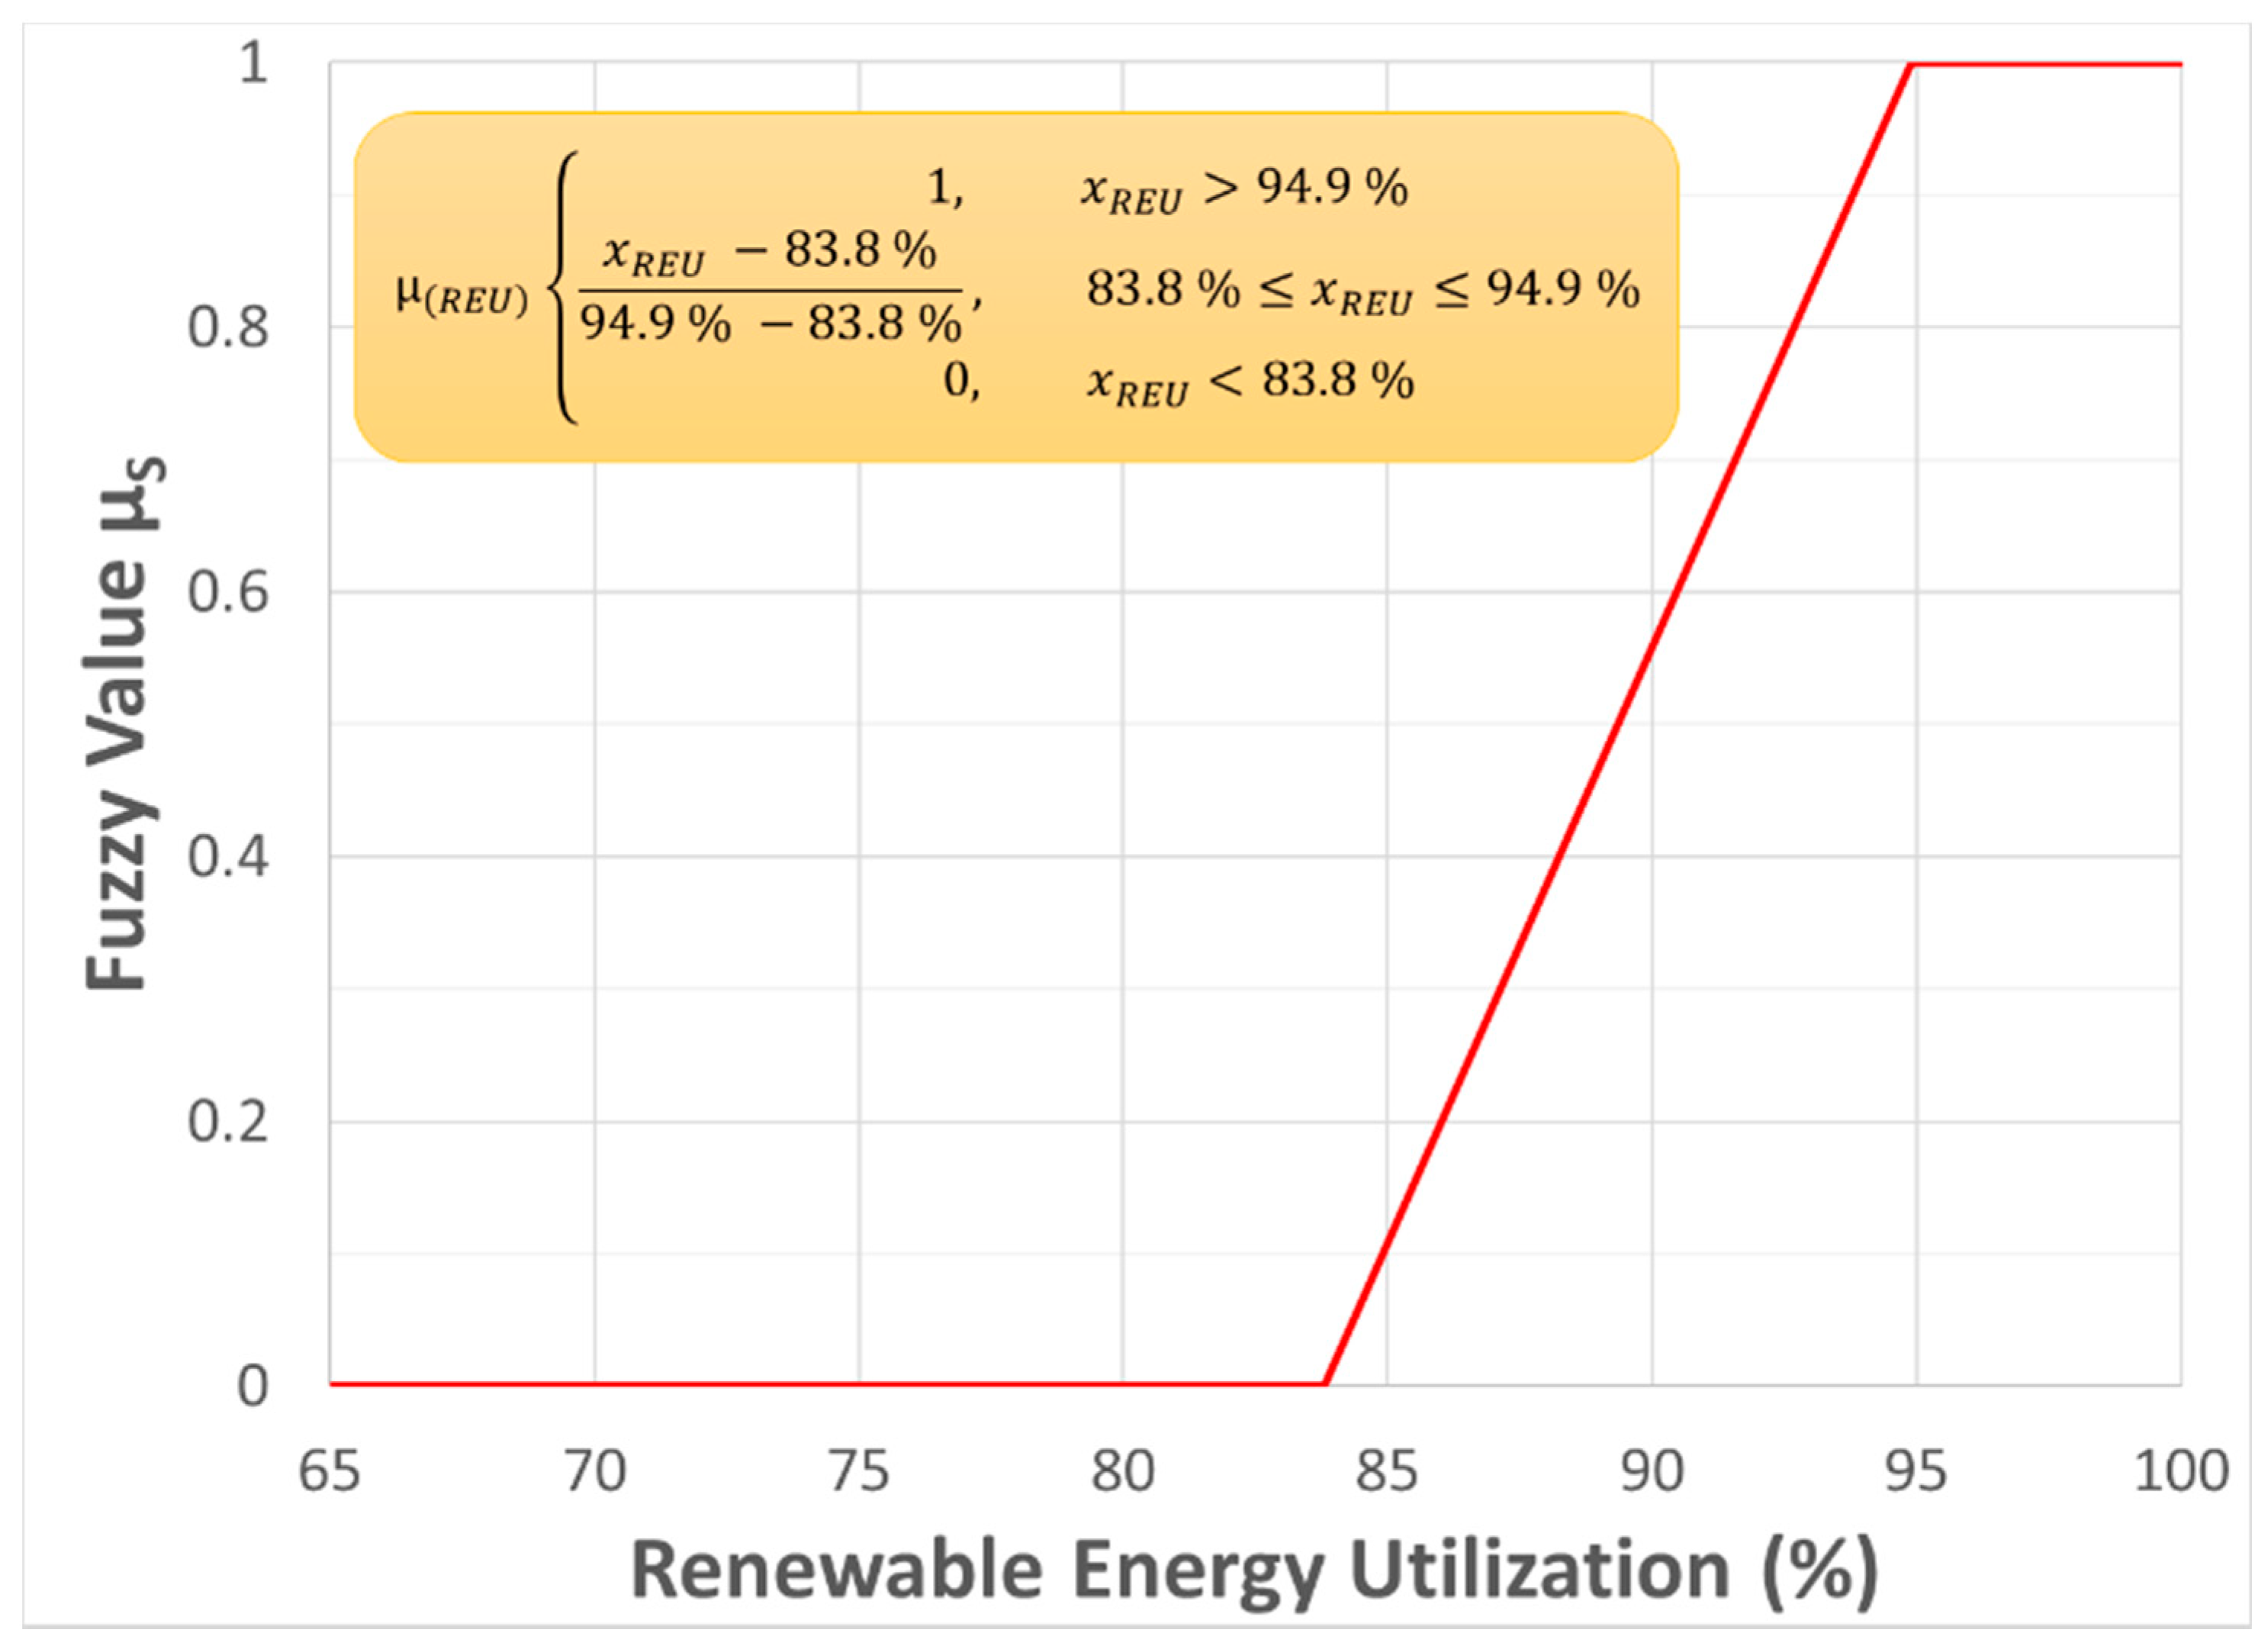
Table 2.
Overview of existing literature reviews for sustainable production planning.
| Reference | Economic Sustainability | Environmental Sustainability | Social Sustainability |
|---|---|---|---|
| [8] | X | X | |
| [44] | X | X (Focus on Waste Reduction) | |
| [17] | X | X (Focus on Energy Efficiency) | |
| [11] | X | X | |
| [45] | X | X |
Table 3.
Overview of objective functions and suitable variables for conventional production planning.
Table 3.
Overview of objective functions and suitable variables for conventional production planning.
| Objective Function (Unit) | Variable |
|---|---|
| Processing of jobs within a certain makespan (h) | Makespan |
| Minimal total makespan to finish jobs (h) | Makespan |
| Minimal total tardiness time of jobs (h) | Tardiness time |
| Threshold for production volume (%) | Production volume |
| Minimal total inventory of products and semi-products (number of products/semi-products) | Inventory of products and semi-products |
Table 4.
Overview of objective functions and suitable variables for sustainable production planning.
Table 4.
Overview of objective functions and suitable variables for sustainable production planning.
| Objective Function (Unit) | Variable | |
|---|---|---|
| Economic Sustainability | Minimal energy production costs (Euro) | Energy cost |
| Minimal disassembly and shredding costs for recycling purposes (Euro) | Disassembly and shredding costs | |
| Minimal total production costs (Euro) | Production costs | |
| Minimal cost-weighted processing quality instability index (Euro) | Cost-weighted processing quality instability index | |
| Environmental Sustainability | Minimal total non-processing energy (kWh) | Non-processing energy |
| Threshold for the peak power (kW) | Peak power | |
| Minimal carbon dioxide (equivalents) emission (tons CO2) | Carbon dioxide (equivalents) emission | |
| Minimal total energy consumption (kWh) | Energy consumption | |
| Minimal number of setups of machines to avoid the emission of waste, effluent, and greenhouse gases (number of setups) | Number of setups | |
| Minimal use of freshwater through reusing (m3) | Use of freshwater | |
| Social Sustainability | Threshold for the minimum required human workforce for job tasks (h) | Human workforce |
| High learning rate of employees processing jobs (number of processed jobs) | Learning rate of employees | |
| Low forgetting rates of employees processing jobs (time period without processing the job) | Forgetting rates of employees | |
| Minimal risk of injuries and/or health impacts caused by physical stress on employees (risk of injuries, (human) energy expenditure performing jobs, Occupational Risk Assessment (OCRA) index) | Risk of injuries caused by ergonomic stress on employees; (human) energy expenditure performing jobs | |
| Maximal skill level of the employee | Skill level of the employee |
| Partial Flexibility | Variable |
|---|---|
| Machine flexibility describes the convertibility of machines to new products/materials. | Setup time |
| Material handling flexibility describes the (re-)routability and storage ability of materials. | Queue time in buffer zones |
| Volume flexibility describes the capacity adaptability of production resources. | Production capacity |
| Process flexibility describes the versatility of processes to adapt to new products. | Number of possible product variations which can be produced |
| Routing flexibility describes the redundancy of production resources. | Number of available resources |
Table 6.
Overview of production planning goals and variables for the case study.
| Production Goal | Potential to Improve the Sustainability of the Production Program |
|---|---|
Total Product Output Rate
| Use of Renewable Energy Potential:
|
Table 7.
Overview of fuzzy sets for the case study.
| Variable | Membership Function Shape | Description Value X1 | Value X1 | Description Value X2 | Value X2 | Data Source and Method | |
|---|---|---|---|---|---|---|---|
| Product Output Goal | f |  | Total (or specific) required production output (of single products) in (products/hour). | 0–38 products/hour | Set by production planner based on forecast product data and customer requests. | ||
| Renewable Energy Utilization | µS,1 |  | Minimally acceptable renewable energy utilization for the production process in (%). | 83.8% of the available renewable energy. | Best-case of renewable energy utilization for the production process. | 94.9% of the available renewable energy. | Sensitivity analysis of the renewable energy demand in different production scenarios. |
| Average Queue Time | µF,1 | 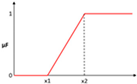 | Queue time in (seconds/production hour), which offers no production flexibility. | 173.4 s/production hour | Queue time in (seconds/production hour), which offers high production flexibility. | 768.2 s/production hour | Sensitivity analysis of the queue time in different production scenarios for the production system. |
| Use of Recycled Carrier | µS,2 | 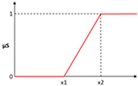 | Minimally acceptable reuse of internal and external carriers for the material preparation in (carriers). | 75% of the total used carriers for the production process. | Best-case of reuse of internal and external carriers for the material preparation in (carriers). | 90% of the total used carriers for the production process. | Set by production planner based on forecast product data and customer requests. |
| Total Product Output | µF,2 | 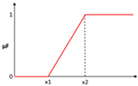 | Minimally product output, which offers no flexibility (products/hour). | Production output goal | Maximal possible production output (products/hour). | 120% of the production output goal | Set by production planner based on forecast product data and customer requests. |
| Accumulated Work Load Peak | µS,3 | 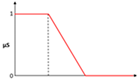 | Low work intensity | 250 kJ | Medium workload | 500 kJ | Empirical data from literature [54] |
| Average Queue Time Warehouse | µF,3 | 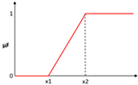 | Queue time in (seconds/ production hour), which offers no production flexibility. | 225.0 s/ production hour | Queue time in (seconds/production hour), which offers high production flexibility. | 772.0 s/ production hour | Sensitivity analysis of the queue time in different production scenarios for the warehouse process. |
Table 8.
Results for the low utilization of the production system.
| Variable | Value | Fuzzy Value | Aggregated Fuzzy Value (1. Step) | Aggregated Fuzzy Value (2. Step) | Defuzzification (Model Outcome) |
|---|---|---|---|---|---|
| f | 10 Products/hour | 1 | 1 | 0.501 | Potential to improve the production program´s sustainability is Medium. |
| µS,1 | 4.42 kWh (81.1%) | 0 | 0.501 | ||
| µF,1 | 173.4 s | 0.001 | |||
| µS,2 | 12 Carriers | 1 | 0 | ||
| µF,2 | 10 Products/hour | 0.444 | |||
| µS,3 | 124.16 kJ | 1 | 0 | ||
| µF,3 | 225 s | 0.003 |
Table 9.
Results for the full utilization of the production system.
| Variable | Value | Fuzzy Value | Aggregated Fuzzy Value (1. Step) | Aggregated Fuzzy Value (2. Step) | Defuzzification (Model Outcome) |
|---|---|---|---|---|---|
| f | 32 Products/hour | 1 | 1 | 0.833 | Potential to improve the production program´s sustainability is high. |
| µS,1 | 12.48 kWh (83.2%) | 0 | 0.808 | ||
| µF,1 | 539.2 | 0.617 | |||
| µS,2 | 21 | 0 | 0.833 | ||
| µF,2 | 32 | 0.667 | |||
| µS,3 | 376.7 kJ | 0.493 | 0.442 | ||
| µF,3 | 630 s | 0.743 |
Publisher’s Note: MDPI stays neutral with regard to jurisdictional claims in published maps and institutional affiliations. |
© 2021 by the authors. Licensee MDPI, Basel, Switzerland. This article is an open access article distributed under the terms and conditions of the Creative Commons Attribution (CC BY) license (http://creativecommons.org/licenses/by/4.0/).
Share and Cite
MDPI and ACS Style
Zarte, M.; Pechmann, A.; Nunes, I.L. Fuzzy Inference Model for Decision Support in Sustainable Production Planning Processes—A Case Study. Sustainability 2021, 13, 1355. https://doi.org/10.3390/su13031355
AMA Style
Zarte M, Pechmann A, Nunes IL. Fuzzy Inference Model for Decision Support in Sustainable Production Planning Processes—A Case Study. Sustainability. 2021; 13(3):1355. https://doi.org/10.3390/su13031355
Chicago/Turabian StyleZarte, Maximilian, Agnes Pechmann, and Isabel L. Nunes. 2021. "Fuzzy Inference Model for Decision Support in Sustainable Production Planning Processes—A Case Study" Sustainability 13, no. 3: 1355. https://doi.org/10.3390/su13031355
Note that from the first issue of 2016, this journal uses article numbers instead of page numbers. See further details here.