1. Introduction
One of the main strategic goals of the development of energy systems in the world today is the course towards energy conservation and the introduction of information technologies [
1,
2,
3] that increase the interaction between the consumer and the energy system [
4]. The introduction of information technologies such as big data and the Internet of Things (IoT) will optimize the demand response process and increase the overall level of energy efficiency [
5], improve the quality and availability of electricity for users, and popularize energy efficient thinking among energy consumers. However, the issues of applying demand response today have a number of unsolved problems associated with stimulating the involvement of consumers in the creation of mechanisms for the flexibility of power systems [
6]. The need to create and develop demand response technology is due to the changes that are taking place in the power systems of the whole world; however, there are also local reasons. The need for digital transformation in the Russian electric power industry is caused by global and local trends and meets a number of challenges along the way.
Global challenges include:
Local factors include:
The lack of regulatory, organizational, and technical solutions in managing the demand of consumers in the retail market (medium and small consumers, the household sector) leads to a decrease in the significant potential of demand response.
Low involvement of consumers in the introduction of demand response programs, as the majority of qualified participants in the wholesale electricity market are already using the potential of flexibility of their consumption to reduce costs.
Inability to meet the minimum capacity requirements required to participate in the demand response of the retail (sometimes wholesale) consumer of the market at the individual level.
High costs of interaction with infrastructure organizations (system operator) of small and medium-sized consumers, since the costs of such interaction are too high relative to the small volume of unloading provided by these consumers.
The great complexity of the rules of the wholesale markets for the retail consumer.
Lack of interface between the infrastructure of the wholesale market and the consumer of the retail market.
Unification and approval of requirements for commercial metering of electricity to adequately control the unloading of retail consumers.
The absence at this stage of development of independent organizations with a full range of necessary competencies. Lack of technical requirements for the participation of consumers (aggregators) in the provision of services to ensure system reliability [
9].
Overcoming these challenges that prevent retail consumers from participating in demand response is possible by creating load aggregators [
10]. The load aggregator enters into agreements with consumers of the retail market for the provision of services to change the load of their equipment. The aggregator receives a signal from the infrastructure organizations of the wholesale market to reduce the load in a certain volume, distributes this volume among the participating consumers and gives them a signal to change the load when appropriate economic conditions arise. The consumer load changes by a certain amount during a given time interval. The aggregator receives payment in the electricity and capacity (or system services) market for reducing electricity consumption or increasing generation. The consumer receives payment for services to change consumption from the aggregator in accordance with the service agreement concluded between them. Thus, the load aggregator:
searches for consumers who are potentially capable of changing consumption without prejudice to the technological cycle, assesses the unloading possibilities available to consumers, develops optimal algorithms for participation in demand response programs, equips consumers with automation tools, instruments and devices;
enters into contracts with consumers for the provision of services by the latter to change consumption on an unregulated commercial basis;
acts as an agent in the wholesale market (or in the provision of services to ensure system reliability);
provides on the wholesale market a resource for joint change in the load of a group of consumers in the form of a single element, is responsible for fulfilling obligations on the wholesale market;
the load aggregator receives signals for changes in consumption (in the form of load graphs, dispatch commands, etc.) from infrastructural organizations in accordance with all the requirements and transmits them to the consumer in a convenient format;
the load aggregator, being a full-fledged participant in the wholesale market, receives income from operating in the market (or from the provision of services to ensure system reliability) and pays part of it to retail consumers.
Given the emergence of an increasing number of IoT devices in the distribution systems of power supply to consumers, methodological approaches are needed to justify, develop and apply demand response technology. The main demand response tool is load curve management. To participate in the demand response program, distributed generation sources, energy storage, are used, which allows to follow the decarbonization path and increase the cost and reliability of generation, as shown in [
11] it also uses direct load reduction due to equipment shutdown, as well as load redistribution during the day.
This article [
12] provides an overview of the various initiatives, methods, impacts, and developments of the demand response of electrical power systems. The potential benefits of implementing demand response in power grids are presented, and an extensive literature review is provided on the impact of demand response on power system reliability. The article concludes that the introduction of demand response improves economic, environmental, and market performance and reliability. The authors of the article [
13] analyzed the need to implement demand response methods to increase the reliability and cost-effectiveness of existing generation sources. The article discusses the following ways of demand response: peak clipping, valley filling, load shifting, energy efficiency, strategic load growth, and flexible load shape. According to the results of [
13], the Load shifting model is the most effective model for increasing the reliability of generation sources. The authors of the article [
14] consider such demand management methods as peak-shaving and valley-filling in order to minimize energy losses on buses in electrical networks. The article [
15] discusses the combined use of Battery energy storage systems (BESS) and demand response (DR), which creates the prospect for the development of demand response to reduce and offset peaks in power consumption. According to the above sources, the demand management program has broad development prospects what confirms the relevance of our study.
1.1. Overview of Demand Response Research
The calculation of the optimal base load for the residential sector is discussed in article [
10]. Also, for the redistribution of loads during the day, a complex of RES and EESS is used [
16], which can store electricity during the hours when the power system loads are reduced and compensate for peaks in consumption. For this purpose, the authors of the article [
17] combine a forecasting algorithm to optimize the operation of renewable energy sources in conjunction with EESS. However, the use of RES and EESS today at the level of each consumer is impractical due to the high cost of these energy sources for consumers in the retail market. In this regard, it is necessary to use a managed load resource, which is targeted by the load aggregation and demand response program [
18].
Tariff regulation is used to optimize the electricity consumption schedule for residential consumers through economic incentives. The use of tariff regulation as part of a demand response program is discussed in [
19].
To control the load within an industrial enterprise, there are many algorithms for load redistribution, both by direct control by determining the optimal load [
20], and by planning power consumption [
21].
However, the key point for a demand response system is the factor of comfort and the appropriateness of the use of electricity by consumers. Residential consumers are not always ready to rebuild their schedules for the use of power consumers, even with tariff incentives. Separately, it is worth highlighting educational institutions for which the priority task is planning and adherence to the educational process, which complicates participation in the demand response program since it is impossible to change the curriculum in a short time.
The article [
22] presents a method for transferring power consumption peaks for the educational campus; however, it does not take into account the many consequences that will entail a change in the educational process. In addition, the peak consumption of the end user may not always coincide with the peak load of the power system, which determines the hours of use of the demand response system. Most often, the planning of the schedule of classes, which largely determines the power consumption of educational institutions, is carried out using a genetic algorithm [
23,
24,
25]. However, in the context of the development of renewable energy sources, as well as the requirements for improving the energy efficiency of consumers, which are developing more actively than ever before, the disadvantage of the methods used is the need to consider energy consumption for planning the curriculum of educational institutions.
The purpose of this study is to develop an algorithm for optimizing the university’s power consumption schedule, taking into account the forecasting of power system loads in order to participate in the demand response program.
By responding to signals from the unified power system about the need to reduce and redistribute the load during peak hours and considering the need for sustainable development of energy systems, educational institutions, especially the engineering profile, are beginning to play an important role in improving the efficiency of the entire electricity life cycle chain [
26]. The role in fostering an energy-efficient lifestyle based on understanding and trust in the mechanisms of demand response and their role in achieving sustainable development is extremely important and subsequently will bring not only a direct technological but also a significant social effect [
27,
28]. By implementing, developing, and involving young researchers, students, active workers, it is possible to realize the achievement of effects from the application of demand response directly in the learning process. Given the trends in the sustainable development of energy systems based on decarbonization, energy conservation, decentralization, and digitalization technologies, the use of digital technologies in demand response is currently a relevant topic [
29,
30,
31,
32].
1.2. Overview of Platforms
The development of demand response systems is based on close information communication with the user, and on the integration of information systems of the power system and the user through the IoT. Studying the world experience, we can conclude that IoT software platforms for data analysis have already begun to be implemented by such well-known world companies as MindSphere—from Siemens (Berlin, Germany); Predix—GeneralElectric (Boston, MA, USA) company; ThingWorx, developed by PTC (Boston, ON, Canada); WatsonIoT, created by IBM (Armonk, NY, USA); KepServerEX by Kepware (Portland, OR, USA).
An analysis of the cases of companies implementing and implementing demand response, and an overview of typical platforms in the electric power services market, presented, among other things, in [
33], allowed us to study the possibilities of their technical implementation, highlighting the advantages and disadvantages. Thus, the following platforms can be distinguished, on the basis of which the implementation of the methodology considered in this study is possible.
RedLAB (Demand Response Platform) software (version 4.3) enables power consumption monitoring, cloud communication, visualization, and load management with low-cost, dedicated hardware. This solution is built on the basis of an artificial neural network by the backpropagation method for analysis and short-term prediction of electrical load [
34].
The Honeywell (Morristown, NJ, USA) project demonstrates the performance of an automated demand response (ADR) platform across an enterprise. This project differs from other Smart Grid projects in that it focuses both on developing an ADR hardware and software platform to respond quickly to demand and on attracting and training ADR customers to participate in utility-sponsored energy conservation programs. This project was focused not on private consumers, but on large commercial, industrial, and institutional consumers with an average power consumption of 200 kW or more [
35].
The GridBeyond platform (Houston, TX, USA) is an aggregator and technology platform for automated demand response that monitors and automates energy consumption using machine learning technology. It includes, among others, local hardware devices, cloud software, an energy portal for customers, and fully automates the shift in energy consumption, making energy management strategies more efficient. Utilities are using the GridBeyond platform to offer their corporate customers new services to increase energy flexibility [
36].
In addition, when implementing the concept of demand response, it is necessary to take into account the preservation of quality and voltage level when the load changes. Quality issues, stability, harmonics, etc. reviewed in [
37,
38,
39,
40,
41].
It should be noted that demand response has a positive effect on the state of the energy infrastructure, and it is necessary to take into account the influence of this technology when modernizing or designing new facilities both on the consumption side and at sources, including distributed generation [
42]. The opposite effect can also be observed, with the modernization of infrastructure and electrification, it is possible to create more flexibility for the end user [
43].
By 2025, the global market for demand response services will grow 3.5 times compared to 2018—up to 144 GW, the realistically achievable and economically viable demand response potential for the UES of Russia may amount to 4–6 GW. The trend of increasing demand response market, covering not only industry but also individual households. The experience of introducing practice in the retail market in Russia has shown that for the normal functioning of this program, not only a methodological approach to the creation of algorithms, descriptions of user behavior, and close information communication of all participants is needed, but also a number of changes in the regulatory framework of the Russian Federation.
1.3. Analysis of Normative and Technical Documentation and Legislative Acts
A review of domestic and foreign legislative frameworks in the field of demand response, as well as an analysis of changes in technical documentation and standards of the system operator, allowed the authors of this study to develop recommendations for the revision of the legal framework for regulating electricity metering.
For the full deployment of demand response mechanisms, it is necessary to expand the range of services that the demand response aggregator can provide throughout its entire life cycle, as well as the creation of guidelines for the formation of load schedules and behavioral motivation of users.
As part of the review of the world’s best legal practices, it is worth paying special attention to the legislation of the Federal Republic of Germany. Germany’s legal framework for the electricity sector is dynamically developing [
44]. The latest innovations in the legislation regarding generating capacities determine measures to support and stimulate the construction of certain types of generation in relation to the selected location [
45].
Demand response has been officially enshrined in the legislative framework as one of the forms of interaction between the subjects of the electricity market since July 2021. However, the imperfection of the current legislative framework is that there is no detailed study and architecture of interaction between individuals. Until now, the market for network services, in particular for demand response remains closed to private users. Indeed, the variety of physical users of electricity, their preferences, routines, and views are quite extensive and require flexible approaches in building strategies for managing periods of consumption.
1.4. Pilot Project on Demand Response in Russia
The pilot project for demand response is defined by Russian legislation as part of the provision of services to ensure system reliability and is valid from 1 July 2019 to 31 December 2022. Based on the results of the pilot project, the conditions and procedure for the participation of demand aggregators in the wholesale electricity and capacity market (WECM) will be determined. As of February 2020, the report of SO UES JSC on the price reduction in the day-ahead market, taking into account the impact of demand response, was published (
Table 1):
The average day-ahead market price decline since the start of the demand aggregator pilot is 2.87%. As of July 2021, during the pilot project, 70 aggregator companies took part in it, representing the interests of over 350 management objects, and the geographical coverage exceeded 50 regions of Russia. In total, since the third quarter of 2019, the volume of demand response resources has increased 20 times—from 48 MW to 963 MW based on the selection results for the third quarter of 2021 [
46].
Thus, there is a trend towards an increase in the aggregate capacity involved in demand response, which increases the aggregate economic effect. According to
Table 1, there is a regular decrease in prices in the day-ahead market with the participation of demand aggregators, which leads to an additional economic effect for electricity consumers due to the removal of less efficient equipment from the generation.
Based on the results of the study of the pilot project, the possible risks of introducing the concept of demand response in the Russian market are highlighted:
lack of specific competencies unique to this type of activity;
consumer’s inability to qualitatively assess the available opportunity to obtain commercial benefits due to changes in energy consumption;
lack of awareness of the consumer about modern technologies that allow to form (or increase) the regulatory capacity;
lack of mechanisms for translating the economic effect obtained from changes in consumption back to the consumer;
dependence on investment in the development of this technology, competencies, legal and legislative mechanisms, infrastructure;
decrease in system reliability, since the pilot project does not have a system of direct penalties for non-compliance with demand response obligations. The total capacity of consumers participating in aggregated load management in the pilot project should not exceed 1% of the demand for capacity in the corresponding price zone of the wholesale electricity market;
lack of an approved methodology for determining the volume of power reduction when participating in aggregated load management for residential apartments and small households.
The unwillingness of the state, companies, and the population to introduce digital technologies in the energy sector and to change the approach to energy consumption leads to the emergence of a large number of risks that impede the large-scale use of the concept of demand response in the Russian market. Following the goals of sustainable development and transformation of the electric power complex in the new paradigm is impossible without the active involvement of consumers. Gradually, through the introduction of legislation and regulations, the involvement of companies is increasing, and a conscious approach is growing due to the large-scale popularization of reasonable consumption and energy efficiency. However, the lack of research on the study of the characteristics of the behavior of various consumers from the standpoint of involvement in flexible load management does not allow to fully use all current potential opportunities [
47,
48].
2. Materials and Methods
The study proposes to consider the possibility of participating in the concept of demand response for such an object as an educational institution of higher education, with a typical workweek schedule, which includes not only low-power installations typical for office buildings, but also laboratory installations with electromechanical, heating, and other equipment. To conduct a study and build a concept for the implementation of consumption flexibility control, physical, information, and simulation models were considered and an algorithm for the operation of the application for collecting and processing power consumption data and a load-planning algorithm were developed, including all levels of interaction between devices.
Thus, the objectives of the study are:
Research of physical and construction of information and simulation models of the research object (laboratories and educational buildings of an educational institution).
Analysis of load curves and comparison of the coefficients of the schedules before and after the implementation of the concept of demand response.
Formation of an algorithm for the operation of the application for the collection and processing of energy consumption data.
Building a forecast of power consumption in the power system and power consumption of the research object in order to identify the period of the total peak load.
Preparation of recommendations for the formation of the load schedule and development of the load-planning algorithm, which will allow, based on the forecast of power consumption, to form and optimize the construction of the schedule of laboratory classes for a week in advance.
Calculation of economic efficiency, taking into account the transfer of the time of laboratory studies during the day with different tariff regulations.
The study uses the following data and methods: statistical data of open services and sources, research on the use of digital and information technologies, analytical method, methods of mathematical modeling, methods of data analysis and generalization, statistical methods of data processing, theory of energy conservation and energy efficiency.
Because of the analysis of the load graphs and simulation modeling and based on the developed algorithms, it is proposed to optimize the scheduling and laboratory exercises, depending on the forecast of the power system load graph, to reduce peaks and level the load graph. The main regulation criteria are peak electricity and capacity consumption and the cost of payment for electricity and capacity.
The study was carried out sequentially, analyzing the physical model, that is, the directly connected load in laboratory 1 and laboratory 2, an information model that describes the transfer of data from intelligent control cabinets, the load data from which is transmitted to the cloud and then to a personal computer or another client device. as well as a simulation model that allows you to build graphs of the laboratory load and compare the laboratory load before and after the implementation of the concept of demand response and load redistribution.
2.1. Physical Model
The study considers the laboratories of the St. Petersburg Mining University (Saint Petersburg, Russia) as an object. Both laboratories include personal computers with developed electrical load control software (algorithm in Python programming language), router, laboratory input and distribution device, switchboard equipped with circuit breakers with remote control, digital electricity meters, and Schneider Electric data acquisition buses based on low-voltage modular system Acti9, distribution box and connected electrical load, which is shown in
Table 2 and
Table 3.
The load can be divided into groups:
- (1)
Load that consumes electricity during the working day, that is, with a continuous cycle of work;
- (2)
The load, which is included depending on the schedule of training sessions in the laboratory—with an uninterrupted and non-movable mode of operation;
- (3)
Load, tied to the schedule and type of activity with a non-movable, but interrupted consumption profile within the activity;
- (4)
The load, tied to the schedule and moved (shifted) within the classes, but without the possibility of interrupting the work;
- (5)
Load, tied to the schedule, moved within the lesson and interrupted in the course of work;
- (6)
A movable or shifting activity with all the active load attached to it.
The fourth type of load is the load located in laboratory 2, namely, a stand for testing hot standby control systems based on PLC MODICON and a stand for testing hot standby control systems based on PLC QUANTUM. The turn-on time of such a load can be adjusted during the day and during the lesson, which allows you to change the load schedule, optimize it depending on the signals from the unified power system to reduce the peaks of the electrical load.
2.2. Information Model
The architecture of the control system of intelligent low-voltage switchgear (LVS) of electricity is as follows and a detailed description is presented in [
49]. Data transfer is carried out according to the following scheme in
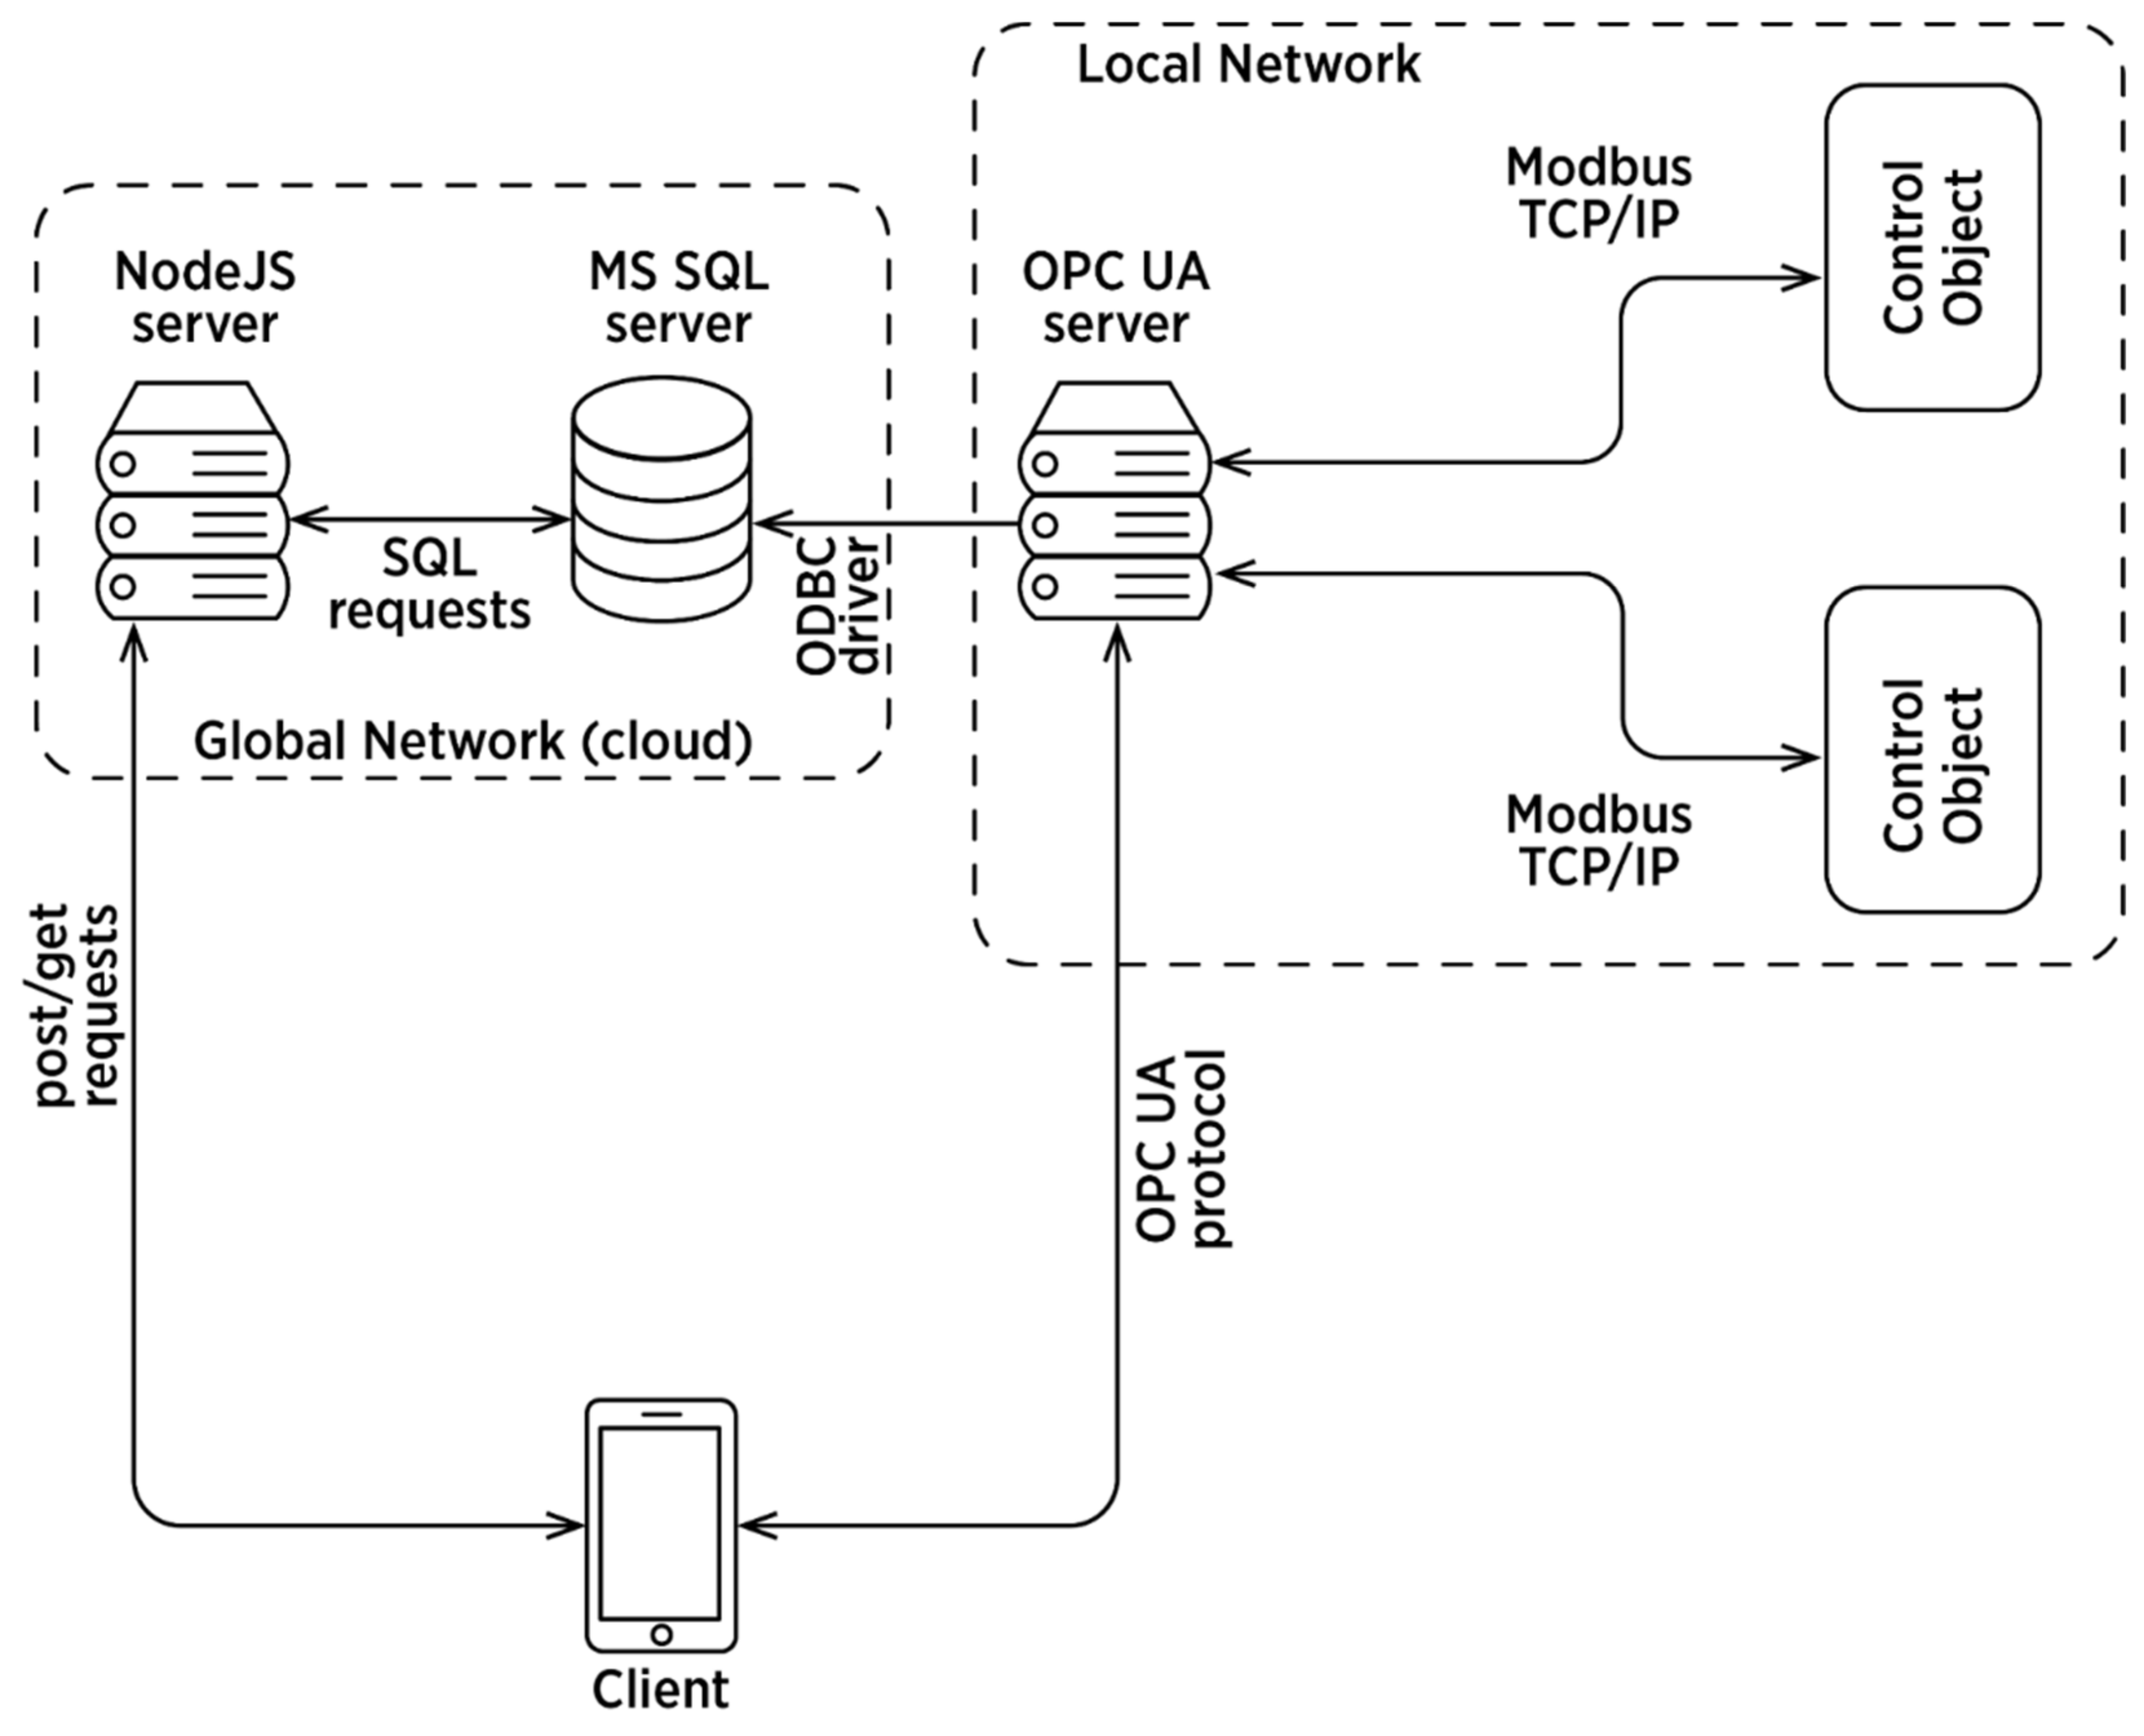
Figure 1 (all figures in the research were compiled by the authors):
The control objects are two intelligent LVS. Moreover, one of them includes equipment equipped with motorized circuit breakers. Since the system allows accumulating historical data, it is necessary to form a database. The MS SQL Server database is used. The client part of the system receives information based on SQL queries to the database, and MS SQL Server simplifies the deployment, transfer, and integration of big data. The developed database includes four tables: one for each distribution meter in the cabinet. All parameters recorded by the sensors (voltage, current, frequency, power factor, unbalance of currents and voltages, etc.) and the state of the low-voltage equipment of the switchboard via the Modbus TCP/IP protocol using the OPC UA server are saved in the MS SQL Server database.
Communication with LVS is based on the OPC UA protocol. The OPC UA server is located in the local network and is connected via Wi-Fi to a router connected to the devices from which information is collected. The OPC server was configured using the Kepware KEPServerEx software (version 6.6).
OPC UA Client is located on the client device and implemented in the C# programming language. The server part is implemented in the high-level programming language NodeJS in order to possibly expand the functionality and offload the client part of the system. In further studies, it is planned to take this server component outside the local network in order to have access to the installation parameters from any point where there will be access to the global network.
One of the most important tasks for ensuring reliable data collection and management of remote objects is protection against cyberattacks, which can provoke the receipt of false data from metering devices, as well as false control signals to power consumers, which will entail financial losses. The data transmission system is based on the IEC 61850 protocol, which defines the basic requirements for cybersecurity such as robustness, adaptability, and recoverability. The article [
50] discusses the types of cyberattacks to which the process of information exchange is subject to remote data collection and object management. If there is a threat of penetration into the local network with the subsequent distortion of information, the authors of the article recommend applying strict rules for accessing the network, as well as the correct configuration of the Firewall, and involving only certified specialists to set up the network. In the event that false signals have entered the system, the issues of stability and reliability of the controlled equipment are considered in [
51]. In such cases, the asset control code includes protection against cyberattacks.
Also, the issue of cybersecurity for digital twin systems that provide remote data collection and facility management is addressed in [
52,
53].
Based on the analysis of sources, the solution for the system proposed in this study to prevent cases of information substitution is comparing and contrasting the data that comes to the OPC server from the local network with the parameters/values that the operator sees from the database. If the SQL code was injected, then this method of comparing the parameters will allow detecting penetration into the cyber-level.
Upon detecting a successful cyberattack, the operator must report the penetration into the IT department, which monitors the information activity of the enterprise, and also perform a series of actions in accordance with the instructions, similar to situations when unexpected changes in the technological process occur.
In the event of a loss of connection with the elements that are in the global network (cloud), the object management (issuing control commands) will continue, since the OPC server is located in the local network, but the data will no longer be archived.
2.3. Simulation Model
As noted above, one of the factors preventing the full use of demand response mechanisms is the lack of consumer behavior patterns and digital profiles. This work implements an approach based on simulation modeling of the load behavior in the power supply system of the laboratory and on the information description, the mode of operation, and the schedule of classes, including the type of lesson (lecture, practice, laboratory, master class, etc.).
The simulation model was built using the MatLab Simulink software (version R2020a) package. The following blocks were used to create simulation models:
Step block, providing a step between two defined levels at the required time, this block with sufficient accuracy allows you to simulate the consumption of active power from the network;
Block Sum, which sums up a load of various groups of consumers;
Scope block used to display the load profile of laboratory classrooms.
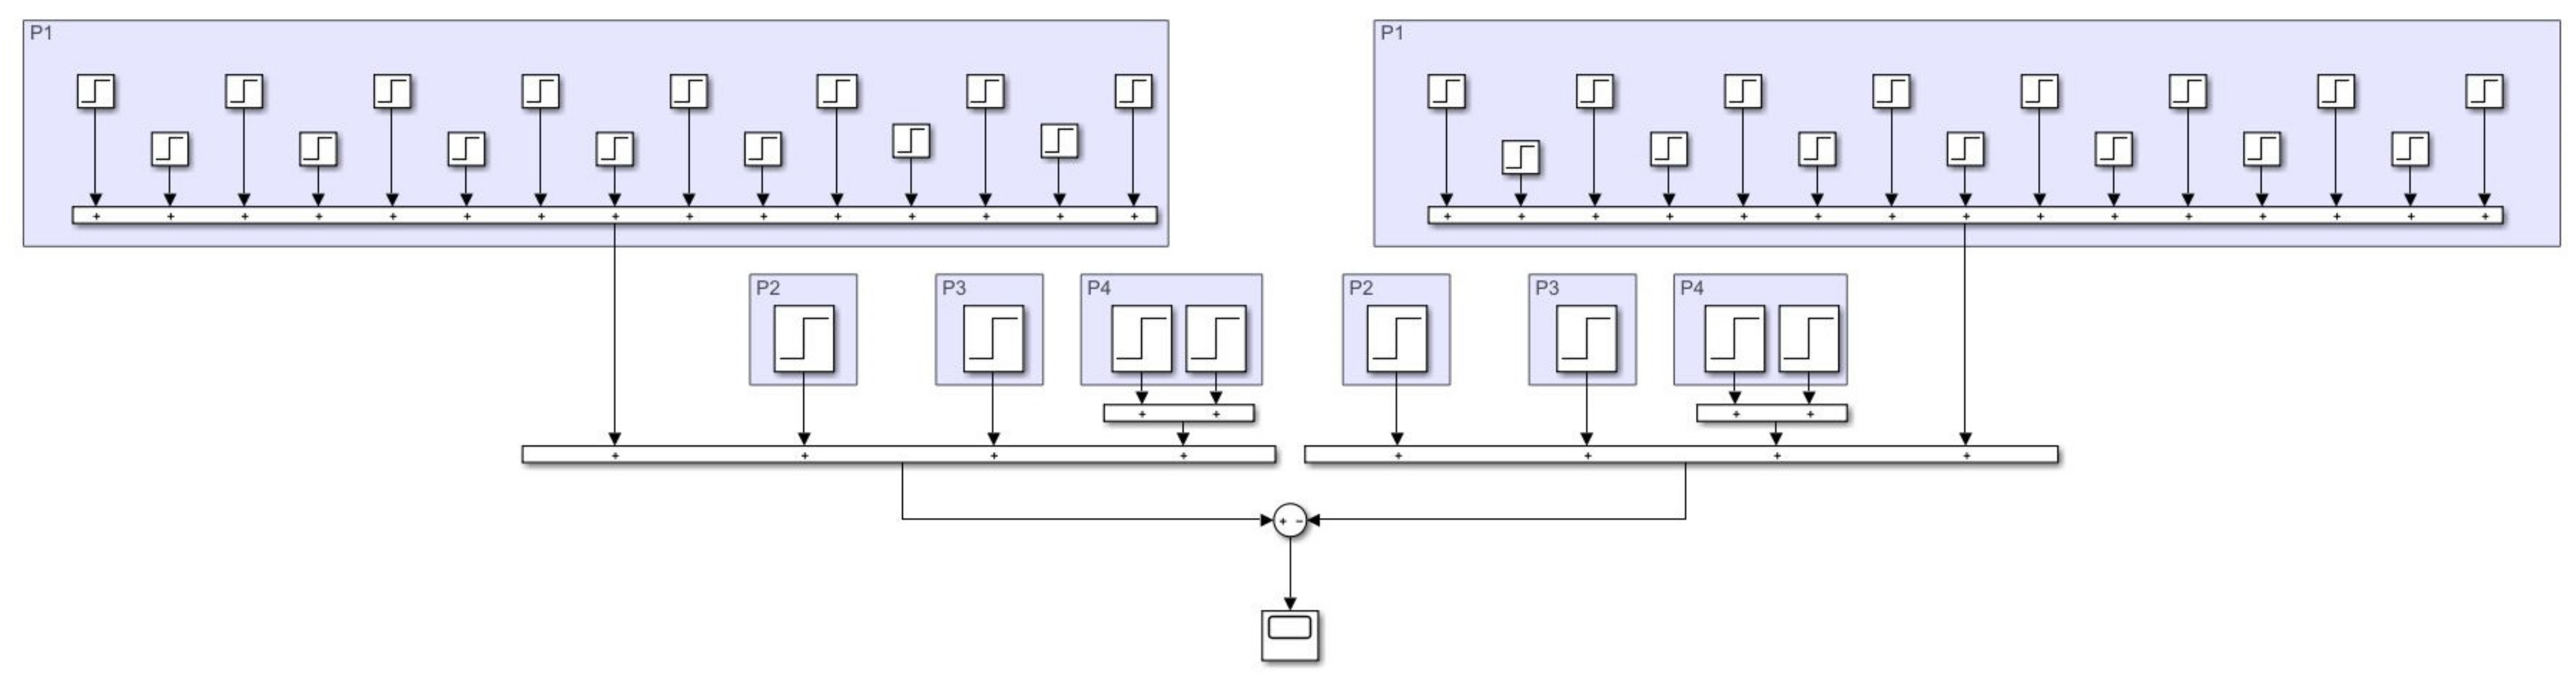
In laboratory 1 (
Figure 2), there is a constant load from 8:00 a.m. to 6:00 p.m. in connection with working personal computers, lighting, a projector, a screen for a projector. It is also possible to connect consumers with a three-phase load, but since there were no laboratory stands of this kind at the time of the simulation, they were not taken into account. When forecasting energy consumption, it is worth considering the fact that laboratories can play a key role during peak consumption with three-phase power consumers.
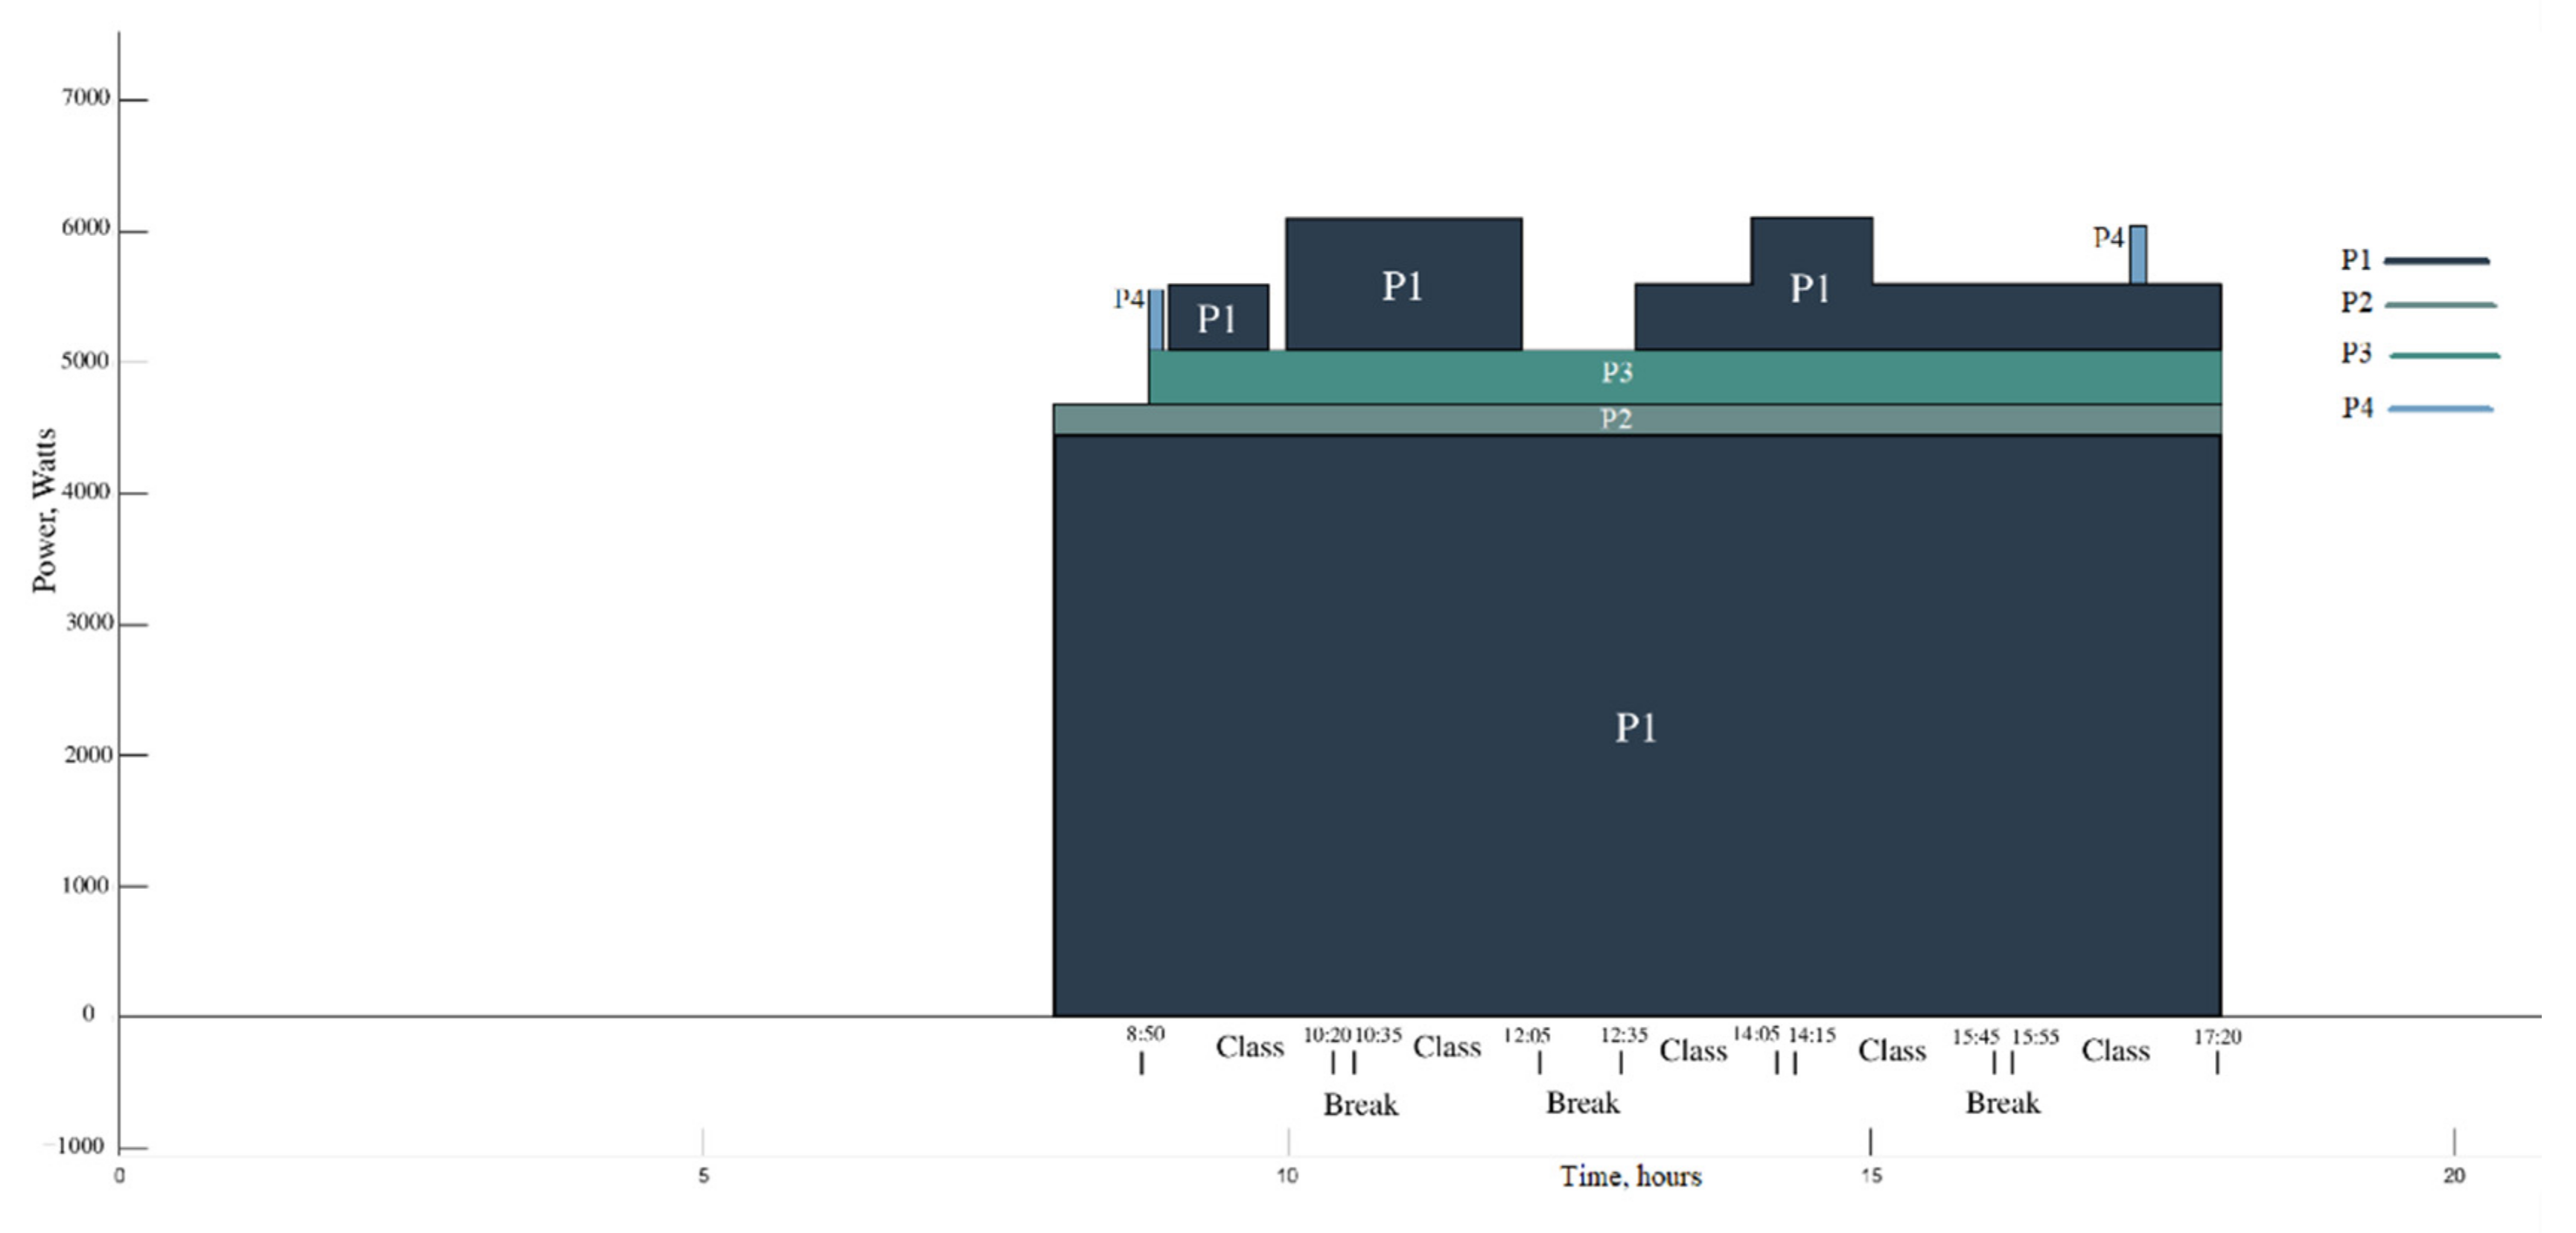
On the load graph (
Figure 3), the lights (P2) and 15 computers (P1) are turned on at 8:00 a.m, which is the main load in laboratory 1. Then, at the start of classes at 8:50 a.m., the projector (P3) and screen for the projector (P4) are turned on, which are turned off at 6:00 p.m. after the end of the working day. It is worth noting that there are no pronounced peaks in power consumption on the oscillogram, but there is some potential load in the audience that can participate in demand response.
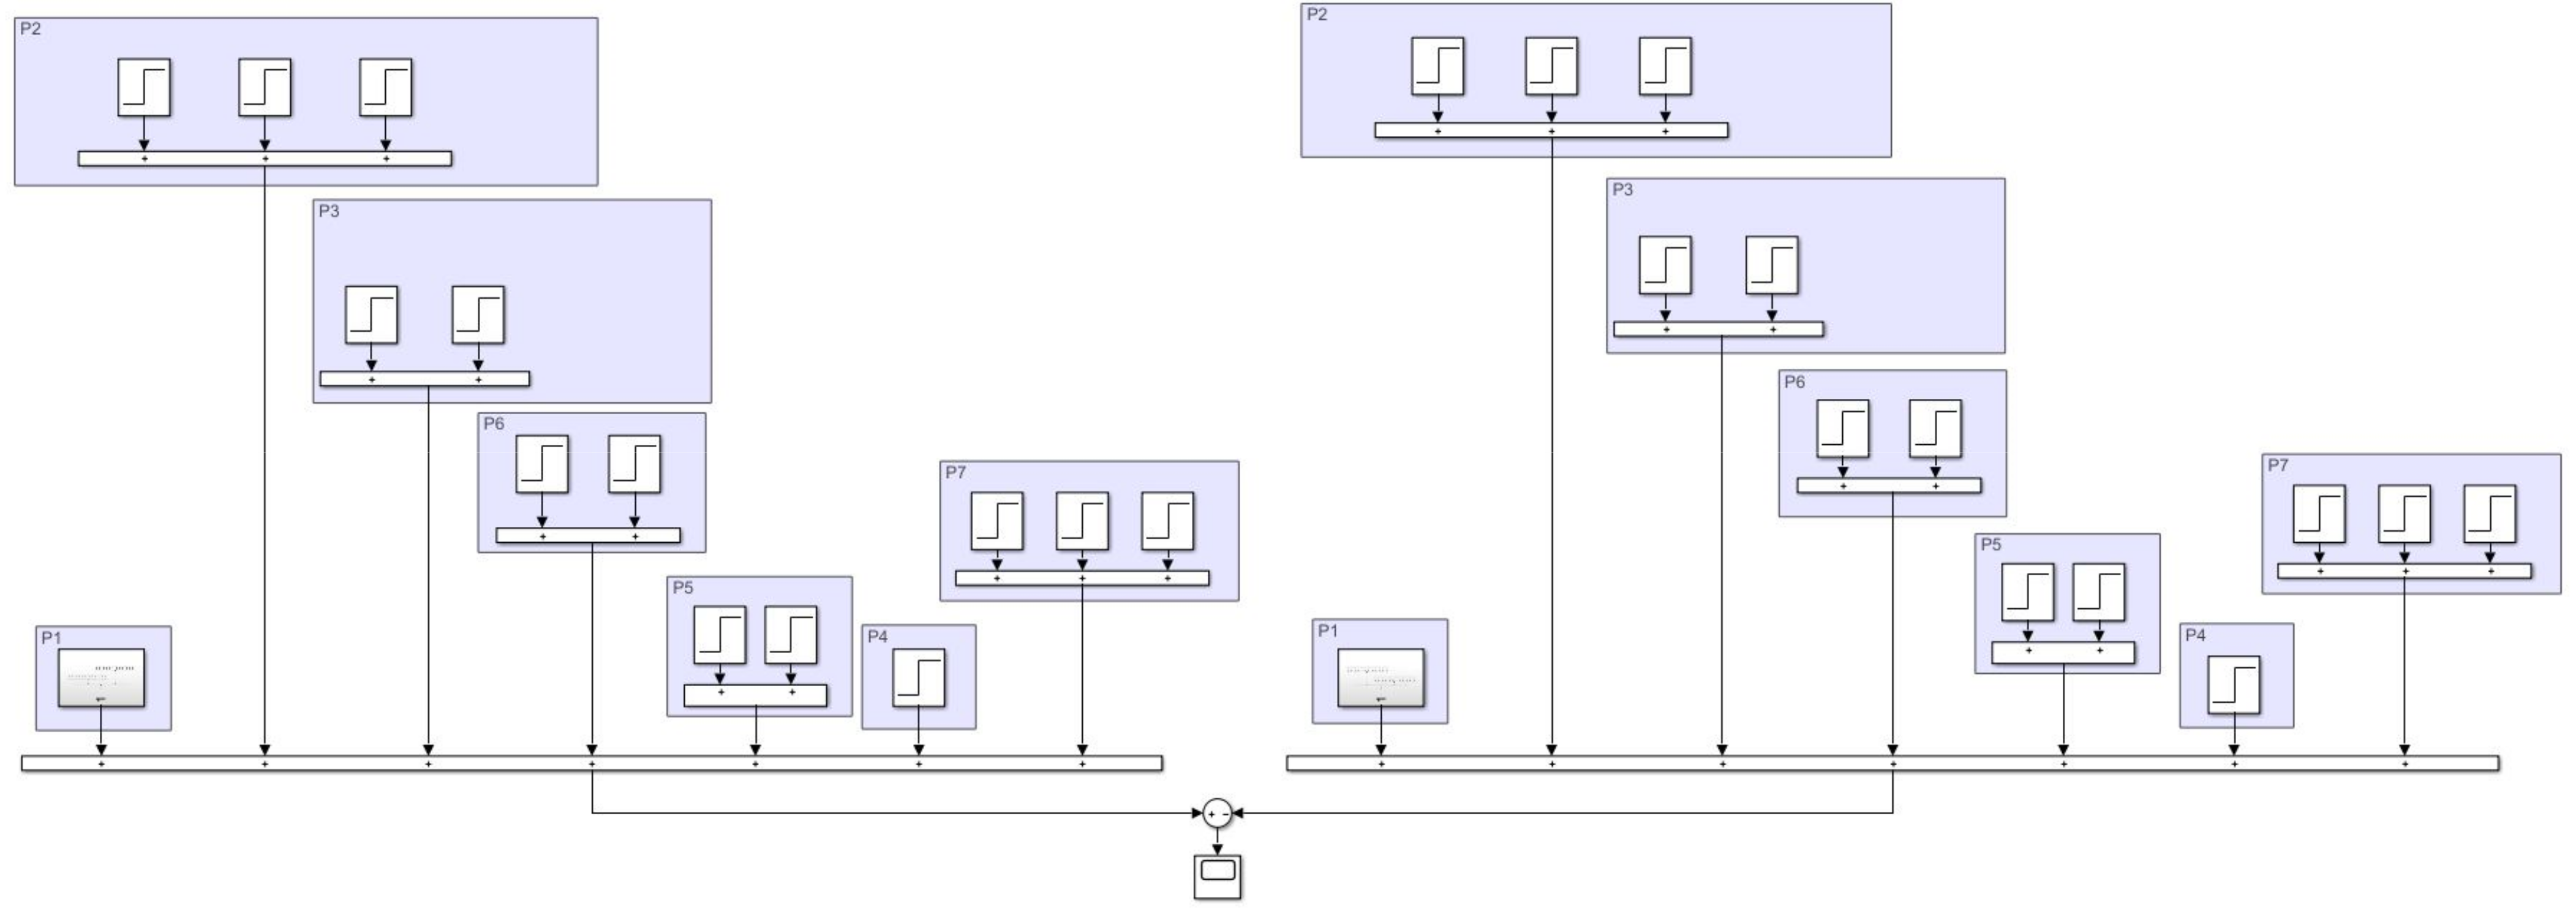
In the model of the next laboratory (
Figure 4) there are laboratory benches: a stand for testing hot standby control systems based on PLC MODICON and a stand for testing hot standby control systems based on PLC QUANTUM, this load refers to the types of moving load.
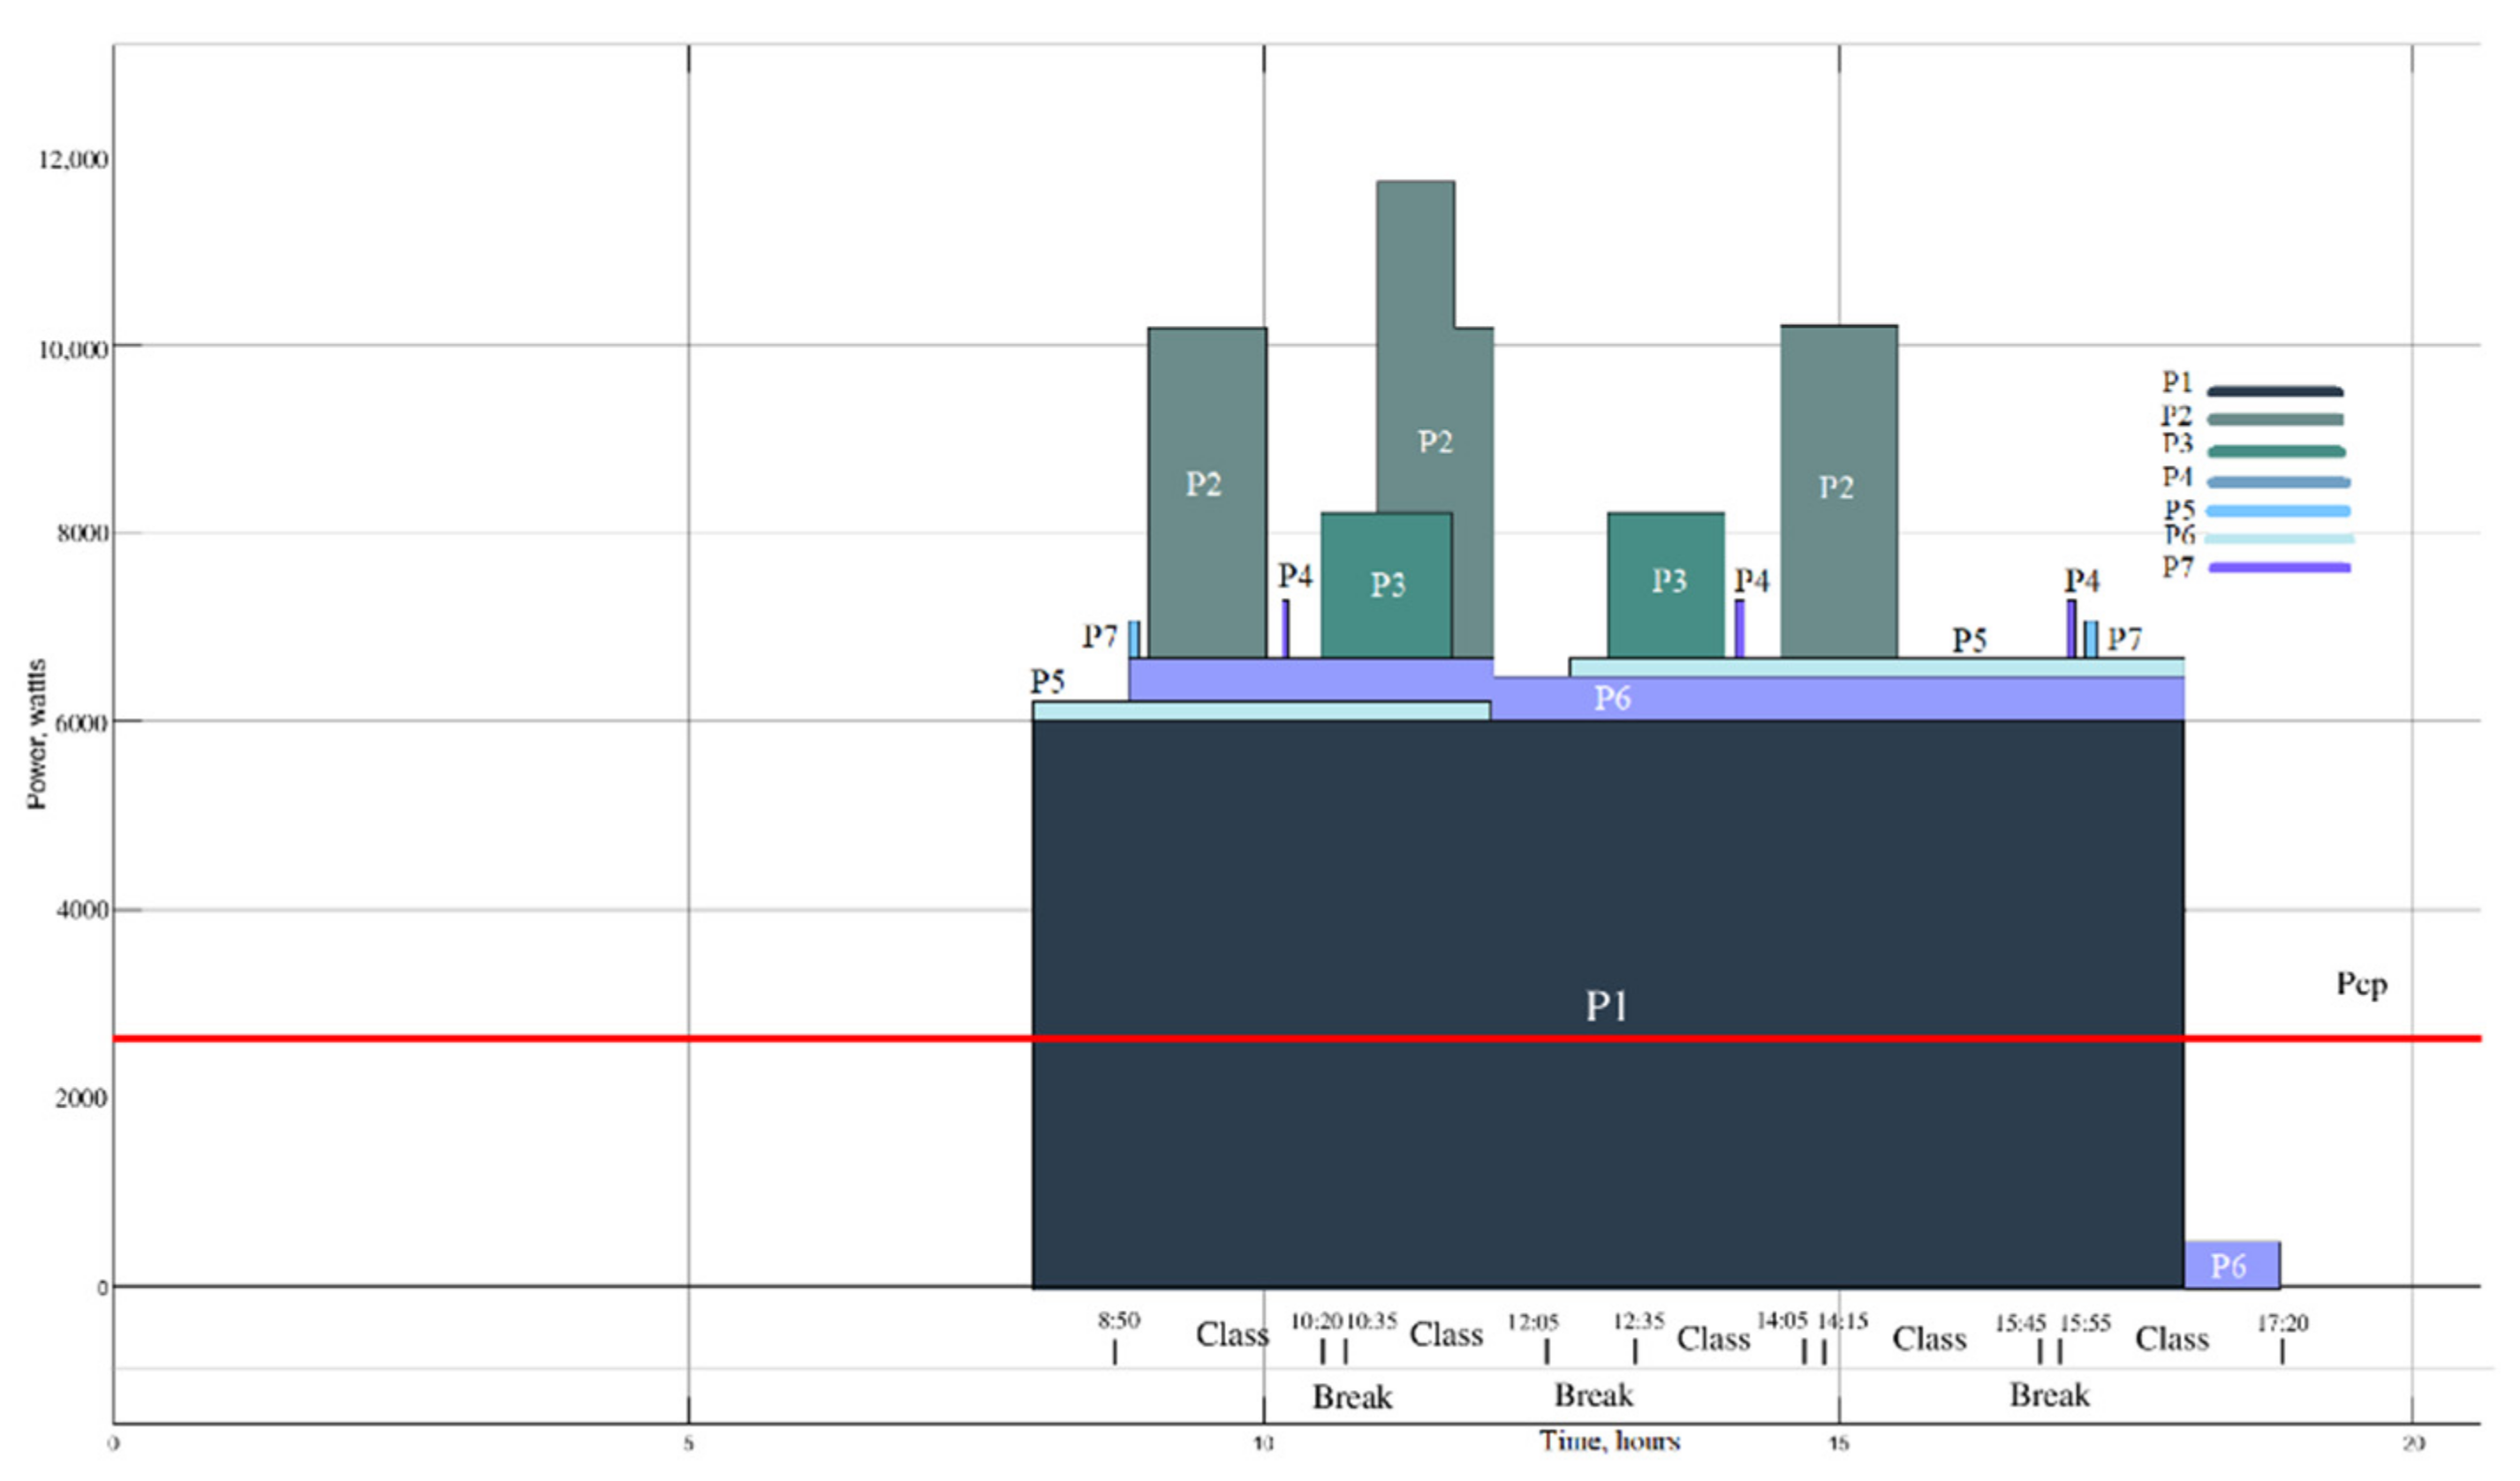
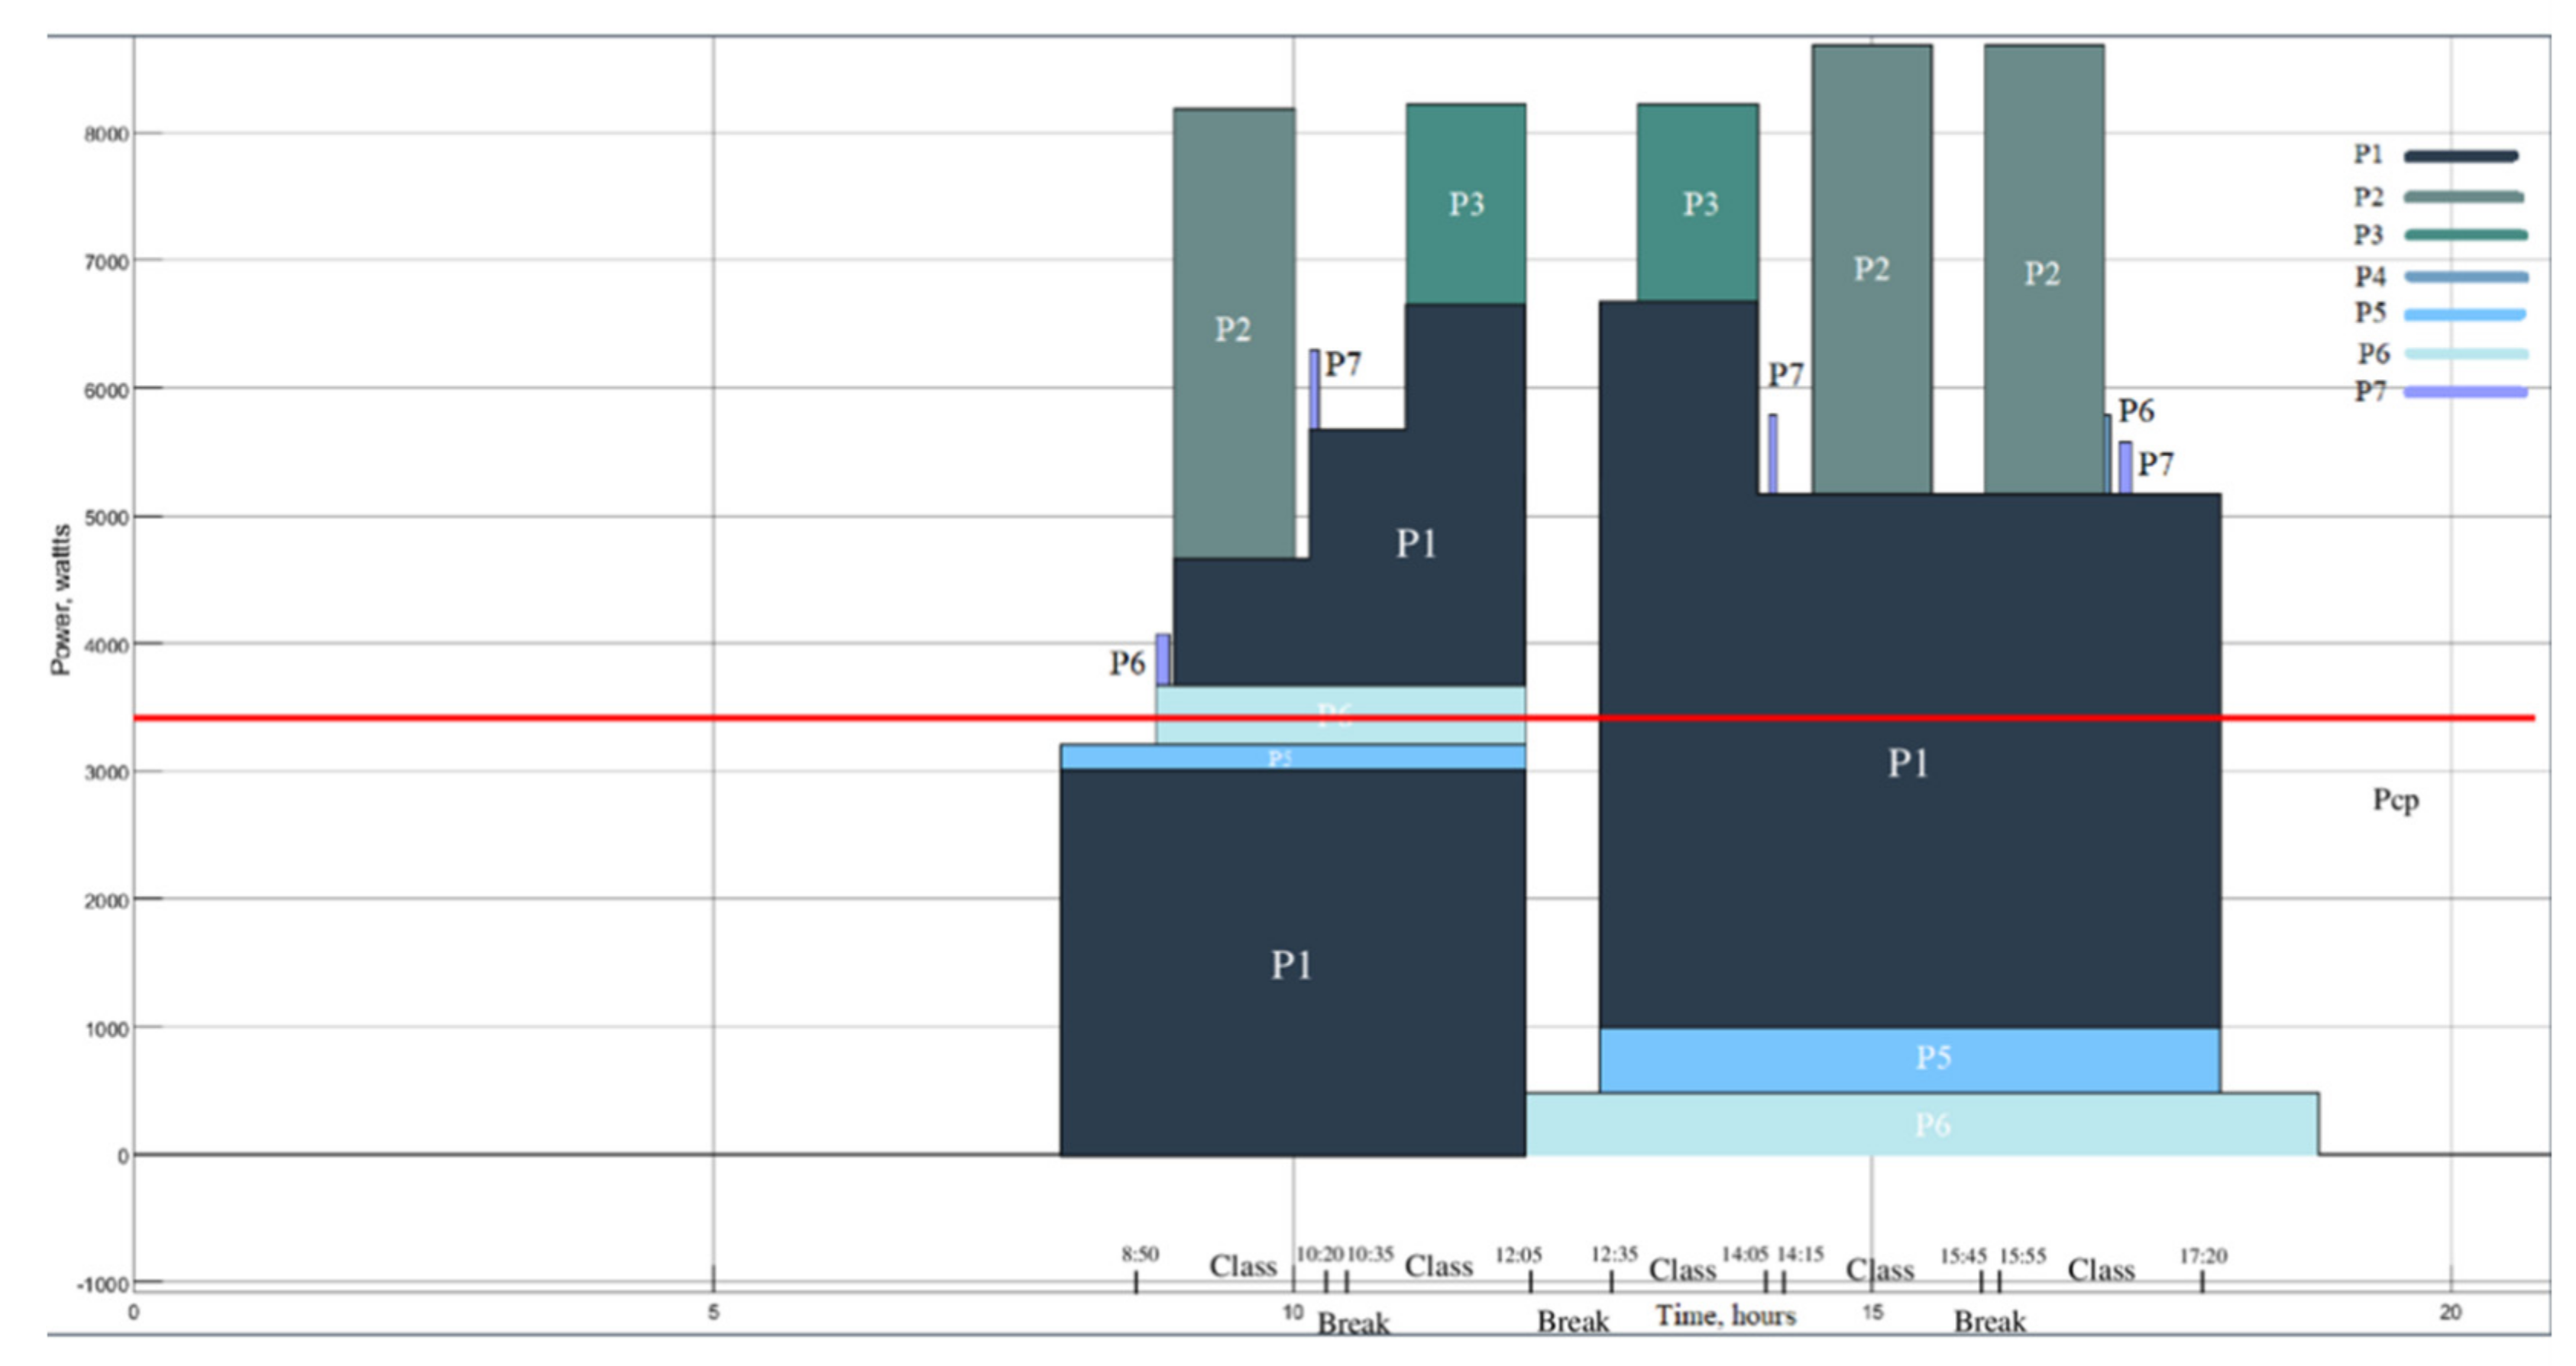
The oscillogram (
Figure 5) shows that in the middle of the working day there is a peak in electricity consumption in laboratory 2 from 10:30 a.m. to 12:00 a.m. If all laboratories operate with a similar load profile, then the university as a whole will also see a peak in consumption. The maximum power consumption is 11,700 watts. This is due to the fact that at this time two powerful consumers are used in laboratory classes, and for this reason, it is advisable to change the duration of classes or schedule the work of the classrooms for a different time.
3. Case Study
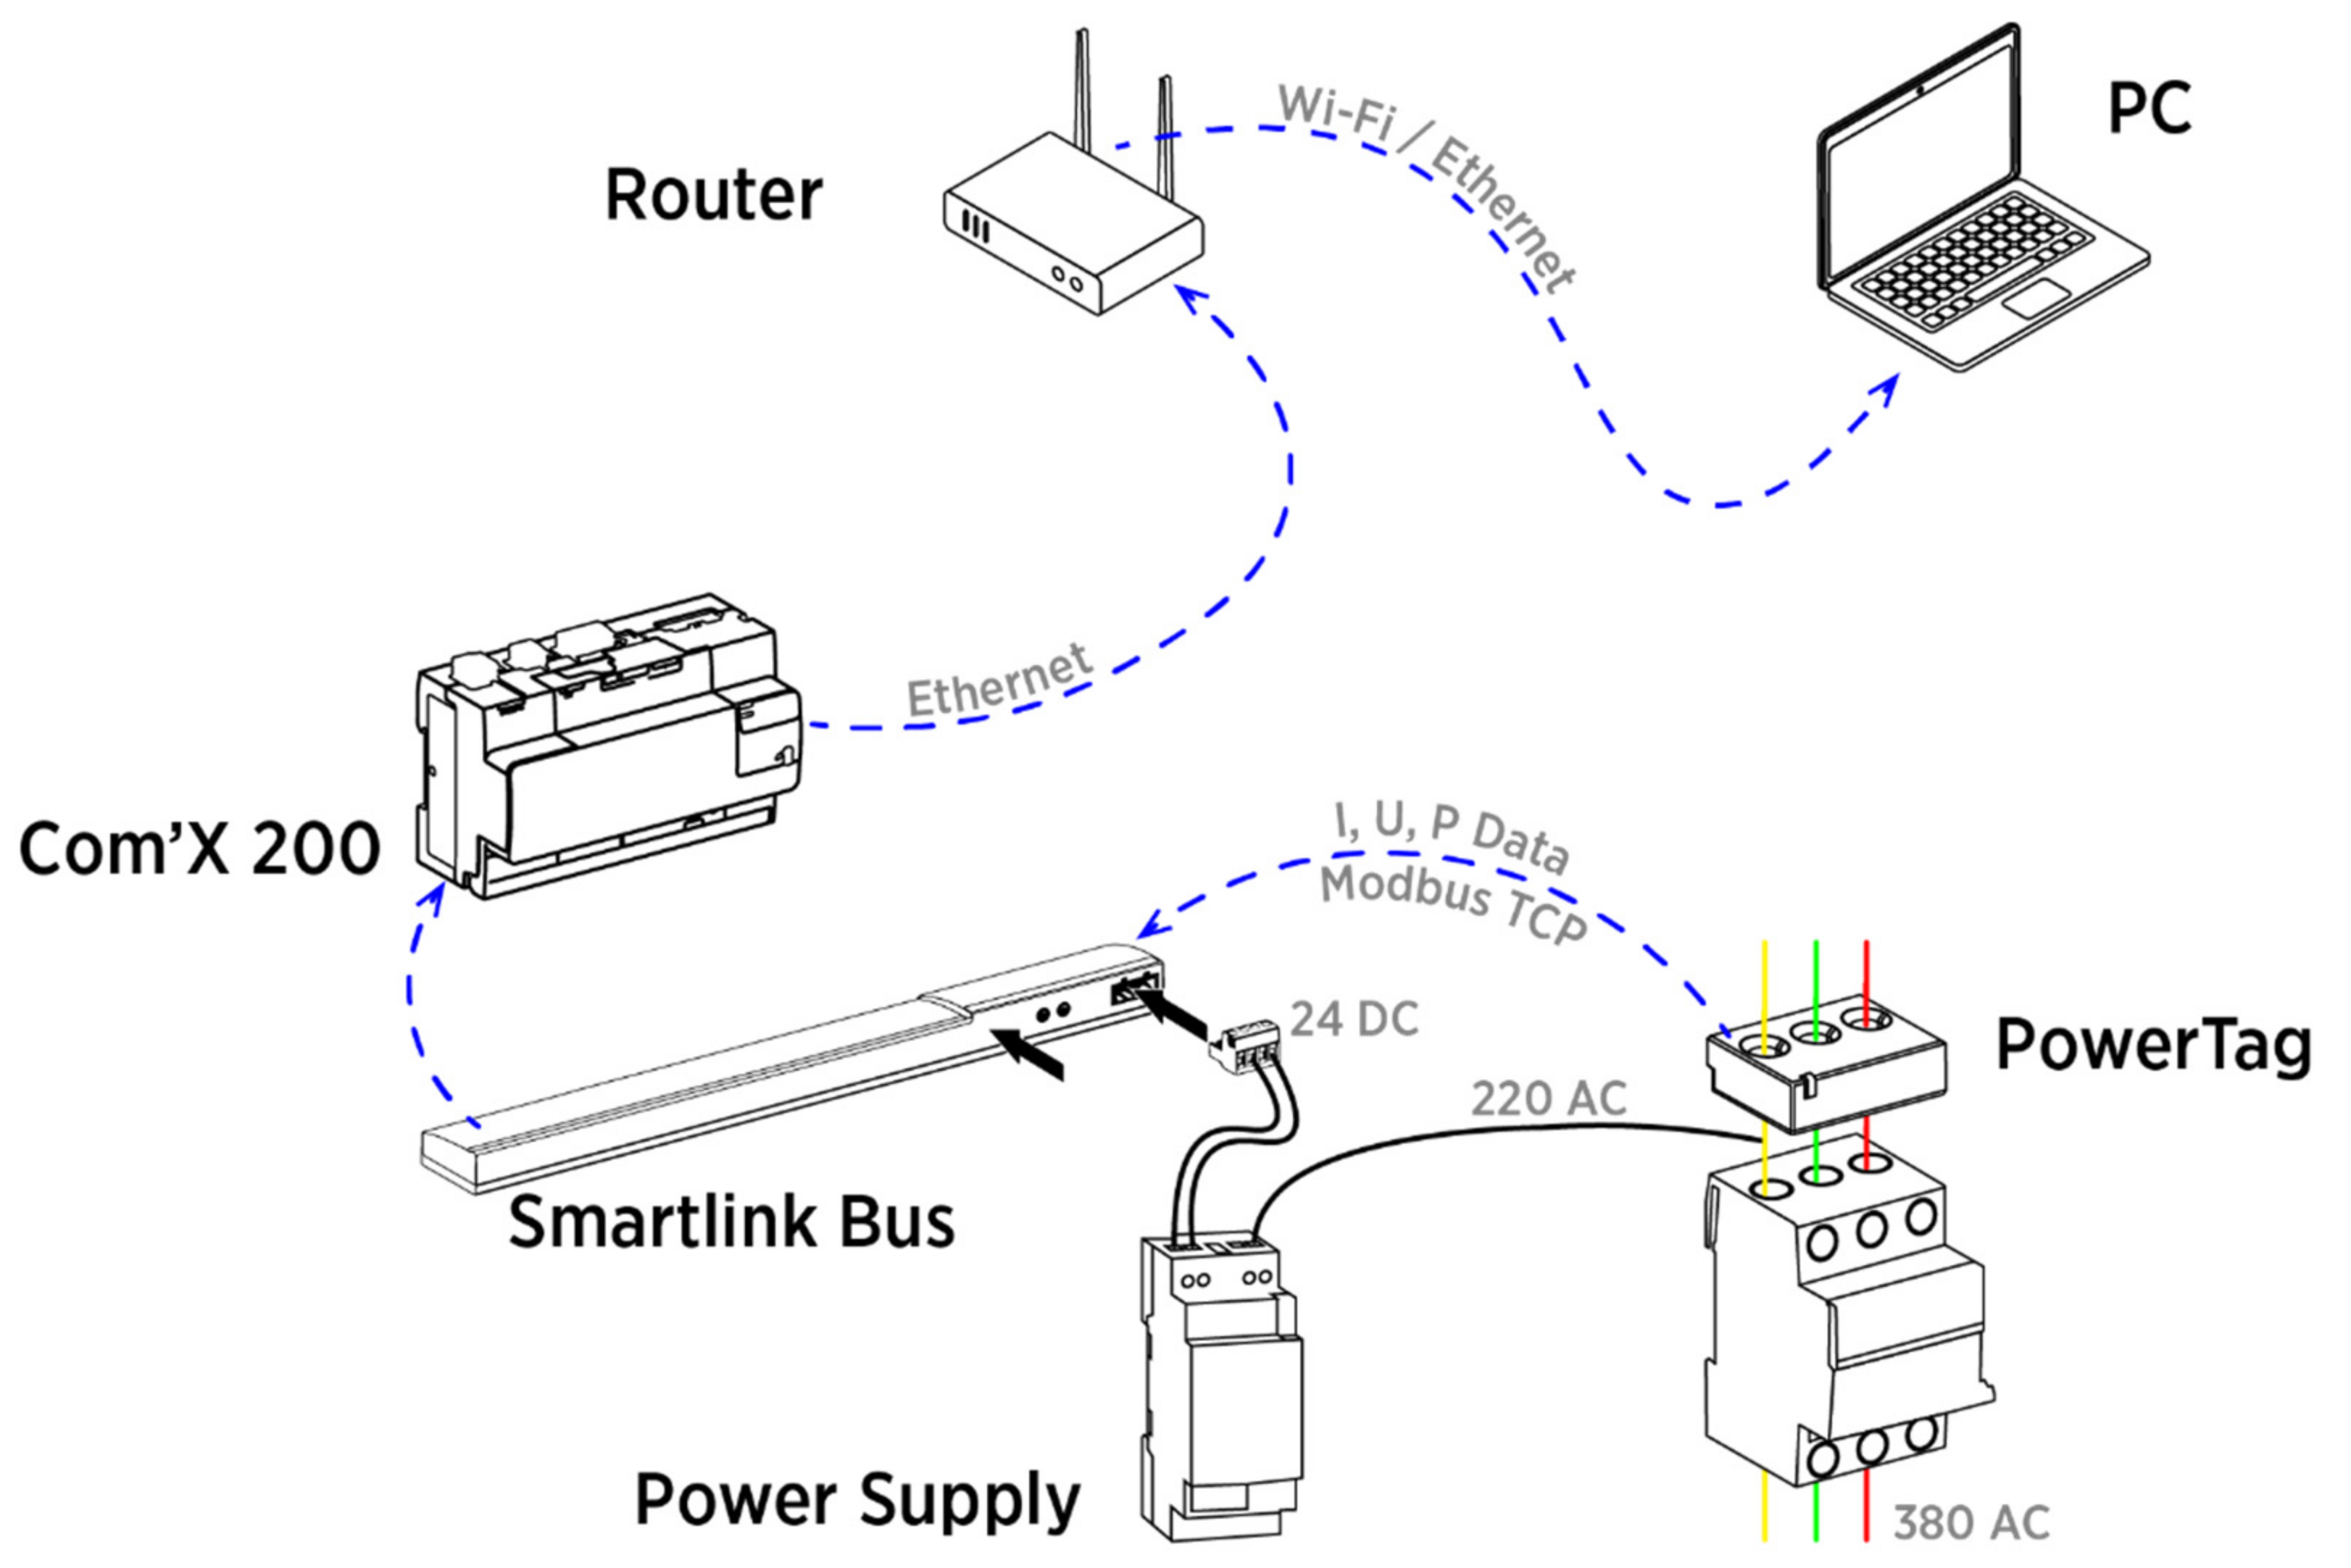
For the collection of data on electricity consumption and the primary structuring of data on the amount of electricity and power consumed in this study, equipment from Schneider Electric (Rueil Malmaison, France) was used. In particular, the following functional units were involved: Acti9 Smartlink SI B—Modbus TCP/IP and Wireless communication module, ACTI9 Power Tag, switch, Wi-Fi router, and personal computer for data collection. A schematic diagram of the connection of measuring equipment and equipment for storing and processing data is shown in
Figure 6.
Thus, the ACTI9 Power Tag is a current transformer with a digital interface, which, receiving information from three phases about the magnitude of the current flowing through each of the phases, digitizes it and transmits it to the network in the gigahertz range. For correct reception of the information stream, which is broadcast from the ACTI9 Power Tag, a data collection module is required, in this case, its role is performed by Acti9 Smartlink SI B. This information bus polls up to 20 nearest sensors once a second within a radius of up to 20 m straight visibility receives and transforms information. Further, information from the information bus, or rather the values of the consumed electricity, voltage, current, power, power factor, goes to the switch, from where routing and sending data through the router to the computer via a cable connection via an Ethernet connection or via Wi-Fi is performed. The computer analyzes and stores the information received with discreteness of one measurement per second. Further analysis and data processing is performed on a personal computer using the developed algorithms.
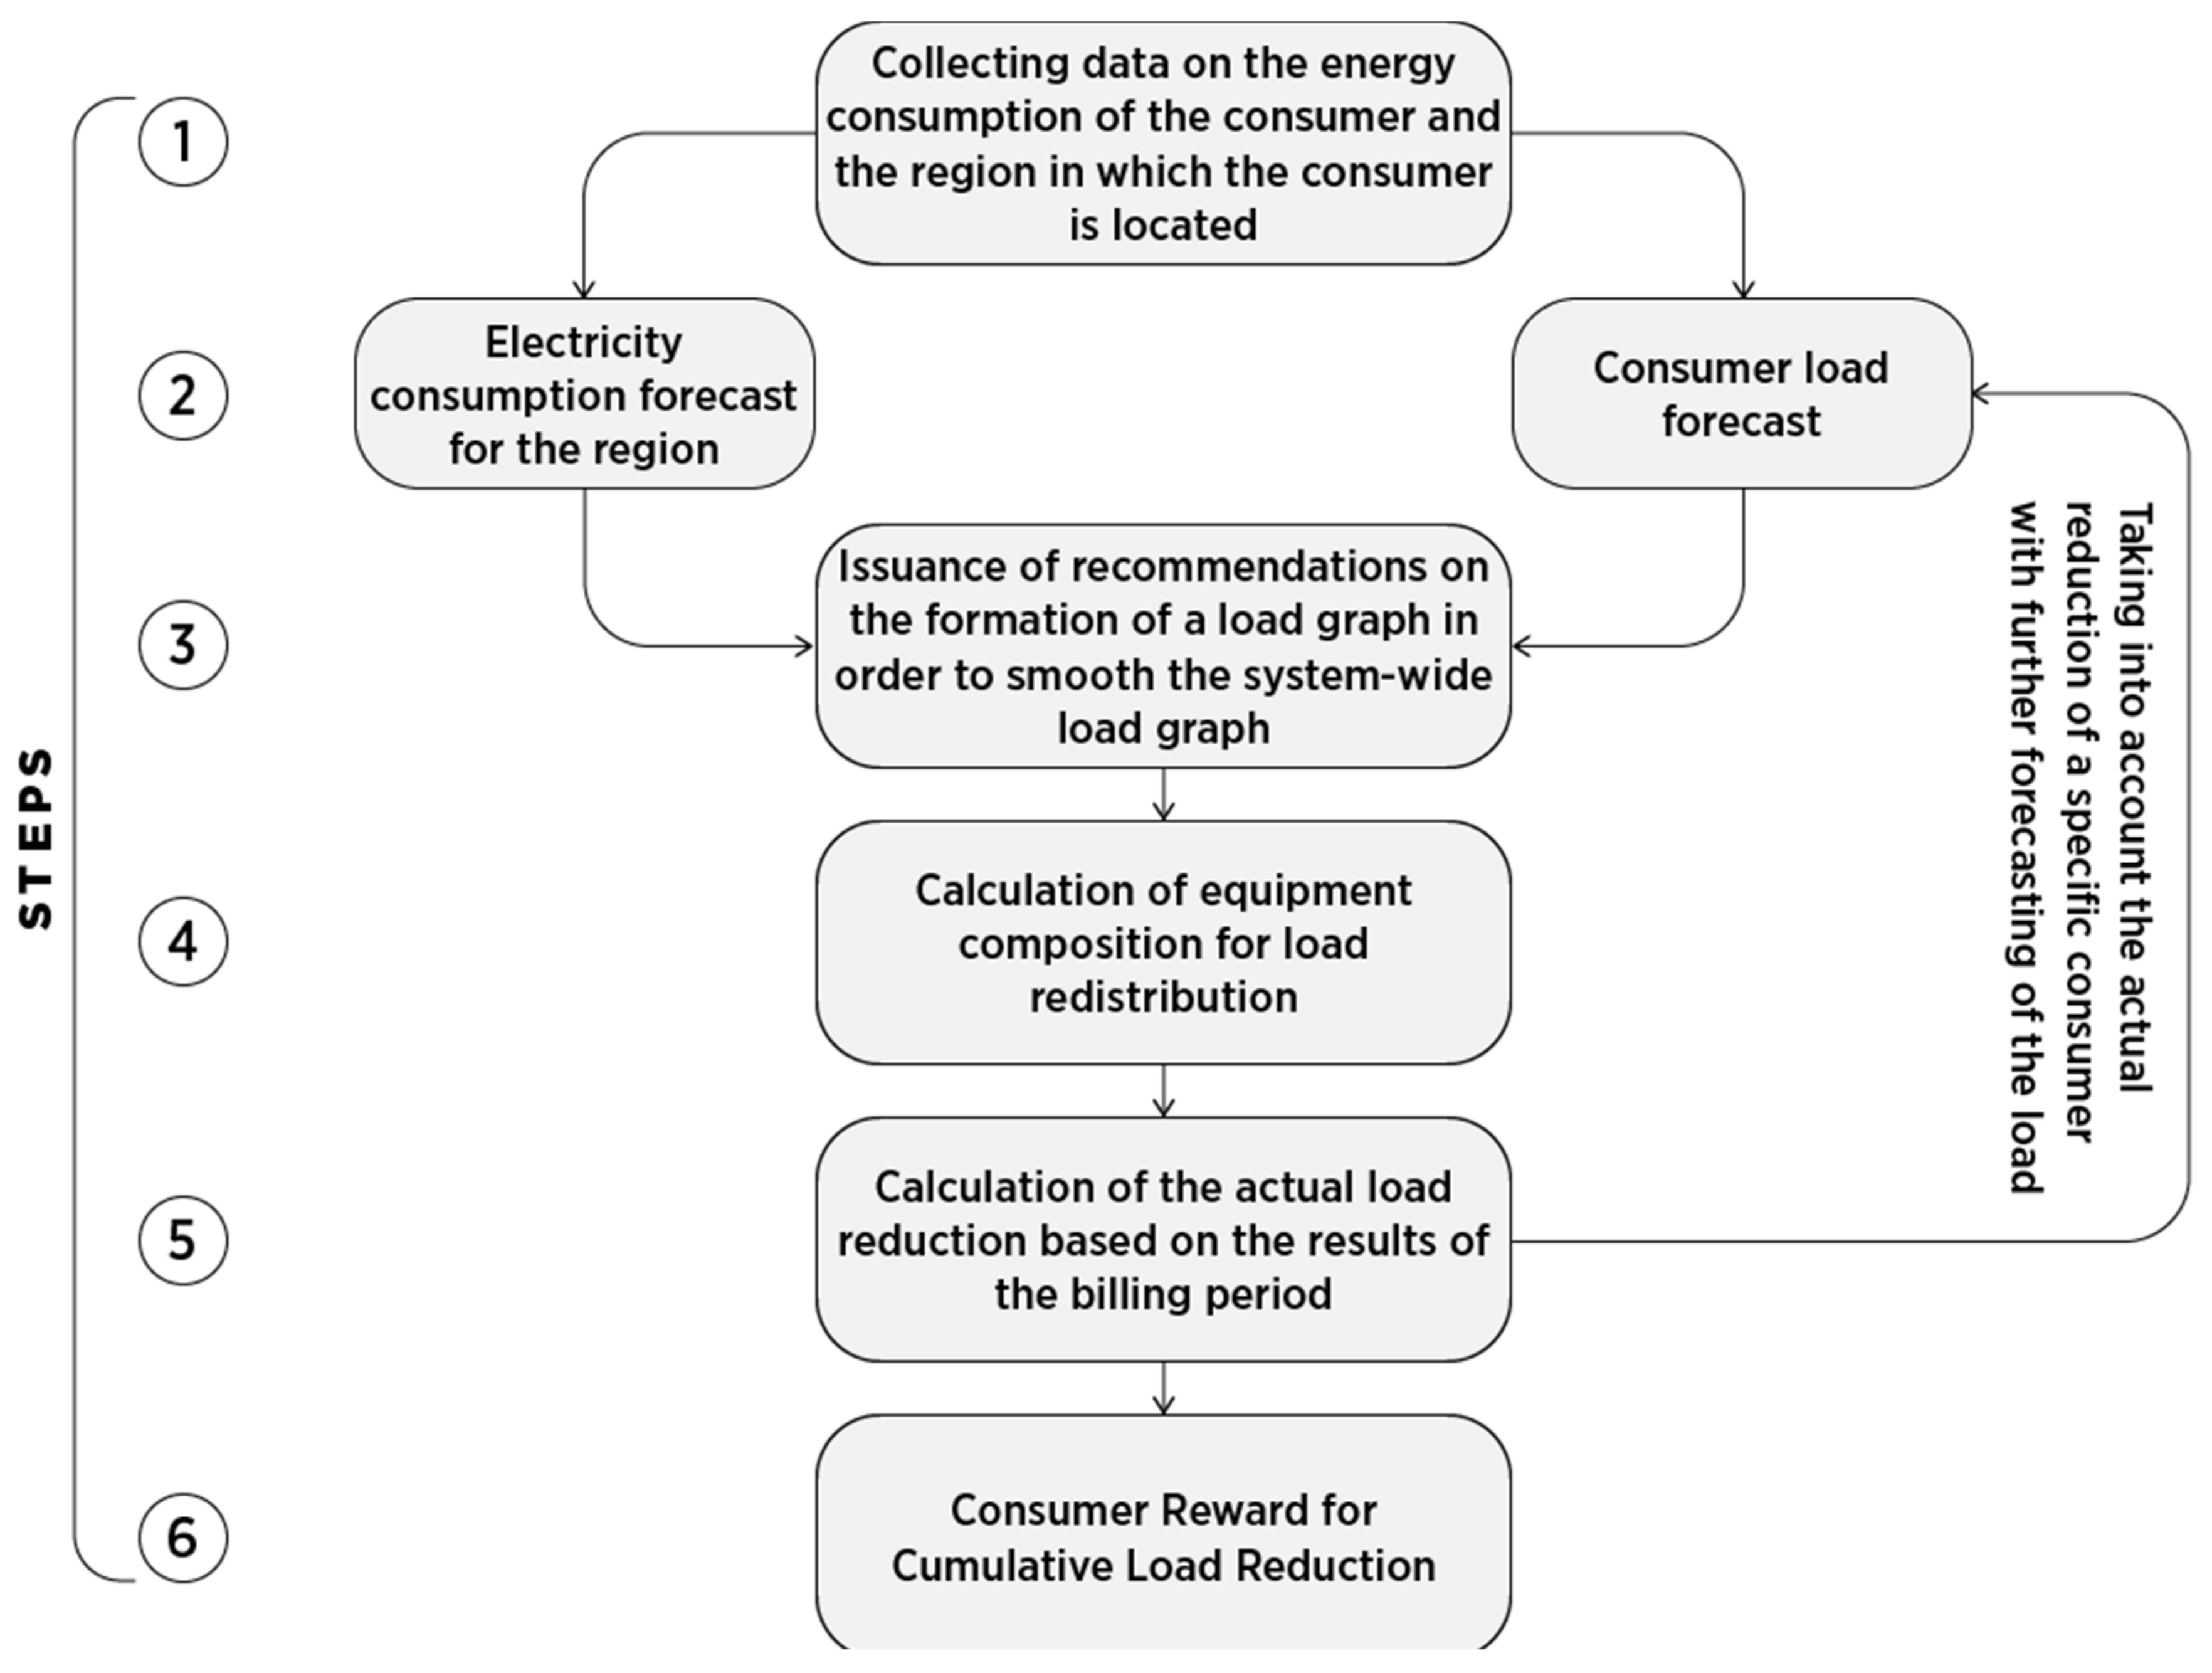
The algorithm developed by the authors for the formation of control actions for regulating demand was based on the use of an application for collecting and processing data (
Figure 7), using the forecast of electricity consumption and data from a unified power system. According to the algorithm, at the first step, data on power consumption in the classroom and in the power system is collected and processed, then the power consumption of the power system in which the research object is located and the consumer’s load are predicted, then recommendations are given on the formation of a load schedule, the composition of equipment for load redistribution is determined and calculated effect on load reduction.
In the process of executing the algorithm in
Figure 7 at step 1, the collection and primary processing of data on the power consumption of the interconnected power system, in which the consumer is located (in our case, the UPS of the North-West), is carried out. At step 2, the electricity consumption forecast of the IES and the university is made to determine the coincidence of the maximum power consumption. At step 3, when the peaks of consumption of the UPS and the university coincide, requirements are formed to reduce the consumption of the university for the period of maximum load of the power system. At step 4, structural elements (laboratories, separate electrical equipment) are selected from the university, the load of which will be reduced to achieve the required effect. At step 5, the actual decrease in the load after the implementation of the demand response program is calculated, as well as the forecast accuracy and the total economic effect, which are further taken into account at step 2. At the step, consumers are rewarded who have fulfilled their demand response obligations.
3.1. Collection and Processing of Data
The demand response system consists in changing the aggregate load of a large number of consumers, whose capacity is insufficient to participate in the wholesale electricity and capacity market (WECM), in order to align the daily load schedule of the power system.
The commercial operator of the unified electric power system makes the decision on the participation of demand aggregators in the formation of the daily load schedule.
For optimal planning of your own power consumption schedule, it is necessary to analyze the consumption of the power system in order to determine the need to change the load in the billing period. Energy system consumption data was obtained from the official website of the system operator [
54].
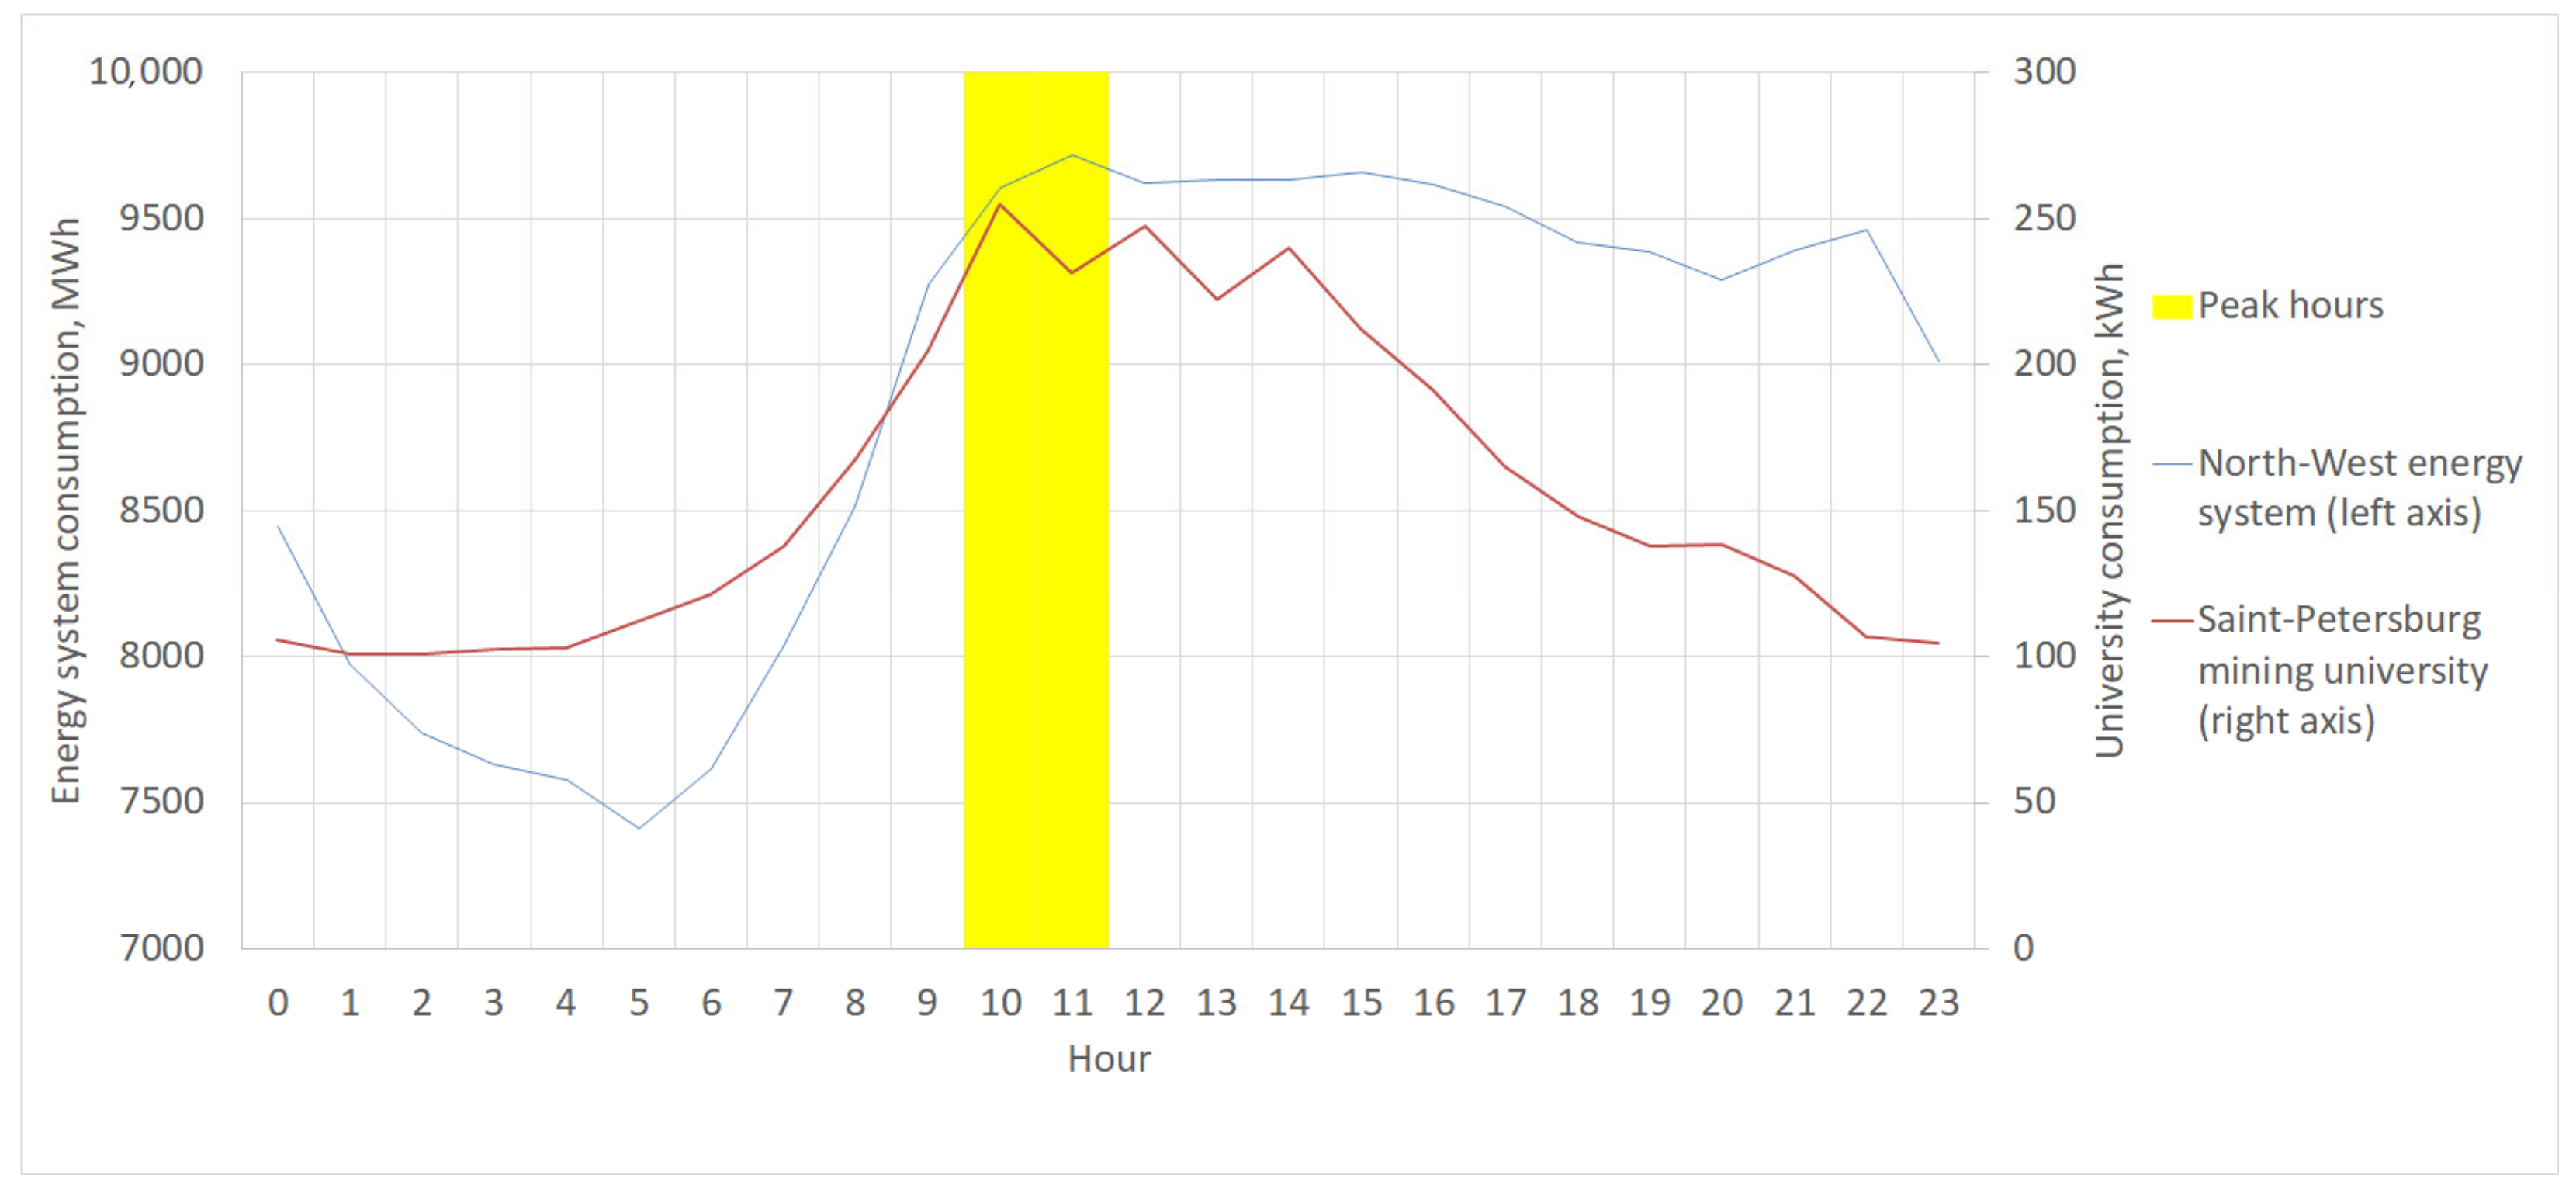
For this study, an analysis of the power consumption of the St. Petersburg Mining University (Saint Petersburg, Russia) was carried out. The UES of the North-West in Russia is considered a region. When the peaks of the power system and the consumer coincide, the possibility of transferring the load to a period with a lower system load is considered (
Figure 8).
Based on the results of the analysis of the graphs in
Figure 2, it can be concluded that the peak load of the consumer coincides with the peak of the power system from 10 a.m. to 12 a.m. Based on this, it is required to transfer the load to another period of the day. In a demand response project, aggregated load management uses intervals of 2 and 4 h, during which it is necessary to reduce loads to a predetermined level.
For most consumers, the energy plan is directly related to the production plan, therefore, optimal planning of the load schedule is necessary so that the damage from load transfer does not exceed the positive economic effect from participation in the demand response program [
55,
56]. In the case of an educational institution, this plan is the conducted classes, for which it is possible to establish the cost of conducting in relation to the costs and discounts for participation in demand response.
For the St. Petersburg Mining University (Saint Petersburg, Russia), a decision was made to forecast power consumption with a forecast horizon of 1 week, since to change power consumption it is necessary to adjust the time of training sessions and draw up a work plan with laboratory benches, which have a frequency of 1 week.
3.2. Power System Consumption Forecast
For analyzing the possibility of participating in a demand response program by shifting the peak consumption of the university, it is necessary to determine the peak consumption of the unified power system. The main task of the demand response program is to reduce the peak load of the unified power system, therefore, when forecasting the load of the power system, we allocate peak consumption hours during which we will reduce the consumption of the university.
To predict power consumption, an additive autoregressive model was used using exogenous parameters—the average temperature in the power system [
57].
Initial data of the forecast model:
discreteness of data set—1 h;
depth of learning—6567 h (9 months);
forecast horizon—168 h (1 week);
Model—additive autoregressive with a nonlinear trend.
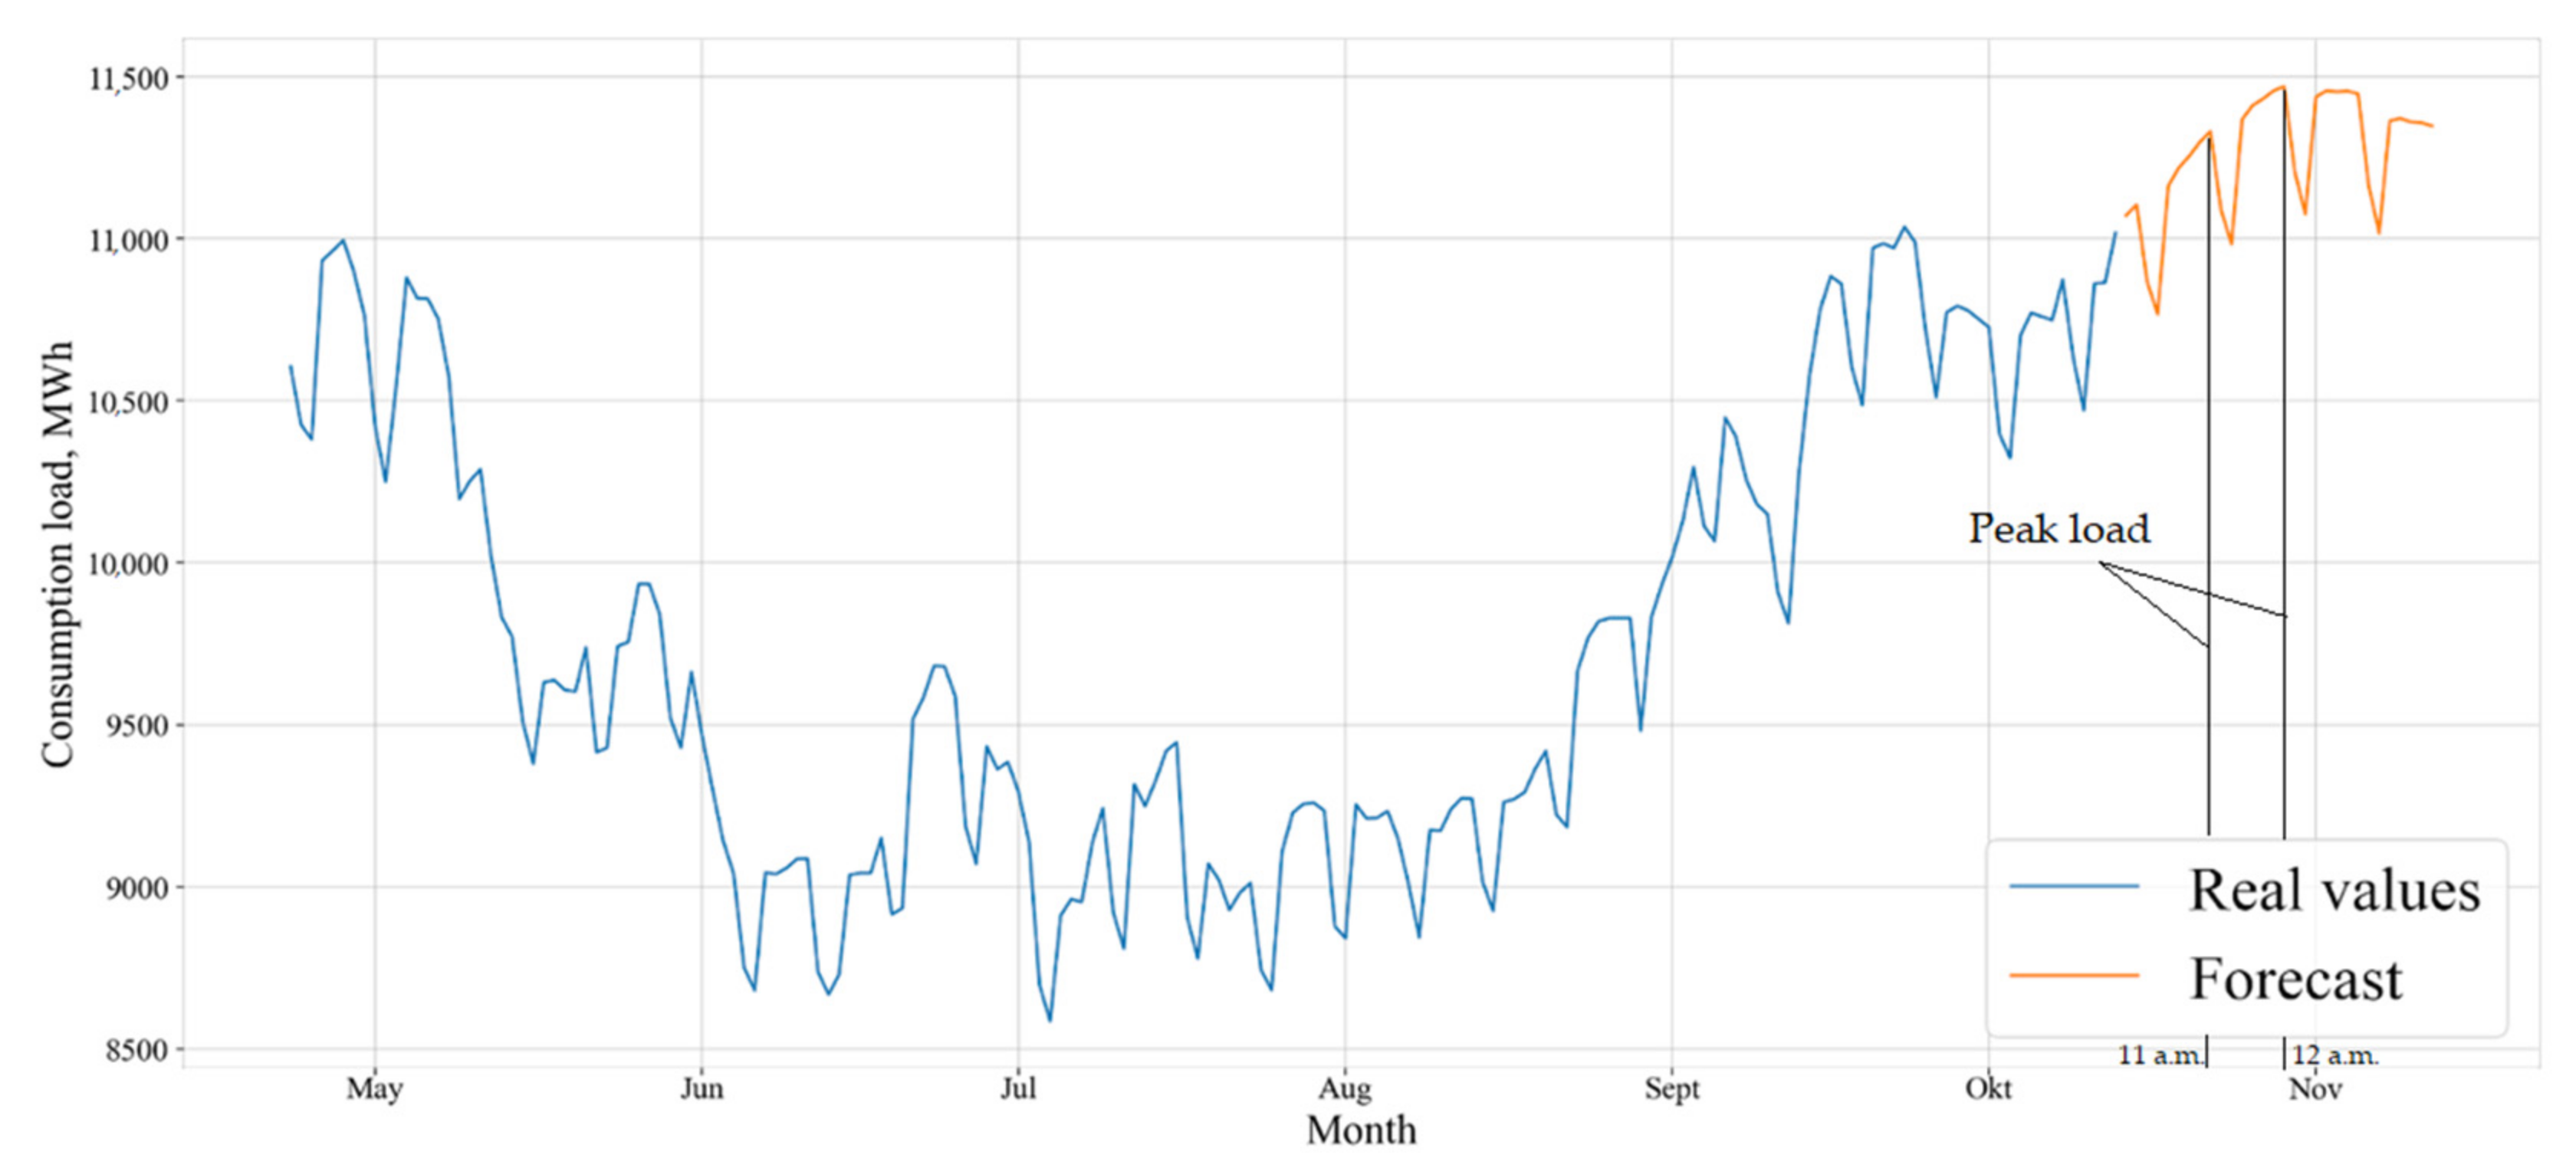
The results of constructing a forecast of power consumption are presented in
Figure 9:
From the results presented in
Figure 9, we can conclude that the consumption peaks are periodic in nature and are repeated every day, which will allow the development of a unified algorithm for regulating the consumer load schedule. The forecast of power consumption of the power system made it possible to determine the hours of peak consumption during the day. The period of the greatest load of the power system is from 11 to 12 a.m. and it is this period is used in this study to optimize the power consumption of the university.
3.3. University Power Consumption Forecast
The factors that must be taken into account when building forecasting models can be conditionally divided into three groups: cyclical, natural, and random. This classification is determined on the basis of the nature of the occurrence of factors and reflects the possibility of taking them into account in the forecast model [
58,
59]. Also, from the point of view of the source of occurrence, meteorological and socio-economic factors are the main ones in forecasting.
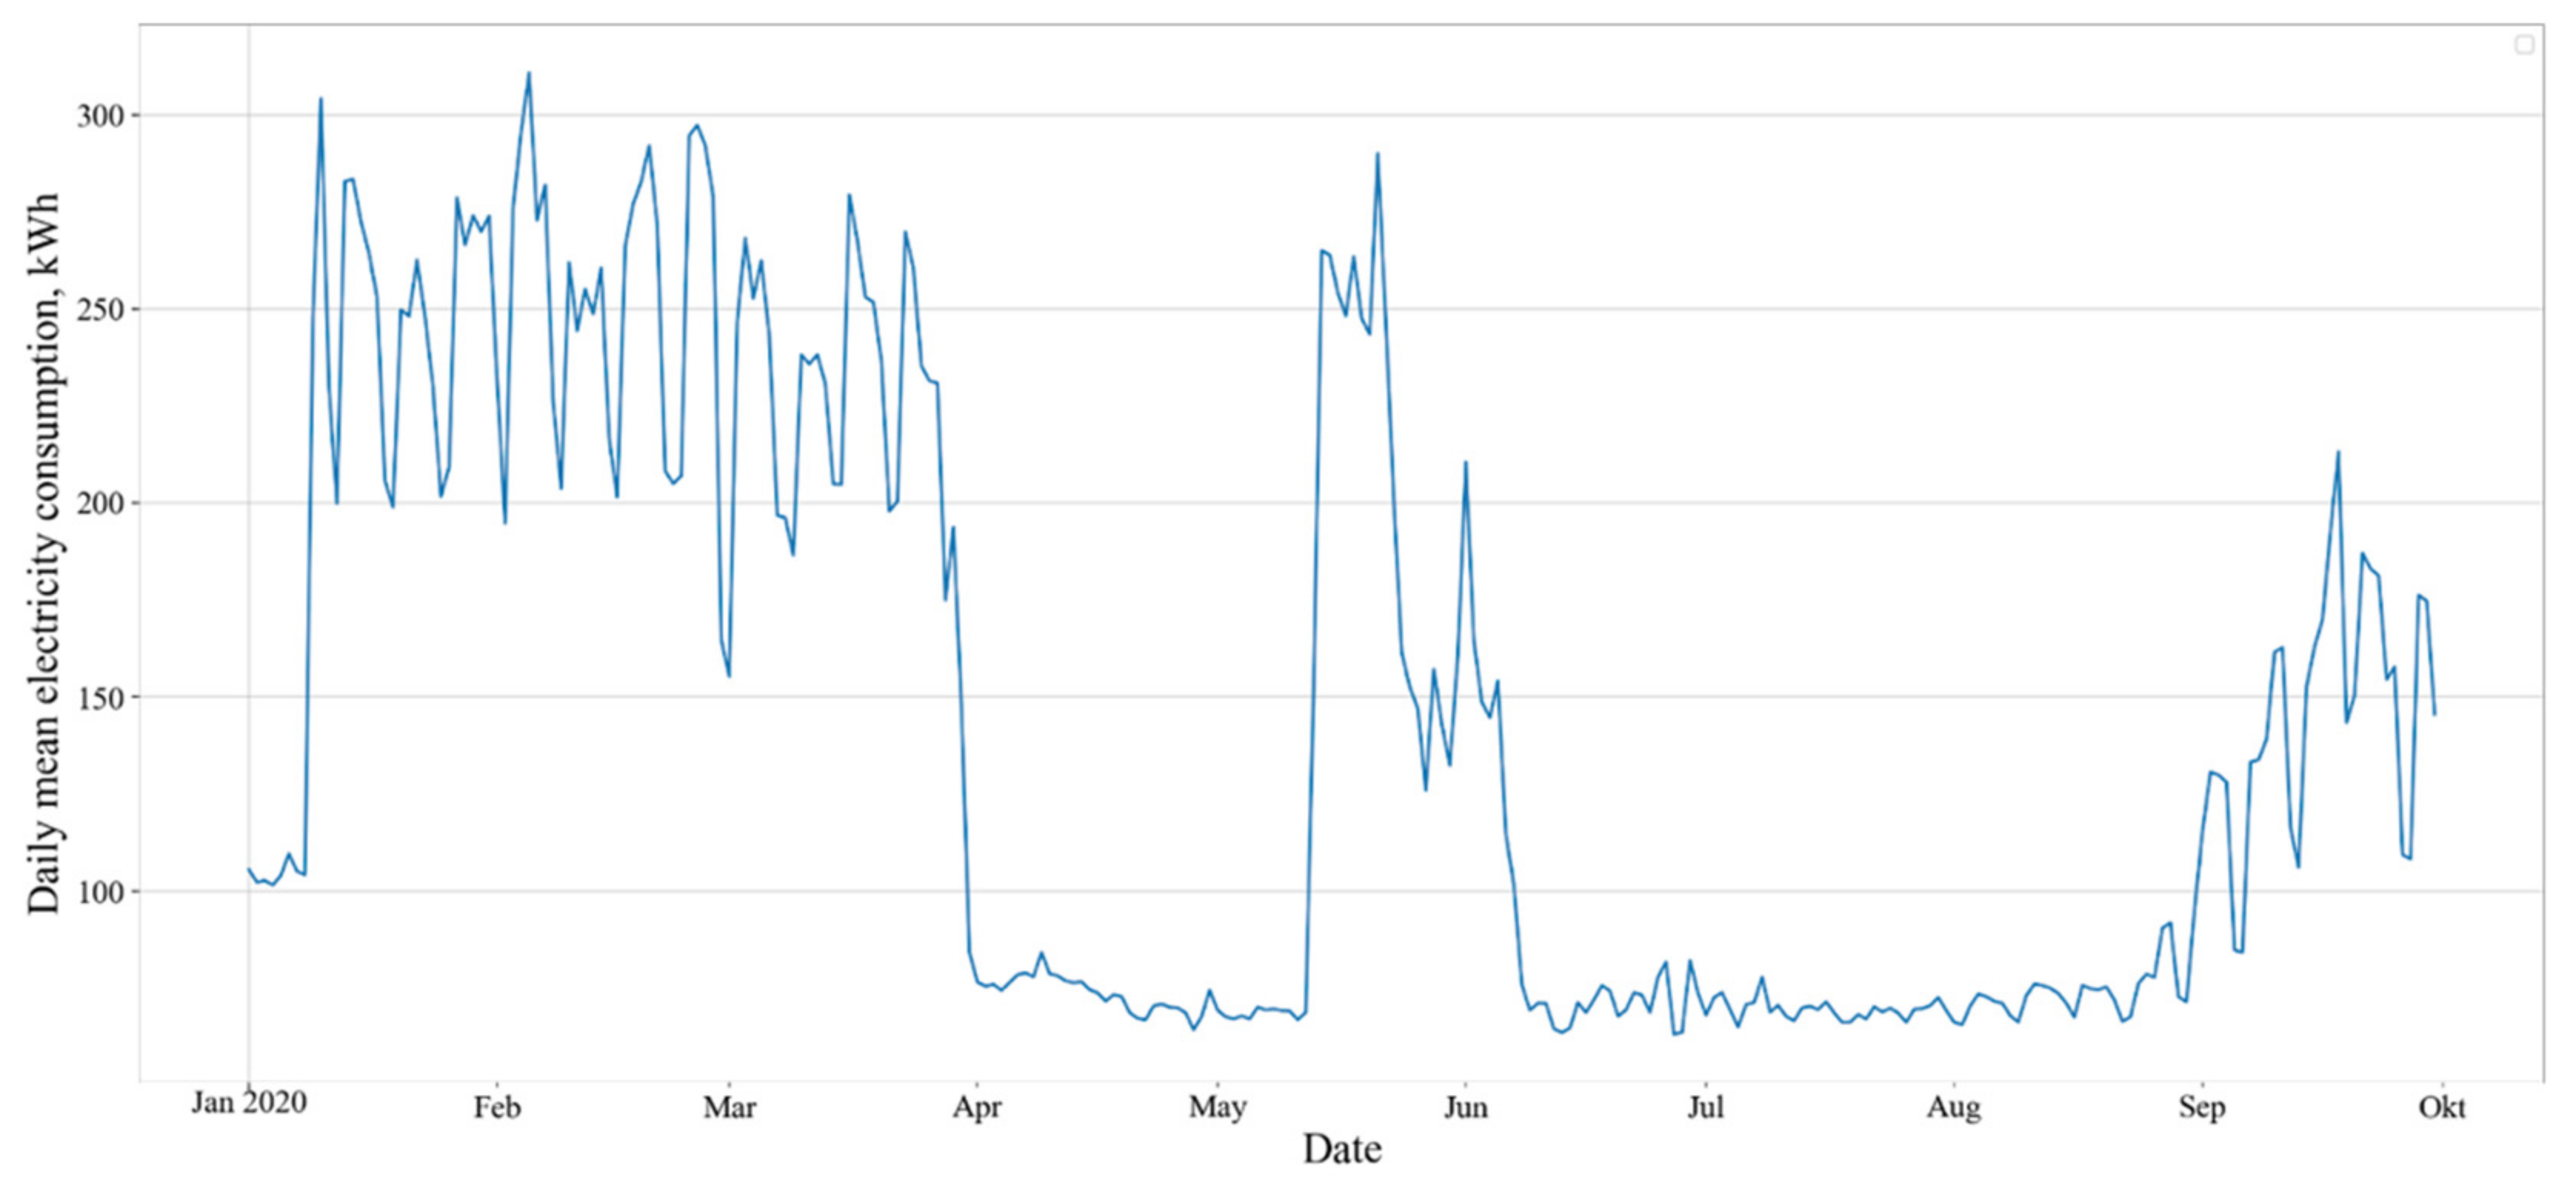
The consumption graphs of educational institutions are highly correlated with the season, day of the week, and school schedule, which allows planning energy consumption using statistical methods. Consider the electricity consumption graph for the first 9 months of 2020 (
Figure 10):
The graph in
Figure 10 allows us to conclude that from mid-June to early September, the university’s consumption is minimal, since this period coincides with the student holidays, but also from early April to mid-May there is a significant drop in power consumption. Based on known external factors, we can conclude that this period coincides with the closure of educational institutions in quarantine due to the spread of COVID-19, however, this conclusion also allows us to judge that in addition to obvious seasonal patterns, it is necessary to take into account some external factors. for accurate planning of energy consumption for a long period.
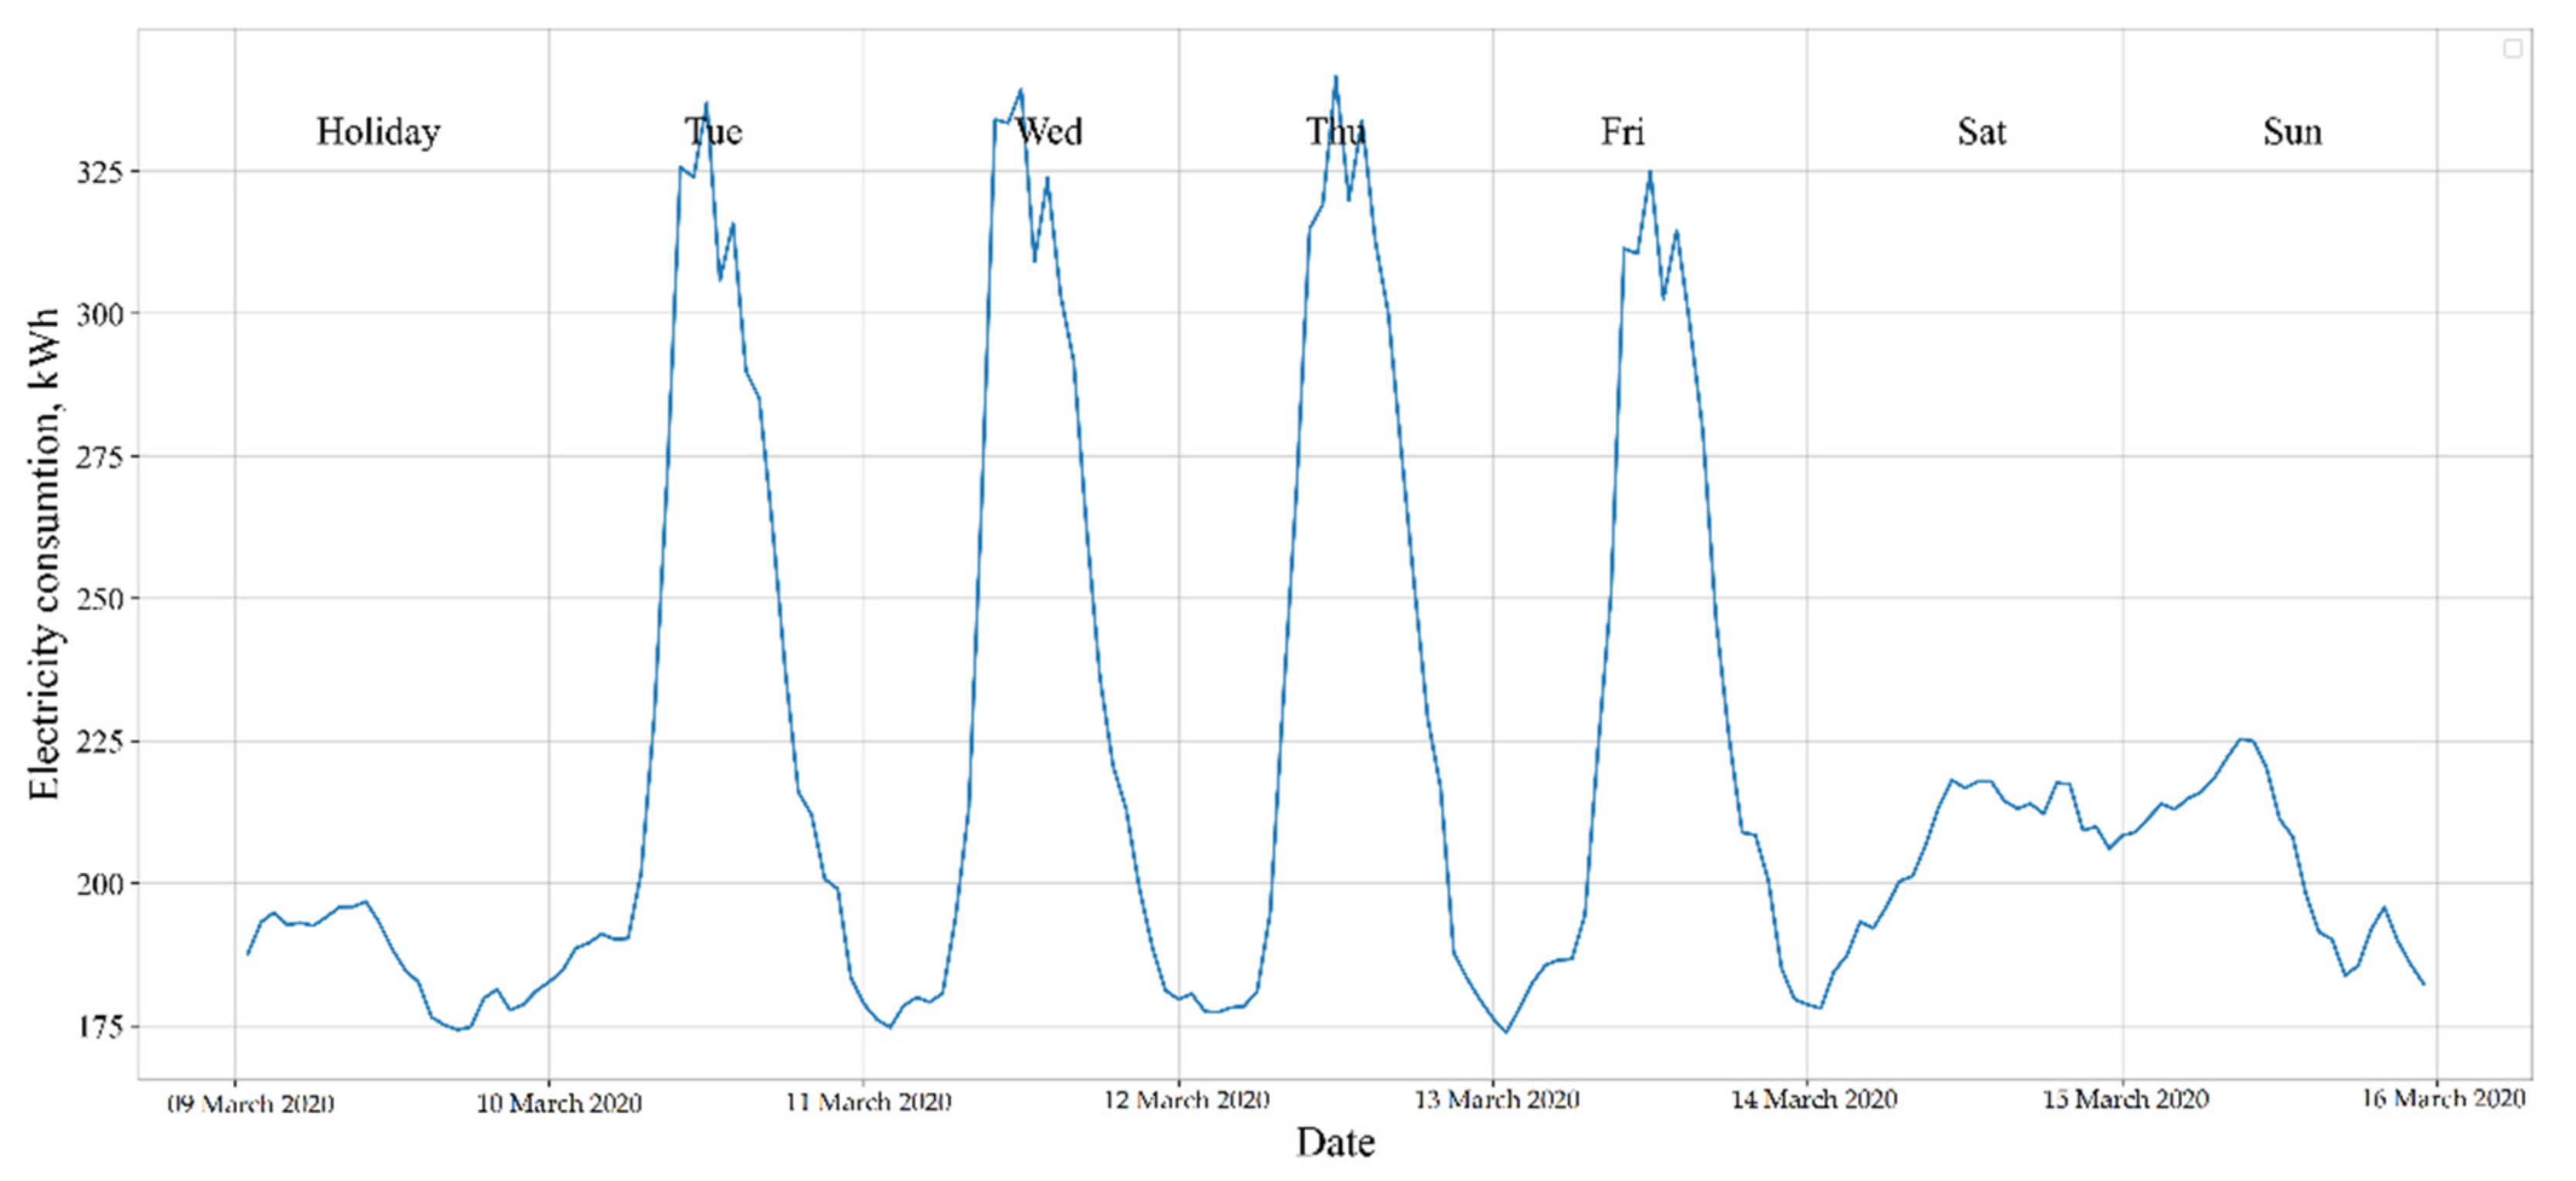
During the week, the schedule changes depending on the training schedule, which is publicly available and can be used to plan an electricity schedule. A typical study week is shown in
Figure 11:
Based on the graph in
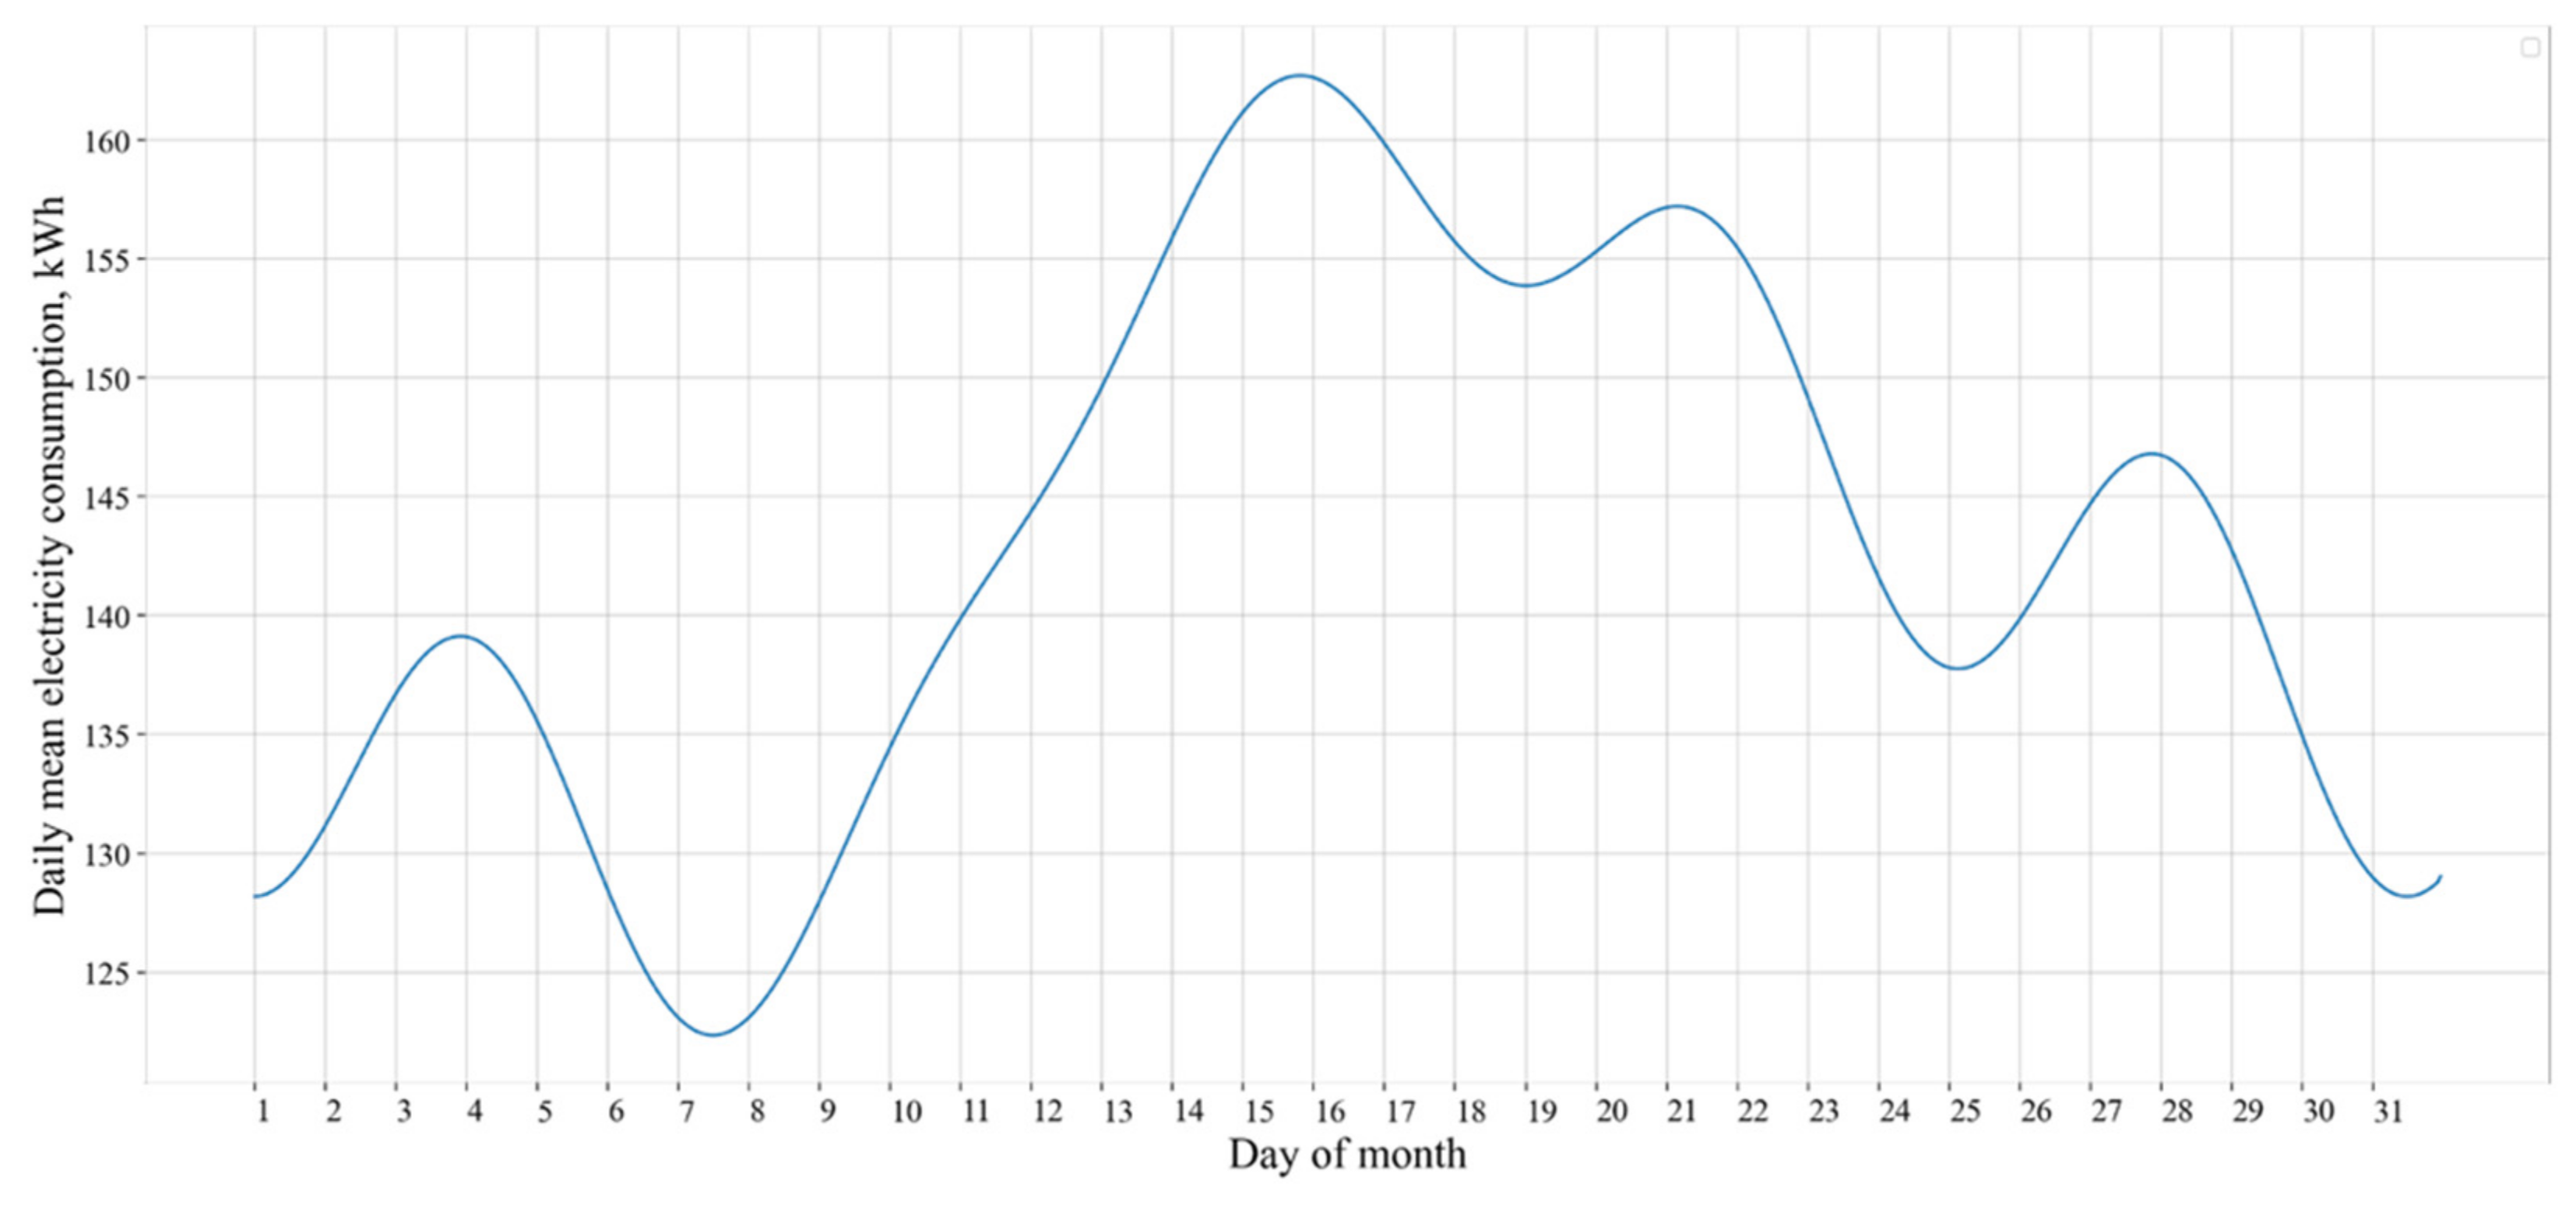
Figure 11, we can conclude that there is a weekly frequency that corresponds to a five-day study week. When expanding into a Fourier series of the annual electricity consumption graph, a monthly frequency is allocated for the complete data set (
Figure 12):
From the graph in
Figure 12, we can conclude that consumption grows by the middle of the month, however, with a monthly frequency, there are no obvious dependencies, since classes are evenly distributed throughout the month. However, power consumption can depend on many external factors, each of which is difficult to identify separately, however, their cumulative influence can be determined using statistical methods, which can be devoted to subsequent studies.
The load graph was examined for uniformity. The indicators of the load graph were calculated, where
Pmean—average load for a month,
Pmsqr—root-mean-square load for a month,
KF—load curve shape factor,
Pmax—maximum power, kW,
Pmin—minimum power, kW,
Kmax—maximum load factor,
Kfill—fill factor or load density,
Kun—coefficient of the unevenness of the load curve. The results are presented in
Table 4.
To predict the power consumption of the university, taking into account the high coefficient of the unevenness of the load graph, a model of decision trees with a gradient boosting algorithm [
60] was used to train the model, as well as the use of categorical endogenous parameters (day of the week, hour of the day, holidays and weekends).
Initial data of the forecast model:
discreteness of data collection—1 h;
depth of training—6567 h (9 months);
forecast horizon—168 h (1 week);
model—an ensemble of decision trees with gradient boosting using categorical variables [
61].
The forecasting results are shown in
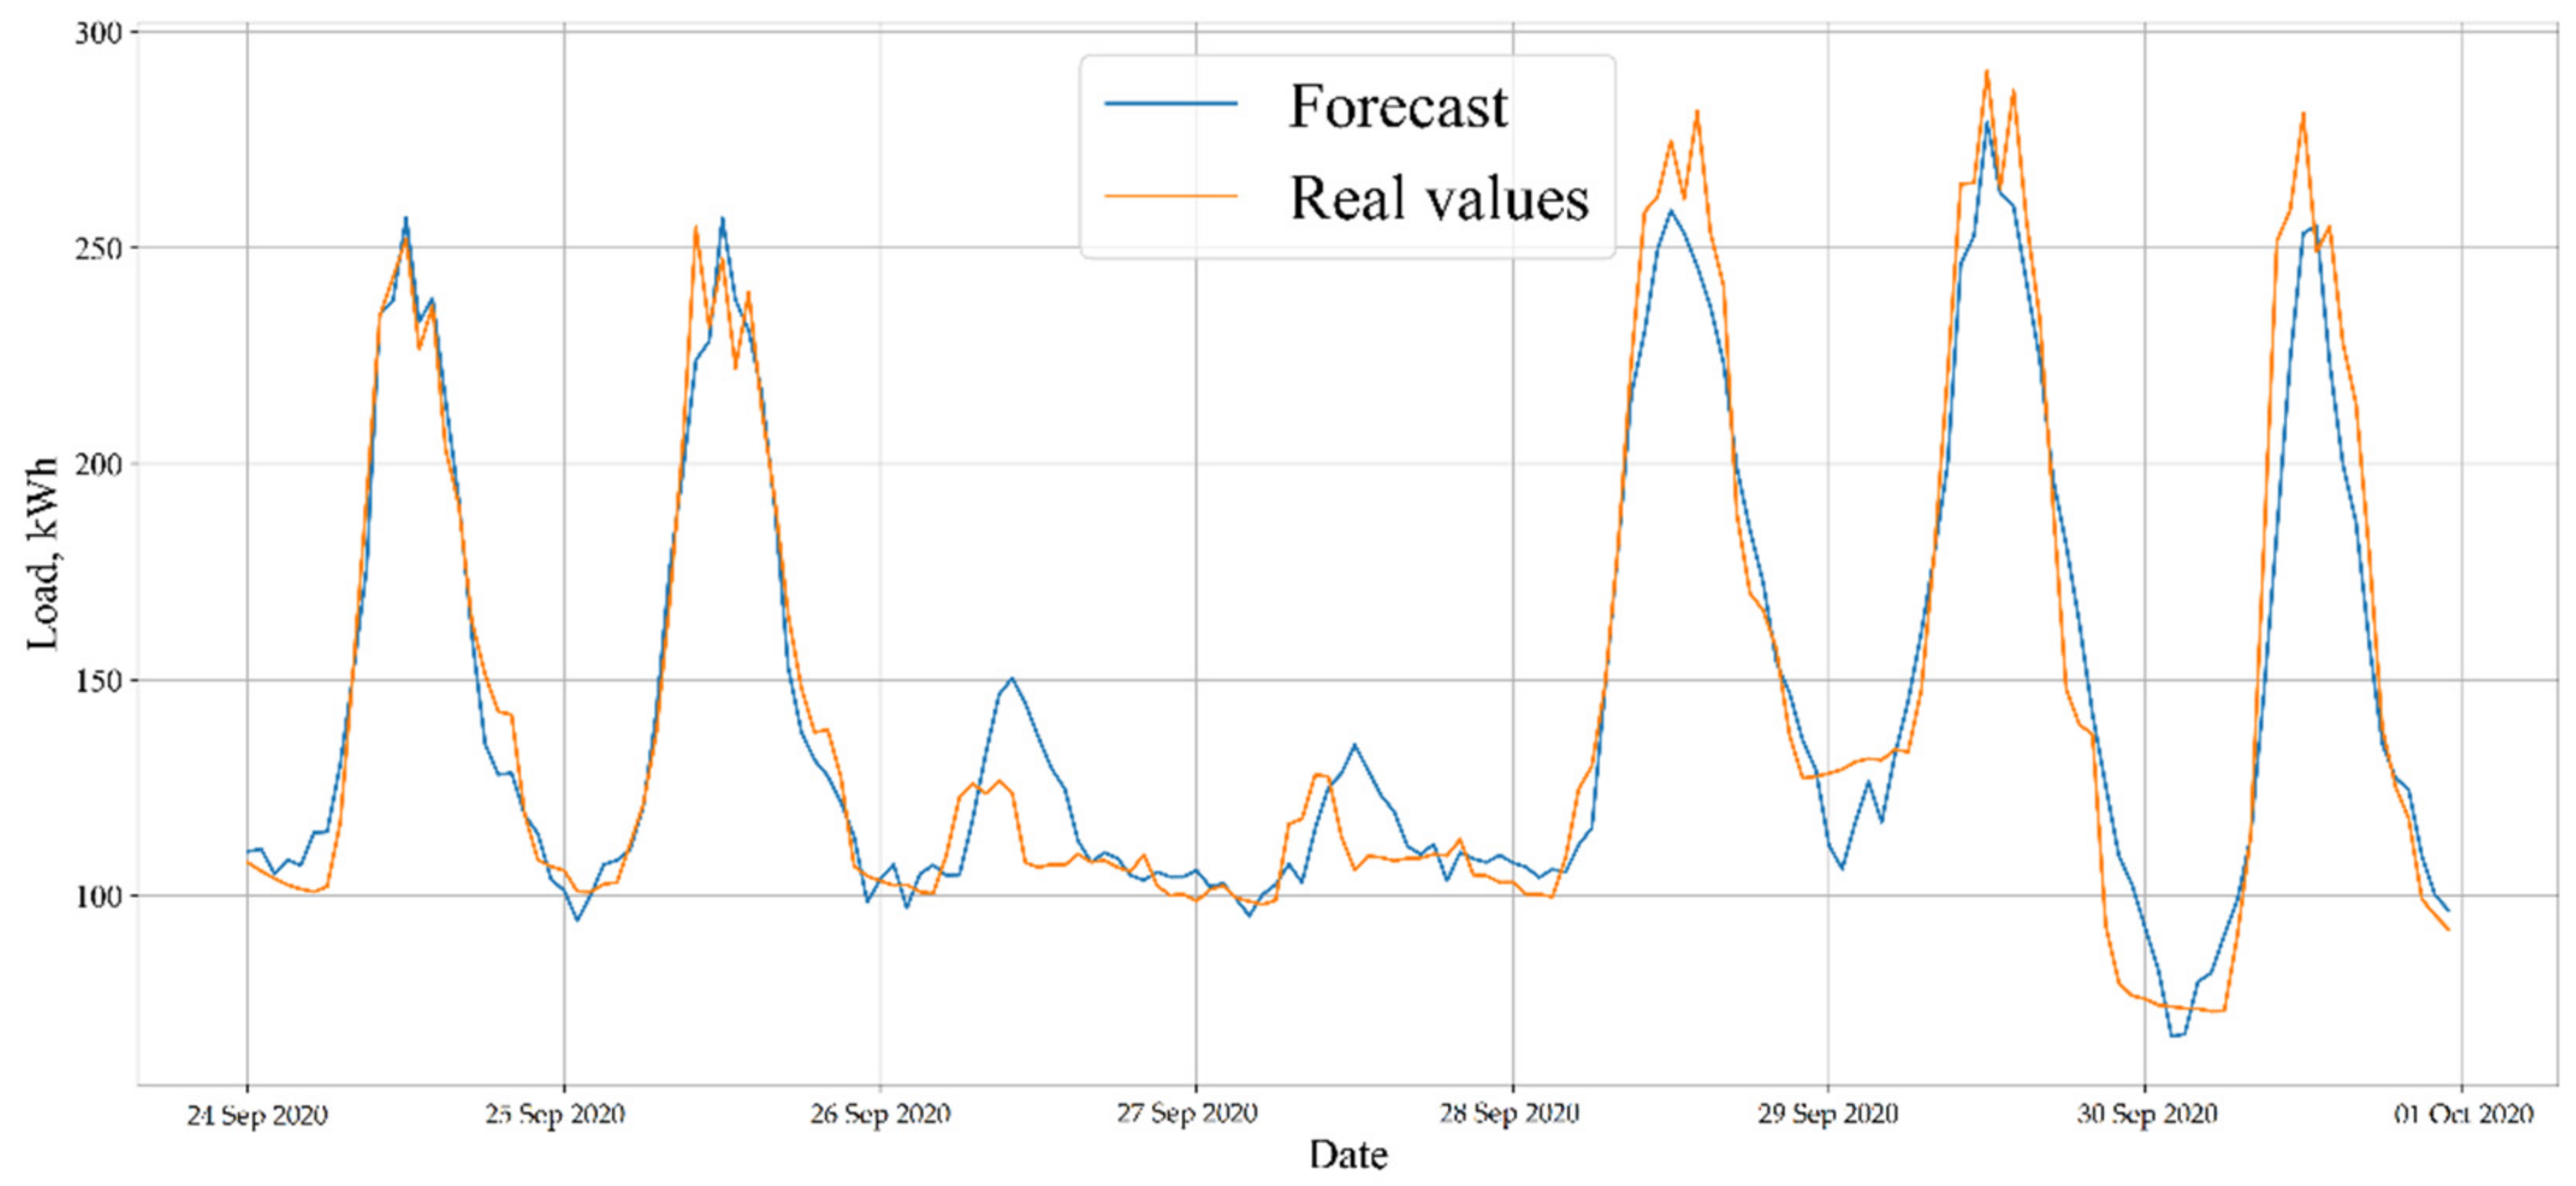
Figure 13:
The mean absolute error of forecast is 10.5 kWh (7.34%).
Based on the results presented in
Figure 13, the forecast for electricity consumption quite accurately repeats the load peaks on weekdays. The error takes the smallest value with a decrease in the forecast horizon, however, with an increase in the number of forecasting steps, an accumulation of errors occurs. The decision tree model allows reducing the cumulative error since when using such a model, the retrospective load values have less weight than other endogenous variables.
3.4. Composition of Equipment for Load Redistribution
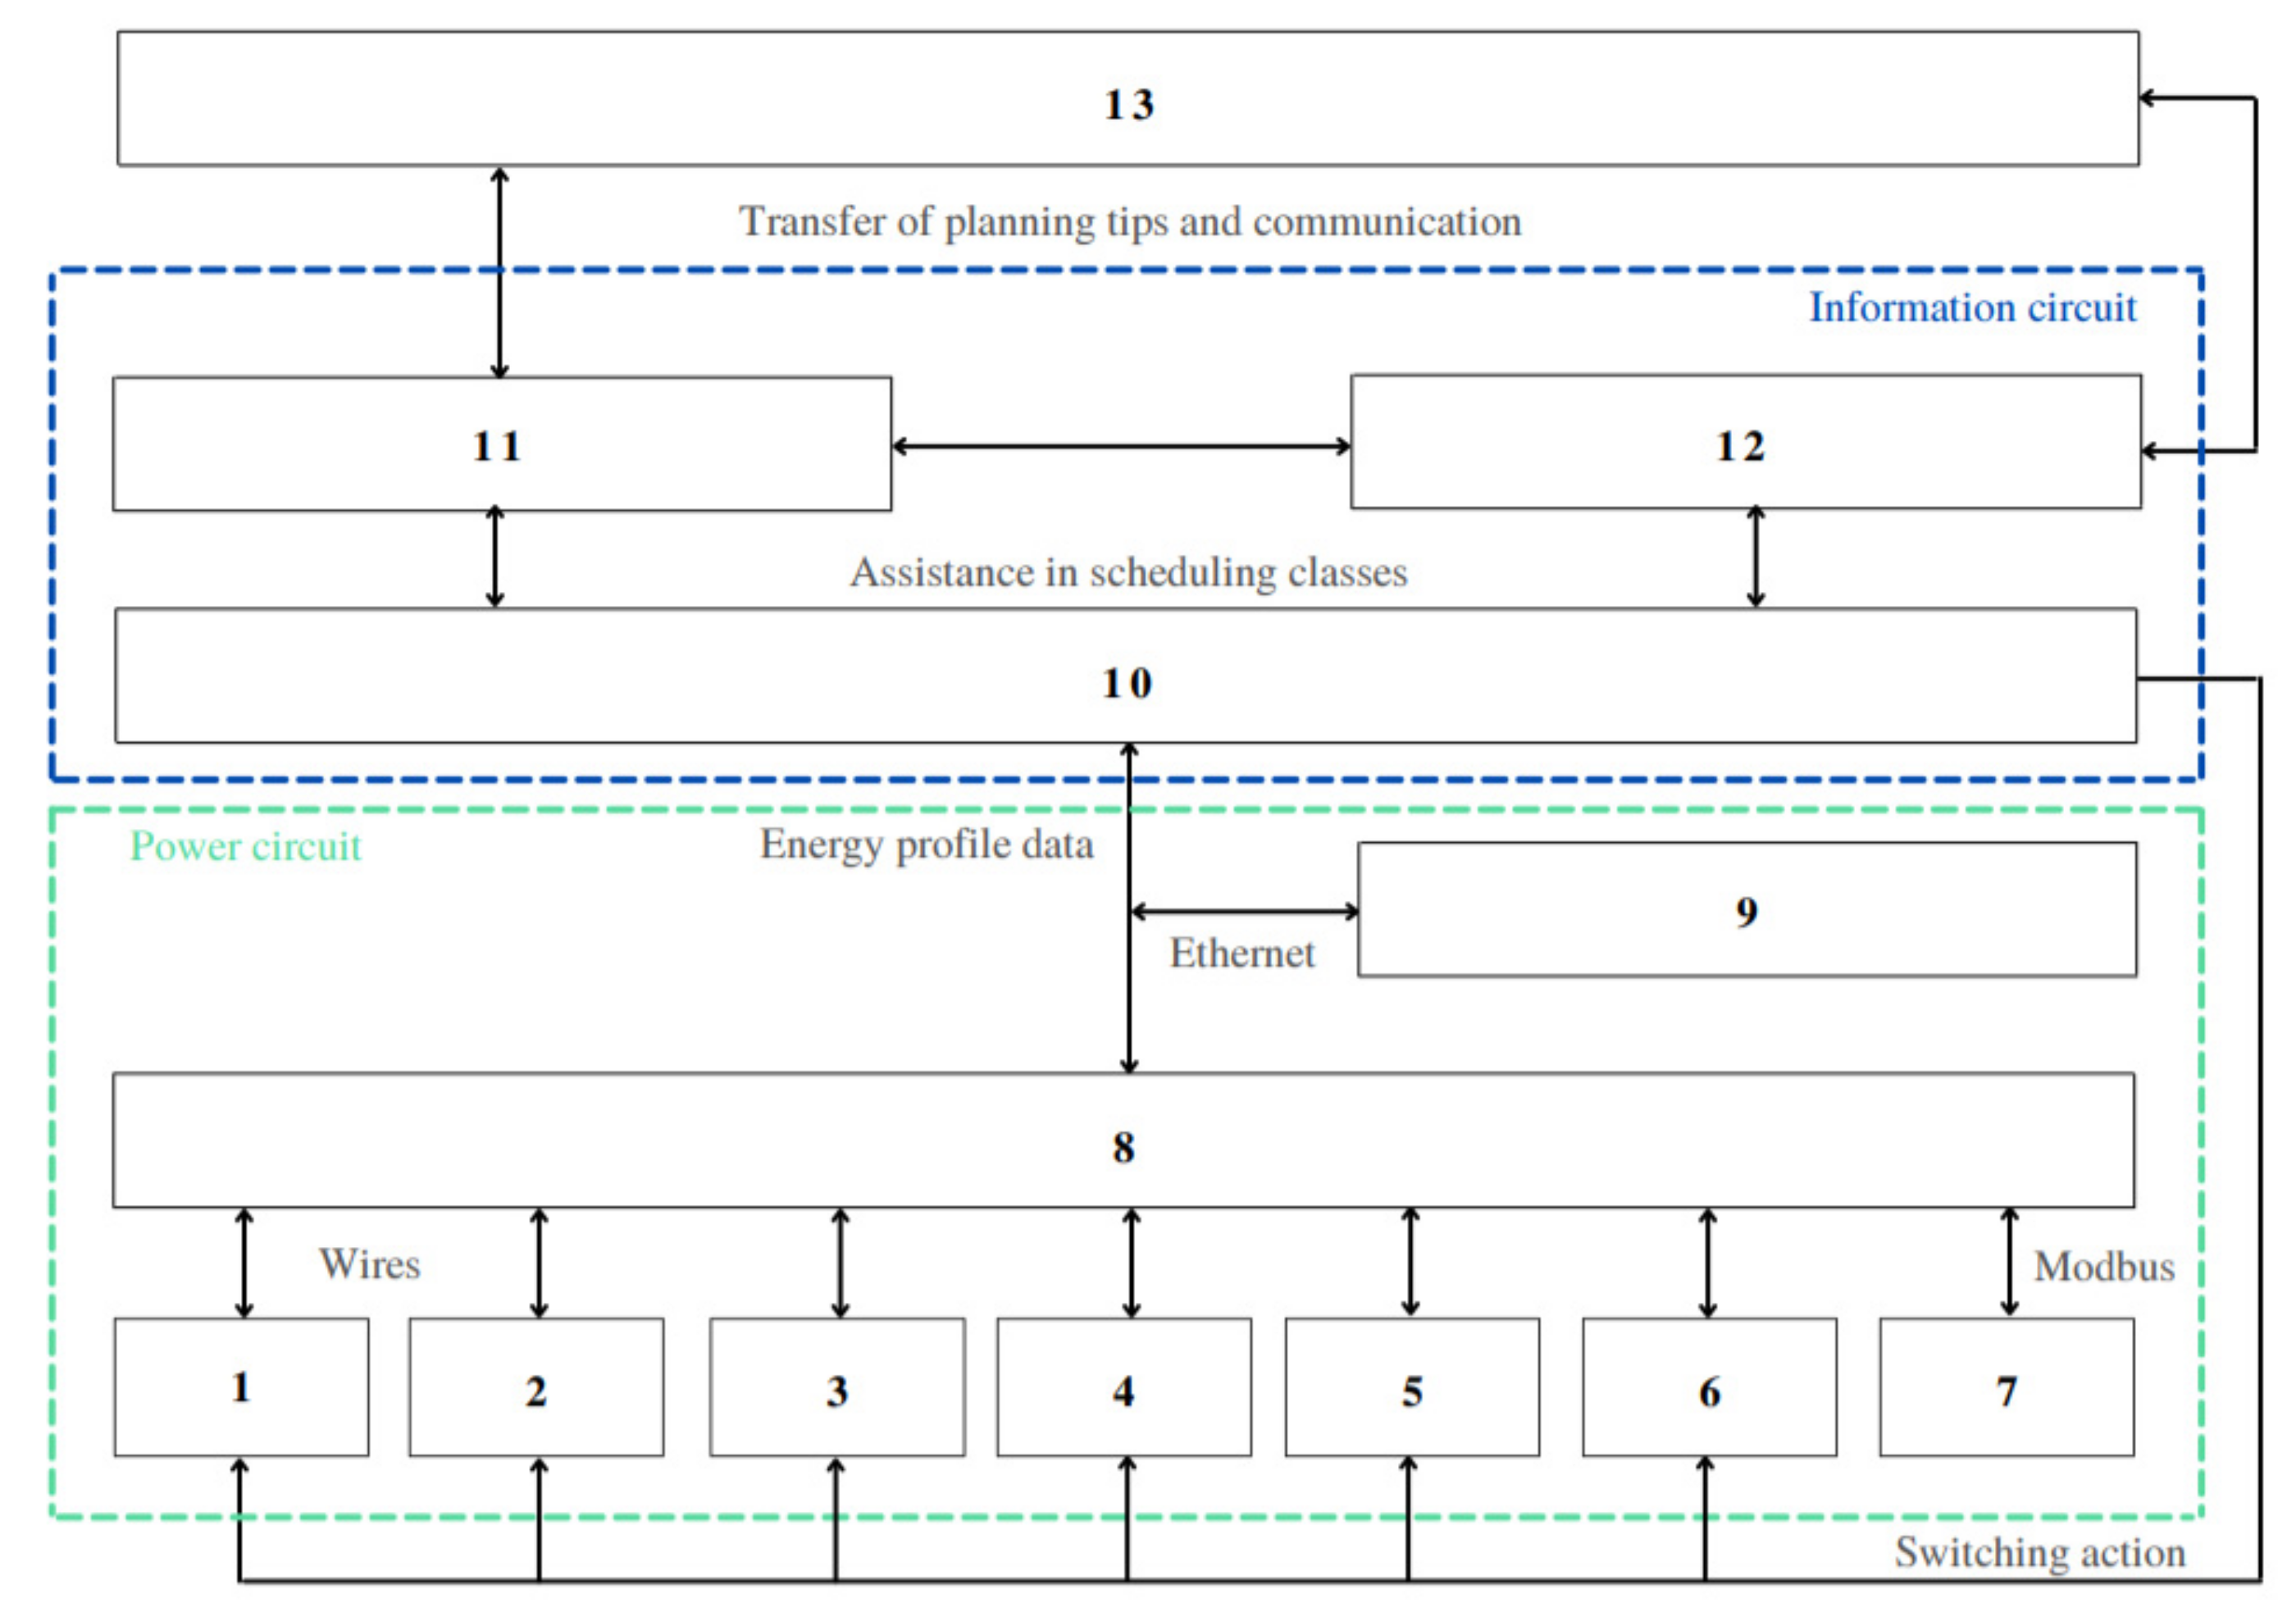
Due to the fact that many experiments in the laboratories of the university are associated with long-term data collection, changes in the workload of laboratories can take place automatically according to a predetermined schedule. The functional diagram of information interaction at the physical and channel level of the demand response system is shown in
Figure 14.
Legend in
Figure 14: 1—Stand for testing hot standby control systems based on PLC MODICON; 2—Stand for testing hot standby control systems based on PLC QUANTUM or a complex installation “Explosion-proof APCS by conveyor transport”; 3—Personal computers; 4—Projector and board; 5—Lighting; 6—Multifunction device; 7—Main power monitoring, input measurements; 8—Data bus Acts 9 Smartlink Ethernet; 9—Main switchgear; 10—Energy Management Server; 11—PersonalPower website; 12—PersonalPower mobile app; 13—User.
3.5. Load Scheduling Algorithm
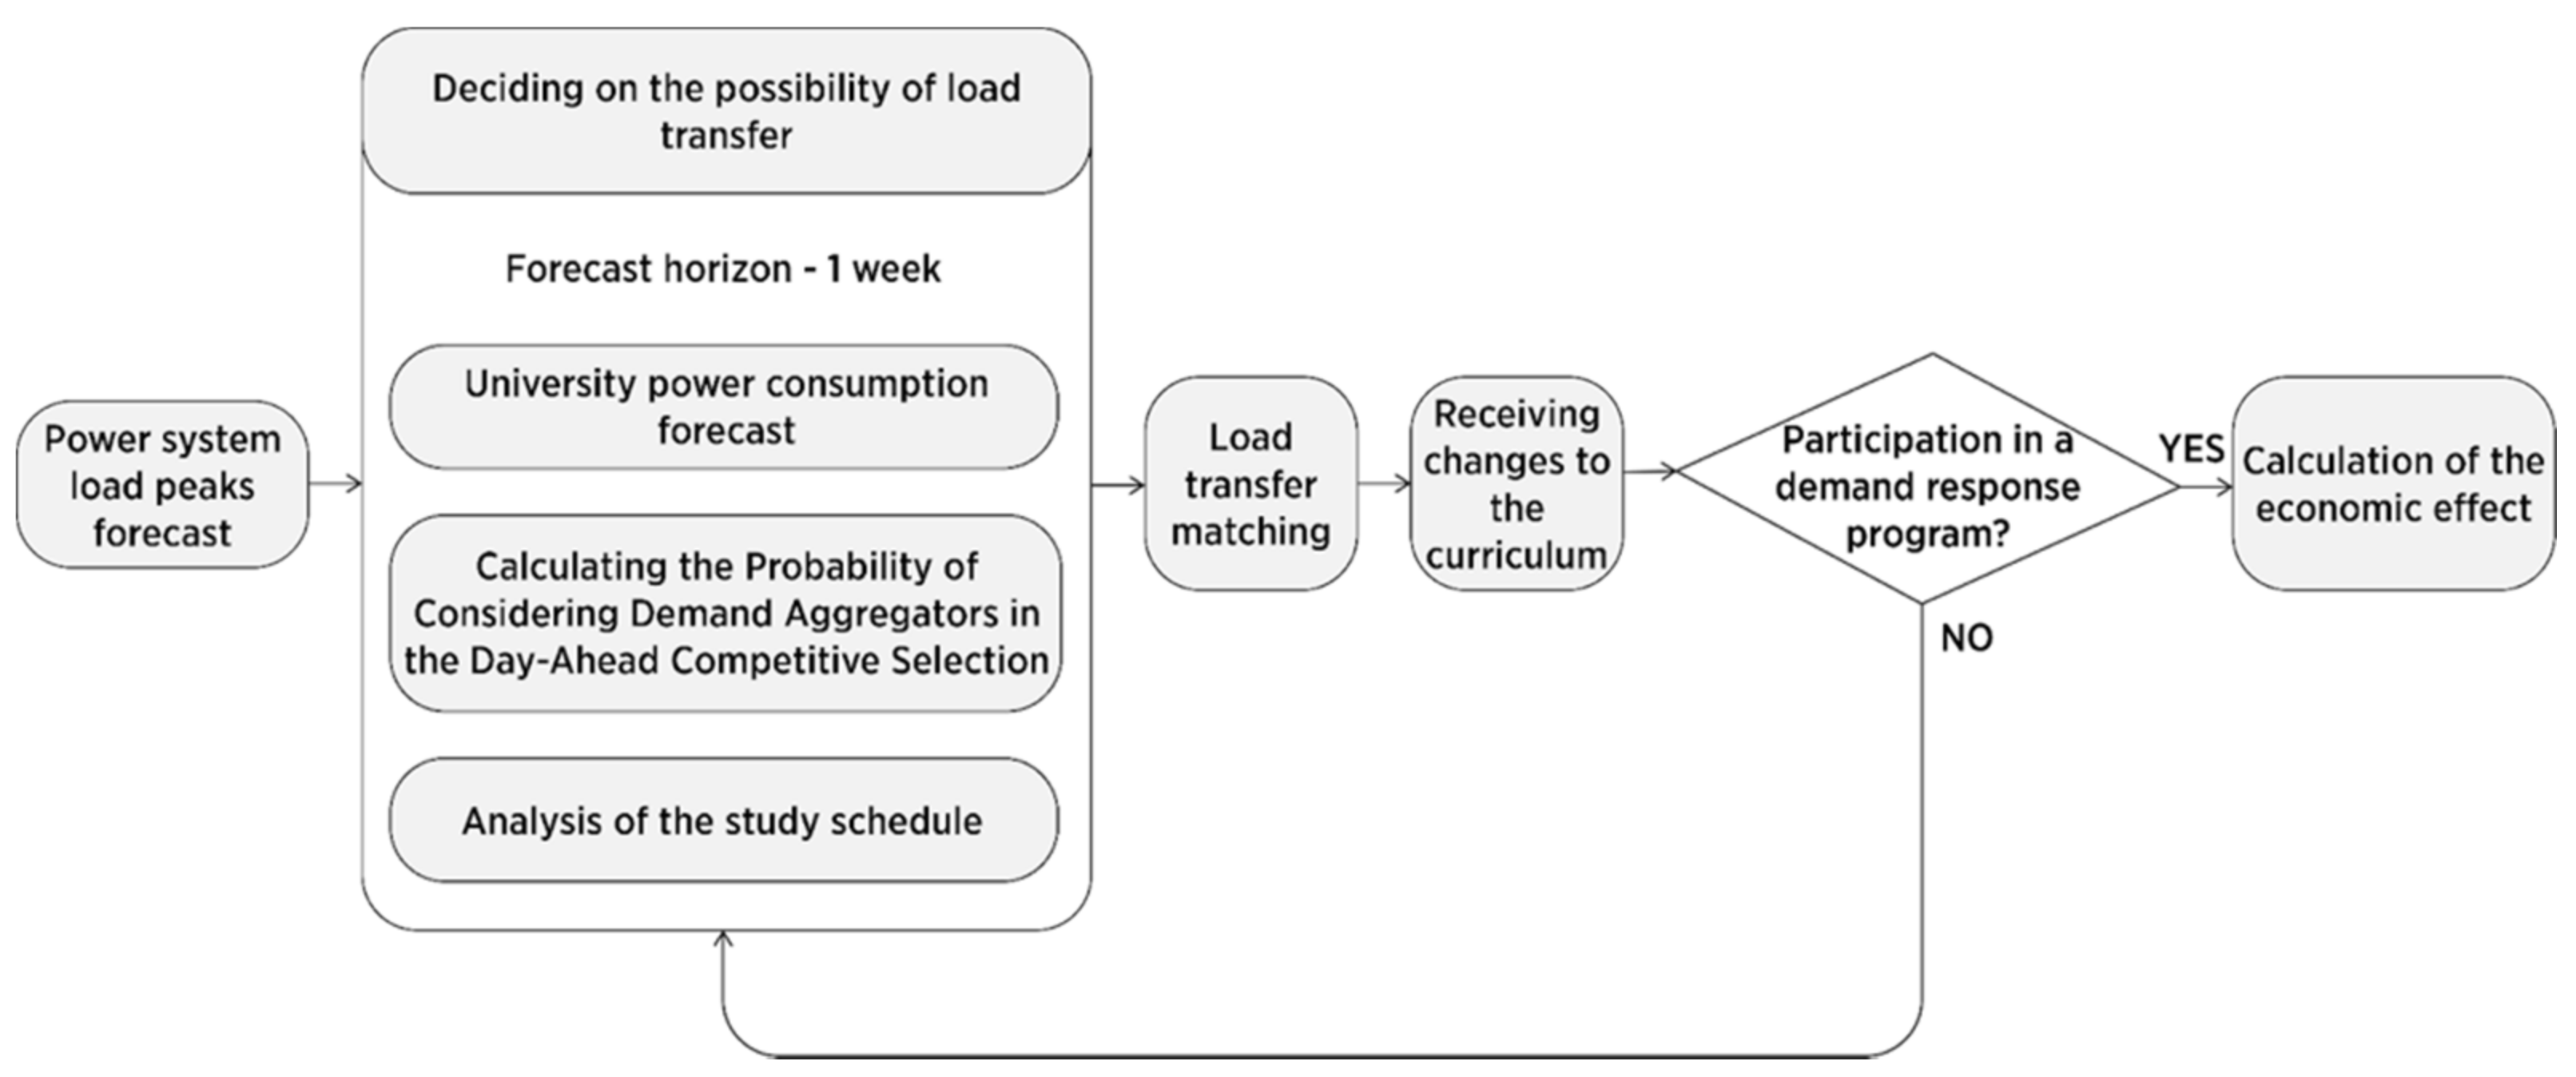
The decision to shift the load to participate in the demand response program is made according to the algorithm shown in
Figure 15.
The mathematical model of the algorithm for making decisions on the formation of the training schedule is formed on the basis of an evolutionary algorithm based on the optimal power consumption, taking into account the participation of the object in the demand response program.
The structure of the model is determined by the following sets:
—time intervals for classes;
—laboratories for conducting classes;
—student groups;
—teachers;
—power consumption of the university during the hours of the demand response program, determined from the predicted values of the power system load;
—the amount of basic consumption during the hours of the demand response program;
The model used in the genetic algorithm is represented as the Cartesian product of the above sets by the set {0,1}:
Constraints used in the model:
Therefore, each lesson
x is described by the following set:
where
—respectively, time, laboratory number, group, teacher, power consumption for the lesson
x.
We will also set the condition that no more than one group can take part in a laboratory lesson.
Also, in addition to the boundary conditions, it is necessary to determine the quality of the calculated description, which is determined by the following function:
where
—a sign that determines the violation of an additional requirement put forward to the schedule, for example, the wishes of the management, shortened days, etc.,
—significance of
.
Algorithm tasks: for the sets
T,
L and
Z find such a time and place for laboratory classes
, at which:
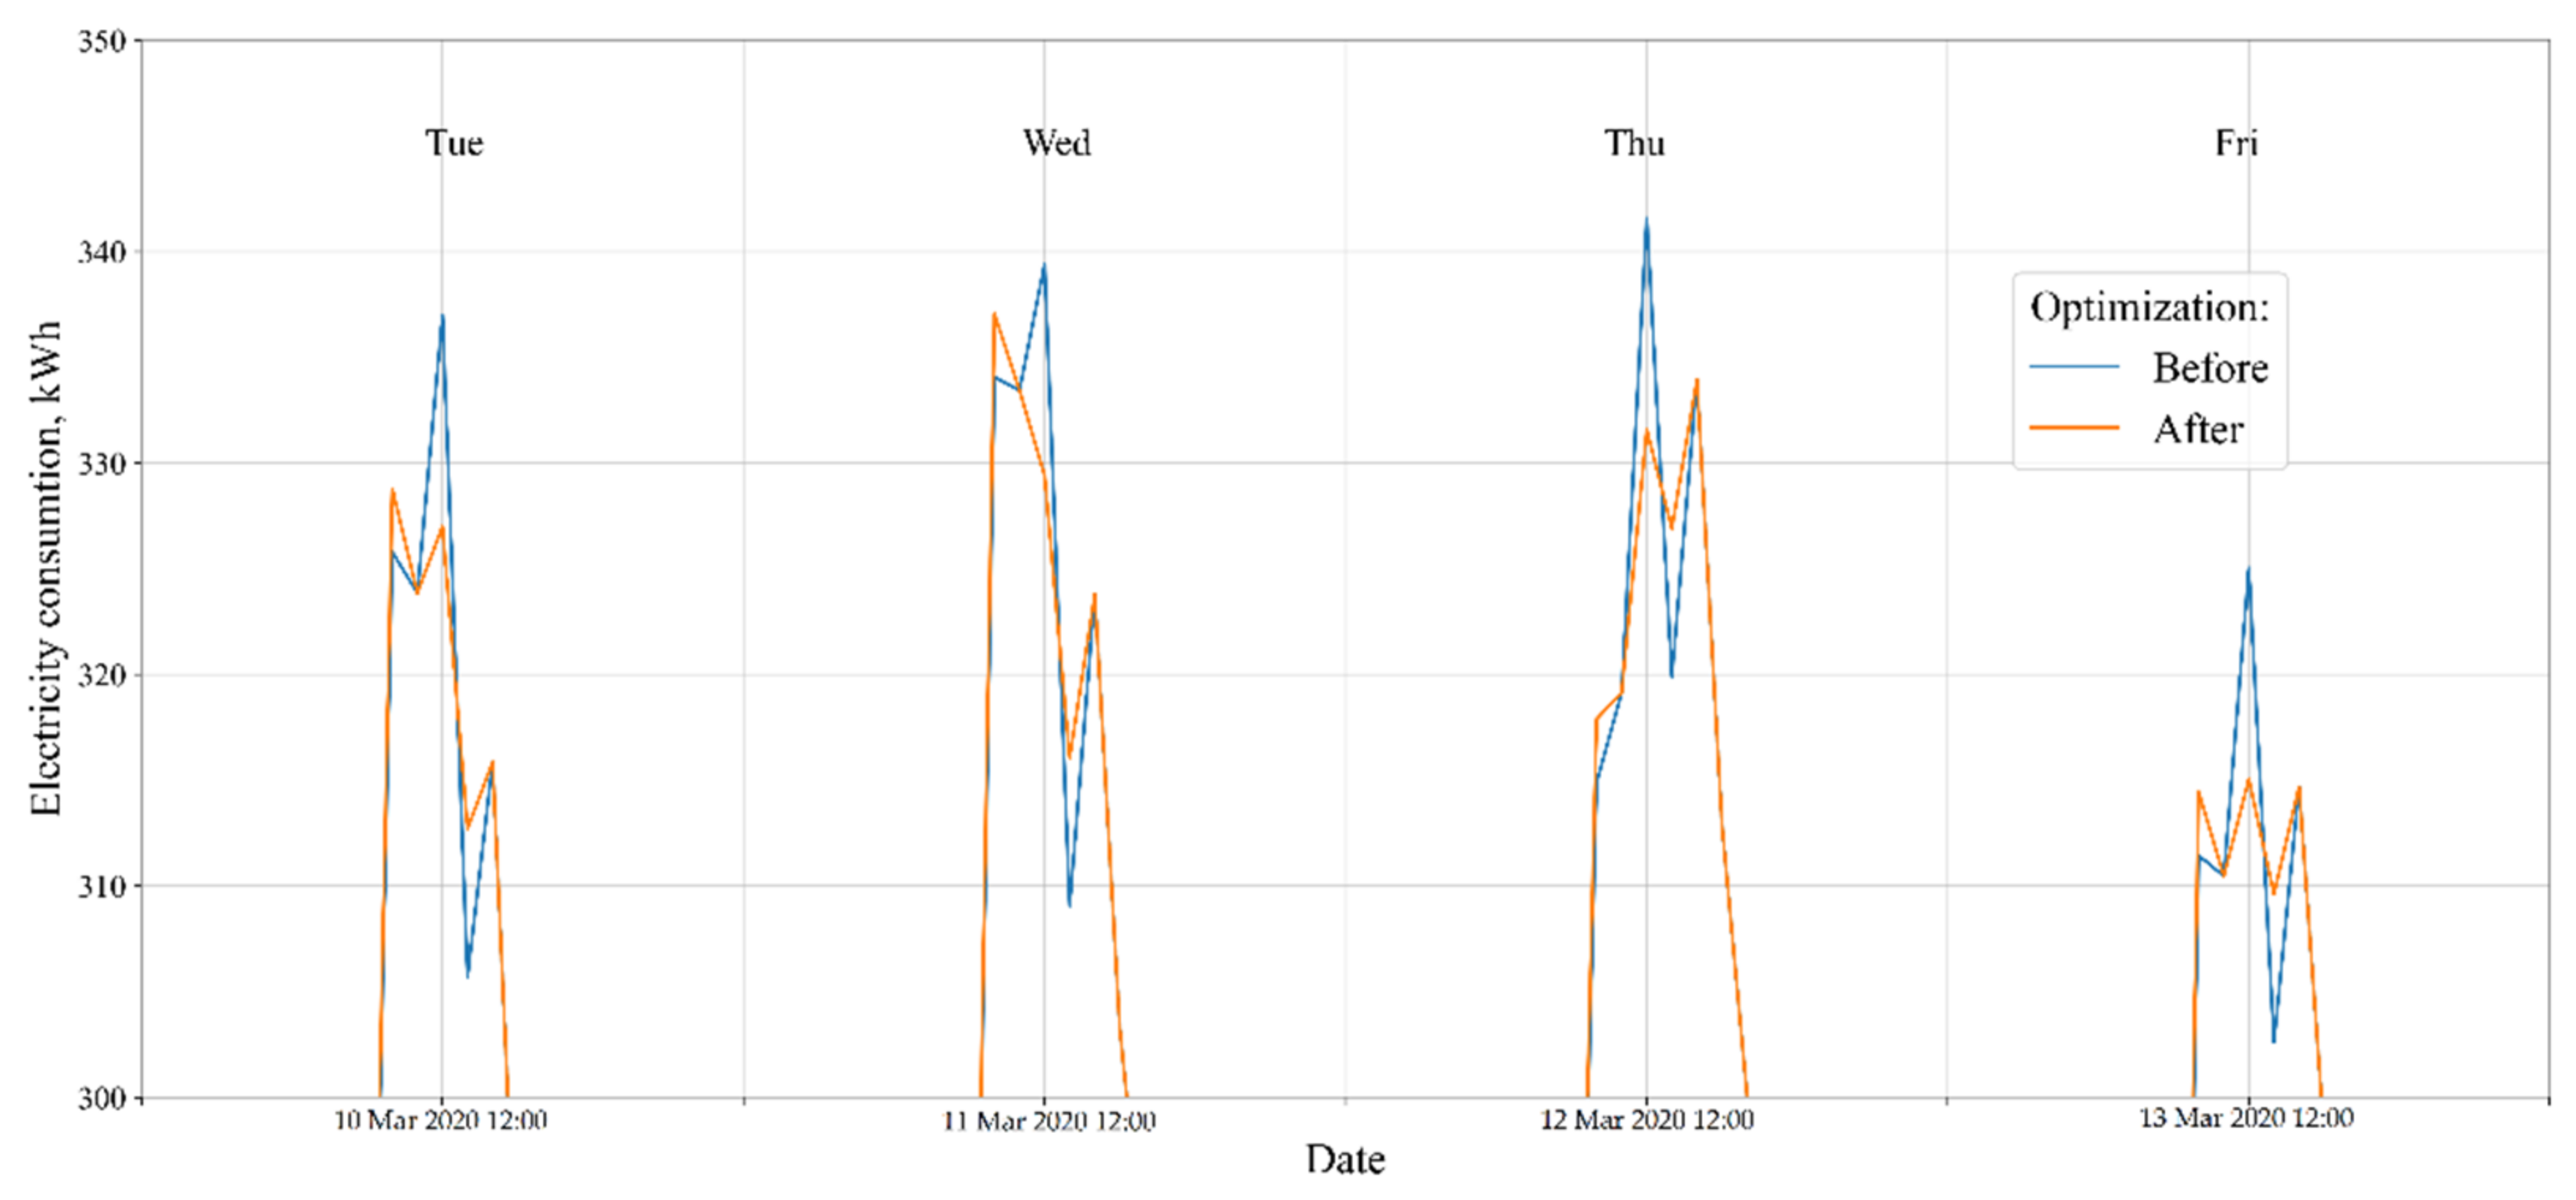
The result of applying this algorithm and taking into account the possibility of shifting the conduct of classes into four laboratories is a redistribution of loads, which leads to a decrease in consumption during the period of the demand response program requirement to 10 kWh (~4.5%). The result of shifting the load curve is shown in
Figure 16:
The values of peak daily consumption before and after optimization, as well as the magnitude of the decrease in peak consumption after applying the genetic algorithm are presented in
Table 5:
These values were obtained by optimizing the power consumption schedule by redistributing the teaching load of 2 laboratories, however, this algorithm has the ability to scale, which will increase the effectiveness of using the results of this study to more significant values. Load shifting helps to reduce peak consumption charges, which are often a significant part of the cost of electricity.
Figure 17 proposes a variant of transferring the lesson to a later time from 4:00 p.m. to 5:00 p.m., the load of the laboratory lesson is redistributed in order to equalize the load schedule and change the total power consumption. The maximum consumption is now around 9.2 kW. In this case, the audience load is manageable. By varying the time of classes, you can achieve the most profitable energy consumption.
Thus, simulation modeling allows you to build a profile of the behavioral consumption model of an object, which can be combined and adjusted depending on the conditions and factors related to the schedule, mode of operation, the number of students in groups, and the time of year. Also, this profile is the basis for the operation of optimization algorithms for the distribution and transfer of consumption. In addition to the load graph, the digital profile of the behavioral simulation model must be supplemented with calculated parameters that can be used for strategic demand response. To supplement the information model, it is proposed to use such parameters as the active power utilization factor, the shape factor of the active load graph, the maximum coefficient, the schedule fill factor, and the number of hours of use of the active load graph per day [
62]. The averaging interval is 15 min.
The calculation of indicators according to the active power graph is carried out according to the following formulas.
Indicator reflecting the average value of active power consumed per day—average active power consumed per day, W:
Indicator numerically equal to the square root of the sum of the squares of the active power of a group of electrical receivers—the root-mean-square active power per day, W:
Active power utilization factor—the ratio of the average active power to the installed power, showing the level of actual active power utilization:
where
Pr—rated power of the
k-th electrical receiver.
The shape factor of the active load graph is the ratio of the rms power of a group of receivers for a certain period to the average value for the same period of time, which characterizes the unevenness of the load over time:
Maximum active load factor—the ratio of the calculated active power to the average load for a certain period of time (equal to the duration of the busiest shift), linking the calculated and average loads:
The fill factor of the active load graph is the ratio of the average active power to the maximum for a certain period (equal to the duration of the busiest shift), showing the degree of filling of the electric load graph:
The number of hours of use of the maximum active load per day is the ratio of the average active power consumed per day to the maximum power for a certain period (equal to the duration of the busiest shift):
Table 6 shows a comparison of the parameters calculated by Equations (7)–(13) before and after adjusting the load schedule.
Thus, in this case, the regulation of power consumption was carried out in two ways:
Because of using the algorithm, the consumption of the average active power is reduced due to the overall decrease in power consumption, and the number of hours of using the maximum active load per day is reduced by changing the schedule of laboratory work. When using this algorithm in several laboratories, the total effect will be impressive.
4. Discussion
The investigated models describe the architecture of the interaction of devices involved in demand response at different levels. The algorithms presented in this study allow not only optimize the process of power consumption but also allow educational institutions to participate in demand response in the electric power services market by redistributing laboratory work that requires the inclusion of stands with electromechanical equipment in the training schedule.
Also, the effects of increasing energy efficiency and energy saving can be achieved by taking into account the following proposals: by modernizing the legal framework in the context of electricity metering and ASCME (automated system of control and metering of energy resources) systems in terms of hourly dynamic tariffs for electricity and capacity, as well as a general decrease in the maximum capacity of technological connection will expand the existing economic effect.
If we accept the fact that there is a tariff depending on the level of consumption for each individual substation, then there is a need to modernize the developed algorithm in order to combine the increased level of consumption of an individual consumer of the substation during the hours of minimum load on it. For example, an increase in the electricity tariff during the peak period at a given substation will provide an additional incentive to participate in demand response.
Because of the study, it is possible to note not only important technological effects, such as a decrease in peak consumption and the optimization of the facility load schedule, but also economic benefits.
Since now in Russia the payment for electricity and capacity is calculated at a one-rate or two-rate tariff, it is not possible to carry out a demand response policy. However, it can be compared using the example of dynamic prices on the wholesale electricity market in Germany [
63], where there is a spot market in which electricity is traded within a day in a time from 20 min to an hour. Sales are carried out 30 min before order execution. Accordingly, changes in supply and demand in a short time are reflected in the price.
The economic effect of transferring the load can be obtained both for participation in the aggregation of demand and the provision of services for transferring and limiting consumption, and by reducing the payment for consumed electricity. Thus, according to
Table 4 in the study [
64], the overall reduction in total costs due to consumption transfer is small, and this is true for all types of households considered in the study, although the percentage cost savings are greatest for households with low consumption.
The decrease in the electricity bill is also influenced by the control of limiting the declared capacity during peak hours, and consumption management based on modeling and forecasting consumption can become a tool for reducing the declared capacity in the contract for the provision of electricity supply services and, as a result, reducing payments. Reducing the declared capacity can significantly affect savings in planning electricity consumption, you can also abandon the construction and maintenance of peak generation power plants and reduce emissions into the environment.
5. Conclusions
The study analyzes typical platform solutions on the market. The review of the legal framework of Russia and Germany in the context of the integration of the concept of market demand response and the restrictions that must be overcome is carried out. The paper considers the risks of introducing the concept of demand response in the Russian market, as well as the results of the implementation of a pilot project, which shows positive results and the willingness of fuel and energy companies to participate in demand response. Based on the selected object of research, physical, information and simulation models were formed, which make it possible to display the connected load in the laboratory, its unevenness during the week, which makes it possible to distribute training sessions depending on the energy consumption of the laboratories and the possibility of transferring it during the day. Protocols for data transmission and control actions are considered, and load curves are modeled depending on the power system commands to reduce or transfer the load.
Thus, based on the studied models, an algorithm has been developed for collecting and processing data for the purposes of the demand response program, which is based on the application of the university’s power consumption forecast and data from the power system to form control actions. The models used to predict power consumption are considered in detail, and patterns in the formation of load graphs are revealed. The indicators of the load graph have been calculated, which make it possible to display the unevenness of power consumption throughout the year in different periods—a month, a week, a day.
After conducting such an analysis, a scheme of information interaction on the physical and channel level of the demand response system and an algorithm for making a decision on load transfer with a description of the sets that determine the structure of the model was developed.
The study allows educational institutions to consider the possibility of constructing a flexible schedule depending on the equipment used in laboratories based on the university’s power consumption forecast and the power system’s power consumption forecast while receiving not only a technological effect, but also an economic benefit depending on the tariff-setting model in different countries. At the same time, it is required to consolidate the concept of demand response at the legislative level, to introduce legislation and regulations, increase the involvement of companies and a conscious approach to electricity consumption through the large-scale popularization of reasonable electricity consumption and energy efficiency.


