
Heavy Metal Contamination and Human Health Implications in the Chan Thnal Reservoir, Cambodia
by
 and
and
Lita Chheang
1, 
Nisakorn Thongkon
1,
Tongchai Sriwiriyarat
2 and
Sudtida Pliankarom Thanasupsin
3,* 1
Department of Chemistry, Faculty of Science, King Mongkut’s University of Technology Thonburi, Bangkok 10140, Thailand
2
Department of Chemical Engineering, Faculty of Engineering, Burapha University, Chonburi 20131, Thailand
3
Chemistry for Green Society and Healthy Living Research Unit, Faculty of Science, King Mongkut’s University of Technology Thonburi, Bangkok 10140, Thailand
*
Author to whom correspondence should be addressed.
Sustainability 2021, 13(24), 13538; https://doi.org/10.3390/su132413538
Submission received: 5 November 2021
/
Revised: 29 November 2021
/
Accepted: 29 November 2021
/
Published: 7 December 2021
(This article belongs to the Topic Climate Change and Environmental Sustainability)
Abstract
:Chan Thnal reservoir, built during the Pol Pot period, is the major water source for the people in Krang Chek commune, Kampong Speu Province, Cambodia. Metal pollution caused by agricultural activities, improper wastewater treatment, and municipal waste disposal poses serious environmental health problems. In this study, the concentrations of four potential toxic metals (i.e., Cd, Cu, Pb, and Zn) from six locations across the reservoir were investigated both in the water and sediment. The results reflected progressive deterioration and indicated moderate to heavy pollution from the metals. The metal levels in the water were in the order of Zn > Cu > Pb > Cd. The statistical analysis revealed primary sources of heavy metals contamination in the water. Cd, Cu, Zn, and Pb in the water likely originate from anthropogenic activities including agricultural runoff (i.e., the use of fertilizers and pesticides) and urban runoff (i.e., improper wastewater discharge and waste disposal). Among the four metals, the Pb levels in the water significantly exceeded the guideline for drinking water in all locations. The health risk assessment revealed serious non-carcinogenic risks of Pb intake in the children at the age below 10 and infants. Appropriate control and protection strategies are urgently needed to cut off the main Pb exposure pathway in pregnant women, children, and infants.
1. Introduction
Rapid growth in the industrial and agricultural sectors is one of the main contributors to environmental deterioration. Environmental pollutants from both anthropogenic and natural sources enter the environment through various processes and cause serious threats to the ecosystem and human health. Heavy metals are a group of environmental pollutants that are potentially toxic, persistent, nondegradable, and able to bioaccumulate [1,2]. Heavy metals enter the environment through several processes such as soil erosion of metal ions and leaching of heavy metals, metal corrosion, sediment resuspension, and atmospheric deposition. Their natural sources are dominated by parent rocks and metal-bearing minerals. The weathering of metal-bearing rocks and volcanic eruptions are significant processes contributing to heavy metal pollution. The major anthropogenic sources are industrial and metallurgical activities, agricultural activities, transportation, wastewater discharge, and waste disposal [3]. Like many other heavy metals, cadmium (Cd), lead (Pb), copper (Cu), and zinc (Zn) can cause a combination of environmental and health problems. Major sources of these metals in agricultural applications are, for example, fertilizers, pesticides, and livestock manures [4]. Cu and Zn are biochemically classified as essential elements. However, they can be toxic to biota at certain threshold concentrations [4]. Cd and Pb are nonessential metals and are naturally toxic even at low concentrations. Cd is a naturally occurring environmental pollutant derived from both industrial and agricultural sources [5]. One of the major causes of Cd released into the environment is from excessive application of pesticides and phosphate fertilizers [6,7]. Chronic exposure to Cd can invariably cause health problems such as stress, hypertension, kidney dysfunction, proliferative lesions of the prostate, bone fractures, and lung cancer [5,8]. Major contributing sources of Pb in the environment are natural and anthropogenic activities. Much of it comes from burning fuel, production of batteries, ammunition, metal products, and pigment-related manufacturing [9]. Moderate exposure to Pb can significantly impair human reproductive function such as a decrease in human semen quality [1,10]. Concerning the vulnerable groups, i.e., pregnant women, infants, and children under the age of four, excessive intake of lead can cause long-term health problems associated with children’s behaviors, growth, and development of their hearing and learning abilities. In adults, lead poisoning impairs the stomach, kidneys, brain, and nervous system [11]. Among other heavy metals, Cu and Zn are classified as essential elements. Apart from being used in electrical systems, copper compounds are used in agriculture as fungicides, algaecides, and feed additives while Zn uses vary such as in fertilizers, batteries, medical drugs, and household applications. Major contributions of Zn and Cu contamination in the surface waters are both point and nonpoint sources. For the Chan Thnal reservoir, the possible sources of Cu and Zn contamination in the environment are improper disposal of household waste and wastewater, direct use of pesticides on paddy soils, burning of coal, or waste-burning operations. Their toxic effects on humans are relatively less than those of other nonessential metals [12]. Adults typically need 2 to 3 mg of Cu and 12 to 14 mg of Zn daily. Exposure to Cu above certain levels may lead to liver and kidney dysfunctions. The provisional tolerable weekly intake (PTWI) value of Cu is 3500 µg/kg body weight/week [13,14]. The oral reference dose (RfD) of Zn is 300 µg/kg body weight/day [13,15]. Effects of Zn toxicity can be diverse. Excess intake of Zn over the destroying capacity of the body can interfere with metabolic processes and stress development [16]. Indications of Zn overexposure are a combination of gastrointestinal effects and pancreatitis [17].
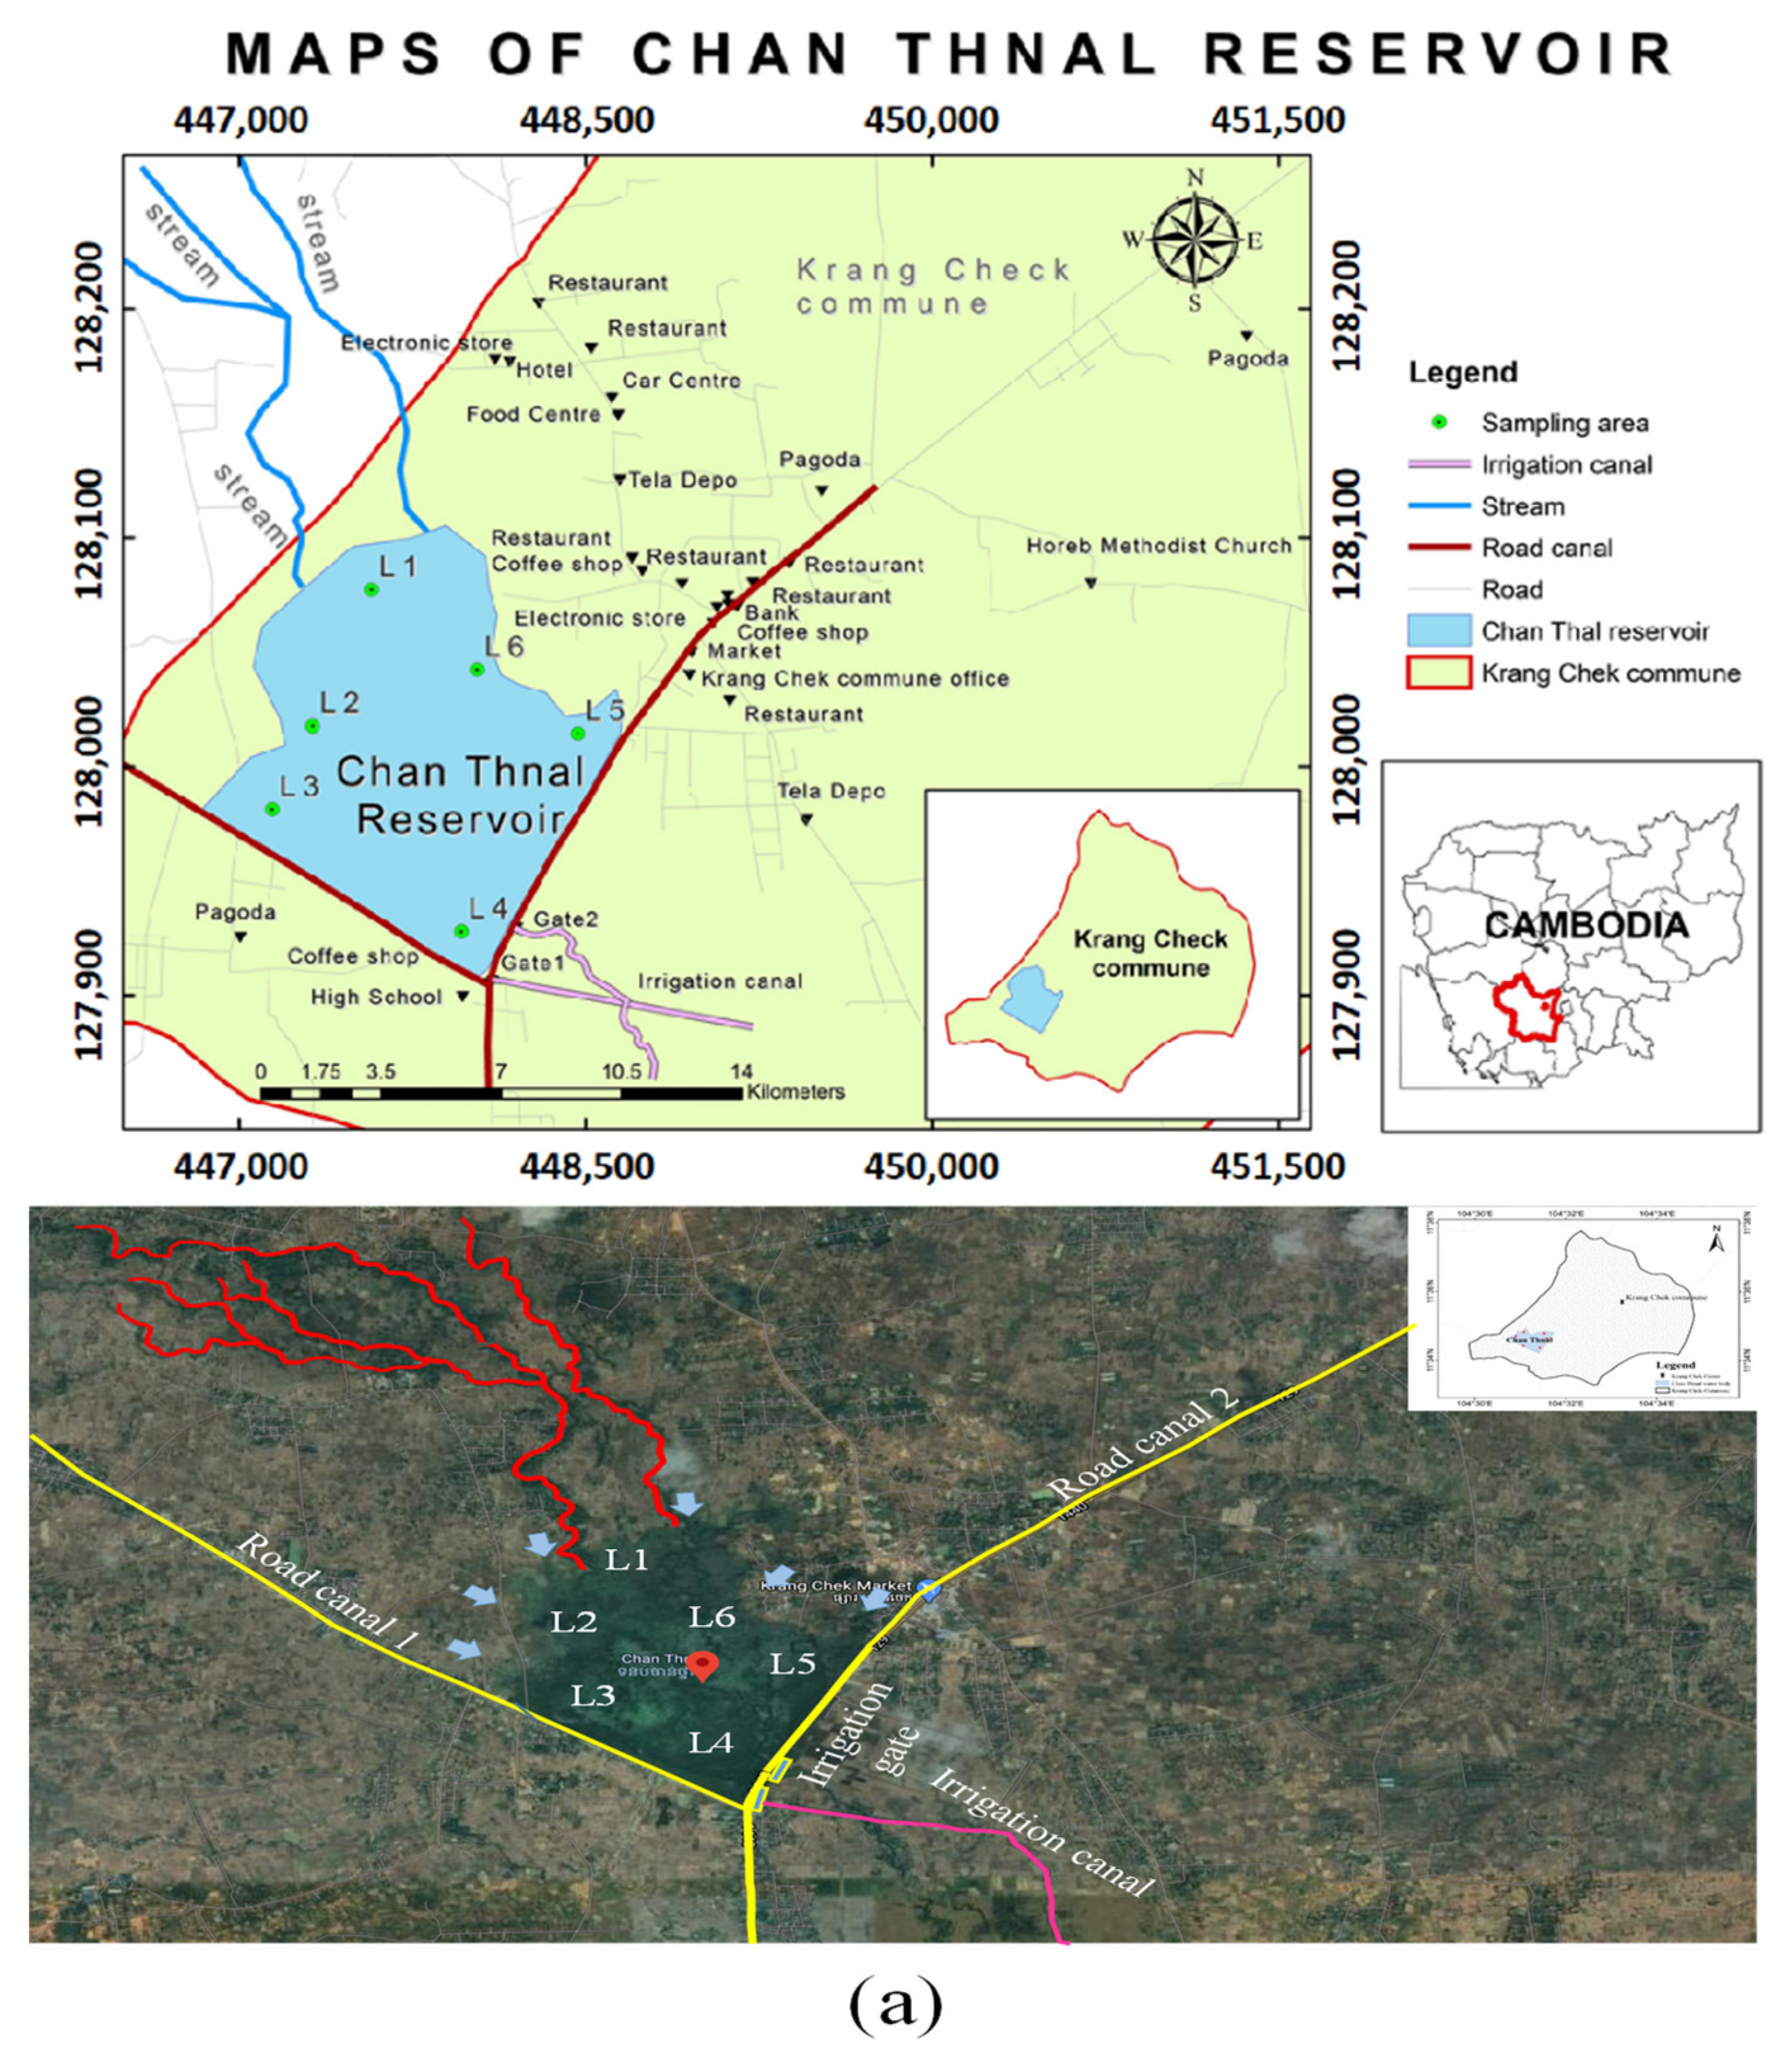
The Chan Thnal reservoir located in Cambodia was built in 1976 during the Pol Pot period. Rainwater is the main water source of this reservoir. With a capacity of approximately 3,000,000 m3, it is the major water source for approximately 2300 farmers in Krang Chek commune, Kampong Speu Province, which is known to be one of the lowest income provinces in Cambodia with a low landholding area of 0.3 ha per farmer household [18]. People use water from this reservoir for agriculture and daily consumption. During the wet season, the surplus water from the reservoir is discharged to supply the downstream area through irrigation gates and canals, as shown in Figure 1a. Generally, the presence of heavy metals in the aquatic environment comes from both natural and anthropogenic activities [2,19,20,21,22,23,24,25,26]. Chan Thnal reservoir is surrounded by large agricultural areas, scattered farmer households, commercial and residential areas, poultry farms, schools, and community markets. In recent decades, an increase in population and urbanization has led to an increase in quantities of both non-hazardous and hazardous waste production [19,24,27]. It can be expected that the catchment of this reservoir has been affected by improper waste disposal since open dumping and open burning of household and agricultural hazardous wastes (i.e., batteries, empty bottles of pesticides, and herbicides) are common practices in this area. In addition, excessive use of fertilizers and pesticides in a vast agricultural area is responsible for producing heavy metals in the water and soil. These activities can cause an increase in the mobilization of heavy metals in the environment [1,6,28]. It is likely that the Chan Thnal reservoir receives drainage from this catchment via runoff and two road canals connected to the reservoir, as shown in Figure 1a. Road canal 1 runs from the northwest and road canal 2 runs from the northeast. The road canals carry residential, commercial, and agricultural discharges to the reservoir. Increasing heavy metal pollution may cause significant adverse effects on invertebrates, fish, and human health [27,28,29,30,31,32,33,34,35,36]. Recently, water pollution and metal contamination in this reservoir have become major environmental and health concerns for the people and local authorities. Thus far, the quantitative analysis of heavy metals pollution in the Chan Thnal reservoir has not been undertaken. Our study is the first to provide insight and information on the heavy metals contamination in both the water and sediment of the Chan Thnal reservoir. Hence, this study aimed to: (1) measure the contamination levels and investigate the distribution of four heavy metals (Cd, Cu, Zn, and Pb) in both the water and sediment; (2) use various sediment indicators such as contamination factor, pollution load index, and enrichment factor to evaluate the pollution degree and ecological risk levels of the sediments based on Cd, Cu, Pb, and Zn; (3) use the health index to assess the potential non-carcinogenic health effects; and (4) perform the cluster and factor analysis to determine the possible sources of heavy metals contamination in the water of the Chan Thnal reservoir.
2. Materials and Methods
2.1. Background of the Study Area
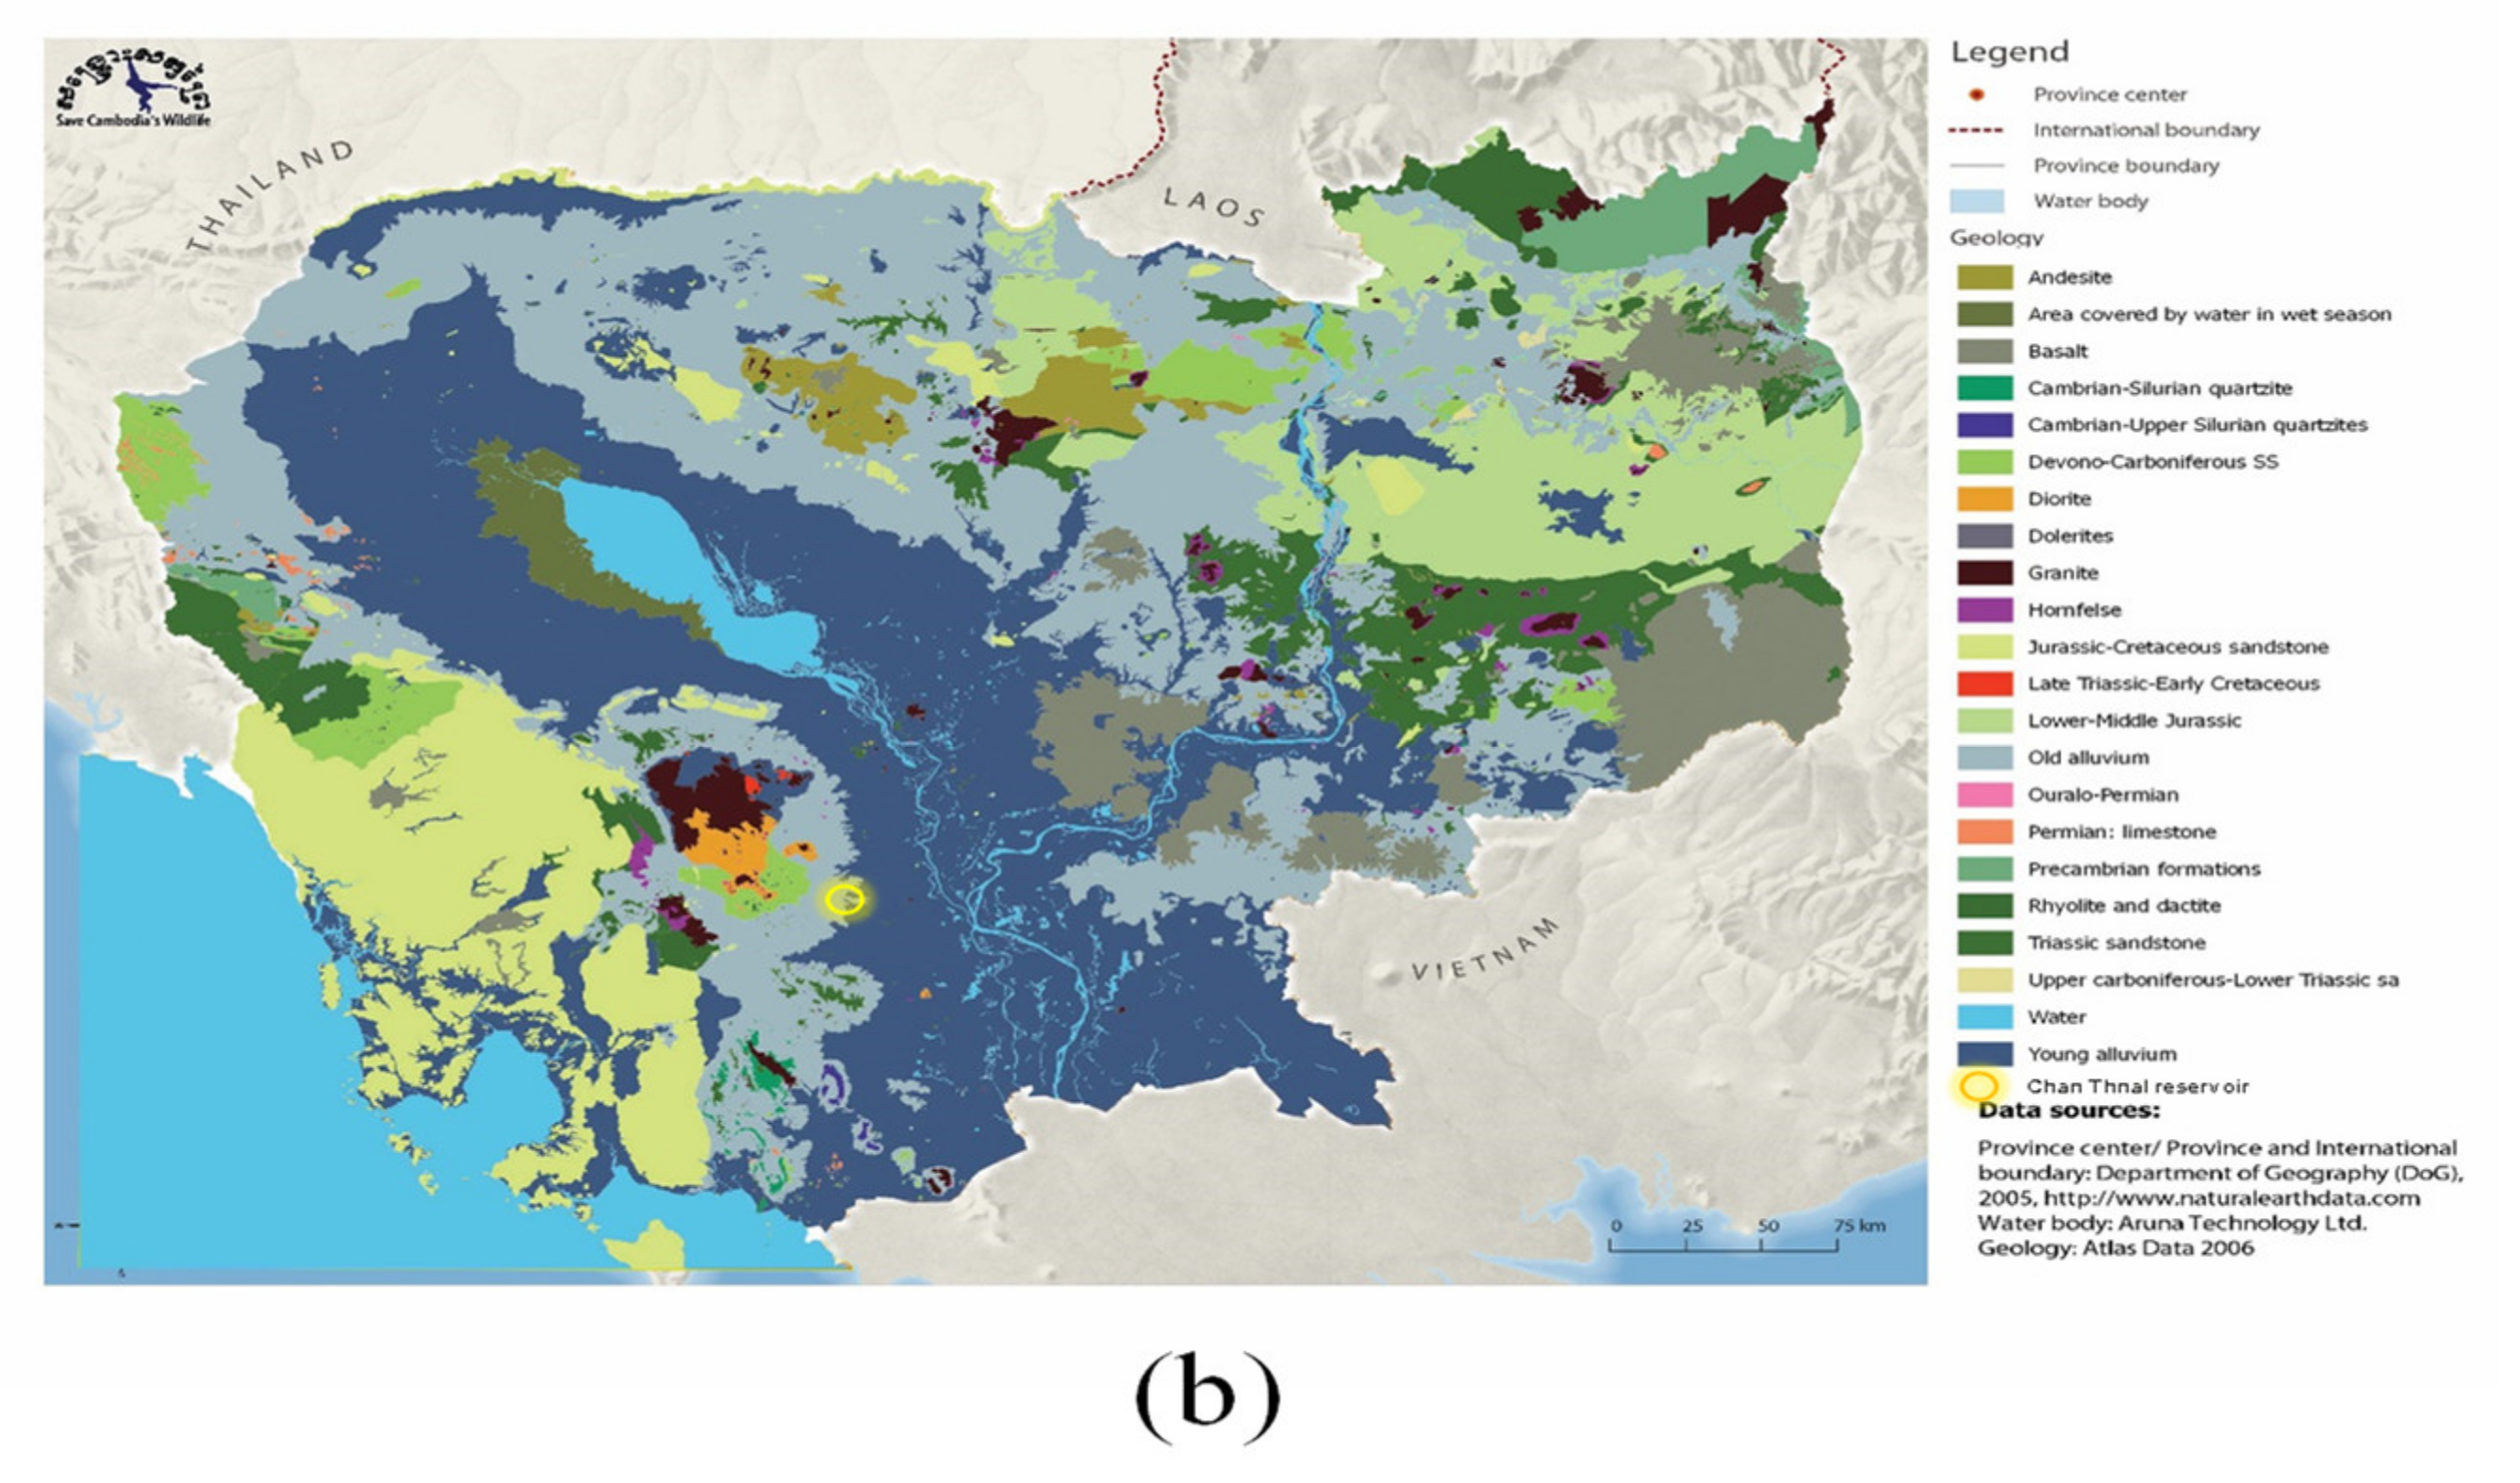
The Chan Thnal reservoir is situated at latitude 11°34′38.5″ N and longitude 104°31′18.2″ E in the Krang Chek district of Kampong Speu Province. The wet season runs from May to October, and the dry season runs from November to April. The average annual rainfall is approximately 1400 mm. The catchment area of the reservoir is approximately 268 km2, resulting in a maximum capacity of 3 × 10⁶ cubic meters. From the irrigation main gate, it supplies the water to the irrigation canals, having a total length of 7320 m. The major crop cultivated in this area is rice paddies. The reservoir is not only a water source but also a community food bank for 2300 households in the Krang Check commune. The sediments are sandy, loamy, clayey, and a combination of these [18,37]. In Figure 1a, the reservoir receives road, municipal, and agricultural discharges via runoff and road canals 1 and 2. Location 1 is north of the reservoir where the terrain is higher than the south. It is the point where two unnamed natural streams are connected to the reservoir. These two small streams have intermittent flow and no water during the dry season. Location 2 is relatively far from the city. Mainly, it receives agricultural runoff from the northeastern part of the reservoir. Locations 3 and 5 are the locations that receive the discharge of road canals 1 and 2, respectively. Location 4 is close to the irrigation gates south of the reservoir. Location 6 is northeast of the reservoir. This location receives runoff from municipalities (households, shops, restaurants, and duck farms). As shown in Figure 1b, the Chan Thnal reservoir is located on the old alluvium and young alluvium deposits. The natural occurrence of heavy metals in these deposits is from various processes such as the weathering process of parent rocks (i.e., igneous rocks, sedimentary rocks, and metamorphic rocks), soil formation, and the deposition of organic materials and inorganic fractions [3], while anthropogenic activities, for example, industrial discharge, agricultural runoff (i.e., fertilizers and pesticides), wastewater discharge, and waste disposal are major sources which lead to an increase in heavy metals in these deposits [4]. The concentration ranges of selected heavy metals in basaltic igneous, granite igneous, and shales and clays are as follows: Cd 0.006–0.6 ppm (basaltic igneous), 0.003–0.18 ppm (granite igneous), 0.0–11 ppm (shales and clays); Pb 30–160 ppm (basaltic igneous), 4–30 ppm (granite igneous), 18–120 ppm (shales and clays); Cu 48–240 ppm (basaltic igneous), 5–140 ppm (granite igneous), 18–180 ppm (shales and clays); and Zn 2–18 ppm (basaltic igneous), 6–30 ppm (granite igneous), 18–50 ppm (shales and clays).
2.2. Samples Collection
Water and sediment samples were collected from six locations around the Chan Thnal reservoir. To date, there have been no previous reports on the levels of potentially toxic metals in the Chan Thnal reservoir or reports relating the levels of heavy metals in uncontaminated soil in Cambodia that can be used as background values.
Triplicate water samples were randomly collected at each location in 500 mL polyethylene bottles. These sampling bottles were precleaned with 10% nitric acid for 24 h and rinsed three times with deionized water. Rinsing the bottles three times with the water samples was performed at sites before taking the water samples. Immediately after collection, the water samples were preserved and kept acidified with nitric acid (pH ~ 2) until the measurement. At each location, three to six sediment samples, randomly collected using a grab sampler at approximately 10 cm below the sediment surface, were kept at 3–4 °C and brought back to the laboratory within 24 h [19,27,38].
Parameters including temperature, dissolved oxygen (DO), and pH were also measured and analyzed on-site. Measurement of these parameters was conducted using a DO meter (HANNA, DO-5512SD) and a pH meter (INDEX, ID1000).
2.3. Sample Preparation and Analysis
Upon arrival, the water samples were filtered through 0.45 µm glass filter papers, transferred to new precleaned polyethylene bottles, and kept in the refrigerator for further sample preparation steps. The sediment samples were freeze-dried at −80 °C for approximately 5 days until completely dry, ground, and sieved with 2 mm mesh. For the digestion step, 50 mL of water samples (triplicate) was digested with 2.5 mL of 69% nitric acid at 90 ± 5 °C on a hotplate for 1 h. The digested samples were filtered through Whatman filter papers and filtered again through 0.2 µm nylon membrane filters followed by a volume adjustment to 50 mL with deionized water.
For the sediment samples, 2 g of the sediment samples (triplicate) was digested with the acid solution (i.e., 10 mL of 69% HNO3, 30 mL of 36% HCl, and 20 mL of 30% H2O2) at 180–220 °C for 2 h. The digested sediment samples were then filtered through Whatman filter paper (grade no. 42, ∅ 70 mm) and filtered again through 0.45 µm nylon membrane filters followed by a volume adjustment to 50 mL with deionized distilled water [19,27,38].
2.4. Quality Control and Assurance
All analyses were carried out in triplicate. Heavy metals were measured using inductively coupled plasma optical emission spectrometry (ICP-OES), Perkin Elmer Optima 8000 DV. All reagents used in this study were analytical grade. Glassware was properly cleaned and rinsed with KNO3 solution followed by deionized water. Quality assurance was performed using blanks and repeated comparison with standards. The accuracy of the heavy metal concentrations was assessed with certified reference material (CRM) with a deviation of less than 5%. The recovery percentages of the heavy metals were as follows: Cd (83–117%), Cu (101–113%), Pb (109–110%), and Zn (97–114%) for the water samples and Cd (93–115%), Cu (103–119%), Pb (85–107%), and Zn (93–107%) for the sediment samples. In addition, the limits of detection of Cd, Pb, Cu, and Zn were 0.02, 0.01, 0.01, and 0.01 µg/L, respectively.
2.5. Heavy Metal Pollution Indices
2.5.1. Geoaccumulation Index (Igeo)
Igeo has been widely used to assess the extent of individual metal accumulation in sediment [20,39,40]. To evaluate the level of metal pollution in the sediment, the Igeo values can be calculated by using the following equation.
where Cn is the metal concentration “n” in the sediment, and Bn is the background concentration of the metal. A factor of 1.5 is used for the background matrix correction and lessening effects from lithogenic compositions [39,41]. The interpretation of this index is listed as follows: uncontaminated (Igeo ≤ 0), slightly contaminated (0 < Igeo ≤ 1), moderately contaminated (1 < Igeo ≤ 2), moderately to heavily contaminated (2 < Igeo ≤ 3), heavily contaminated (3 < Igeo ≤ 4), heavily to extremely contaminated (4 < Igeo ≤ 5), and extremely contaminated (Igeo ≥ 5) [40].
2.5.2. Contamination Factor (CF)
The contamination factor (CF) is a parameter used to quantify the degree of contamination of a single metal in relation to the Earth crush’s compositions or the background values from uncontaminated or geologically similar areas. The CF can be calculated by using Equation (2).
where Cmetal is the measured level of the metal, and Cbackground is the background level of the metal [20,42,43,44]. CFmetal is a contamination factor of heavy metals in sediment. The contamination factor can be classified into four levels of metal contamination in sediment as follows: low contamination (CF < 1), moderate contamination (1 ≤ CF < 3), high contamination (3 ≤ CF < 6), and very high contamination (CF > 6) [44].
2.5.3. Enrichment Factor (EF)
The enrichment factor (EF) is the ratio of pollutants in the sediment calculated proportionately to the background value relative to the reference elements such as scandium, titanium, manganese, iron, and aluminum [45]. This index refers to the enrichment quantification of a potentially contaminant-derived element in an environmental sample relative to a user-defined background composition [46]. Hence, it is an excellent parameter not only able to differentiate the source of metals but also able to estimate the amounts of metals originating from anthropogenic activities [45]. It can be calculated as follows:
where Cm is the concerned metal concentration and Cref is the reference element concentration in the sample and background sample [46]. In this study, Fe was used as a conservative metal. The EF can be categorized as follows: minor enrichment (1.5–3.0), moderate enrichment (3.0–5.0), severe enrichment (5.0–10.0), and very severe enrichment (> 10) [28,43,44,45].
2.5.4. The Pollution Load Index (PLI)
The PLI is an aggregative explanation of the overall level of metal pollution. It has been used to comprehensively assess the degree to which microflora and fauna in sediment or soil might be affected. The PLI can be calculated by using Equation (4).
PLI = (CF1 × CF1 × CF1 ×…× CFn)1/n
2.5.5. The Modified Degree of Contamination (mCd), Pollution Index (PI), and the Modified Pollution Index (MPI)
To evaluate the pollution status, many researchers have proposed multimetal indices instead of single metal indices. The most generally used indices are the mCd, PI, and MPI [43,48,49,50]. The mCd is a generalized approach to evaluate the degree of contamination. The calculation of this parameter is shown below:
The mCd is categorized as follows: very low degree of contamination (mCd < 1.5), low degree of contamination (1.5 ≤ mCd < 2), moderate degree of contamination (2 ≤ mCd < 4), high degree of contamination (4 ≤ mCd < 8), very high degree of contamination (8 ≤ mCd < 16), extremely high degree of contamination (16 ≤ mCd < 32), and ultra-degree of contamination (mCd > 32) [43]. The PI can be calculated by using Equation (6).
where CFmax is the maximum value of the contamination factors, and CFaverage is the average value of the contamination factor. The interpretation of PI is described as follows: clean environment (PI < 0.7), warning (0.7 ≤ PI < 1), slight pollution (1 ≤ PI < 2), moderate pollution (2 ≤ PI < 3), and heavy pollution (PI ≥ 3) [43]. The pollution index was later modified to MPI using the EF instead of CF [41]. The MPI can be determined by using Equation (7).
where EFaverage and EFmax refer to the average and maximum EF values, respectively. The MPI in the range of 1.0–2.0 reveals slightly polluted, 2.0–3.0 moderately polluted, 3.0–5.0 moderately to heavily polluted, 5.0–10 severely polluted, and > 10 heavily polluted conditions [41].
2.5.6. Ecological Risks (ER) and Potential Ecological Risks (PER)
The ER and PER are used to assess the ecological risk of the concerned metals in sediment, based on their toxicity and response to the environment [43,44]. The ER and PER can be calculated as follows:
where Ci is the metal (i) level in the sediment, Co is the background level of the metal, and Tr refers to the biological toxicity factor of a single metal. According to previous studies, the Tr of the concerned metals is as follows: Cu = Pb = 5, Zn = 1, and Cd = 30 [43,47]. The interpretation of this index is as follows: low risk (ER < 40), moderate risk (40 ≤ ER < 80), considerable risk (80 ≤ ER < 160), high risk (ER > 160); and the classification of PER is as follows: low potential risk (PER < 50), moderate potential risk (50 ≤ PER < 100), considerable potential risk (100 ≤ PER < 200), high risk condition (PER > 200) [51,52].
2.6. Human Health Risk Assessment
Health risk assessment is an evaluation in which the results reveal the degree of threat to human health under various conditions. The assessment can be performed based on either non-carcinogenic or carcinogenic risk for adults and vulnerable groups (e.g., children, infants, pregnant women, breastfeeding, and elderly) [44]. For this study, the potential health risk assessment, caused by the ingestion of metal-contaminated water from the Chan Thnal reservoir, was performed. Three age groups, including adults, children, and infants, were assessed by the following risk model [27,44]:
where CMW is the concentration of heavy metal in the water, IR is the ingestion rate, ED is the exposure duration, EF is the number of days per year, ABW is the average body weight, AT is the average exposure time, EDI is the estimated daily intake, and RfD is the oral reference dose. The RfD values of Cd, Cu, Zn, and Pb are 0.001, 0.037, 0.3, and 0.0035 mg/kg/day, respectively [53]. The HQ represents non-carcinogenic effects associated with the consumption of heavy metal contaminated water. HQ < 1 means no significant non-carcinogenic risk where HQ > 1 indicates adverse health effects regarding the non-carcinogenic risk of heavy metals.
3. Results
3.1. Water Quality Parameters
The physicochemical characteristics of the water in the Chan Thnal reservoir are presented in Table 1. These parameters significantly affect the water quality. Deterioration of water quality can cause suffering for aquatic lives. The temperature values ranged from 25 to 28 °C and 24 to 27 °C during the wet and dry seasons, respectively. The results revealed that for both the wet and dry seasons, the mean water temperature was well below Cambodia’s allowable limits for water that can be discharged to protected public water areas and sewers. Overall, the average water temperature in the Chan Thnal reservoir was within the permissible limits (25–30 °C) of the “Guidelines for drinking water quality” [54]. The average pH was 6.4 ± 0.2 and 7.0 ± 0.4 during the wet and dry seasons, respectively. The average pH values were in the acceptable range of the guidelines for drinking water quality (World Health Organization). DO refers to the dissolved oxygen in the water. It is a vital indicator for the viability of aquatic life. DO levels in the reservoir ranged from 4.6 to 7.2 mg/L. The average DO was 6.9 ± 0.5 mg/L and 5.6 ± 0.8 mg/L during the wet and dry seasons, respectively. These values were well above Cambodia’s allowable limits for the protected public water areas and were classified as Class 2 based on Thailand’s guidelines for surface water quality. This classification refers to surface water that can be used as the source of water supply as well as for water conservation, fisheries, swimming, and water sports purposes. Relatively high DO levels were observed at L1, L2, and L3 because they are somewhat far from water-polluting activities. Generally, a higher DO should be expected in the dry season because the solubility of oxygen increases with a decrease in temperature [20,54]. However, during the dry season, less or no rain and higher levels of human activity (such as fishing, lotus harvesting, and cattle rearing) would be the reason for relatively lower DO levels in the dry season.
3.2. Heavy Metal Concentrations in Water and Permissible Limits
From Table 2, significant variation (p < 0.05) in heavy metal concentrations was found in the water from all six locations. Details of statistical analysis of heavy metals in the water can be found in Table S1: Water samples. The concentration trend of the studied metals followed a decreasing order of Zn > Pb > Cu > Cd. Generally, the concentrations of each metal in the water were lower in the dry season than in the wet season. Lower water pH during the wet season may increase the solubility of metals while during the dry season, the lower dilution effect of water would cause the metal species to be suspended with both inorganic and organic particles in the reservoir [20,21,28,55,56,57]. However, the occurrence pattern of the metals was the same during both the wet and dry seasons, indicating that there was no irregular pattern in the availability of heavy metals in the water. Interestingly, the highest levels of all four metals were observed at L3 during the wet season.
Concerning the Pb levels of the water from all locations, it was found that the average concentration of Pb was much higher than the WHO Guidelines for drinking water quality during the wet and dry seasons. Even at the 10th percentile, the Pb concentration (26.08 µg/L) in water was four times higher than the permissible limit, suggesting that water from the Chan Thnal reservoir is not safe for either drinking or cooking.
3.3. Heavy Metal Concentrations in Sediments
The heavy metal concentrations in the sediment samples were higher than those in the water samples because sediment is regarded as a significant sink material for absorbing heavy metals [63]. According to the heavy metal contents in igneous and sedimentary rocks, the metal concentrations in shales and clays followed the decreasing order of Cu > Pb > Zn > Cd [4]. The metal contents in sediment can be varied depending on the rock types and the surrounding environmental conditions. During the soil formation process, Cd and Pb are less likely to accumulate in the river sediment [64]. From Table 2, the concentrations of Cu, Zn, and Pb were higher than the background values, indicating an input of the heavy metals from human activities in the Chan Thnal reservoir. The occurrence pattern of the studied metals followed a decreasing order of Zn > Cu > Pb > Cd. Unlike the trend of water samples, Pb content in the sediment was lower than that of Cu and Zn. This indicated a low tendency of Pb accumulation in the sediment; on the other hand, a high accumulation tendency can be expected for Cu and Zn. In addition, environmental conditions such as pH and organic contents may affect the bioavailability of Pb in the sediment [64].
The results also revealed a significant variation (p < 0.05) in heavy metal concentrations of sediments in all the locations. Details of statistical analysis of heavy metals in the sediment can be found in Table S2: Sediment samples. Generally, in the wet season, the concentrations of the selected metals in the sediment were higher than those in the dry season. These results might be attributed to the water capacity of the reservoir, wherein the wet season, high flow, and low human activities could enhance the accumulation and precipitation processes of metals in the sediment [22,28].
Overall, the concentrations of heavy metals (Cu, Pb, and Zn) in the sediment from all the locations in the Chan Thnal reservoir were below the concentration threshold of metals in sediments based on sediment quality guidelines for freshwater systems [59] and the soil quality standards for habitat and agriculture purposes established by the pollution control department, Thailand [60].
3.4. Pollution Status and Ecological Risk Assessment
3.4.1. Geoaccumulation Index (Igeo)
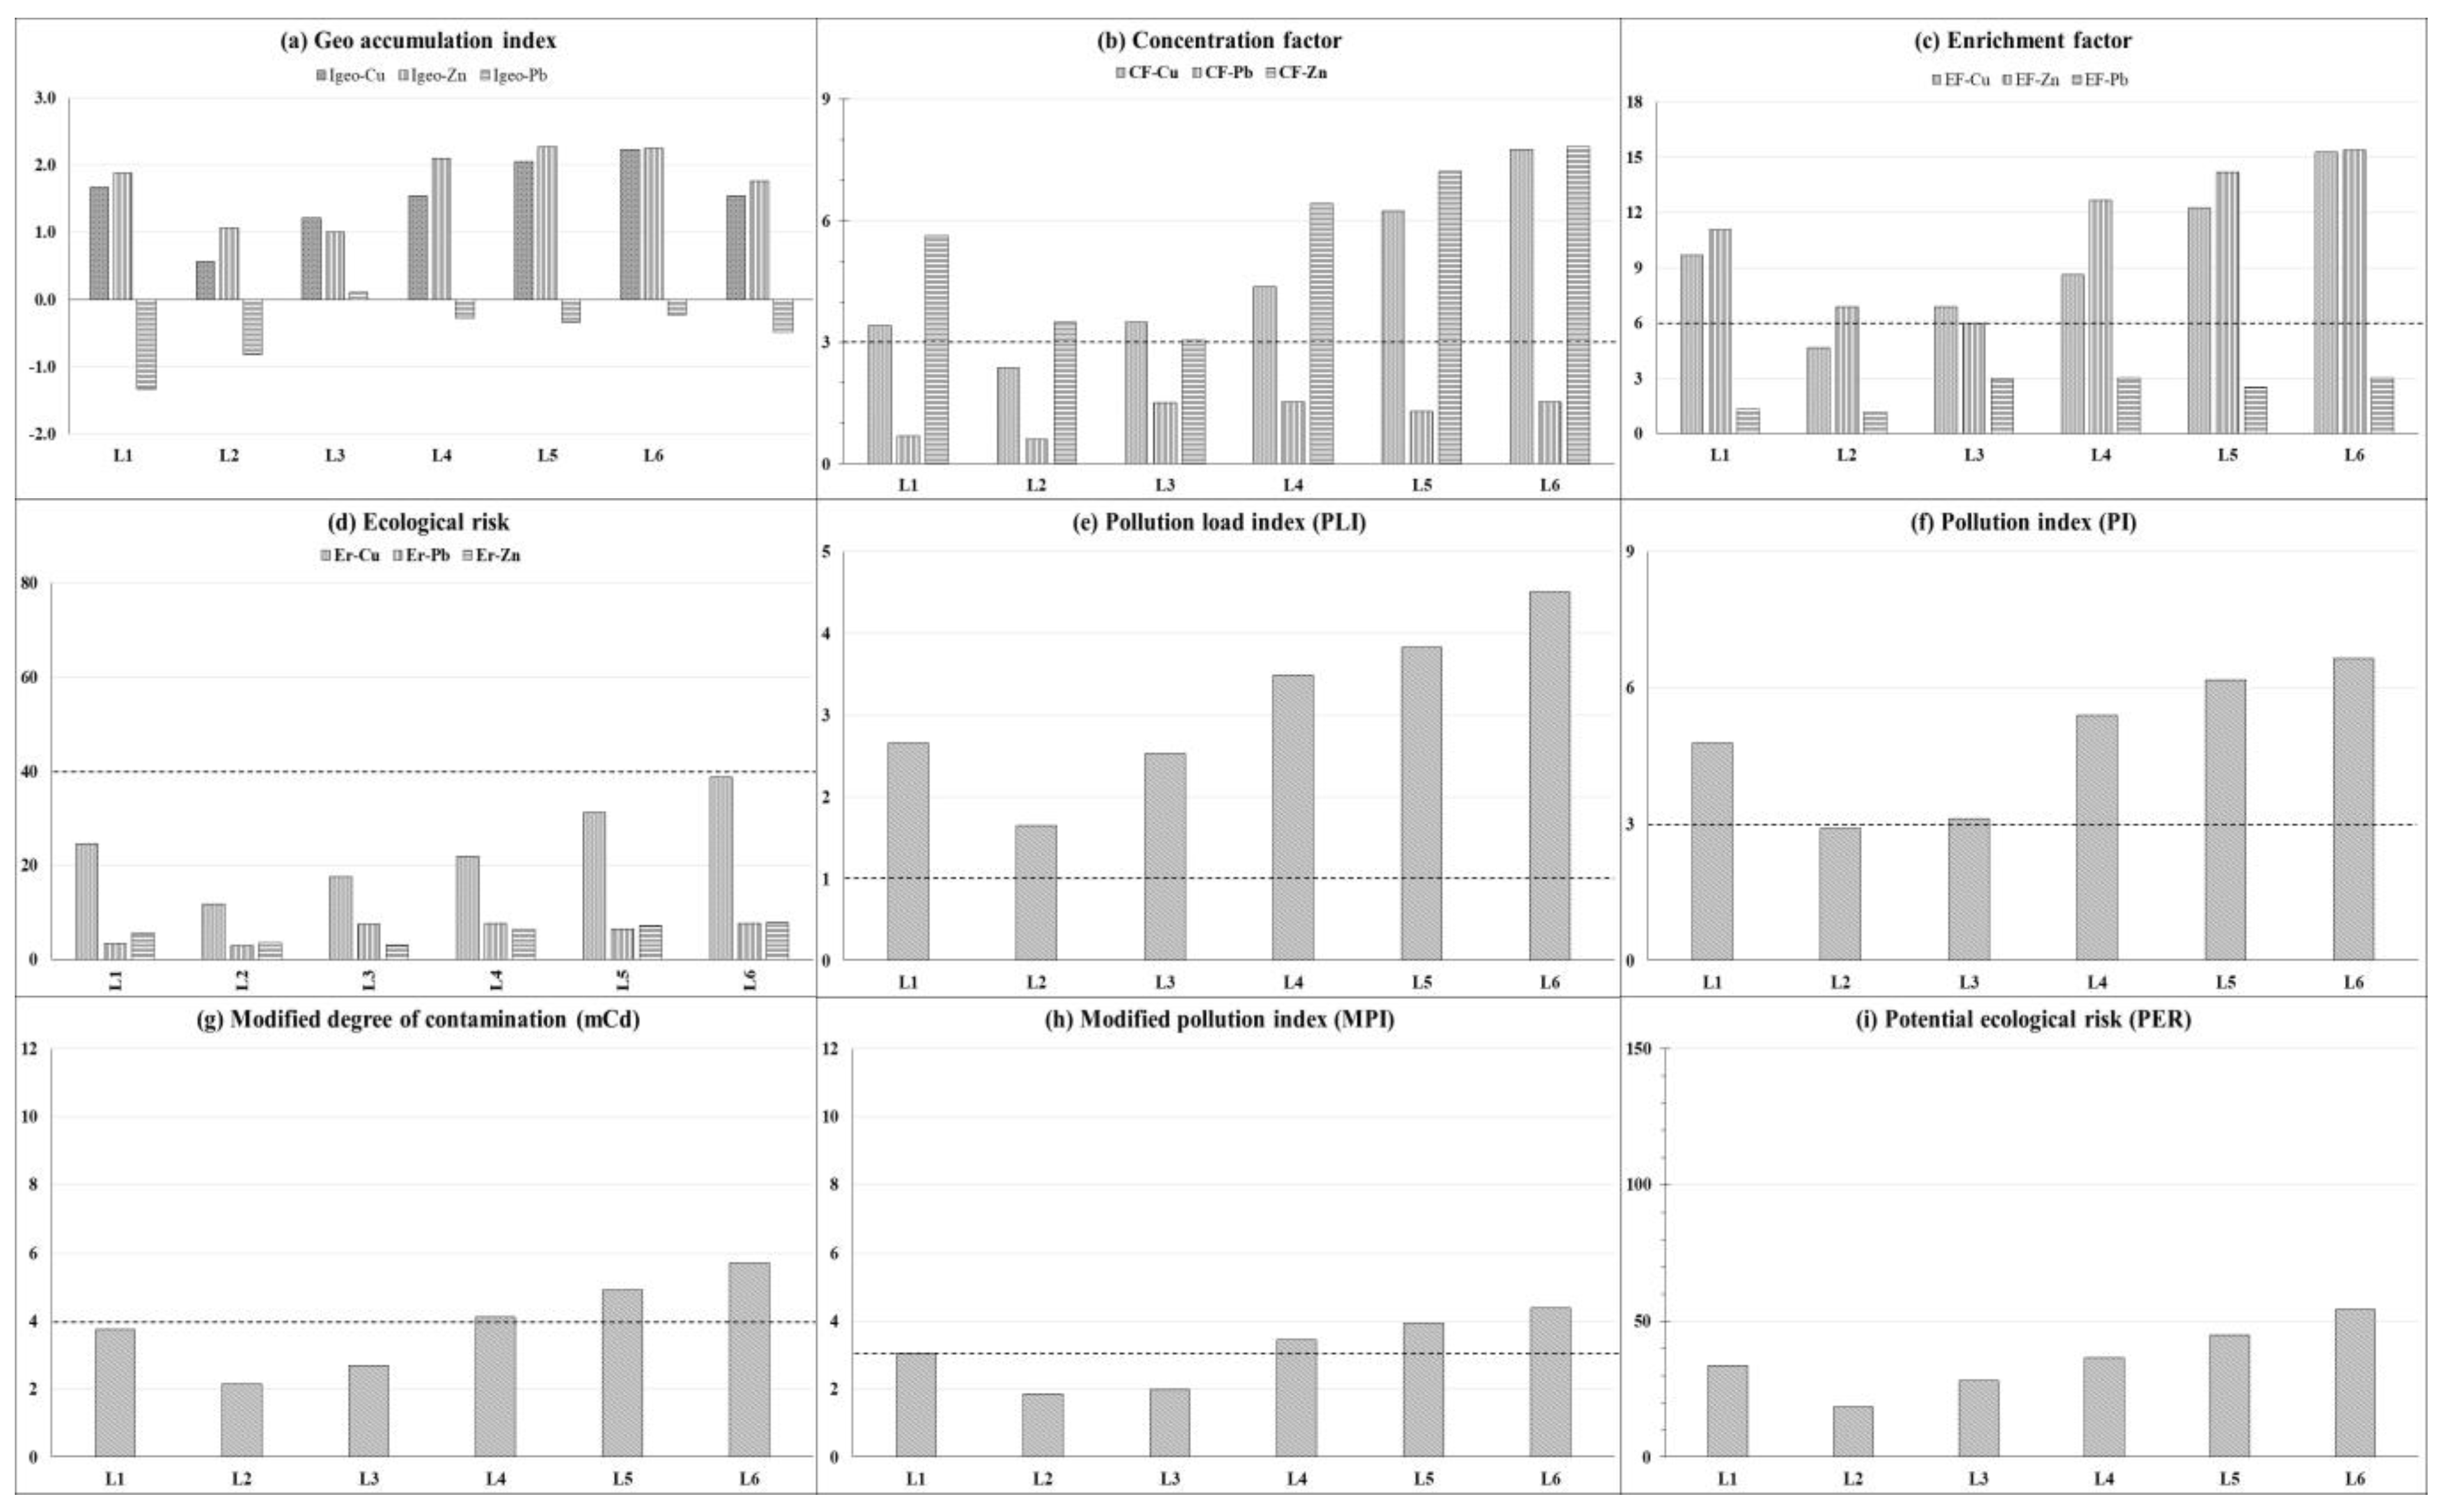
Geoaccumulation index (Igeo) is used to assess accumulation levels of metals in the soil or sediment. Moreover, it is an indication of contamination from anthropogenic activities [65,66]. From Table 3 and Figure 2, Igeo values were found in the following order: Zn > Cu > Pb > Cd. The results revealed the moderate contaminations of Cu and Zn; however, there was, so-called, no indication of Pb contamination in the sediment since a significantly high Pb level in the water was observed. However, a relatively higher enrichment for Cu and Zn was found at locations L4, L5, and L6. These might be attributed to the fact that these locations receive runoff from the Krang Chek market and municipalities located at the northeast of the map in addition to the discharge from the road canal 2 (Figure 1a).
3.4.2. Contamination Factor (CF) and Enrichment Factor (EF)
The CF and EF values revealed the metals contamination in the descending order of Zn > Cu > Pb > Cd. Overall, the metal pollution of the Chan Thnal reservoir can be classified as having considerable levels of Zn and Cu contamination and a moderate level of Pb contamination. However, a very high level of Cu contamination (CF ≥ 6) was found at L5 and L6 while L4, L5, and L6 were classified as having a very high level of Zn contamination. These results indicated strong urban influence on Cu and Zn contaminations at L5 and L6. An additional location of L4 was found to have a very high level of Zn contamination. Low to moderate level of Pb contamination (CF < 3) was found for all locations in the Chan Thnal reservoir.
For EF, it is another indicator used for an evaluation of anthropogenic effects. The results revealed very severe enrichments of Zn and Cu in the sediments. Minor enrichment was observed for Pb contamination. Very high Cu and Zn enrichments indicated that the reservoir was greatly affected by anthropogenic activities [43,67,68].
3.4.3. The Pollution Load Index (PLI), Pollution Index (PI), Modified Degree of Contamination (mCd), and Modified Pollution Index (MPI)
Comprehensively, the PLI and PI of all locations ranged from 1.70 to 4.53 and 3.88 to 11.03. These indicated that the sediment of the reservoir was classified as progressively deteriorating (PLI > 1), while almost all locations (except L2) were under heavily polluted conditions (PI > 3), as shown in Figure 2. According to the CF and EF values, these results affirmed that high levels of Cu, Zn, and Pb contaminations were found in the Chan Thnal reservoir. However, these parameters seem to be less sensitive than the modified degree of contamination (mCd) and the modified pollution index (MPI) because they cannot discriminate the pollution level among the locations. In other words, the PI showed an advantage over the other indices in that it could reflect the alteration even at low trigger values, which ultimately led to an early indication of metal pollution and ecological risk. Similar to the PI, the MPI and mCd revealed that L1, L4, L5, and L6 were classified as moderately to heavily polluted sites (3 < MPI < 5) (4 < mCd < 8) with the same order (L6 > L5 > L4 > L1).
Figure 2.
(a) Igeo, (b) CF, (c) EF, (d) ER, (e) PLI, (f) PI, (g) mCd, (h) MPI, and (i) PER values of each location in the Chan Thnal reservoir.
Figure 2.
(a) Igeo, (b) CF, (c) EF, (d) ER, (e) PLI, (f) PI, (g) mCd, (h) MPI, and (i) PER values of each location in the Chan Thnal reservoir.

3.4.4. Ecological Risks (ER) and Potential Ecological Risks (PER)
The ER and PER were used to assess the risk of the concerned metals in the sediment of the Chan Thnal reservoir. The results revealed the ecological risk of each metal as follows: Zn > Cu > Pb > Cd. The ER of the selected heavy metals indicated low risk (ER < 40) in all locations. The results also revealed the PER of each location as follows: L6 > L5 > L4 > L1 > L3 > L2. A moderate potential ecological risk was found in L6. Similar to other evaluating parameters, L4, L5, and L6 are the top three locations having high metal contamination levels. This result might relate to the fact that this location connects to the road canal that might carry runoff and discharge from areas such as schools, rice paddies, farmer households (L3 and L4), markets, petroleum stations, and cattle and poultry farms (L5 and L6) [67,69].
3.5. Health Risk Assessment
Information from an interview with local officers revealed that around 2300 farmers in the Krang Chek commune use water primarily from the Chan Thnal reservoir for drinking, cooking, and growing vegetables during the dry season. Boiling is the sole water purification method before being used for consumption. Concerning the high Pb levels in the water, a potential health risk evaluation calculated based on the non-carcinogenic effect, caused by ingestion of Pb-contaminated water, was performed. Table 4 shows the parameters needed for computing EDI and HQ values of the metal of interest for adult male, female, and vulnerable groups (i.e., children and infants). Human exposure to heavy metals can occur through ingestion, inhalation, and dermal contact. However, this study focuses specifically on the ingestion pathway because it is the primary route of a maximum intake of heavy-metal-contaminated water. The HQ values disclosed the non-carcinogenic risk of heavy metals as follows: HQPb > HQZn > HQCu > HQCd.
Results revealed that male and female adults are not at risk of the non-carcinogenic effect caused by ingestion of heavy-metal-contaminated water (i.e., Pb, Zn, Cu, and Cd). However, children and infants are at serious health risk as HQ > 1. This indicated adverse health effects regarding the non-carcinogenic risk of Pb ingestion. Particularly, children and infants are vulnerable to Pb toxicity. Long-term exposure to Pb at the early stage of life causes a permanent neurological discrepancy, affecting their behavior and learning ability. Other confirmations of Pb toxicity in children and infants include permanent damage to multiple organs as well as other behavioral disorders such as inattentiveness, hyperactivity, irritability, and shorter attention span [4]. In addition, prenatal exposure to Pb in pregnant women may cause low birth weight, preterm delivery, and abnormalities in neurodevelopment in offspring [70].
3.6. Source Analysis of Metal Contaminations in Water
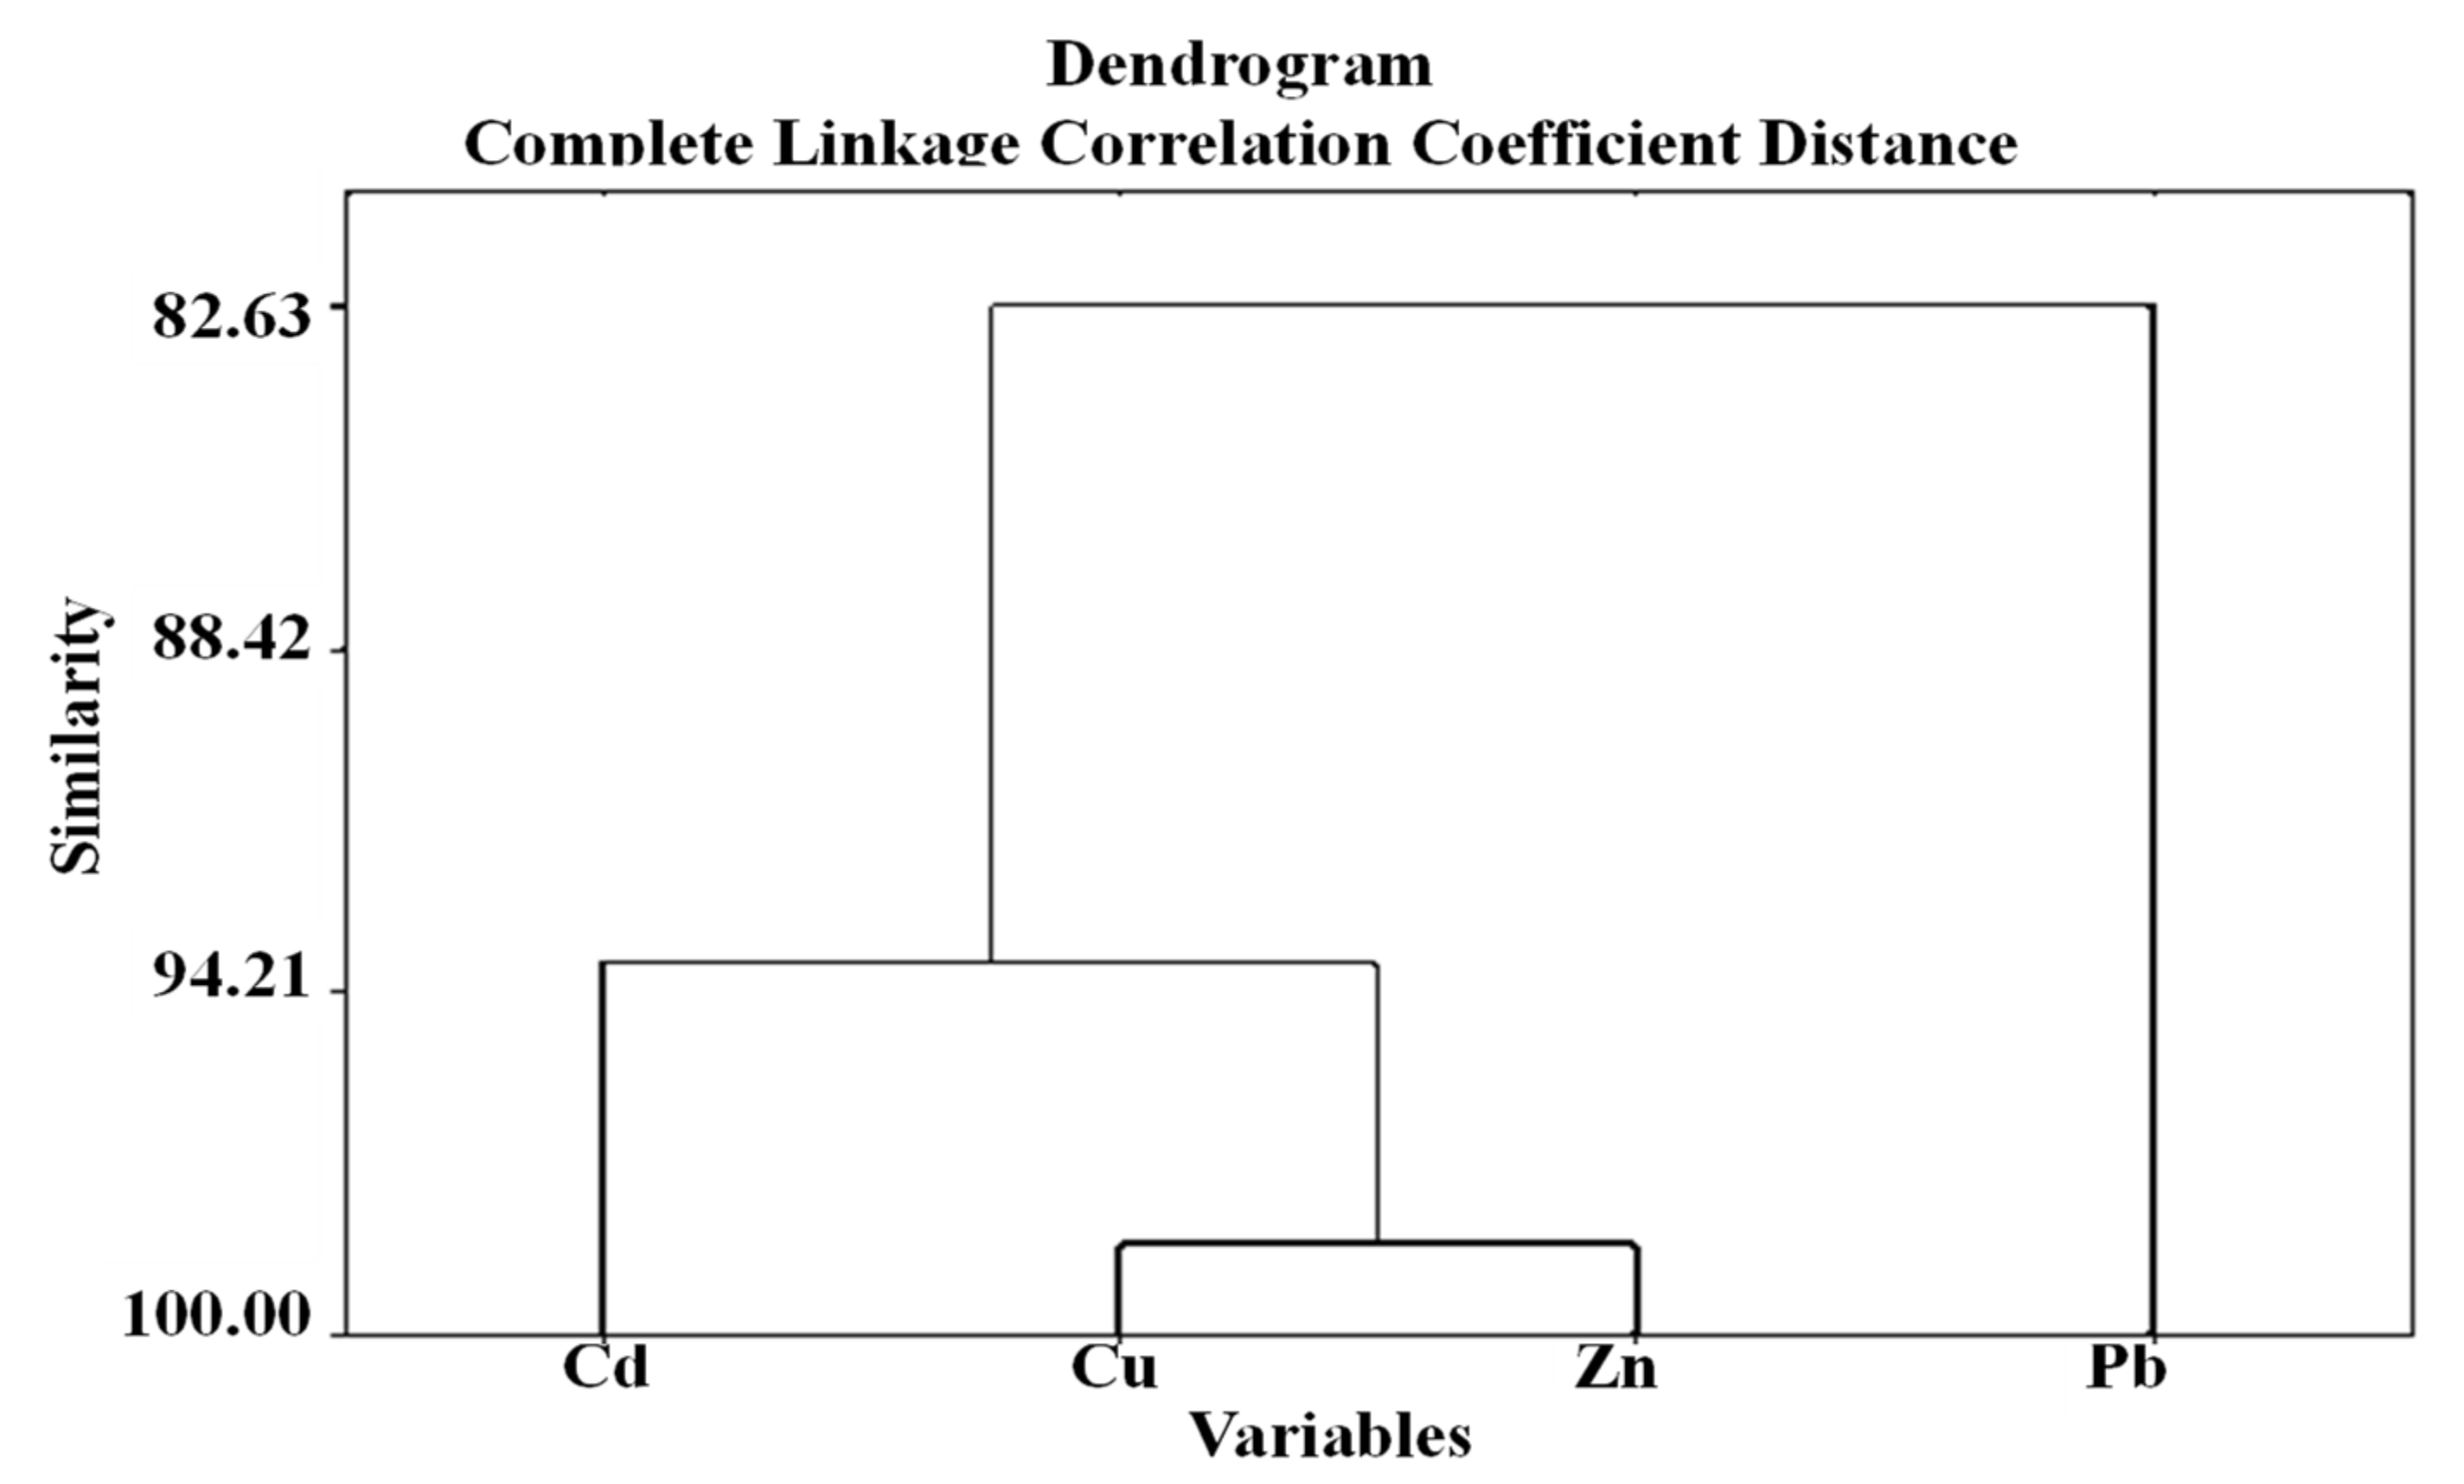
Pearson’s analysis was used to identify the origins of the studied heavy metals. The closeness among metals (i.e., Cd, Cu, Zn, and Pb) is shown in Table 5. The high and positive coefficients between Cd-Cu (0.925), Cd-Zn (0.874), and Cd-Pb (0.653) showed strong correlations of Cd with Cu, Zn, and Pb. This implied a similar source of Cd, Cu, Zn, and Pb.
Factor analysis was also performed to assess the relationship of heavy metal contaminations in the water. As shown in Table 6, three factors are able to identify the sources of heavy metals in the water by up to 99.5% of the total variance. Factor 1 is capable of explaining the grouping of Cd, Cu, Zn, and Pb with 86% of the total variance, and the values imply that the presence of these metals in the water is from the same origin. Factor 2 is able to separate the grouping of Cd, Cu, and Zn from Pb by 10.3% of the total variance. In addition, Factor 3 explains the similar source of Cu and Zn with 3.2% of the total variance but with relatively pintsize loading.
As illustrated in Figure 3 and Table 7, the first factor refers to anthropogenic activities. By considering the common sources of Cd, Cu, and Zn, it is more likely that the occurrences of Cd, Cu, and Zn were related to urban runoff, domestic wastewater discharges, and agricultural runoff (i.e., P-fertilizer, N-fertilizer, lime fertilizer, and manure) [4]. The second factor that differentiates the source of Pb from the others is possibly from pesticide loading from agricultural runoff, aerial deposition, road dust, fuel burning, or car exhaust [4]. Cu and Zn likely originate from similar sources which could be the domestic wastewater discharges and fertilizers used in agricultural activities. Considering Factor 3, one of the strange reasons that can also explain the occurrence and additional closeness of Cu and Zn in the water is that the farmers and villagers intentionally throw copper wires and zinc-carbon batteries into the reservoir to prevent fish catching by using electric shock. By doing this, they believe that the electricity will shock back to the fish-catching smugglers.
4. Discussion
4.1. Heavy Metals Contamination in the Water
Significant variation (p < 0.05) in heavy metal concentrations was found in the water from all six locations. The occurrence of the heavy metals might be attributed to the input from road canal 1 carrying both point and non-point sources from the northwestern area (i.e., large rice paddies, households, schools, and animal farms [22,57]). In addition, fertilizers, pesticides, and sewage sludge are common agricultural sources of heavy metals [4]. A significantly high level of Pb was revealed in the water. This finding brought serious health concerns to villagers who are living in the areas because L6 is the location where local water vendors pump the water and sell it to the villagers who do not have access to the public water supply (piped water). Lifelong intake of metal-contaminated water can cause chronic health effects on those villagers or people who live nearby the water. In general, gasoline, paint, fertilizer, pesticides, and ammunition are common anthropogenic sources of Pb in the environment [6,70]. The principal component analysis (PCA) and factor analysis confirmed our assumption that the primary source of the heavy metals is from anthropogenic activities such as urban runoff, agricultural runoff, industrial discharge, sewage effluent, and atmospheric deposition. The occurrence of Cd, Cu, and Zn in the water likely originates from agricultural runoff (i.e., the use of fertilizers) and urban runoff (i.e., improper wastewater treatment and waste disposal) in the catchment of the Chan Thnal reservoir. Agricultural runoff is one of the major sources that generate significant levels of Cu, Zn, and Pb in the water resulting from the use of fertilizers, pesticides, herbicides, and fungicides in farming activities [4,34]. Moreover, the results of factor analysis confirmed additional sources of Pb occurrence in the water which include both direct (e.g., Pb shot and Pb sinkers) and indirect sources. In general, Pb is transferred continuously between air, water, and soil by natural chemical and physical processes such as weathering, runoff, precipitation, dry deposition of dust, and atmospheric deposition. The latest one is one of the largest sources of Pb found in the environment [4]. By considering the location of the reservoir and activities of reservoir utilization by local people, it is believed that an additional source of Pb contamination in the reservoir is likely from an aerial deposition and Pb sinkers used for fishing and fish catching.
4.2. Heavy Metals Contamination in the Sediment
In contrast, the concentrations of heavy metals (Cu, Pb, and Zn) in the sediment of all locations in the Chan Thnal reservoir were below the concentrations threshold of metals in the sediment based on the sediment quality guidelines for freshwater systems [59], indicating that they are safe for human use for habitation and agriculture purposes. However, these results cannot justify the assumption of no ecological risk or health risk conditions of the Chan Thnal reservoir, as the sediment acidity (pH) and compositions may affect solubility, mobility, and phytoavailability of heavy metals in the sediment [64]. Acidic sediment can cause an increase in solubility and mobility of heavy metals [3], which subsequently increases the bioavailability of heavy metals for plant uptake. For example, Cd, Cu, and Zn are more mobile and bioavailable for plants than others, while Pb is classified as a low bioavailable heavy metal. However, plants can employ several processes to alter the physicochemical properties of the sediment and facilitate heavy metal chelation which subsequently causes an increase in solubility, mobility, and bioavailability of heavy metals in the sediment [64]. Once the heavy metals become bioavailable, they can be either absorbed by algae at a lower trophic level in the food web or by aquatic plants [3]. In particular, the abundance of aquatic plants in the Chan Thnal reservoir, for example, water lily (Nymphaea) and lotus (Nelumbo) can enhance phytoremediation and translocation of heavy metals in the sediment, resulting in a low concentration of metals in both the water and sediment [64]. Despite the results of this study revealing low to moderate ecological risks based on heavy metals contamination in the sediment, it has brought serious health risk concerns when considering the potential issue of bioaccumulation in the Chan Thnal reservoir.
4.3. Ecological Risk Assessment
A few parameters (i.e., PLI, PI MPI, mCd) reflected a progressive deterioration and indicated moderate to heavy pollution from Cu, Zn, and Pb. However, the contamination level seems not to affect the overall ecological function of the Chan Thnal reservoir. This is probably because the purification capacity (e.g., phytoremediation process) is sufficient to sustain the consistent input of heavy metals in the reservoir. Considering the PER value, this parameter integrates the biological toxicity of individual metals into the concentration factor. The classic number of heavy metals to be studied is at least eight species. As can be expected, an increasing number of heavy metals would result in a higher potential ecological risk. However, in this study, the PER value is calculated based on fewer heavy metals (i.e., Cd, Cu, Zn, Pb), resulting in a relatively low potential ecological risk of metal pollution in the Chan Thnal reservoir.
4.4. Human Health Risk
Among the four heavy metals of interest, the Pb level in the water significantly exceeded the guideline for drinking water for all locations. The health risk assessment revealed no risk of the non-carcinogenic effect caused by ingestion of heavy-metal-contaminated water (i.e., Pb, Zn, Cu, and Cd). However, children at the age below 10 and infants are vulnerable to Pb toxicity. The HQ of Pb exceeded 1, revealing a non-carcinogenic risk of Pb intake through oral ingestion. Long-term exposure to Pb through oral ingestion can permanently impair the neurological system [4]. The findings highlight the need for mitigation actions to reduce Pb concentrations in the water, along with the use of intervention measures to prevent Pb uptake through ingestion pathways.
5. Conclusions
This study revealed significant contamination of heavy metals in the water and sediment of the Chan Thnal reservoir. The metal levels in the sediment were well below the concentration threshold limits and could be used for habitation and agriculture purposes. However, the ecological risk assessment revealed progressive deterioration and indicated low to moderate to heavy pollution from Cu, Zn, and Pb. The following conclusions were drawn from this study:
- (1)
- The values above the unity of Igeo in all locations affirmed heavy metals contamination in this reservoir.
- (2)
- CF and EF implied that the high level of the concerned metal species is strongly influenced by anthropogenic activities around the reservoir.
- (3)
- The values of several indices indicated a significantly high level of metal pollution in L5 and L6. Overall, the average concentrations of the studied metals found in the water followed a decreasing order of Zn > Pb > Cu > Cd. Among the four metals, the water is highly contaminated with Pb. Even at the 10th percentile, the Pb levels in the water exceeded the WHO guideline for drinking water. This indicated that both in the wet and dry seasons the water from the Chan Thnal reservoir cannot be used as a water source for consumption purposes.
- (4)
- The statistical analysis revealed that the primary source of heavy metals is anthropogenic activities. The occurrence of Cd, Cu, and Zn in the water likely originates from agricultural runoff (i.e., the use of fertilizers) and urban runoff (i.e., improper wastewater treatment and waste disposal). Additional sources of Pb occurrence in the water are likely from aerial deposition and Pb sinkers used for fishing and fish catching.
- (5)
- Human health risk assessment revealed a serious non-carcinogenic risk of Pb in vulnerable groups, i.e., children and infants. Therefore, priority should be given to tackling Pb contamination. Appropriate control and protection strategies are urgently required to cut off the main Pb exposure pathway in children and infants.
- (6)
- The Chan Thnal reservoir is the main source of water and food supply for the Krang Chek commune. Improper waste disposal and lack of infrastructure development (i.e., public water purification and supply system and wastewater collection and treatment system) could trigger water pollution problems, especially metal pollution. In the longer run, a relatively high level of metal contamination in the reservoir would cause long-term health problems in the commune. This phenomenon could be an early call to attention for the local authorities to impose some kinds of administrative or mitigation intervention to rejuvenate the Chan Thnal reservoir and improve the environmental health conditions of this area.
Supplementary Materials
The following are available online at https://www.mdpi.com/article/10.3390/su132413538/s1, Table S1: Water samples, Table S2: Sediment samples.
Author Contributions
Conceptualization, S.P.T.; methodology, L.C.; software, S.P.T. and L.C.; validation, N.T. and S.P.T.; formal analysis, L.C. and S.P.T.; investigation, L.C.; data curation, S.P.T.; writing—original draft preparation, L.C.; writing—review and editing, S.P.T. and T.S.; visualization, L.C. and S.P.T.; supervision, S.P.T., N.T. and T.S.; project administration, S.P.T.; funding acquisition, S.P.T. All authors have read and agreed to the published version of the manuscript.
Funding
This research received no external funding.
Institutional Review Board Statement
Not applicable.
Informed Consent Statement
Not applicable.
Data Availability Statement
Not available.
Acknowledgments
This study was financially supported by the Department of Chemistry, Faculty of Science, King Mongkut’s University of Technology Thonburi. The student was supported by the Petchra Pra Jom Klao Ph.D. Research Scholarship. We are also grateful for the support of the local staff for their insightful information and versatile assistance during the sampling and delivery of the samples.
Conflicts of Interest
The authors declare no conflict of interest.
References
- Jiang, Z.; Xu, N.; Liu, B.; Zhou, L.; Wang, J.; Wang, C.; Dai, B.; Xiong, W. Metal concentrations and risk assessment in water, sediment and economic fish species with various habitat preferences and trophic guilds from Lake Caizi, Southeast China. Ecotoxicol. Environ. Saf. 2018, 157, 1–8. [Google Scholar] [CrossRef]
- Ahmed, M.K.; Baki, M.A.; Islam, M.S.; Kundu, G.K.; Habibullah-Al-Mamun, M.; Sarkar, S.K.; Hossain, M.M. Human health risk assessment of heavy metals in tropical fish and shellfish collected from the river Buriganga, Bangladesh. Environ. Sci. Pollut. Res. 2015, 22, 15880–15890. [Google Scholar] [CrossRef] [PubMed]
- Bradl, H.B. Sources and Origins of Heavy Metals. In Interface Science and Technology; Bradl, H.B., Ed.; Elsevier Ltd.: Amsterdam, The Netherlands, 2005; pp. 1–27. [Google Scholar]
- Alengebawy, A.; Abdelkhalek, S.T.; Qureshi, S.R.; Wang, M.-Q. Heavy metals and pesticides toxicity in agricultural soil and plants: Ecological risks and human health implications. Toxics 2021, 9, 42. [Google Scholar] [CrossRef]
- Genchi, G.; Sinicropi, M.S.; Lauria, G.; Carocci, A.; Catalano, A. The Effects of Cadmium Toxicity. Int. J. Environ. Res. Public Health 2020, 17, 3782. [Google Scholar] [CrossRef]
- Ali, H.; Khan, E.; Ilahi, I. Environmental chemistry and ecotoxicology of hazardous heavy metals: Environmental persistence, toxicity, and bioaccumulation. J. Chem. 2019, 2019, 6730305. [Google Scholar] [CrossRef] [Green Version]
- Grant, C.A.; Sheppard, S.C. Fertilizer impacts on cadmium availability in agricultural soils and crops. Hum. Ecol. Risk Assess. 2008, 14, 210–228. [Google Scholar] [CrossRef]
- Zhao, H.; Xia, B.; Fan, C.; Zhao, P.; Shen, S. Human health risk from soil heavy metal contamination under different land uses near Dabaoshan Mine, Southern China. Sci. Total Environ. 2012, 417–418, 45–54. [Google Scholar] [CrossRef]
- Wani, A.L.; Ara, A.; Usmani, J.A. Lead toxicity: A review. Interdiscip. Toxicol. 2015, 8, 55–64. [Google Scholar] [CrossRef] [Green Version]
- Telišman, S.; Čolak, B.; Pizent, A.; Jurasović, J.; Cvitković, P. Reproductive toxicity of low-level lead exposure in men. Environ. Res. 2007, 105, 256–266. [Google Scholar] [CrossRef]
- Abel, M.T.; Suedel, B.; Presley, S.M.; Mcdaniel, L.N.; Rigdon, R.; Goebel, T.; Lascano, R.J.; Zartman, R.; Anderson, T.A.; Cobb, G.P. Contribution of Soil Lead to Blood Lead in Children: A Study from New Orleans, LA. J. Environ. Prot. 2012, 3, 1704–1710. [Google Scholar] [CrossRef] [Green Version]
- Fu, Z.; Wu, F.; Chen, L.; Xu, B.; Feng, C.; Bai, Y.; Liao, H.; Sun, S.; Giesy, J.P.; Guo, W. Copper and zinc, but not other priority toxic metals, pose risks to native aquatic species in a large urban lake in Eastern China. Environ. Pollut. 2016, 219, 1069–1076. [Google Scholar] [CrossRef]
- Korkmaz, C.; Ay, Ö.; Çolakfakioğlu, C.; Cicik, B.; Erdem, C. Heavy Metal Levels in Muscle Tissues of Solea solea, Mullus barbatus, and Sardina pilchardus Marketed for Consumption in Mersin, Turkey. Water Air Soil Pollut. 2017, 228, 315. [Google Scholar] [CrossRef]
- Adepoju-Bello, A.A.; Issa, O.A.; Oguntibeju, O.O.; Ayoola, G.A.; Adejumo, O.O. Analysis of some selected toxic metals in registered herbal products manufactured in Nigeria. Afr. J. Biotechnol. 2012, 11, 6918–6922. [Google Scholar] [CrossRef]
- Türkmen, A.; Türkmen, M.; Tepe, Y.; Akyurt, I. Heavy metals in three commercially valuable fish species from İskenderun Bay, Northern East Mediterranean Sea, Turkey. Food Chem. 2005, 91, 167–172. [Google Scholar] [CrossRef]
- Li, Q.; Zhao, X.; Lv, Q.; Liu, G. The determination of zinc in water by flame atomic absorption spectrometry after its separation and preconcentration by malachite green loaded microcrystalline triphenylmethane. Sep. Purif. Technol. 2007, 55, 76–81. [Google Scholar] [CrossRef]
- Agency for Toxic Substances and Disease Registry. Toxicological Profile for Zinc; U.S. Department of Health and Human Services: Washington, DC, USA, 2005.
- Perera, L.R.; Bonn, M.; Naren, T.; Sopheak, C.; Tiang, S.; Channarith, U.; Soveng, N.; Sokin, L.; Serey, S.; Sophorn, E.; et al. Towards Establishing a System of Monitoring and Evaluation for the Participatory Irrigation Management and Development Program in Cambodia; International Water Management Institute (IWMI): Colombo, Sri Lanka, 2007. [Google Scholar]
- Sriuttha, M.; Tengjaroenkul, B.; Intamat, S.; Phoonaploy, U.; Thanomsangad, P.; Neeratanaphan, L. Cadmium, chromium, and lead accumulation in aquatic plants and animals near a municipal landfill. Hum. Ecol. Risk Assess. 2017, 23, 350–363. [Google Scholar] [CrossRef]
- Ali, M.M.; Ali, M.L.; Islam, M.S.; Rahman, M.Z. Preliminary assessment of heavy metals in water and sediment of Karnaphuli River, Bangladesh. Environ. Nanotechnol. Monit. Manag. 2016, 5, 27–35. [Google Scholar] [CrossRef] [Green Version]
- Akbulut, A.; Akbulut, N.E. The study of heavy metal pollution and accumulation in water, sediment, and fish tissue in Kizilirmak River Basin in Turkey. Environ. Monit. Assess. 2010, 167, 521–526. [Google Scholar] [CrossRef] [PubMed]
- Islam, M.S.; Han, S.; Ahmed, M.K.; Masunaga, S. Assessment of Trace Metal Contamination in Water and Sediment of Some Rivers in Bangladesh. J. Water Environ. Technol. 2014, 12, 109–121. [Google Scholar] [CrossRef] [Green Version]
- Su, S.; Xiao, R.; Mi, X.; Xu, X.; Zhang, Z.; Wu, J. Spatial determinants of hazardous chemicals in surface water of Qiantang River, China. Ecol. Indic. 2013, 24, 375–381. [Google Scholar] [CrossRef]
- Srebotnjak, T.; Carr, G.; De Sherbinin, A.; Rickwood, C. A global Water Quality Index and hot-deck imputation of missing data. Ecol. Indic. 2012, 17, 108–119. [Google Scholar] [CrossRef]
- Khan, S.; Cao, Q.; Zheng, Y.M.; Huang, Y.Z.; Zhu, Y.G. Health risks of heavy metals in contaminated soils and food crops irrigated with wastewater in Beijing, China. Environ. Pollut. 2008, 152, 686–692. [Google Scholar] [CrossRef]
- Wilson, B.; Pyatt, F.B. Heavy metal dispersion, persistance, and bioccumulation around an ancient copper mine situated in Anglesey, UK. Ecotoxicol. Environ. Saf. 2007, 66, 224–231. [Google Scholar] [CrossRef]
- Ruchuwararak, P.; Intamat, S.; Tengjaroenkul, B.; Neeratanaphan, L. Bioaccumulation of heavy metals in local edible plants near a municipal landfill and the related human health risk assessment. Hum. Ecol. Risk Assess. 2019, 25, 1760–1772. [Google Scholar] [CrossRef]
- Islam, M.S.; Ahmed, M.K.; Raknuzzaman, M.; Al-Mamun, M.H.; Islam, M.K. Heavy metal pollution in surface water and sediment: A preliminary assessment of an urban river in a developing country. Ecol. Indic. 2015, 48, 282–291. [Google Scholar] [CrossRef]
- Demirak, A.; Yilmaz, F.; Tuna, A.L.; Ozdemir, N. Heavy metals in water, sediment and tissues of Leuciscus cephalus from a stream in southwestern Turkey. Chemosphere 2006, 63, 1451–1458. [Google Scholar] [CrossRef]
- Yi, Y.; Yang, Z.; Zhang, S. Ecological risk assessment of heavy metals in sediment and human health risk assessment of heavy metals in fishes in the middle and lower reaches of the Yangtze River basin. Environ. Pollut. 2011, 159, 2575–2585. [Google Scholar] [CrossRef]
- Martín, J.A.R.; De Arana, C.; Ramos-Miras, J.J.; Gil, C.; Boluda, R. Impact of 70 years urban growth associated with heavy metal pollution. Environ. Pollut. 2015, 196, 156–163. [Google Scholar] [CrossRef]
- Ebrahimpour, M.; Mushrifah, I. Heavy metal concentrations in water and sediments in Tasik Chini, a freshwater lake, Malaysia. Environ. Monit. Assess. 2008, 141, 297–307. [Google Scholar] [CrossRef]
- Karbassi, A.R.; Monavari, S.M.; Nabi Bidhendi, G.R.; Nouri, J.; Nematpour, K. Metal pollution assessment of sediment and water in the Shur River. Environ. Monit. Assess. 2008, 147, 107. [Google Scholar] [CrossRef]
- Ikenaka, Y.; Nakayama, S.M.M.; Muzandu, K.; Choongo, K.; Teraoka, H.; Mizuno, N.; Ishizuka, M. Heavy metal contamination of soil and sediment in Zambia. Afr. J. Environ. Sci. Technol. 2014, 4, 729–739. [Google Scholar] [CrossRef]
- Bhuyan, M.S.; Bakar, M.A.; Akhtar, A.; Hossain, M.B.; Ali, M.M.; Islam, M.S. Heavy metal contamination in surface water and sediment of the Meghna River, Bangladesh. Environ. Nanotechnol. Monit. Manag. 2017, 8, 273–279. [Google Scholar] [CrossRef]
- Rajeshkumar, S.; Li, X. Bioaccumulation of heavy metals in fish species from the Meiliang Bay, Taihu Lake, China. Toxicol. Rep. 2018, 5, 288–295. [Google Scholar] [CrossRef]
- Sovanna, M.; Koichi, U.; Masayuki, F. Level-set methods applied to the kinematic wave equation governing surface water flows. J. Environ. Manag. 2020, 269, 110784. [Google Scholar] [CrossRef]
- Chand, V.; Prasad, S. ICP-OES Assessment of Heavy Metal Contamination in Tropical Marine Sediments: A Comparative Study of Two Digestion Techniques. Microchem. J. 2013, 111, 53–61. [Google Scholar] [CrossRef]
- Birch, G. Use of sedimentary-metal indicators in assessment of estuarine system health. In Treatise on Geomorphology; Shroder, J., Switzer, A.D., Kennedy, D.M., Eds.; Academic Press: San Diego, CA, USA, 2013; pp. 282–291. [Google Scholar]
- Rostami, S.; Kamani, H.; Shahsavani, S.; Hoseini, M. Environmental monitoring and ecological risk assessment of heavy metals in farmland soils: Ecological risk assessment of heavy metals in Kamfiruz district. Hum. Ecol. Risk Assess. 2021, 7, 1–13. [Google Scholar] [CrossRef]
- Duncan, A.E.; de Vries, N.; Nyarko, K.B. Assessment of Heavy Metal Pollution in the Sediments of the River Pra and Its Tributaries. Water Air Soil Pollut. 2018, 229, 272. [Google Scholar] [CrossRef] [Green Version]
- Genc, T.O.; Yilmaz, F. Metal pollution assessment in water and sediment of Sarıcay stream in Mugla-Turkey. J. Chem. Pharm. Res. 2016, 8, 786–794. [Google Scholar]
- Siddiqui, E.; Pandey, J. Assessment of heavy metal pollution in water and surface sediment and evaluation of ecological risks associated with sediment contamination in the Ganga River: A basin-scale study. Environ. Sci. Pollut. Res. 2019, 26, 10926–10940. [Google Scholar] [CrossRef]
- Shen, F.; Mao, L.; Sun, R.; Du, J.; Tan, Z.; Ding, M. Contamination evaluation and source identification of heavy metals in the sediments from the lishui river watershed, southern China. Int. J. Environ. Res. Public Health 2019, 16, 336. [Google Scholar] [CrossRef] [Green Version]
- Ahamad, M.I.; Song, J.; Sun, H.; Wang, X.; Mehmood, M.S.; Sajid, M.; Su, P.; Khan, A.J.K. Contamination Level, Ecological Risk, and Source Identification of Heavy Metals in the Hyporheic Zone of the Weihe River, China. Int. J. Environ. Res. Public Health 2020, 17, 1070. [Google Scholar] [CrossRef] [PubMed] [Green Version]
- Bern, C.R.; Walton-Day, K.; Naftz, D.L. Improved enrichment factor calculations through principal component analysis: Examples from soils near breccia pipe uranium mines, Arizona, USA. Environ. Pollut. 2019, 248, 90–100. [Google Scholar] [CrossRef]
- Suresh, G.; Sutharsan, P.; Ramasamy, V.; Venkatachalapathy, R. Assessment of spatial distribution and potential ecological risk of the heavy metals in relation to granulometric contents of Veeranam lake sediments, India. Ecotoxicol. Environ. Saf. 2012, 84, 117–124. [Google Scholar] [CrossRef] [PubMed]
- Duodu, G.O.; Goonetilleke, A.; Ayoko, A.G. Comparison of pollution indices for the assessment of heavy metal in Brisbane River sediment. Environ. Pollut. 2016, 219, 1077–1091. [Google Scholar] [CrossRef]
- Brady, J.P.; Ayoko, G.A.; Martens, W.N.; Goonetilleke, A. Development of a hybrid pollution index for heavy metals in marine and estuarine sediments. Environ. Monit. Assess. 2015, 187, 306. [Google Scholar] [CrossRef] [PubMed] [Green Version]
- Hakansonm, L. An ecological risk index for aquatic pollution control: A sedimentological approach. Water Res. 1980, 14, 975–1001. [Google Scholar] [CrossRef]
- Chabukdhara, M.; Munjal, A.; Nema, K.A.; Gupta, K.S.; Kaushal, R. Heavy metal contamination in vegetables grown around peri-urban and urban-industrial clusters in Ghaziabad, India. Hum. Ecol. Risk Assess. 2016, 22, 736–752. [Google Scholar] [CrossRef]
- Rai, P.K.; Lee, S.S.; Zhang, M.; Tsang, Y.F.; Kim, K.H. Heavy metals in food crops: Health risks, fate, mechanisms, and management. Environ. Int. 2019, 125, 365–385. [Google Scholar] [CrossRef] [PubMed]
- US EPA Integrated Risk Information System of the US Environmental Protection Agency. Available online: https://cfpub.epa.gov/ncea/iris/search/index.cfm (accessed on 5 November 2021).
- World Health Organization. Guidelines for Drinking-Water Quality: Fourth Edition Incorporating the First Addendum; WHO: Geneva, Switzerland, 2017; ISBN 978-92-4-155001-7. [Google Scholar]
- Manickam, N.; Bhavan, P.S.; Santhanam, P.; Bhuvaneswari, R.; Muralisankar, T.; Srinivasan, V.; Asaikkutti, A.; Rajkumar, G.; Udayasuriyan, R.; Karthik, M. Impact of seasonal changes in zooplankton biodiversity in Ukkadam Lake, Coimbatore, Tamil Nadu, India, and potential future implications of climate change. J. Basic Appl. Zool. 2018, 79, 15. [Google Scholar] [CrossRef] [Green Version]
- Adamu, C.I.; Nganje, T.N.; Edet, A. Heavy metal contamination and health risk assessment associated with abandoned barite mines in Cross River State, southeastern Nigeria. Environ. Nanotechnol. Monit. Manag. 2015, 3, 10–21. [Google Scholar] [CrossRef] [Green Version]
- Mohiuddin, K.M.; Otomo, K.; Ogawa, Y.; Shikazono, N. Seasonal and spatial distribution of trace elements in the water and sediments of the Tsurumi River in Japan. Environ. Monit. Assess. 2012, 184, 265–279. [Google Scholar] [CrossRef]
- Zarcinas, A.B.; Pongsakul, P.; McLaughlin, J.M.; Cozens, G. Heavy metals in soils and crops in Southeast Asia. 2. Thailand. Environ. Geochem. Health 2004, 26, 359–371. [Google Scholar] [CrossRef] [PubMed]
- MacDonald, D.D.; Ingersoll, C.G.; Berger, T.A. Development and evaluation of consensus-based sediment quality guidelines for freshwater ecosystems. Arch. Environ. Contam. Toxicol. 2000, 39, 20–31. [Google Scholar] [CrossRef] [PubMed]
- Pollution Control Department Soil Quality Standards for Habitat and Agriculture. Available online: http://www.pcd.go.th/info_serv/%0Aen_reg_std_soil01.html (accessed on 16 July 2021).
- Thongyuan, S.; Aendo, P.; Binot, A.; Tulayakul, P. Ecological and health risk assessment, carcinogenic and non-carcinogenic effects of heavy metals contamination in the soil from municipal solid waste landfill in Central, Thailand. Hum. Ecol. Risk Assess. 2021, 27, 876–897. [Google Scholar] [CrossRef]
- Vongdala, N.; Tran, H.D.; Xuan, T.D.; Teschke, R.; Khanh, T.D. Heavy metal accumulation in water, soil, and plants of municipal solid waste landfill in Vientiane, Laos. Int. J. Environ. Res. Public Health 2019, 16, 22. [Google Scholar] [CrossRef] [Green Version]
- Weber, P.; Behr, E.R.; Knorr, C.D.L.; Vendruscolo, D.S.; Flores, E.M.M.; Dressler, V.L.; Baldisserotto, B. Metals in the water, sediment, and tissues of two fish species from different trophic levels in a subtropical Brazilian river. Microchem. J. 2013, 106, 61–66. [Google Scholar] [CrossRef]
- Yan, A.; Wang, Y.; Tan, N.S.; Yusof, M.L.M.; Ghosh, S.; Chen, Z. Phytoremediation: A Promising Approach for Revegetation of Heavy Metal-Polluted Land. Front. Plant Sci. 2020, 11, 359. [Google Scholar] [CrossRef]
- Omwene, P.I.; Öncel, M.S.; Çelen, M.; Kobya, M. Heavy metal pollution and spatial distribution in surface sediments of Mustafakemalpaşa stream located in the world’s largest borate basin (Turkey). Chemosphere 2018, 208, 782–792. [Google Scholar] [CrossRef] [PubMed]
- Varol, M. Assessment of heavy metal contamination in sediments of the Tigris River (Turkey) using pollution indices and multivariate statistical techniques. J. Hazard. Mater. 2011, 195, 355–364. [Google Scholar] [CrossRef]
- Dwivedi, S.; Mishra, S.; Tripathi, R.D. Ganga water pollution: A potential health threat to inhabitants of Ganga basin. Environ. Int. 2018, 117, 327–338. [Google Scholar] [CrossRef]
- Pandey, J.; Yadav, A. Alternative alert system for Ganga river eutrophication using alkaline phosphatase as a level determinant. Ecol. Indic. 2017, 82, 327–343. [Google Scholar] [CrossRef]
- Yadav, A.; Pandey, J. Contribution of point sources and non-point sources to nutrient and carbon loads and their influence on the trophic status of the Ganga River at Varanasi, India. Environ. Monit. Assess. 2017, 189, 475. [Google Scholar] [CrossRef] [PubMed]
- Tchounwou, P.B.; Yedjou, C.G.; Anita, K.; Patlolla, A.K.; Dwayne, J.S. Heavy Metal Toxicity and the Environment. Exp. Suppl. 2012, 101, 133–164. [Google Scholar] [CrossRef] [Green Version]
- Agency for Toxic Substances and Disease Registry. Toxicological Profile for Cadmium; U.S. Department of Health and Human Services: Washington, DC, USA, 2012.
- Agency for Toxic Substances and Disease Registry. Toxicology Profile for Copper; U.S. Department of Health and Human Services: Atlanta, GA, USA, 2004.
- Agency for Toxic Substances and Disease Registry. Toxicological Profile for Lead; U.S. Department of Health and Human Services: Washington, DC, USA, 2020.
Figure 1.
(a) The Chan Thnal reservoir and sampling locations (L1–L6) and (b) geological map of Cambodia and the Chan Thnal reservoir.
Figure 1.
(a) The Chan Thnal reservoir and sampling locations (L1–L6) and (b) geological map of Cambodia and the Chan Thnal reservoir.


Figure 3.
Dendrogram of a complete linkage, correlation coefficient among Cd, Cu, Zn, and Pb.


Table 1.
Descriptive statistics of the water temperature, pH, and DO of the Chan Thnal reservoir.
| Locations | Temperature (°C) | pH | DO (mg/L) | |||
|---|---|---|---|---|---|---|
| Wet Season | Dry Season | Wet Season | Dry Season | Wet Season | Dry Season | |
| L1 | 25.3 | 25.0 | 6.1 | 7.5 | 7.20 | 6.00 |
| L2 | 25.6 | 27.3 | 6.6 | 7.4 | 7.10 | 6.40 |
| L3 | 27.7 | 24.7 | 6.5 | 6.9 | 7.20 | 6.40 |
| L4 | 25.7 | 24.7 | 6.5 | 6.6 | 7.00 | 4.60 |
| L5 | 27.7 | 23.2 | 6.6 | 7.0 | 6.00 | 5.60 |
| L6 | 27.3 | 25.7 | 6.2 | 6.7 | 6.70 | 4.70 |
| Permissible limits | <45 a,b, 25–30 d | <45 a,b, 25–30 d | 6–9 a, 5–9 b,c, 6.5–8.5 d | 6–9 a, 5–9 b,c, 6.5–8.5 d | 2.0 a, 1.0 b, 4.0 c | 2.0 a, 1.0 b, 4.0 c |
| Mean ± SD | 26.6 ± 1.1 | 25.1 ± 1.4 | 6.4 ± 0.2 | 7.0 ± 0.4 | 6.9 ± 0.6 | 5.6 ± 1.2 |
| Minimum | 23.2 | 6.1 | 4.6 | |||
| Median | 25.7 | 6.6 | 6.4 | |||
| Maximum | 27.7 | 7.5 | 7.2 | |||
| Range | 4.5 | 1.4 | 2.6 | |||
| IQR | 2.525 | 0.475 | 1.375 | |||
| Skewness | −0.008 | −0.62 | −0.80 | |||
a Cambodia’s allowable limits for pollutant substance discharging to the protected public water area and b to the public water area and sewer, c Thailand’s surface water quality guideline, and d guidelines for drinking water quality.
Table 2.
Heavy metal concentrations in water and sediment of the Chan Thnal reservoir and the permitted levels.
Table 2.
Heavy metal concentrations in water and sediment of the Chan Thnal reservoir and the permitted levels.
| Mean Concentrations (µg/L) in Water Samples | ||||||||
|---|---|---|---|---|---|---|---|---|
| Locations | Cd | Cu | Zn | Pb | ||||
| Wet | Dry | Wet | Dry | Wet | Dry | Wet | Dry | |
| L1 | 1.28 b | 1.31 a | 10.01 e | 14.82 a | 42.72 f | 111.12 a | 51.55 d | 28.29 b |
| L2 | 1.20 b | 1.17 b,c | 14.52 c | 6.04 b,c | 247.66 b | 66.93 b | 54.45 c | 25.29 b |
| L3 | 1.79 a | 1.12 c | 50.41 a | 7.46 b | 636.17 a | 45.91 c | 75.72 a | 26.01 b |
| L4 | 1.22 b | 1.28 a,b | 19.27 b | 6.42 b,c | 234.06 c | 36.65 c | 61.94 b | 51.43 a |
| L5 | 1.15 b | 1.12 c | 12.26 d | 5.19 c | 66.46 e | 43.24 c | 52.29 d | 26.73 b |
| L6 | 1.22 b | 1.17 b,c | 10.89 d,e | 5.45 c | 92.20 d | 70.74 b | 50.51 d | 26.86 b |
| Average ± SD | 1.31 ± 0.24 | 1.19 ± 0.08 | 19.56 ± 15.47 | 7.56 ± 3.64 | 219.88 ± 221.58 | 62.43 ± 27.44 | 57.74 ± 9.71 | 30.77 ± 10.17 |
| Overall | 1.25 ± 0.18 | 13.56 ± 12.411 | 141.15 ± 171.53 | 44.26 ± 16.98 * | ||||
| 10th percentile | 1.12 | 5.51 | 42.77 | 26.08 * | ||||
| 50th percentile | 1.21 | 10.45 | 68.84 | 50.97 * | ||||
| 90th percentile | 1.30 | 18.83 | 246.30 | 61.19 * | ||||
| WHO 1 | 3 | 2000 | 5000 | 10 | ||||
| Mean concentrations (mg/kg) in sediment samples | ||||||||
| L1 | ND | ND | 13.972 c | 8.676 d | 24.331 b,c | 16.194 c | 4.290 c | 2.346 d |
| L2 | ND | ND | 3.515 f | 7.366 e | 6.982 d | 18.220 c | 3.360 c | 2.493 d |
| L3 | ND | ND | 7.270 e | 8.794 d | 9.226 d | 12.713 d | 6.160 b | 8.666 a |
| L4 | ND | ND | 9.381 d | 10.768 b | 24.078 c | 22.197 b | 5.702 b | 9.315 a |
| L5 | ND | ND | 15.542 b | 13.140 a | 26.450 b | 25.443 a | 8.374 a | 4.191 c |
| L6 | ND | ND | 25.354 a | 10.341 c | 39.697 a | 16.615 c | 9.351 a | 5.633 b |
| Average ± SD | ND | ND | 12.506 ± 0.509 | 9.848 ± 0.219 | 21.794 ± 0.988 | 18.564 ± 1.348 | 6.206 ± 0.550 | 5.441 ± 0.356 |
| Overall | - | 11.18 ± 5.53 | 20.18 ± 8.88 | 5.86 ± 2.54 | ||||
| 10th percentile | - | 7.28 | 9.57 | 2.98 | ||||
| 50th percentile | - | 9.86 | 20.21 | 5.67 | ||||
| 90th percentile | - | 15.39 | 26.35 | 9.25 | ||||
| Earth’s crust 2 | 0.09 | 28 | 67 | 17 | ||||
| Background concentration of metals in soil 3 | 0.01 | 2.3 | 3.6 | 4.9 | ||||
| CT 4 | 4.98 | 149 | 459 | 128 | ||||
| Standard 5 | 0.15 | 45 | 70 | 55 | ||||
| WHO 6 | 0.80 | 36 | 40 | 85 | ||||
Data are presented as the mean values; SD means standard deviation, ND means not detected. Values with similar letters refer to “not significantly different”, where a, b, c, d, e, f refer to “significantly different” (p < 0.05) with the following order: a < b < c < d < e < f (Minitab 16 ANOVA one-way test). * indicates the value above the standard limits. 1 Guidelines for Drinking-Water Quality [54]. 2 Earth’s crust composition [40]. 3 Thailand—background concentration of metals in soil [58]. 4 Concentration threshold of metals in sediments based on sediment quality guidelines for freshwater systems [59]. 5 Soil quality standards for habitat and agriculture purposes [58,60,61]. 6 Permissible limits of heavy metals in soil and plants, World Health Organization 1996 [4,62].
Table 3.
Heavy metals pollution and ecological risk assessment of the Chan Thnal reservoir.
| Metals | Parameters | Values | Interpretation |
|---|---|---|---|
| Cu | Igeo | 1.55 | moderately contaminated |
| CF | 4.86 | considerable level of contamination | |
| EF | 9.56 | severe enrichment | |
| ER | 24.30 | low ecological risk | |
| Zn | Igeo | 1.76 | moderately contaminated |
| CF | 5.61 | considerable level of contamination | |
| EF | 11.03 | very severe enrichment | |
| ER | 28.03 | low ecological risk | |
| Pb | Igeo | −0.48 | uncontaminated to moderately contaminated |
| CF | 1.20 | moderate level of contamination | |
| EF | 2.35 | minor enrichment | |
| ER | 5.98 | low ecological risk | |
| PLI | 3.19 | progressive deterioration or pollution | |
| PI | 8.27 | heavily polluted | |
| MPI | 4.25 | moderately to heavily polluted | |
| mCd | 3.89 | moderately contaminated | |
| PER | 35.88 | low risk (based on only four metal species) |
Note: The values are calculated based on the background values of Thailand soil reported by [61].
Table 4.
The parameters used for the estimation of EDI and the HQ values.
| Parameters | Adults-Male | Adults-Female | Children | Infants |
|---|---|---|---|---|
| IR * (L/day) | 2 | 2 | 1 | 0.5 |
| ED (years) | 67 | 72 | 10 | 1 |
| EF (days/year) | 365 | 365 | 365 | 365 |
| ABW (kg) | 60 | 50 | 10 | 5 |
| AT (days) | 24,455 | 26,280 | 3650 | 365 |
| HQPb | 0.42 | 0.51 | 1.26 | 1.26 |
| HQZn | 0.02 | 0.02 | 0.05 | 0.05 |
| HQCu | 0.01 | 0.01 | 0.04 | 0.04 |
| HQCd | <0.001 | <0.001 | <0.001 | <0.001 |
* The IR values were obtained from [54].
Table 5.
Pearson’s correlation among Cd, Cu, Zn, and Pb in the water.
| Heavy Metals | Cd | Cu | Zn | Pb |
|---|---|---|---|---|
| Cd | 1.00 | |||
| Cu | 0.925 | 1.00 | ||
| Zn | 0.874 | 0.969 | 1.00 | |
| Pb | 0.653 | 0.728 | 0.702 | 1.00 |
Table 6.
Factor analysis of Cd, Cu, Zn, and Pb in the water.
| Heavy Metals | Factor 1 | Factor 2 | Factor 3 | Communality |
|---|---|---|---|---|
| Cd | 0.937 | −0.219 | −0.271 | 1.00 |
| Cu | 0.982 | −0.131 | 0.070 | 0.99 |
| Zn | 0.962 | −0.140 | 0.222 | 0.99 |
| Pb | 0.820 | 0.571 | −0.034 | 1.00 |
| Variance | 3.439 | 0.411 | 0.129 | 3.979 |
| % Cumulative | 86.0 | 10.3 | 3.2 | 99.5 |
Table 7.
The possible sources of Cd, Cu, Zn, and Pb in the water.
| Heavy Metals | Sources | References |
|---|---|---|
| Cd | Natural weathering processes, Discharge from industrial facilities or sewage treatment plants, Leaching from landfills or soil, Urban runoff, Agricultural runoff (i.e., fertilizers) | [71] |
| Cu | Natural weathering processes, Sewage effluent, Leachate from municipal landfills, Urban runoff, Agricultural runoff (i.e., fertilizers) | [72] |
| Zn | Natural weathering processes, Urban runoff, Municipal and industrial effluents, Agricultural runoff (i.e., fertilizers) | [17] |
| Pb | Discharge from industrial facilities, Urban runoff, Atmospheric deposition, Agricultural runoff (i.e., pesticide), Direct sources (e.g., Pb shots and Pb sinkers) | [73] |
Publisher’s Note: MDPI stays neutral with regard to jurisdictional claims in published maps and institutional affiliations. |
© 2021 by the authors. Licensee MDPI, Basel, Switzerland. This article is an open access article distributed under the terms and conditions of the Creative Commons Attribution (CC BY) license (https://creativecommons.org/licenses/by/4.0/).
Share and Cite
MDPI and ACS Style
Chheang, L.; Thongkon, N.; Sriwiriyarat, T.; Thanasupsin, S.P. Heavy Metal Contamination and Human Health Implications in the Chan Thnal Reservoir, Cambodia. Sustainability 2021, 13, 13538. https://doi.org/10.3390/su132413538
AMA Style
Chheang L, Thongkon N, Sriwiriyarat T, Thanasupsin SP. Heavy Metal Contamination and Human Health Implications in the Chan Thnal Reservoir, Cambodia. Sustainability. 2021; 13(24):13538. https://doi.org/10.3390/su132413538
Chicago/Turabian StyleChheang, Lita, Nisakorn Thongkon, Tongchai Sriwiriyarat, and Sudtida Pliankarom Thanasupsin. 2021. "Heavy Metal Contamination and Human Health Implications in the Chan Thnal Reservoir, Cambodia" Sustainability 13, no. 24: 13538. https://doi.org/10.3390/su132413538
Note that from the first issue of 2016, this journal uses article numbers instead of page numbers. See further details here.