
Theoretical Framework to Assess Green Roof Performance in Mitigating Urban Flooding as a Potential Nature-Based Solution


 ,
,  ,
, 
Abstract
:1. Introduction
1.1. Characterisation of Flood Events
1.2. Nature-Based Solutions: An Alternate Approach to Address Environmental and Socio-Ecological Problems
1.3. Characteristics and Types of NBS
2. Methodology Used to Investigate the Effectiveness of Green Roofs Based on Literature
2.1. Systematic Literature Review
2.2. Performance Evaluation Study
3. Evolutions, Technical Details, and Co-Benefits of Green Roofs
3.1. Evolutions of Green Roofs
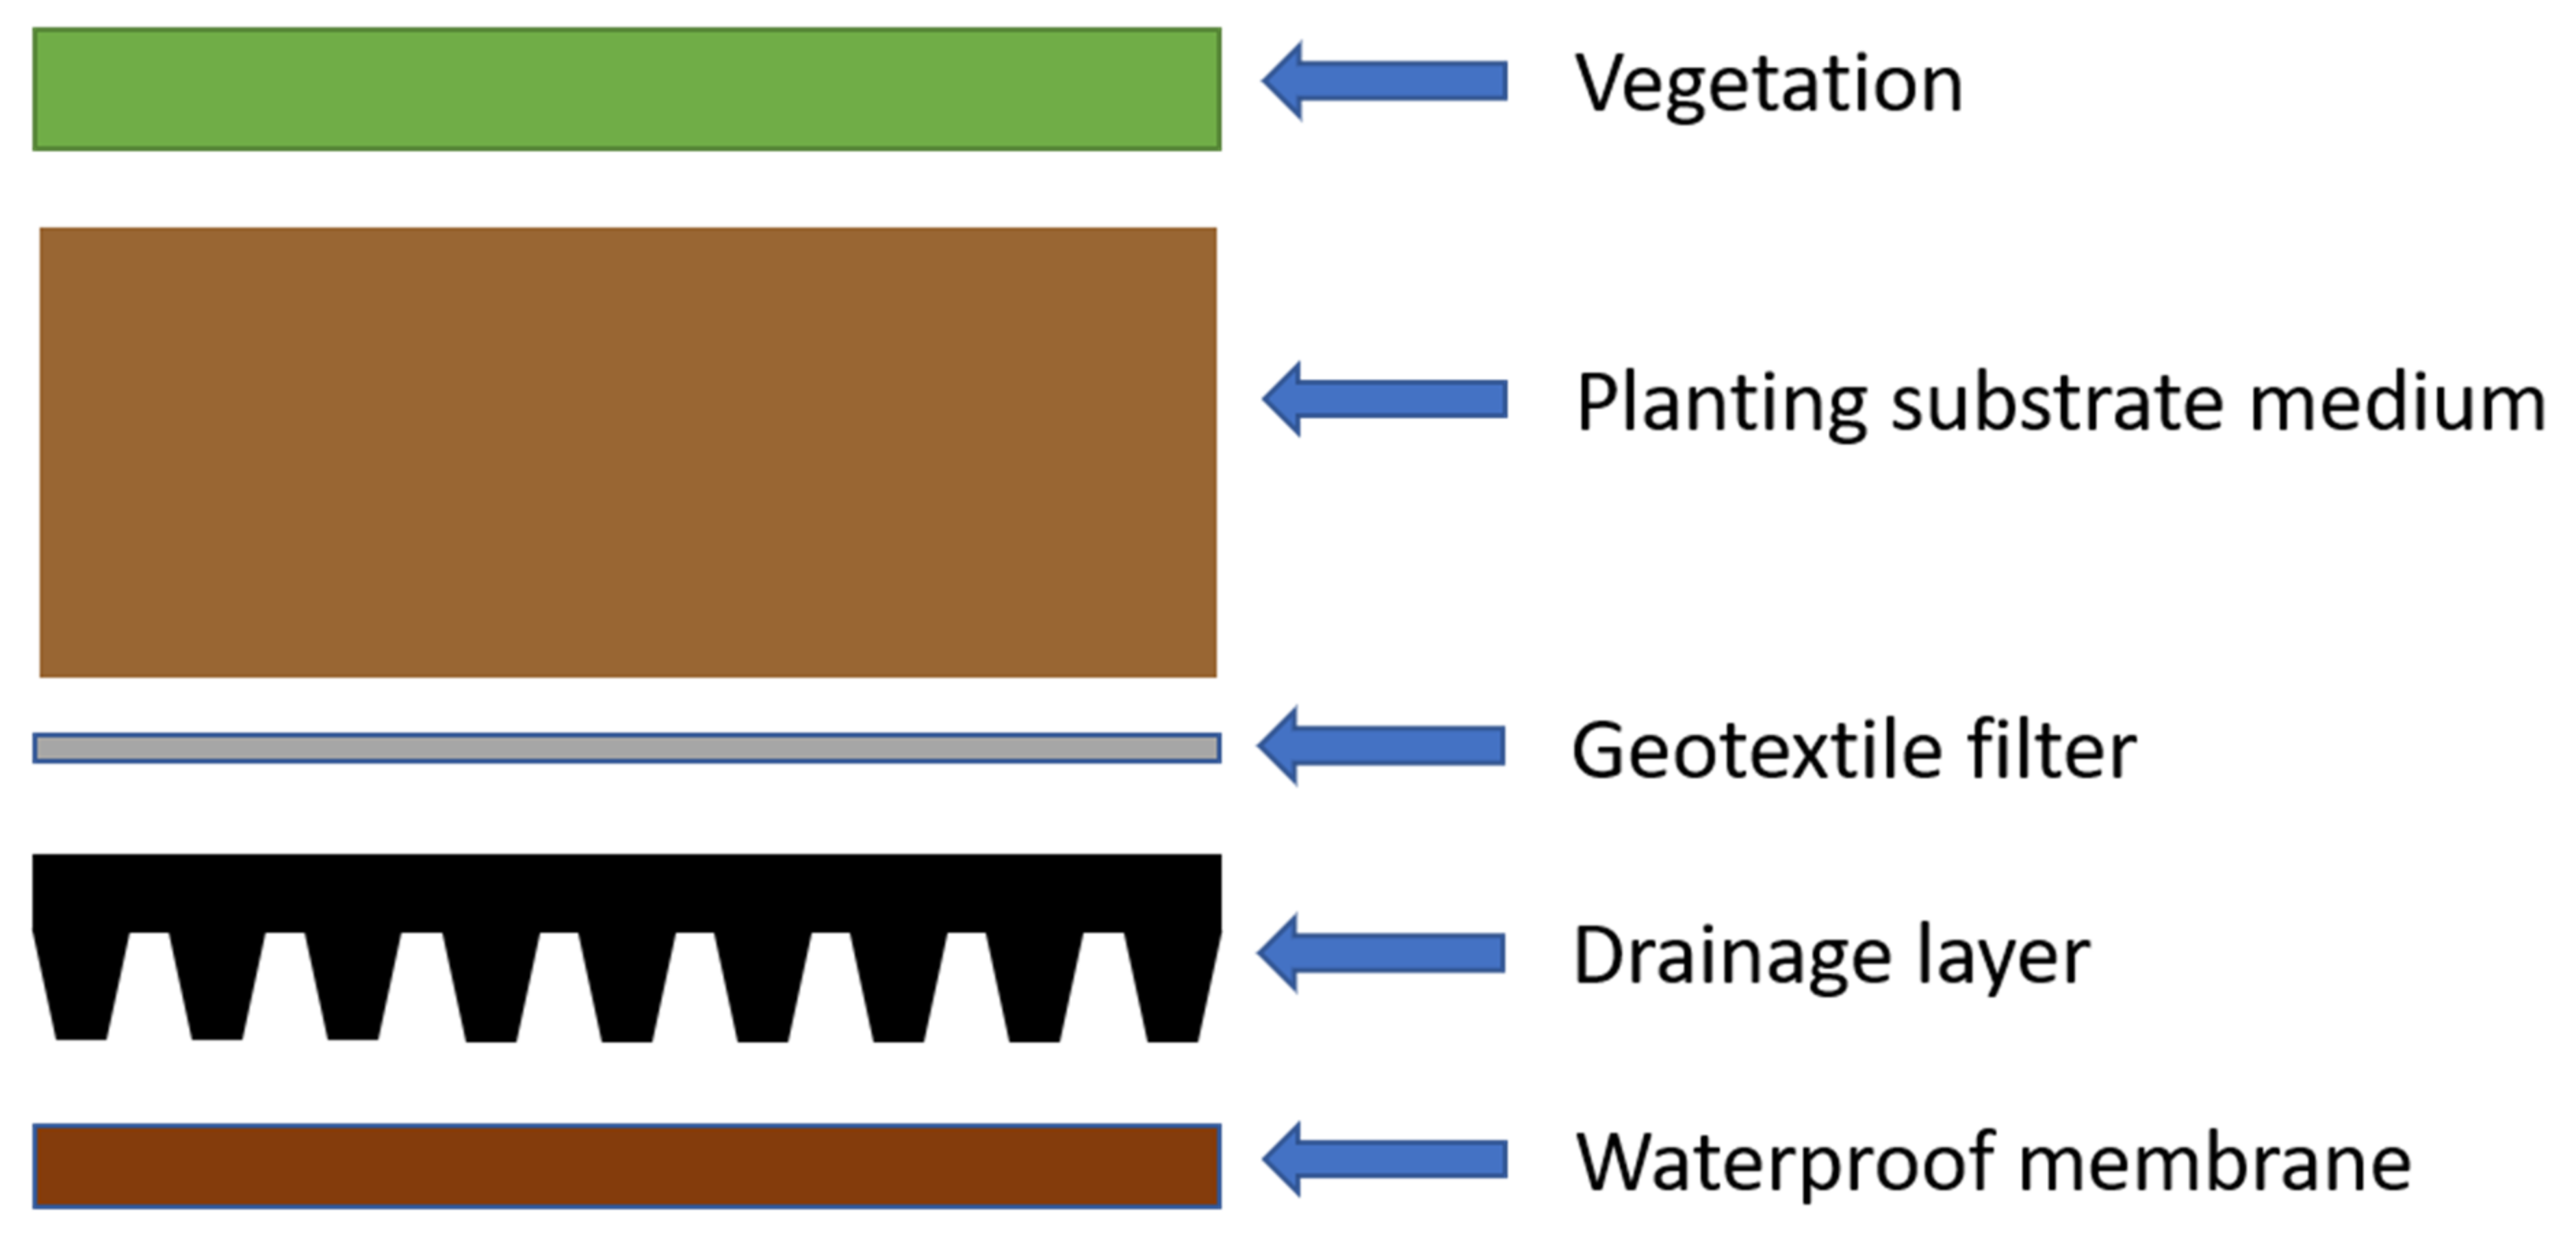
3.2. Technical Description of Green Roofs
3.3. Co-Benefits of Green Roofs
4. Evaluating Green Roofs Performances in Flood Mitigation/Control
4.1. Hydrological Performances of Green Roofs Observed in the Literature
4.1.1. Monitoring Methods for Green Roof Performance Evaluation
4.1.2. Modeling Methods for Green Roof Performance Evaluation
4.2. Evaluating the Performance of Green Roofs Using a Simulation Study
4.2.1. Precipitation
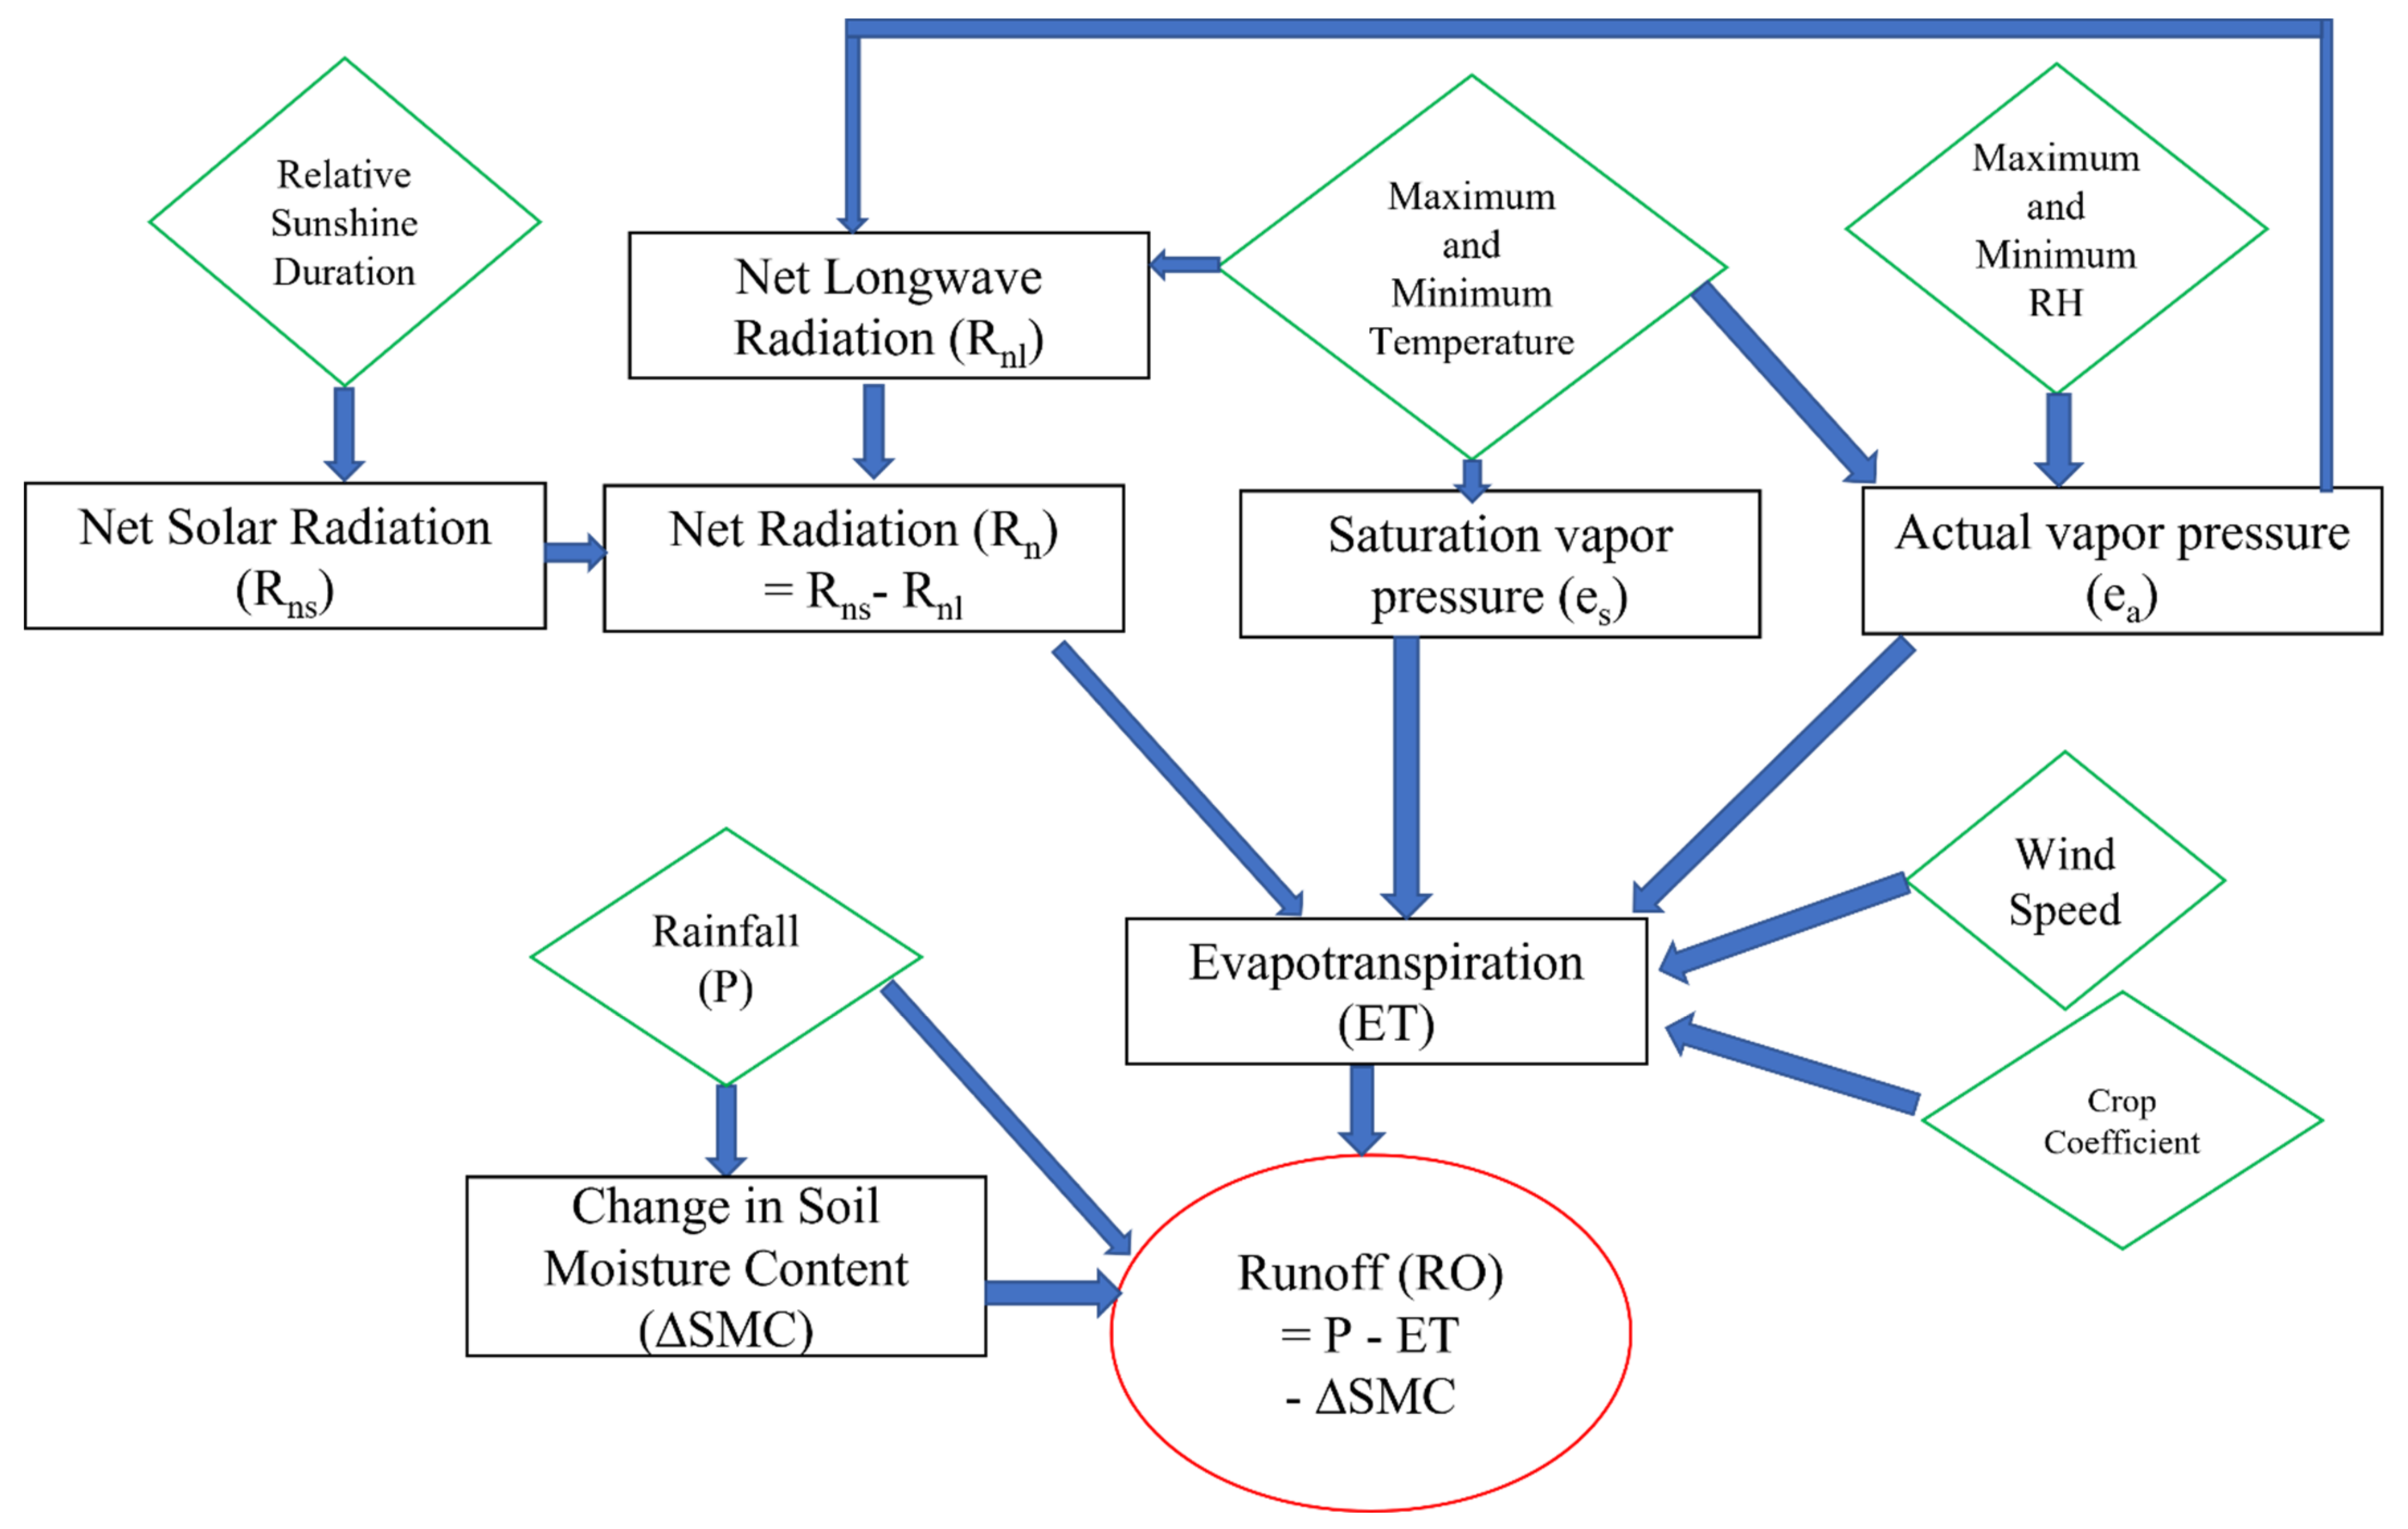
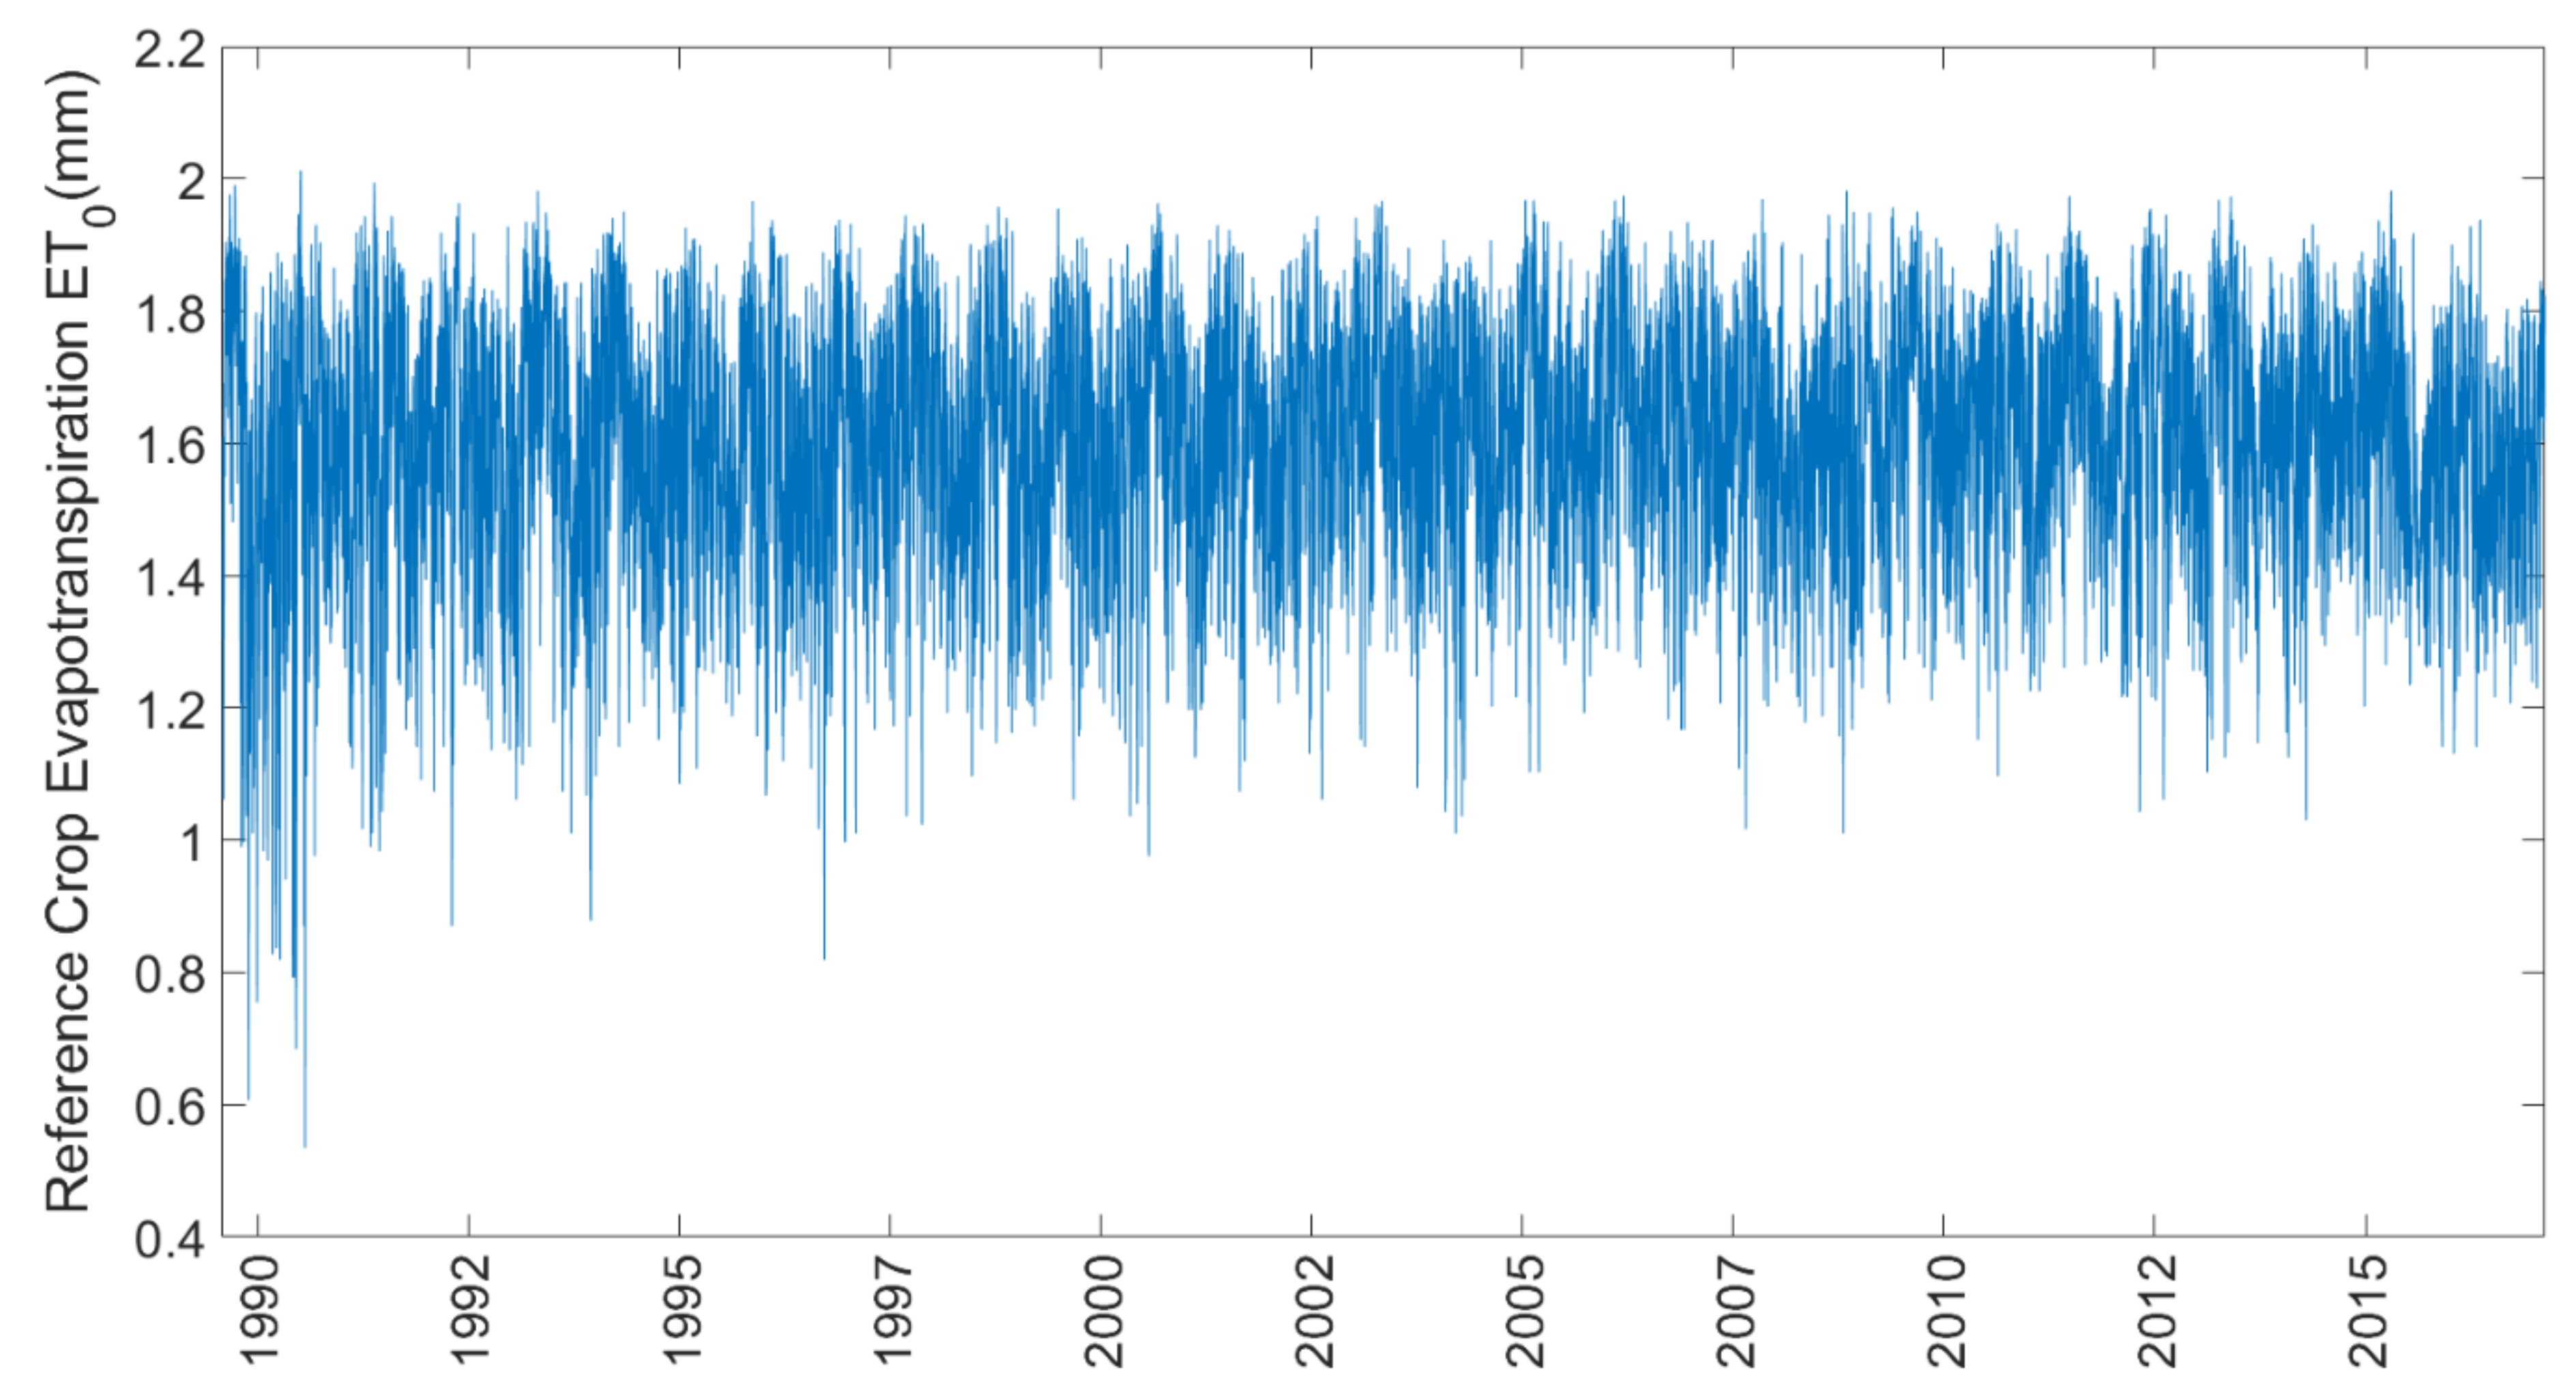
4.2.2. Model to Estimate Evapotranspiration
Estimation of Net Radiation
Estimation of Soil Heat Flux Density
Estimation of Mean Daily Air Temperature
Estimation of Wind Speed at 2-m Height
Estimation of Saturation Vapor Pressure
Estimation of Actual Vapor Pressure
Estimation of the Slope of the Saturation Vapor Pressure-Temperature Curve
Estimation of Psychrometric Constant
4.2.3. Method to Estimate Changes in Soil Moisture Content and Runoff
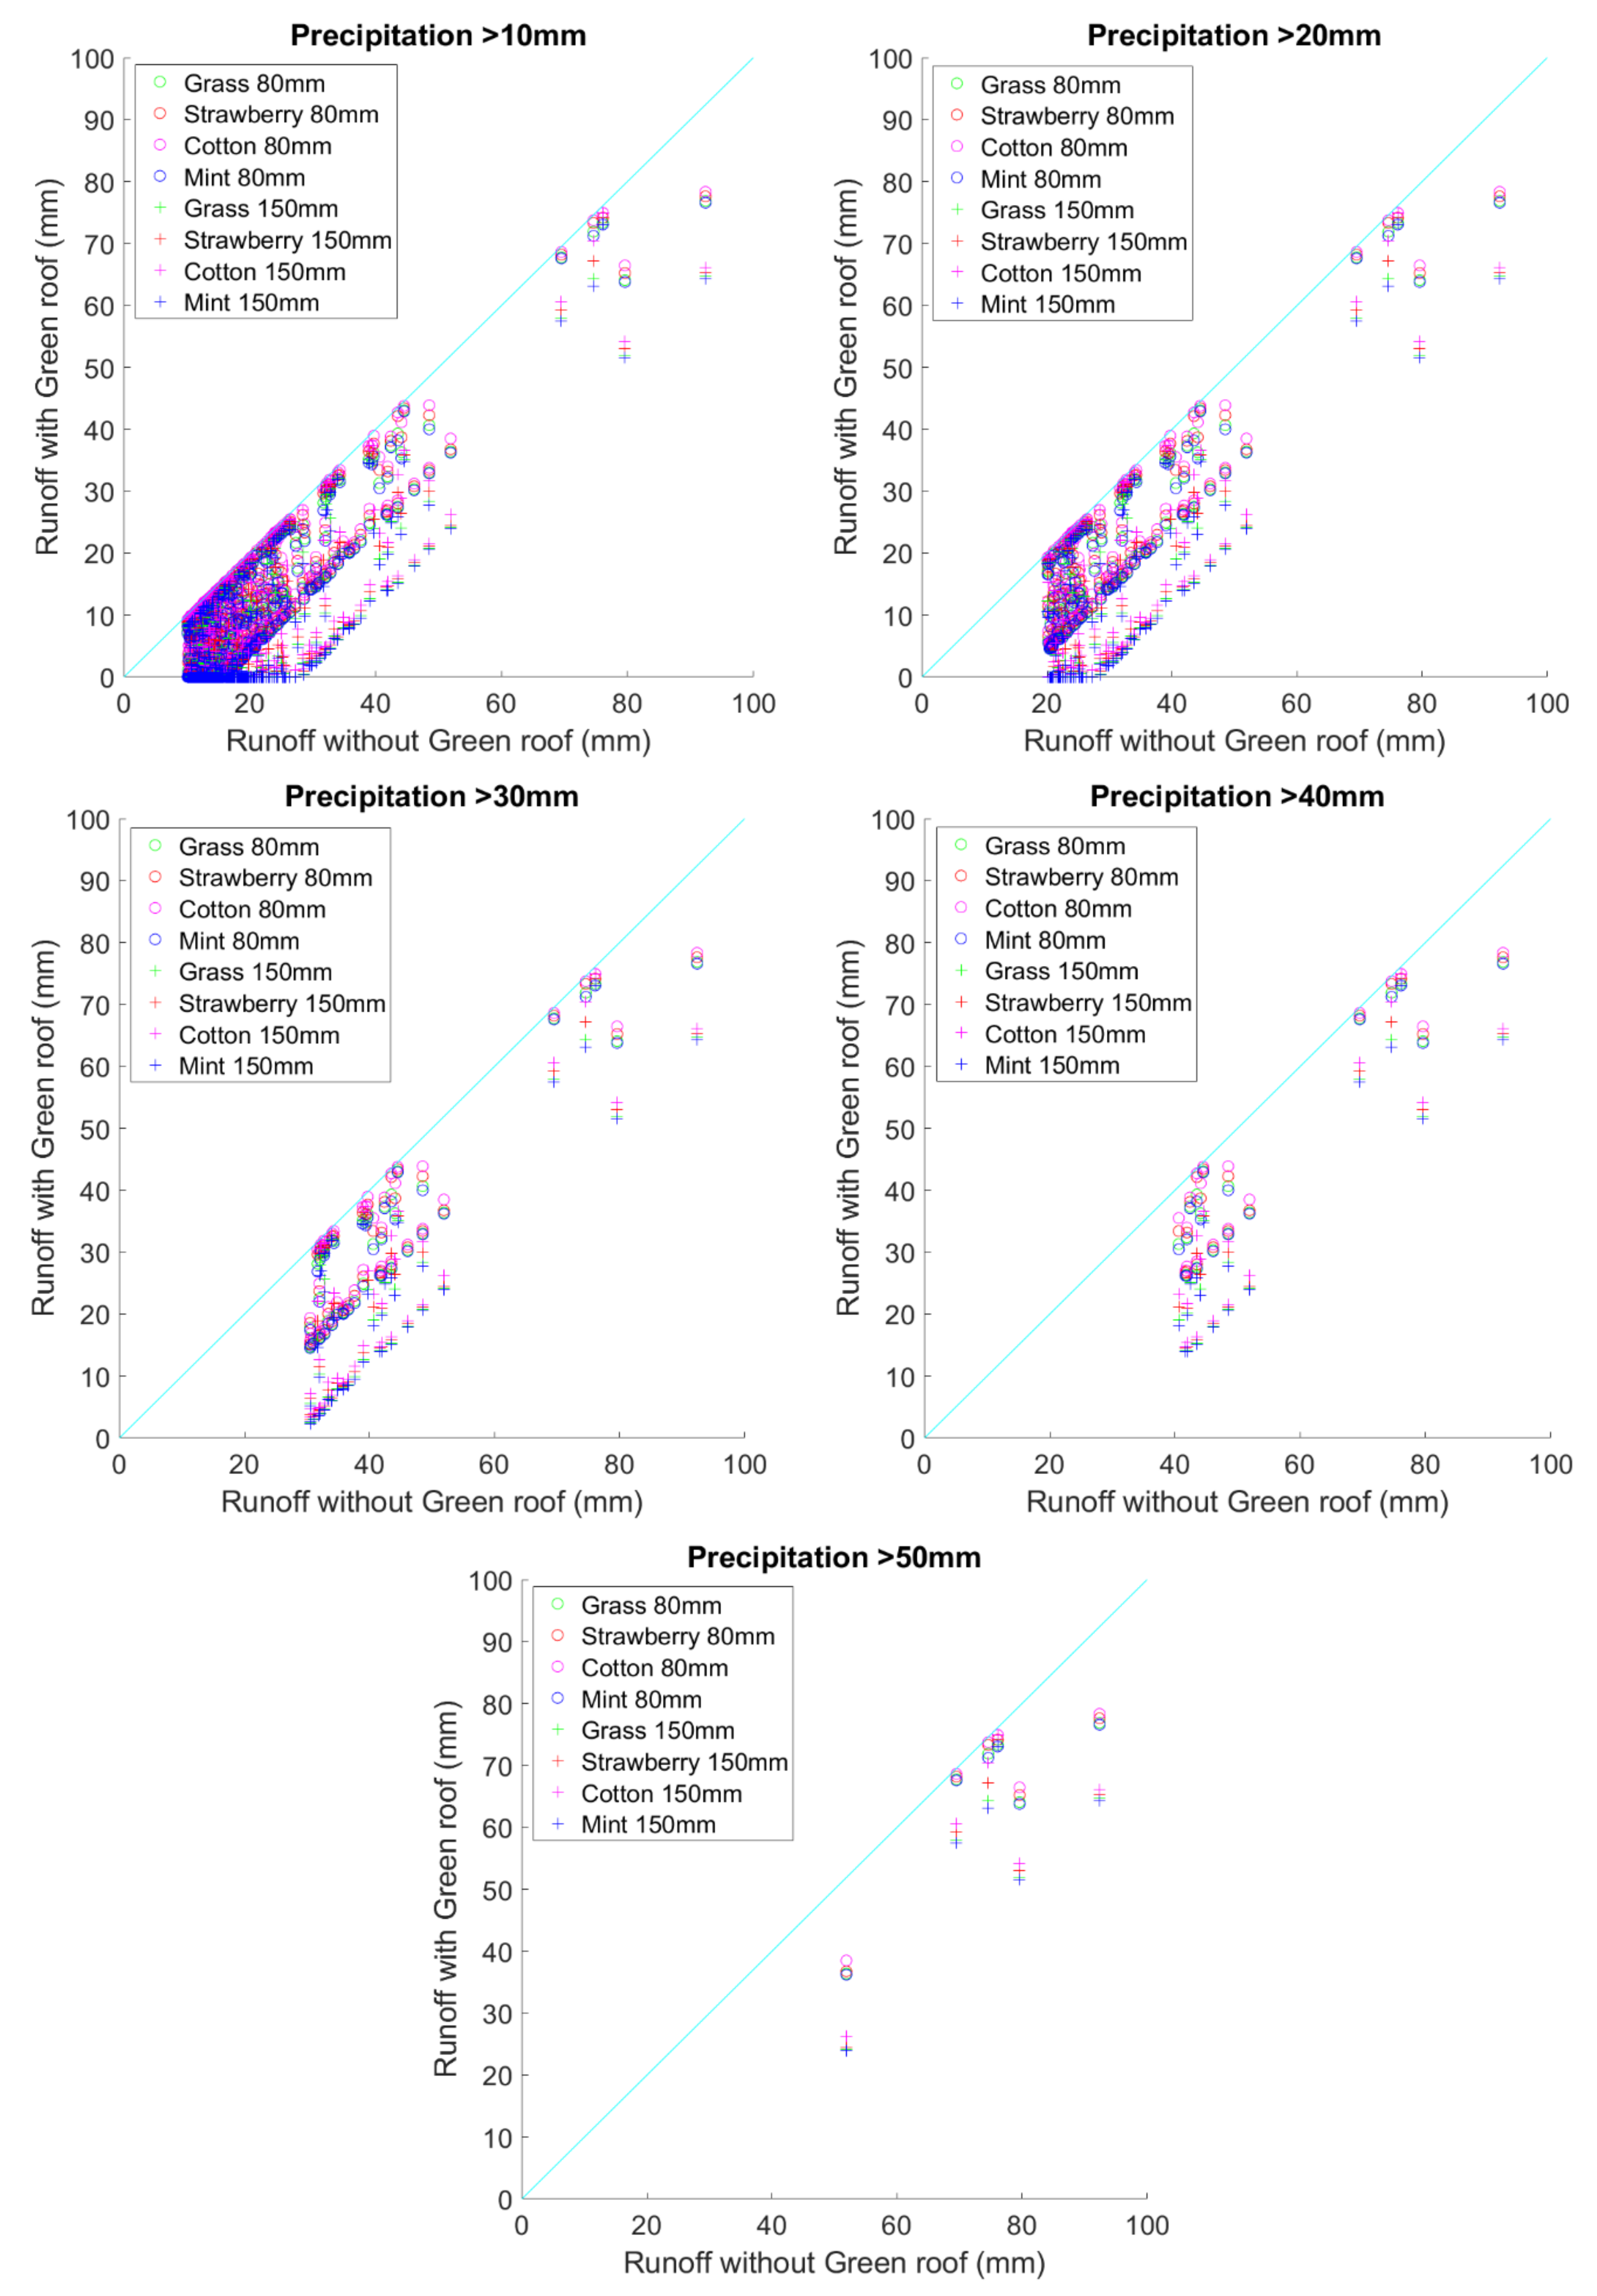
4.2.4. Simulation Study
4.2.5. Real-World Case Study
5. Discussion and Conclusions
Author Contributions
Funding
Institutional Review Board Statement
Informed Consent Statement
Data Availability Statement
Conflicts of Interest
Appendix A

| Sl | Location and Analysis Type | Size of Study Area | Details of Weather/Climate | Green roof Details/Percentage Improvement | Findings | Ref. |
|---|---|---|---|---|---|---|
| 1 | Georgia, USA Monitoring | 42.64 sq. meter | 31 individual storm events from Nov 2003–Nov 2004, where precipitation depth ranged from 0.28 to 8.43 cm. | Green roof stormwater retention ranged from 39–100%, with an average retention just under 78%. In situations where precipitation was less than 1.27 cm, more than 90% times the green roof effectively retain entire water. However, during a 5.38 cm storm event occurring on November 19, 2003, the green roof managed to retain 39% water, which is the least retention over all the 31 storm events. | The green roof mostly retained the rainfall from the frequently occurring to small amount of storm events. In urbanized areas, little rainfall infiltrates, resulting in slow stream base flow; most of the water is transported and results in elevated stormflow. Stormwater retention can occur at the beginning of storms as the substrate medium absorb the rainfall until saturation point is reached. The green roof operates as a retention instrument for a particular water volume. The occurrence of retention depends on seasonal factors when the substrate later is thin. | [88] |
| 2 | Brussels, Belgium Monitoring | NA | 628 individual storm events with rainfall intensity ranging from 27.8–300 mm/h. | A total of 11 intensive green roofs were considered in the study with substrate layer depths ranging from 150–350 mm. Reduction in runoff varied from 65–85%. A total of 121 extensive green roofs were studied, having 30–140 mm depths. Runoff reduction ranged from 27–81%, depending on storm events. | Retention in the green roof is greater in summer compared to winter. This result is due to differences in rainfall distribution and evapotranspiration. | [76] |
| 3 | Pittsburg, USA Monitoring | 1115 sq. meter | Average annual precipitation of 0.94 m. | Annual average runoff reductions for extensive green roofs were up to 60%, and for intensive green roofs were up to 85%. | This paper focuses on the co-benefits of the green roof through a life cycle assessment. | [106] |
| 4 | Michigan, USA Monitoring | 5.954 sq. meter | A total of 62 individual storm events observed between 26 April 2005–1 September 2006 were considered for the analysis. The storm events were categorized into 16 light (<2 mm), 24 medium (2–10 mm), and 22 heavy (>10 mm) storm events. | Overall reductions in runoff by the green roof were found to be 94.2% during light rainfall, 89.5% during medium rainfall, and 63.3% during heavy rainfall. | The green roof and its design has significant potential for carbon sequestration. | [137] |
| 5 | Toronto, Canada Monitoring | 241 sq. meter | A total of 154 individual storm events were considered between May–November 2003, June–November 2004, and April–August 2005. Monthly rainfall in the selected period ranged from 65–190 mm. | The overall reduction of runoff at monthly scale was measured during the study period. The reduction was found to vary from 34–95%, where the reduction was more in summer months and less in spring. | The green roofs with vegetation cover were able to sequester 375 g of carbon per square metre. GThe green roof provides opportunity to sequester carbon. | [138] |
| 6 | Vancouver and Kelowna, Canada, and Shanghai, China Modeling (SCS-CN) | Vancouver: 3500 sq. meter; Kelowna: 3000 sq. meter; Shanghai: 3700 sq. meter. | The annual rainfall of 1224 mm at Vancouver in 2006, 370.9 mm at Kelowna in 1998, and 1254.5 mm at Shanghai in 2008 were considered for the study. | The overall reduction of runoff at the three cities considered in the study are as follows: Vancouver: 29%; Kelowna: 100%; Shanghai: 55%. | The model shows decreases in daily actual evapotranspiration as the antecedent dry period increases. The presence of an additional storage layer in the green roof helps in reduction of runoff and increases actual evapotranspiration. | [123] |
| 7 | Northwest and Central Italy Monitoring and Modeling (kinematic wave model) | 72 sq. meter | Monitoring was performed over two phases, one before deployment of the green roof and another after the deployment. In the first phase, one storm event was observed for 3 days from 2–4 May 2008, where the daily rainfall was 27.2 mm, 1.6 mm, and 43.2 mm, respectively. In second phase, 19 rainfall events were measured over one year (mid-May 2007 to mid-June 2008). | A kinematic wave model was developed to simulate the expected runoff from an impervious roof corresponding to rainfall received in the second phase. The simulated runoff, assuming an impervious roof, was compared with the observed runoff from the green roof during the 19 storm events. The green roof was found to reduce 68% of the average runoff. | The performance of the green roof is favourable also in the Mediterranean regions, where rainfall and the general climatic conditions are less favourable for vegetation to grow. | [139] |
| 8 | Sheffield, UK Monitoring | 3 sq. meter | A total of 11 individual storm events were monitored in 2006 and 2007. The total amount of rainfall per event ranged from 9.2–115.8 mm. | The performance of the green roof in runoff reduction was found to be 10–35% in the wet season and 65–100% in the dry season, with a mean of 34% over the 11 storm events. | Green roofs are able to provide significant stormwater retention in the UK climate. | [111] |
| 9 | Genoa, Italy Monitoring and Modeling (SWMS-2D) | 350 sq. meter | A total of 19 individual storm events were considered between May 2007–August 2008. The rainfall depth during the entire storm event ranged from 8–138.2 mm. | The reduction in runoff during the storm events varied from 4.6–100%, with a mean reduction of 89%. | Different hydraulic behaviours between the growing medium and the drainage layer were observed. The hydrological response of the green roof model reproduces the discharge hydrograph profile, volume, and timing. | [127] |
| 10 | Michigan, USA Monitoring | 325.2 sq. meter | Rainfall from 21 storm events were measured from 1 April–30 September 2008, at daily scale. The rainfall ranged from 4.06–74.68 mm. | Reduction in runoff during those storm events ranged from 29.86–99.95%, with mean of 68.25%. The overall reduction in runoff for the entire 6-month period was 88.86%. | The green roof helped in reducing peak discharge, and also delaying the hydrologic response. | [87] |
| 11 | Sheffield, UK Monitoring | 3 sq. meter | The daily rainfall data for 29 months were considered from 1 January 2007–31 May 2009. The monthly average rainfall ranged from 55 mm to 91.9 mm in the period, with July being the driest and December the wettest. | The green roof reduced the runoff by 50.2%, calculated over the entire study period. To understand the effect of the green roof over individual storm events, 22 significant rainfall events were identified in the study period, and an average of 30% reduction in runoff was noted over those events. The performance of the green roof in runoff reduction decreased with an increase in rainfall depth, with the amount of runoff reduction varying from 0–20 mm. | In winter, the evapotranspiration and retention values are reduced. High levels of runoff and low retention percentages can be expected when considering long return period events. | [77] |
| 12 | Wageningen, Netherlands Modeling (SWAP) | NA | Daily rainfall data were considered for modeling for the period 1954–1999. | Green roof substrate depths, ranging from 5 mm-100 mm, were considered. Increases in depth increased the runoff volume retention. The range of retention was found to be 55–75%. | Management cost and weight are important variables for the implementation of green roofs. | [126] |
| 13 | Wroclaw, Poland Monitoring; Modeling (SWMM) | 2.88 sq. meter, 100 mm thick | A total of 13 individual storm events from August 2009–August 2010 were considered in the study. The maximum rainfall intensity ranged from 2.8–187.35 mm/h, while rainfall duration ranged from 3.5–1572.5 min. | Based on the monitoring of runoff from green roofs during those storm events, the runoff reduction ranged from 29.9–77.7%, while the SWMM simulation study of green roofs showed an reduction of runoff ranging from 54–99%. | The results of the green roof model show a positive effect on the reduction of volume, peak intensity values, and on the delay of the occurrence of runoff. | [114] |
| 14 | Shropshire, UK Monitoring | 1 sq. meter | A total of 86 rainy days data between 9 December 2009–12 June 2010 were considered for the analysis. The rainfall ranged from 0.5–19.3 mm, with a total rainfall of 236 mm. | Two different green roofs were considered, one using sedum decks with 75 mm depth, and the other using meadow decks with 150 mm depth. The overall performance of those green roofs in runoff reduction over the 86 days was 40% for sedum and 48% for meadow decks, respectively. | The water-retention performance of green roofs varies seasonally, due to differences in rainfall patterns. | [100] |
| 15 | Manchester, UK Monitoring | 900 sq. meter | A total of 69 rainfall events were considered for the analysis. The annual average rainfall was 828.8 mm, with October–December as the wettest period (80.7–92.5 mm rainfall), while February –May is the driest (51.4–61.2 mm rainfall). | The overall performance of intensive green roofs of 500 mm depth in runoff reduction was found to be around 50% in winter months and close to 100% during dry months, with an overall average of 65.7% over the 69 storm events. | The highest retention of rainfall was achieved in summer. The age of the green roof is not an issue and does not affect the effectiveness of green roofs. | [75] |
| 16 | Northwest Scotland; Sheffield UK; Cornwall UK; East Midlands UK Modeling (CHFM) | NA | This study considered the effectiveness of green roofs in runoff reduction at four locations: NW Scotland, Sheffield, Cornwall, and East Midlands, where the annual average rainfall are 2708 mm, 838 mm, 1365 mm, and 496 mm, respectively. | Based on the CHFM simulation study, the overall runoff reduction due to green roofs in the four areas are as follows: NW Scotland: 19%; Sheffield: 40%; Cornwall: 33%; East Midlands: 59%. | The green roof’s capacity for retaining rainfall is dependent upon evapotranspiration for the period prior to a storm event. | [119] |
| 17 | Edwardsville, USA Monitoring | 0.363 sq. meter | Rainfall data were collected in two stages, first from September 2005–March 2007, and from April 2007–June 2008. The total rainfall during first stage was 1244.8 mm, with monthly precipitation ranging from 5–120 mm over 101 individual storm events, while during the second stage, the total rainfall was 1397.7 mm, with monthly precipitation from 20–230 mm over 74 individual storm events. | The overall reduction in runoff due to the green roof in the first and second stage for extensive green roofs was 38.6% and 42.9%, respectively, while that for intensive green roofs was 50.8% and 54.3%, respectively. | The design of a green roof, for example, the type of growth media, its depth, and the presence or absence of a drainage layer, plays a vital role in determining the performance. | [140] |
| 18 | Auckland, New Zealand Monitoring | 217 sq. meter | Daily rainfall was collected for 2008. The annual average rainfall was approximately 1200 mm, which is evenly distributed throughout the year, where average wet days is 137. | Median values of runoff retention by green roof varies from 81–85% per event in spring and 83–92% in summer, which decreased to 45–75% in autumn and 66% in winter. | Maintaining conditions for runoff lag time, peak flow, and duration of flow were tested. The peak flow from drainage was less flashy and tended to show variations in runoff compared to asphalt surfaces, which showed spikes in rainfall runoff intensity. | [141] |
| 19 | New York, USA Monitoring | 310 sq. meter | A total of 243 storm event data at daily scale were collected from June 2011 to June 2012. The rainfall depth varied from 0.25–180 mm. | Three green roofs were deployed and the percentage reductions in runoff were measured. The overall reductions in runoff during the study period were found to be 36% for extensive green roof of 32 mm depth made of vegetated mat, 47% for intensive green roof of 100 mm made of sedum mix, and 61% for intensive green roof of 100 mm made of sedum mix with modular trays. | Retention rates are higher for rainfall event-based approaches. In case of large rainfall events, representation of a series of smaller ‘daily’ events when using a daily record is the more accurate approach. | [71] |
| 20 | Manhattan, New York Modeling (HYDRUS-1D) | 310 sq. meter, 99 sq. meter and 0.09 sq. meter | This study considered 3 different green roofs and measured rainfall data corresponding to individual storm events at those locations. The first location had 63 events (small (<20 mm): 41; medium (20–40 mm): 13; large (>40 mm): 9). The second location had 79 events (small: 70; medium: 5; large: 4), and the third location had 6 events (small: 3; medium: 2; large: 1). | The overall reduction in runoff for all three green roofs was found to be 85% for small rainfall events, 48% for medium events, and 32% for large events. | Rainfall depth and event duration have the maximum influence on overall green roof rainfall retention. Rainfall intensity and its relation to the antecedent dry weather period (ADWP) has little influence on the aggregate performance of the green roof systems. The green roof retention and peak reduction generally decrease as rainfall volume increases. | [120] |
| 21 | Soacha, Colombia Modeling (SWMM) | ~35 sq. meter | A total of 8 storm events recorded from March–April 2012 were analyzed. The rainfall intensity during those events varied from 0.24–15.27 mm/h. | The SWMM model predicted a runoff reduction from 5.7–92.2%, with an average of 51.4% runoff reduction due to the green roof. | Green roofs play an important role in hydrologic attenuation, depicting a strong relationship between plant type used and the green roof’s hydrologic response to weather events. | [115] |
| 22 | Adelaide, Australia Monitoring | 1.8 sq. meter | The study considered 226 storm events with a total rainfall of 967.8 mm, where rainfall intensity varied from 0.31–7.16 mm/h. | Reduction in runoff for extensive green roofs over the storm events ranged from 66.38–81.66%, while that for intensive green roofs was 85.05–92.19%. | Extensive as well as intensive green roofs can retain significant volumes of stormwater runoff. An average runoff delay time of almost 3 h was observed in extensive roofs and the corresponding delay time was up to 17 h in intensive roofs, which both indicate that green roofs can effectively attenuate peak runoff flows. | [107] |
| 23 | Hong Kong Monitoring | 1.1 sq. meter | A total of 63 individual storm events were considered in the study from July 2012–April 2013. A total of 19 events had rainfall <2 mm; 18 events had rainfall between 2–10 mm, while 26 events had >10 mm rainfall. | Four different green roofs (two depths: 40 mm and 80 mm, and two substrate types: sandy loam and hydrophilic mineral wool) were considered in the study. The overall mean reduction of runoff for each type of green roof over the 63 storm events was 38.9% (40 mm sandy loam), 40% (40 mm wool), 45.3% (80 mm sandy loam), and 44.3% (80 mm wool). | Sufficient peak mitigation can be achieved even for extensive green roofs with thin 40-mm substrates. Thus, lightweight green roof design can be considered for buildings with loading concerns. | [142] |
| 24 | Ma’anshan, China Modeling (SUSTAIN) | 32585 sq. meter | Daily rainfall was considered for simulation modeling, where the annual average rainfall is 1100 mm, 48% of which occurs during June–August. | The hypothetical deployment of green roofs in the catchment would result in overall runoff reduction of 36%. | The green roofs were an optimal option for achieving the optimum runoff reduction goal. | [125] |
| 25 | Leeds, UK Monitoring | 830 sq. meter | A total of 30 individual storm events between June 2012 and December 2013 were recorded. The rainfall ranged from 5–84 mm with a mean of 10.07 mm. | Reduction in runoff from the green roof with 30-mm deep sedum carpet ranged from 3.57–100%, with mean of 66.21% over the 30 storm events. | The green roof was able to detain rainfall and attenuate peak runoff flows, when compared to a conventional roof. | [143] |
| 26 | Seoul, Korea Modeling (SWMM) | NA | The study considered a single storm event, which occurred over 90 min in 2011. | The SWMM model simulation was run for 30 h and the percentages of runoff reduction for two scenarios were estimated. In the first scenario, 51% of the roof area was assumed to be green roof, while in the second scenario, entire roof was converted to green roof. Reduction in runoff increased from 14.7% in the first scenario to 25.6% in the second scenario. | Stormwater runoff reduction in urban areas is achieved using green roofs. | [116] |
| 27 | Beijing, China Monitoring | 120 sq. meter | A total of 13 individual storm events from April–July 2012 were considered in the study. The rainfall ranged from 1.8–190.4 mm, with rainfall duration varying from 20–2715 min. | Percentage reduction in runoff due to green roofs over the storm events varied from 17.1–100%, where 100% attenuation occurred for storms with <10 mm rainfall, and the performance decreased with an increase in rainfall. | The medium layer or a high initial soil moisture can decrease the rainwater retention capacity of a green roof by generating more runoff. | [73] |
| 28 | Seoul, Korea Monitoring | 1 sq. meter | A total of 7 rainfall events in 2003 was considered, where the rainfall duration varied from 2–17 h, and the total rainfall ranged from 3.5–115 mm. | Two intensive green roofs of depth 150 mm and 200 mm were considered. The performance of the green roofs in the reduction of runoff corresponding to the 7 storm events ranged from 13.8–34.4% for 150 mm green roofs and 42.8–60.8% for 200 mm green roofs. | The extensive green roof system was analyzed, and it was found that it achieved a 13.8–60.8% reduction in runoff for the total rainfall. | [108]) |
| 29 | Victoria, Australia Modeling (MOUSE) | NA | The study considered a 24 h rainfall event corresponding to a 10-year return period., where the rainfall intensity ranged from 2.93–26 mm/h. | The overall reduction in runoff for the 24 h event ranged from 9.77–11.88%. | Eco-roof technology has been effective for mitigating flood extents since it is capable of retaining rainwater and reducing rainfall-runoff. | [122] |
| 30 | Seveso basin, Italy Modeling (SWMM) | NA | The average hourly rainfall for every month was obtained based on observed rainfall data from January 2010 to March 2015. The monthly average rainfall was lowest in March (60 mm/month) and highest in November (210 mm/month). | Based on the SWMM simulation study, the reduction of runoff due to the green roof varies from 2.8–35.3%, depending on rainfall in each month. | To understand green roof susceptibility, the initial conditions are significant in terms of the volumetric water content of the substrate. The use of green roofs at 5% coverage of all roofs reduces the peak flow by between 1.3 and 2%.Whereas, with a 100% greening scenario, the percentage of peak flow reduction equal to 30%, appears to be excellent. | [117] |
| 31 | Singapore Modeling (Sobek) | NA | Rainfall was measured from August 2009–December 2011, with rainfall ranging from 0.7–260.7 mm. | The simulation study was performed by assuming 25%, 50%, and 100% conversion of roofs to green roofs. The percentage reduction of runoff, corresponding to the three hypothetical cases in the catchmen, t are 0.6%, 1.2%, and 2.4%, respectively. | The catchment-scale implementation of green roofs had a positive effect for the reduction of peak discharges at the Marina Reservoir, although the peak reduction is lower compared to that in temperate climates. | [124] |
| 32 | Warsaw, Poland Monitoring | 1.44 sq. meter | The rainfall values of 64.1, 92.4, and 138 dm3/s/ha, corresponding to 1-, 3-, and 10-year return periods, respectively, were considered for the lab-based test, where the rainfall duration was chosen to be 20 min. | The reduction in runoff was found to be 48.3%, corresponding to rainfall with a 10-year return period, 70% for a 3-year return period rainfall, and 84% for rainfall of a 1-year return period. | There is a reduction of discharged rainwater from extensive green roofs. The thickness of the substrate enables the retention of the precipitation. | [144] |
| 33 | Seoul, Korea Monitoring | 285 sq. meter | A single storm event was considered on 3 September 2014, where the maximum intensity of rainfall was 60 mm/hr. | A 200-mm depth intensive green roof was used to measure the reduction in runoff for the storm event, which was found to be 68%. | Green and blue roofs can handle big storm events more effectively as compared to blue roofs. | [145] |
| 34 | Lisbon, Portugal Monitoring | 2.5 sq. meter | Rainfall was measured from September 2014–February 2015. The average rainfall was 0.4 mm/h. | Three types of green roof were considered in the study. The overall average reduction of runoff was found to be: 82% for a mix of plants and moss, 73.2% for shrubs, and 71.1% for grass. | For rainfall runoff reduction, the best results were obtained for the rainfall class of short durations, regardless of intensity, and the worst for the class of high maximum intensities and long durations. | [112] |
| 35 | Hypothetical study area Modeling (SWMM) | 390.2 sq. meter | The study considered 10 storm events with rainfall depths ranging from 0.3–11.3 mm and durations varying from 3–30 h. | Based on the SWMM simulation study, the decrease in runoff from a green roof of depth 12.7 mm was found to be 0–28%, depending on the rainfall intensity. Increases in rainfall intensity reduced the performance of the green roof in runoff reduction. | The study found that installing stormwater control measures in downstream catchments is more efficient for reducing peak flow and runoff volume, compared to installing stormwater controls in upstream catchments. | [118] |
| 36 | Victoria, Australia Modeling (SCS-CN) | 844 sq. meter | Based on historical rainfall data, a 24 h hypothetical rainfall event was generated for the simulation study. | The simulation model predicted a reduction of 66.6% runoff due to the 150-mm thick green roof. | The green roof model generated varying degrees of mitigation for the urban flash floods induced by storms. | [11] |
| 37 | Athens, Greece Monitoring | 69.3 sq. meter | Rainfall was observed from 15 January 2015 for one year. The individual storm events in the period ranged from 20–1670 min, with overall rainfall depth ranging from 0.6–45.4 mm, and the rainfall intensity varying from 0.01–1.4 mm/min. | The performance of five types of green roofs were explored in the study. The overall performance in runoff reduction were found as: Origanum onites with 80 mm depth: 63.6%; sedum with 160 mm depth: 60.3%; sedum with 80 mm depth: 50.8%; festuca with 160 mm depth: 68.8%; and festuca with 80 mm depth: 54.9%. | The runoff reduction was more when the substrate level was deeper than 16 cm, which was combined with vegetation cover, or when the initial moisture content in the substrate was low or the rainfall depth was small. | [74] |
| 38 | Munich, Germany Modeling (MIKE-SHE) | 5400–27000 sq. meter | A 2-year return period rainfall at hourly time scale was considered for the simulation study. | Assuming 20% of the roof area was converted to green roof, a runoff reduction of 1.4% was found in the catchment, while 100% conversion in green roof increased the performance to 14.8%. | The performance of green infrastructure effectiveness remains low under heavy rain events, unless a significantly large proportion of the area is greened, which could provide sufficient water storage capacities. | [47] |
| 39 | Shanghai, China Monitoring | 7.767 sq. meter | Artificial rainfall was generated with 0.33 mm/min intensity. A total of 5, 10, 25, 50, 100, and 250 mm/day rainfall representing light, moderate, large, rainstorm, large rainstorm, and extraordinary large rainfall events were generated by spraying the water for a duration of 15, 30, 75, 150, 300, and 750 min, respectively. | The reduction in runoff from the green roof was highest for light rainfall, and gradually decreased as the rainfall depth increased. The range of runoff reduction decreased from 83% to 15%. | The type of plant species significantly affected the hydrological performance and the rate of runoff reduction from extensive green roofs. | [146] |
| 40 | Portland, USA Monitoring | 1200 sq. meter | Rainfall data at daily scale was collected from 1 February 2014–31 January 2015. The total rainfall was 807.6 mm, with 70% rainfall occurring in Nov–April. | Two green roofs were considered for the study with varying depths. The first one had a 75 mm depth and reduced runoff by the amount of 17.7–48.8%, while the second green roof had a 125 mm depth and the reduction of runoff was 20.2–96.6%. | The long-term vegetated systems on green roofs will tend to offer higher moisture removal due to evapotranspiration. Additionally, the large-pored substrate has a lower maximum moisture-holding capacity. | [109] |
| 41 | Seoul, Korea Monitoring | 663 sq. meter | Hourly rainfall was measured from June–November 2017 and rainfall with more than 60 mm/h was considered in the analysis. | The effectiveness of the extensive green roof of 30 mm depth was found to reduce runoff by 10–60%, depending on the intensity and duration of the rainfall. | The rainwater is first stored on the green roof and then infiltrates to the ground surface. In this way, a peak flow delay is achieved during storm events. As a result, there is reduction in the occurrence of flash flooding in highly urbanized areas. | [147] |
| 42 | Reading, UK Monitoring | 0.24 sq. meter | Artificial rainfall was generated using a nozzle where the rainfall intensity was 28 mm/h and the total rainfall was 9.3 mm. | The performance of the green roof in runoff reduction was measured for two types of vegetation: sedum and Stachys. Runoff reduction for Sedum was 17.1%, and for Stachys was 13.1%. | The evapotranspiration rates are high in ‘warm’ and ‘hot’ conditions. The contribution of the plant’s transpiration component is important in ‘cool’ and ‘humid’ conditions. | [101] |
| 43 | Gansu province, China Monitoring | 1 sq. meter | A total of 66 rainfall events were considered and subdivided into low- and high-intensity rainfalls. The subdivision was based on the medium rainfall intensity equal to 0.38 mm/h. | Two green roofs, one considering Radix Ophiopogonis vegetation and another considering sedum was used for performance evaluation. Overall runoff reduction over the 66 rainfall events was found to be 21% for Radix Ophiopogonis and 31.3% for sedum vegetation. | The structural factors, the substrate material, and the depth were seen to be the most significant criteria for the green roof stormwater retention. | [79] |
| 44 | Rio de Janeiro, Brazil Monitoring | 0.5 sq. meter | Artificial rainfall of 155 mm/h intensity was simulated for 7 min duration, with temperatures ranging from 29–34 °C. | The experiment was repeated with wet and dry soil, where the reduction in runoff was found to be 31.18–35.43% for wet soil, and 62.08–85.19% for dry soil. | The use of modular-green roof systems showed an important impact on postponing hydrographs peak-flows but, jointly with hydrograph abatement, there is rainwater retention in the green roof modular system. This would contribute to flood control, especially for densely occupied urban areas. | [110] |
| 45 | Fisciano, Italy Monitoring | 2.5 sq. meter | The study considered 35 rainfall events with cumulative rainfall per event ranging from 0.5–122.17 mm, and with duration ranging from 35–4565 min. | The green roof performance in runoff reduction ranged from 4–100%, depending on the intensity, duration, and amount of rainfall. | Rainfall events depend on factors such as long duration, high cumulate depth, and rainfall intensity. A longer monitoring period would probably increase the probability of facing rainfall events with longer return periods. | [113] |
| 46 | Arcavacata, Italy Modeling (HYDRUS-1D) | 50 sq. meter | A total of 62 rainfall events from October 2015–September 2016 were considered, with the total rainfall per event ranging from 2.0–120.1 mm, rainfall intensity ranging from 0.4–13.5 mm/h, and duration ranging from 12 min–61 h 31 min. | The simulation study indicated that the overall reduction in runoff varies from 22% for 60 mm soil depths to 24% for 150 mm soil depths. | Peak flow reduction, peak flow lag time, etc., have correlations with the hydrological features of storm events. | [121] |
| 47 | Porto Alegre, Brazil Monitoring | 0.238 sq. meter | A total of 19 individual storm events were considered in the study, where total precipitation per event ranged from 11.87–139.54 mm, with duration ranging from 4 h 10 min to 71 h 50 min. | The percentage reduction of runoff per storm event was found to be between 42.9–80%. | The green roof structures showed a reduction in the volume of drained water. The green roof is composed of plants that have the capacity to retain water. The plants control the volume of runoff which is vital for reducing the volume of water sent to drainage systems. This helps in reducing the risk of flooding. | [148] |
References
- Huang, C.L.; Hsu, N.S.; Liu, H.J.; Huang, Y.H. Optimization of low impact development layout designs for megacity flood mitigation. J. Hydrol. 2018, 564, 542–558. [Google Scholar] [CrossRef]
- UN. World Urbanization Prospects: The 2014 Revision-Highlights; UN: New York, NY, USA, 2014. [Google Scholar]
- Fassman, E.A.; Blackbourn, S. Urban runoff mitigation by a permeable pavement system over impermeable soils. J. Hydrol. Eng. 2010, 15, 475–485. [Google Scholar] [CrossRef]
- Grebel, J.E.; Mohanty, S.K.; Torkelson, A.A.; Boehm, A.B.; Higgins, C.P.; Maxwell, R.M.; Nelson, K.L.; Sedlak, D.L. Engineered infiltration systems for urban stormwater reclamation. Environ. Eng. Sci. 2013, 30, 437–454. [Google Scholar] [CrossRef]
- Pauleit, S.; Ennos, R.; Golding, Y. Modeling the environmental impacts of urban land use and land cover change—A study in Merseyside, UK. Landsc. Urban Plan. 2005, 71, 295–310. [Google Scholar] [CrossRef]
- Alizadehtazi, B.; DiGiovanni, K.; Foti, R.; Morin, T.; Shetty, N.H.; Montalto, F.A.; Gurian, P.L. Comparison of observed infiltration rates of different permeable urban surfaces using a cornell sprinkle infiltrometer. J. Hydrol. Eng. 2016, 21, 06016003. [Google Scholar] [CrossRef]
- Graves, A.R.; Morris, J.; Deeks, L.K.; Rickson, R.J.; Kibblewhite, M.G.; Harris, J.A.; Farewell, T.S.; Truckle, I. The total costs of soil degradation in England and Wales. Ecol. Econ. 2015, 119, 399–413. [Google Scholar] [CrossRef]
- Bai, T.; Mayer, A.L.; Shuster, W.D.; Tian, G. The hydrologic role of urban green space in mitigating flooding (Luohe, China). Sustainability 2018, 10, 3584. [Google Scholar] [CrossRef] [Green Version]
- Miller, J.D.; Kim, H.; Kjeldsen, T.R.; Packman, J.; Grebby, S.; Dearden, R. Assessing the impact of urbanization on storm runoff in a peri-urban catchment using historical change in impervious cover. J. Hydrol. 2014, 515, 59–70. [Google Scholar] [CrossRef] [Green Version]
- Yang, J.L.; Zhang, G.L. Water infiltration in urban soils and its effects on the quantity and quality of runoff. J. Soils Sediments 2011, 11, 751–761. [Google Scholar] [CrossRef]
- Liu, C.; Li, Y.; Li, J. Geographic information system-based assessment of mitigating flash-flood disaster from green roof systems. Comput. Environ. Urban Syst. 2017, 64, 321–331. [Google Scholar] [CrossRef]
- Du, S.; Shi, P.; Van Rompaey, A.; Wen, J. Quantifying the impact of impervious surface location on flood peak discharge in urban areas. Nat. Hazards 2015, 76, 1457–1471. [Google Scholar] [CrossRef]
- Wang, D.; Hejazi, M. Quantifying the relative contribution of the climate and direct human impacts on mean annual streamflow in the contiguous United States. Water Resour. Res. 2011, 47, 1–16. [Google Scholar] [CrossRef] [Green Version]
- Zhou, F.; Xu, Y.; Chen, Y.; Xu, C.Y.; Gao, Y.; Du, J. Hydrological response to urbanization at different spatio-temporal scales simulated by coupling of CLUE-S and the SWAT model in the Yangtze River Delta region. J. Hydrol. 2013, 485, 113–125. [Google Scholar] [CrossRef]
- Tomer, M.D.; Schilling, K.E. A simple approach to distinguish land-use and climate-change effects on watershed hydrology. J. Hydrol. 2009, 376, 24–33. [Google Scholar] [CrossRef]
- Wu, P.; Christidis, N.; Stott, P. Anthropogenic impact on Earth’s hydrological cycle. Nat. Clim. Chang. 2013, 3, 807–810. [Google Scholar] [CrossRef]
- Wasko, C.; Sharma, A. Global assessment of flood and storm extremes with increased temperatures. Sci. Rep. 2017, 7, 1–8. [Google Scholar] [CrossRef] [PubMed]
- McCabe, G.J.; Wolock, D.M. A step increase in streamflow in the conterminous United States. Geophys. Res. Lett. 2002, 29, 38-1–38-4. [Google Scholar] [CrossRef]
- Rougé, C.; Cai, X. Crossing-scale hydrological impacts of urbanization and climate variability in the Greater Chicago Area. J. Hydrol. 2014, 517, 13–27. [Google Scholar] [CrossRef] [Green Version]
- La Barbera, P.; Lanza, L.; Parodi, U. A stochastic framework for the modeling of failures in urban drainage systems due to microscale effects. In Modelling of Flood Propagation over Initially Dry Areas; ASCE: Reston, VA, USA, 1994; pp. 197–208. [Google Scholar]
- Aronica, G.T.; Lanza, L.G. Drainage efficiency in urban areas: A case study. Hydrol. Process. Int. J. 2005, 19, 1105–1119. [Google Scholar] [CrossRef]
- Hatt, B.E.; Fletcher, T.D.; Walsh, C.J.; Taylor, S.L. The influence of urban density and drainage infrastructure on the concentrations and loads of pollutants in small streams. Environ. Manag. 2004, 34, 112–124. [Google Scholar] [CrossRef]
- Bauduceau, N.; Berry, P.; Cecchi, C.; Elmqvist, T.; Fernandez, M.; Hartig, T.; Krull, W.; Mayerhofer, E.; Sandra, N.; Noring, L.; et al. Towards an EU Research and Innovation Policy Agenda for Nature-Based Solutions & Re-Naturing Cities: Final Report of the Horizon 2020 Expert Group on ‘Nature-Based Solutions and Re-Naturing Cities’; European Union: Brussels, Belgium, 2015. [Google Scholar]
- Maes, J.; Jacobs, S. Nature-based solutions for Europe’s sustainable development. Conserv. Lett. 2017, 10, 121–124. [Google Scholar] [CrossRef] [Green Version]
- Kumar, P.; Debele, S.E.; Sahani, J.; Aragão, L.; Barisani, F.; Basu, B.; Bucchignani, E.; Charizopoulos, N.; Di Sabatino, S.; Domeneghetti, A.; et al. Towards an operationalisation of nature-based solutions for natural hazards. Sci. Total. Environ. 2020, 731, 138855. [Google Scholar] [CrossRef] [PubMed]
- Shah, M.A.R.; Renaud, F.G.; Anderson, C.C.; Wild, A.; Domeneghetti, A.; Polderman, A.; Votsis, A.; Pulvirenti, B.; Basu, B.; Thomson, C.; et al. A review of hydro-meteorological hazard, vulnerability, and risk assessment frameworks and indicators in the context of nature-based solutions. J. Disaster Risk Reduct. 2020, 50, 101728. [Google Scholar] [CrossRef]
- Ziegler, A.D.; She, L.H.; Tantasarin, C.; Jachowski, N.R.; Wasson, R. Floods, false hope, and the future. Hydrol. Process. 2012, 26, 1748–1750. [Google Scholar] [CrossRef]
- Marchi, L.; Borga, M.; Preciso, E.; Gaume, E. Characterisation of selected extreme flash floods in Europe and implications for flood risk management. J. Hydrol. 2010, 394, 118–133. [Google Scholar] [CrossRef]
- De Moel, H.D.; Van Alphen, J.; Aerts, J.C.J.H. Flood maps in Europe—Methods, availability and use. Nat. Hazards Earth Syst. Sci. 2009, 9, 289–301. [Google Scholar] [CrossRef] [Green Version]
- Bignami, D.F.; Rosso, R.; Sanfilippo, U. Flood Proofing in Urban Areas; Springer: Berlin/Heidelberg, Germany, 2019. [Google Scholar]
- Guerreiro, S.B.; Dawson, R.J.; Kilsby, C.; Lewis, E.; Ford, A. Future heat-waves, droughts and floods in 571 European cities. Environ. Res. Lett. 2018, 13, 034009. [Google Scholar] [CrossRef]
- Burgess-Gamble, L.; Ngai, R.; Wilkinson, M.; Nisbet, T.; Pontee, N.; Harvey, R.; Kipling, K.; Addy, S.; Rose, S.; Maslen, S.; et al. Working with Natural Processes–Evidence Directory; Report No. SC150005; Environmental Agency: Bristol, UK, 2017.
- Jegatheesan, V.; Goonetilleke, A.; Van Leeuwen, J.; Kandasamy, J.; Warner, D.; Myers, B.; Bhuiyan, M.; Spence, K.; Parker, G. (Eds.) Urban Stormwater and Flood Management: Enhancing the Liveability of Cities; Springer: Berlin/Heidelberg, Germany, 2019. [Google Scholar]
- Depietri, Y.; McPhearson, T. Integrating the grey, green, and blue in cities: Nature-based solutions for climate change adaptation and risk reduction. In Nature-Based Solutions to Climate Change Adaptation in Urban Areas; Springer: Cham, Switzerland, 2017; pp. 91–109. [Google Scholar]
- Cohen-Shacham, E.; Walters, G.; Janzen, C.; Maginnis, S. Nature-Based Solutions to Address Global Societal Challenges; IUCN: Gland, Switzerland, 2016; p. 97. [Google Scholar]
- Kabisch, N.; Korn, H.; Stadler, J.; Bonn, A. Nature-based Solutions to Climate Change Adaptation in Urban Areas: Linkages between Science, Policy and Practice; Springer: Cham, Switzerland, 2017. [Google Scholar]
- European Commission (EC). Communication from the Commission to the European Parliament, the Council, the European Economic and Social Committee and the Committee of The Regions Next Steps for a Sustainable European Future—European Action for Sustainability; COM/2016/0739; European Union: Brussels, Belgium, 2016. [Google Scholar]
- UNDRR. Sendai framework for disaster risk reduction 2015–2030. In Proceedings of the 3rd United Nations World Conference on DRR, Sendai, Japan, 18 March 2015; pp. 14–18. [Google Scholar]
- Pecl, G.T.; Araújo, M.B.; Bell, J.D.; Blanchard, J.; Bonebrake, T.C.; Chen, I.C.; Clark, T.D.; Colwell, R.K.; Danielsen, F.; Evengård, B.; et al. Biodiversity redistribution under climate change: Impacts on ecosystems and human well-being. Science 2017, 355, eaai9214. [Google Scholar] [CrossRef]
- Dudley, N.; Stolton, S.; Belokurov, A.; Krueger, L.; Lopoukhine, N.; MacKinnon, K.; Sandwith, T.; Sekhran, N. Natural solutions: Protected areas helping people cope with climate change. In Natural Solutions: Protected Areas Helping People Cope with Climate Change; IUCN/WCPA “Parks for Life” Coordination Office: Ljubljana, Slovenia, 2010. [Google Scholar]
- Arkema, K.K.; Griffin, R.; Maldonado, S.; Silver, J.; Suckale, J.; Guerry, A.D. Linking social, ecological, and physical science to advance natural and nature-based protection for coastal communities. Ann. N. Y. Acad. Sci. 2017, 1399, 5–26. [Google Scholar] [CrossRef]
- Wild, T.C.; Henneberry, J.; Gill, L. Comprehending the multiple ‘values’ of green infrastructure–Valuing nature-based solutions for urban water management from multiple perspectives. Environ. Res. 2017, 158, 179–187. [Google Scholar] [CrossRef] [Green Version]
- Lafortezza, R.; Chen, J.; Van Den Bosch, C.K.; Randrup, T.B. Nature-based solutions for resilient landscapes and cities. Environ. Res. 2018, 165, 431–441. [Google Scholar] [CrossRef]
- Sallustio, L.; Perone, A.; Vizzarri, M.; Corona, P.; Fares, S.; Cocozza, C.; Tognetti, R.; Lasserre, B.; Marchetti, M. The green side of the grey: Assessing greenspaces in built-up areas of Italy. Urban For. Urban Green. 2019, 37, 147–153. [Google Scholar] [CrossRef]
- Thorslund, J.; Jarsjo, J.; Jaramillo, F.; Jawitz, J.W.; Manzoni, S.; Basu, N.B.; Chalov, S.R.; Cohen, M.J.; Creed, I.F.; Goldenberg, R.; et al. Wetlands as large-scale nature-based solutions: Status and challenges for research, engineering and management. Ecol. Eng. 2017, 108, 489–497. [Google Scholar] [CrossRef]
- Frantzeskaki, N.; Borgström, S.; Gorissen, L.; Egermann, M.; Ehnert, F. Nature-based solutions accelerating urban sustainability transitions in cities: Lessons from Dresden, Genk and Stockholm cities. In Nature-Based Solutions to Climate Change Adaptation in Urban Areas; Springer: Cham, Switzerland, 2017; pp. 65–88. [Google Scholar]
- Zölch, T.; Henze, L.; Keilholz, P.; Pauleit, S. Regulating urban surface runoff through nature-based solutions–An assessment at the micro-scale. Environ. Res. 2017, 157, 135–144. [Google Scholar] [CrossRef]
- Kabisch, N.; Strohbach, M.; Haase, D.; Kronenberg, J. Urban green space availability in European cities. Ecol. Indic. 2016, 70, 586–596. [Google Scholar] [CrossRef]
- Raymond, C.M.; Breil, M.; Nita, M.R.; Kabisch, N.; de Bel, M.; Enzi, V.; Frantzeskaki, N.; Geneletti, G.; Lovinger, L.; Cardinaletti, M.; et al. An Impact Evaluation Framework to Support Planning and Evaluation of Nature-Based Solutions Projects. Report Prepared by the EKLIPSE Expert Working Group on Nature-Based Solutions to Promote Climate Resilience in Urban Areas; Centre for Ecology and Hydrology: Wallingford, UK, 2017. [Google Scholar]
- Faivre, N.; Fritz, M.; Freitas, T.; de Boissezon, B.; Vandewoestijne, S. Nature-Based Solutions in the EU: Innovating with nature to address social, economic and environmental challenges. Environ. Res. 2017, 159, 509–518. [Google Scholar] [CrossRef] [PubMed]
- Debele, S.E.; Kumar, P.; Sahani, J.; Marti-Cardona, B.; Mickovski, S.B.; Leo, L.S.; Porcù, F.; Bertini, F.; Montesi, D.; Vojinovic, Z.; et al. Nature-based solutions for hydro-meteorological hazards: Revised concepts, classification schemes and databases. Environ. Res. 2019, 178, 108799. [Google Scholar] [CrossRef]
- Sahani, J.; Kumar, P.; Debele, S.; Spyrou, C.; Loupis, M.; Aragão, L.; Porcù, F.; Shah, M.A.R.; Di Sabatino, S. Hydro-meteorological risk assessment methods and management by nature-based solutions. Sci. Total. Environ. 2019, 696, 133936. [Google Scholar] [CrossRef]
- Santo, M.A.; Gallotti, G.; Basu, B.; Armigliato, A.; Spyrou, C.; Salmivaara, A.; Ruggieri, P.; Pilla, F.; Basu, A.S.; Apostolidou, E.A.; et al. A modelling approach to assess Nature Based Solutions efficiency. In Proceedings of the AGU Fall Meeting 2020, San Francisco, CA, USA, 7–11 December 2020; AGU: Washington, DC, USA, 2020. [Google Scholar]
- Wong, T.H. Water sensitive urban design-the journey thus far. Australas. J. Water Res. 2006, 10, 213–222. [Google Scholar] [CrossRef]
- Haase, D. Urban wetlands and Riparian forests as a nature-based solution for climate change adaptation in cities and their surroundings. In Nature-Based Solutions to Climate Change Adaptation in Urban Areas; Springer: Cham, Switzerland, 2017; pp. 111–121. [Google Scholar]
- Ritchie, A.; Thomas, R. (Eds.) Sustainable Urban Design: An Environmental Approach; Taylor & Francis: Abingdon, UK, 2013. [Google Scholar]
- Snodgrass, E.C.; McIntyre, L. The Green Roof Manual: A Professional Guide to Design, Installation, and Maintenance; Timber Press: Portland, OR, USA, 2010. [Google Scholar]
- Moher, D.; Liberati, A.; Tetzlaff, J.; Altman, D.G. Preferred reporting items for systematic reviews and meta-analyses: The PRISMA statement. Ann. Intern. Med. 2009, 151, 264–269. [Google Scholar] [CrossRef] [Green Version]
- Shamseer, L.; Moher, D.; Clarke, M.; Ghersi, D.; Liberati, A.; Petticrew, M.; Whitlock, E. Preferred reporting items for systematic review and meta-analysis protocols (prisma-p) 2015: Elaboration and explanation. BMJ 2015, 349, 1–25. [Google Scholar] [CrossRef] [Green Version]
- Berndtsson, J.C. Green roof performance towards management of runoff water quantity and quality: A review. Ecol. Eng. 2010, 36, 351–360. [Google Scholar] [CrossRef]
- Köhler, M.; Schmidt, M.; Laar, M. Green roofs as a contribution to reduce urban heat islands. In Proceedings of the World Climate and Energy Event, Rio de Janeiro, Brazil, 1–5 December 2003; pp. 1–5. [Google Scholar]
- Herman, R. Green roofs in Germany: Yesterday, today and tomorrow. In Proceedings of the Conference: The First North American Green Roof Infrastructure Conference, Awards and Trade Show: Greening Rooftops for Sustainable Communities, Chicago, IL, USA, 29–30 May 2003; pp. 41–45. [Google Scholar]
- Forschungsgesellschaft Landschaftsentwicklung Landschaftsbau. Guideline for the Planning, Execution and Upkeep of Green-Roof Sites; Forschungsgesellschaft Landschaftsentwicklung Landschaftsbau: Bonn, Germany, 2002. [Google Scholar]
- Brenneisen, S. Space for urban wildlife: Designing green roofs as habitats in Switzerland. Urban Habitats 2006, 4, 27–36. [Google Scholar]
- Newton, J. Building Greener: Guidance on the Use of Green Roofs, Green Walls and Complementary Features on Buildings; Ciria: London, UK, 2007. [Google Scholar]
- Ngan, G. Green Roof Policies; Landscape Architecture Canada Foundation: Ottawa, ON, Canada, 2004. [Google Scholar]
- European Commission (EC) Directive. Commission Staff Working Document, Guidance on a Strategic Framework for Further Supporting the Deployment of EU Level Green and Blue Infrastructure; SWD/2019/193; European Union: Brussels, Belgium, 2019. [Google Scholar]
- European Commission (EC) Directive. Energy Performance of buildings (recast). Off. J. Eur. Union 2010, 153, 13–35. [Google Scholar]
- Drainage Drenage. Greater Dublin Strategic Drainage Study Final Strategy Report; Dublin Drainage: Dublin, Ireland, 2005. [Google Scholar]
- Torney, D. Public Consultation on Dublin City Council Draft Climate Change Action Plan; Dublin City University: Dublin, Ireland, 2019. [Google Scholar]
- Carson, T.B.; Marasco, D.E.; Culligan, P.J.; McGillis, W.R. Hydrological performance of extensive green roofs in New York City: Observations and multi-year modeling of three full-scale systems. Environ. Res. Lett. 2013, 8, 024036. [Google Scholar] [CrossRef]
- Carbone, M.; Garofalo, G.; Nigro, G.; Piro, P. Green roofs in the Mediterranean area: Interaction between native plant species and sub-surface runoff. In Applied Mechanics and Materials; Trans Tech Publications Ltd: Bach, Switzerland, 2015; Volume 737, pp. 749–753. [Google Scholar]
- Yang, W.Y.; Li, D.; Sun, T.; Ni, G.H. Saturation-excess and infiltration-excess runoff on green roofs. Ecol. Eng. 2015, 74, 327–336. [Google Scholar] [CrossRef]
- Soulis, K.X.; Ntoulas, N.; Nektarios, P.A.; Kargas, G. Runoff reduction from extensive green roofs having different substrate depth and plant cover. Ecol. Eng. 2017, 102, 80–89. [Google Scholar] [CrossRef]
- Speak, A.F.; Rothwell, J.J.; Lindley, S.J.; Smith, C.L. Rainwater runoff retention on an aged intensive green roof. Sci. Total. Environ. 2013, 461, 28–38. [Google Scholar] [CrossRef] [PubMed]
- Mentens, J.; Raes, D.; Hermy, M. Green roofs as a tool for solving the rainwater runoff problem in the urbanized 21st century? Landsc. Urban Plan. 2006, 77, 217–226. [Google Scholar] [CrossRef]
- Stovin, V.; Vesuviano, G.; Kasmin, H. The hydrological performance of a green roof test bed under UK climatic conditions. J. Hydrol. 2012, 414, 148–161. [Google Scholar] [CrossRef]
- Dunnett, N.; Kingsbury, N. Planting Green Roofs and Living Walls; Timber Press: Portland, OR, USA, 2008. [Google Scholar]
- Liu, W.; Feng, Q.; Chen, W.; Wei, W.; Deo, R.C. The influence of structural factors on stormwater runoff retention of extensive green roofs: New evidence from scale-based models and real experiments. J. Hydrol. 2019, 569, 230–238. [Google Scholar] [CrossRef]
- Schroll, E.; Lambrinos, J.; Righetti, T.; Sandrock, D. The role of vegetation in regulating stormwater runoff from green roofs in a winter rainfall climate. Ecol. Eng. 2011, 37, 595–600. [Google Scholar] [CrossRef]
- Jim, C.Y.; Tsang, S.W. Ecological energetics of tropical intensive green roof. Energy Build. 2011, 43, 2696–2704. [Google Scholar] [CrossRef]
- Bengtsson, L.; Grahn, L.; Olsson, J. Hydrological function of a thin extensive green roof in southern Sweden. Hydrol. Res. 2005, 36, 259–268. [Google Scholar] [CrossRef]
- Carter, T.; Jackson, C.R. Vegetated roofs for stormwater management at multiple spatial scales. Landsc. Urban Plan. 2007, 80, 84–94. [Google Scholar] [CrossRef]
- Hilten, R.N.; Lawrence, T.M.; Tollner, E.W. Modeling stormwater runoff from green roofs with HYDRUS-1D. J. Hydrol. 2008, 358, 288–293. [Google Scholar] [CrossRef]
- Berghage, R.D.; Beattie, D.; Jarrett, A.R.; Thuring, C.; Razaei, F.; O’Connor, T.P. Green Roofs for Stormwater Runoff Control. 2009. Available online: https://cfpub.epa.gov/si/si_public_record_report.cfm?dirEntryId=205444&Lab=NRMRL (accessed on 24 November 2021).
- Feitosa, R.C.; Wilkinson, S. Modelling green roof stormwater response for different soil depths. Landsc. Urban Plan. 2016, 153, 170–179. [Google Scholar] [CrossRef]
- Carpenter, D.D.; Kaluvakolanu, P. Effect of roof surface type on storm-water runoff from full-scale roofs in a temperate climate. J. Irrig. Drain. Eng. 2011, 137, 161–169. [Google Scholar] [CrossRef]
- Carter, T.L.; Rasmussen, T.C. Hydrologic behavior of vegetated roofs 1. JAWRA Assoc. 2006, 42, 1261–1274. [Google Scholar] [CrossRef]
- Li, Y.; Babcock, R.W., Jr. Green roof hydrologic performance and modeling: A review. Water Sci. Technol. 2014, 69, 727–738. [Google Scholar] [CrossRef]
- Dunnett, N. Green roofs for biodiversity: Reconciling aesthetics with ecology. In Proceedings of the 4th Annual Greening Rooftops for Sustainable Communities, Boston, MA, USA, 11–12 May 2006; pp. 11–12. [Google Scholar]
- Williams, N.S.; Lundholm, J.; Scott MacIvor, J. Do green roofs help urban biodiversity conservation? J. Appl. Ecol. 2014, 51, 1643–1649. [Google Scholar] [CrossRef] [Green Version]
- Zinzi, M.; Agnoli, S. Cool and green roofs. An energy and comfort comparison between passive cooling and mitigation urban heat island techniques for residential buildings in the Mediterranean region. Energy Build. 2012, 55, 66–76. [Google Scholar] [CrossRef]
- Alexandri, E.; Jones, P. Temperature decreases in an urban canyon due to green walls and green roofs in diverse climates. Build. Environ. 2008, 43, 480–493. [Google Scholar] [CrossRef]
- Jaffal, I.; Ouldboukhitine, S.E.; Belarbi, R. A comprehensive study of the impact of green roofs on building energy performance. Renew. Energy 2012, 43, 157–164. [Google Scholar] [CrossRef]
- Lee, K.E.; Williams, K.J.; Sargent, L.D.; Williams, N.S.; Johnson, K.A. 40-second green roof views sustain attention: The role of micro-breaks in attention restoration. J. Environ. Psychol. 2015, 42, 182–189. [Google Scholar] [CrossRef]
- White, E.V.; Gatersleben, B. Greenery on residential buildings: Does it affect preferences and perceptions of beauty? J. Environ. Psychol. 2011, 31, 89–98. [Google Scholar] [CrossRef] [Green Version]
- Yang, J.; Yu, Q.; Gong, P. Quantifying air pollution removal by green roofs in Chicago. Atmos. Environ. 2008, 42, 7266–7273. [Google Scholar] [CrossRef]
- Currie, B.A.; Bass, B. Estimates of air pollution mitigation with green plants and green roofs using the UFORE model. Urban Ecosyst. 2008, 11, 409–422. [Google Scholar] [CrossRef]
- Rowe, D.B. Green roofs as a means of pollution abatement. Environ. Pollut. 2011, 159, 2100–2110. [Google Scholar] [CrossRef] [Green Version]
- Graceson, A.; Hare, M.; Monaghan, J.; Hall, N. The water retention capabilities of growing media for green roofs. Ecol. Eng. 2013, 61, 328–334. [Google Scholar] [CrossRef]
- Kemp, S.; Hadley, P.; Blanuša, T. The influence of plant type on green roof rainfall retention. Urban Ecosyst. 2019, 22, 355–366. [Google Scholar] [CrossRef] [Green Version]
- Baudoin, W.; Desjardins, Y.; Dorais, M.; Charrondière, U.R.; Herzigova, L.; El-Behairy, U.; Metwaly, N.; Marulanda, C.; Ba, N. Rooftop Gardening for Improved Food and Nutrition Security in the Urban Environment. In Rooftop Urban Agriculture; Springer: Cham, Switzerland, 2017; pp. 219–233. [Google Scholar]
- Jungels, J.; Rakow, D.A.; Allred, S.B.; Skelly, S.M. Attitudes and aesthetic reactions toward green roofs in the Northeastern United States. Landsc. Urban Plan. 2013, 117, 13–21. [Google Scholar] [CrossRef]
- Whittinghill, L.J.; Rowe, D.B.; Cregg, B.M. Evaluation of vegetable production on extensive green roofs. Agroecol. Sustain. Food Syst. 2013, 37, 465–484. [Google Scholar] [CrossRef]
- Organisation, G.R. The Gro Green Roof Code: Green Roof Code of Best Practice for the UK 2011; Groundwork: Sheffield, UK, 2011. [Google Scholar]
- Kosareo, L.; Ries, R. Comparative environmental life cycle assessment of green roofs. Build. Environ. 2007, 42, 2606–2613. [Google Scholar] [CrossRef]
- Razzaghmanesh, M.; Beecham, S. The hydrological behaviour of extensive and intensive green roofs in a dry climate. Sci. Total. Environ. 2014, 499, 284–296. [Google Scholar] [CrossRef]
- Lee, J.Y.; Lee, M.J.; Han, M. A pilot study to evaluate runoff quantity from green roofs. J. Environ. Manag. 2015, 152, 171–176. [Google Scholar] [CrossRef]
- Schultz, I.; Sailor, D.J.; Starry, O. Effects of substrate depth and precipitation characteristics on stormwater retention by two green roofs in Portland OR. J. Hydrol. 2018, 18, 110–118. [Google Scholar] [CrossRef]
- Loiola, C.; Mary, W.; da Silva, L.P. Hydrological performance of modular-tray green roof systems for increasing the resilience of mega-cities to climate change. J. Hydrol. 2019, 573, 1057–1066. [Google Scholar] [CrossRef]
- Stovin, V. The potential of green roofs to manage urban stormwater. Water Environ. J. 2010, 24, 192–199. [Google Scholar] [CrossRef]
- Brandão, C.; do Rosário Cameira, M.; Valente, F.; de Carvalho, R.C.; Paço, T.A. Wet season hydrological performance of green roofs using native species under Mediterranean climate. Ecol. Eng. 2017, 102, 596–611. [Google Scholar] [CrossRef]
- Longobardi, A.; D’Ambrosio, R.; Mobilia, M. Predicting Stormwater Retention Capacity of Green Roofs: An Experimental Study of the Roles of Climate, Substrate Soil Moisture, and Drainage Layer Properties. Sustainability 2019, 11, 6956. [Google Scholar] [CrossRef] [Green Version]
- Burszta-Adamiak, E.; Mrowiec, M. Modelling of green roofs’ hydrologic performance using EPA’s SWMM. Water Sci. Technol. 2013, 68, 36–42. [Google Scholar] [CrossRef] [PubMed]
- Oviedo, N.; Torres, A. Hydrologie Attenuation and the Hydrologie Benefits of Implementing Eco-Productive Green Roofs in Marginal Urban Areas. Ing. Univ. 2014, 18, 291–308. [Google Scholar]
- Shin, E.; Kim, H. Analysing Green Roof Effects in an Urban Environment: A Case of Bangbae-dong, Seoul. J. Asian Archit. Building Eng. 2015, 14, 315–322. [Google Scholar] [CrossRef] [Green Version]
- Masseroni, D.; Cislaghi, A. Green roof benefits for reducing flood risk at the catchment scale. Environ. Earth Sci. 2016, 75, 579. [Google Scholar] [CrossRef]
- Giacomoni, M.H.; Joseph, J. Multi-objective evolutionary optimization and Monte Carlo simulation for placement of low impact development in the catchment scale. J. Water Res. Plan. Manag. 2017, 143, 04017053. [Google Scholar] [CrossRef]
- Stovin, V.; Poë, S.; Berretta, C. A modelling study of long term green roof retention performance. J. Environ. Manag. 2013, 131, 206–215. [Google Scholar] [CrossRef] [Green Version]
- Hakimdavar, R.; Culligan, P.J.; Finazzi, M.; Barontini, S.; Ranzi, R. Scale dynamics of extensive green roofs: Quantifying the effect of drainage area and rainfall characteristics on observed and modeled green roof hydrologic performance. Ecol. Eng. 2014, 73, 494–508. [Google Scholar] [CrossRef]
- Palermo, S.A.; Turco, M.; Principato, F.; Piro, P. Hydrological effectiveness of an extensive green roof in Mediterranean climate. Water 2019, 11, 1378. [Google Scholar] [CrossRef] [Green Version]
- Liu, C.; Li, Y. Measuring eco-roof mitigation on flash floods via GIS simulation. Built Environ. Proj. Asset. Manag. 2016, 6, 415–427. [Google Scholar] [CrossRef]
- Roehr, D.; Kong, Y. Runoff reduction effects of green roofs in Vancouver, BC, Kelowna, BC, and Shanghai, PR China. Can. Water Resour. J. 2010, 35, 53–68. [Google Scholar] [CrossRef] [Green Version]
- Schmitter, P.; Goedbloed, A.; Galelli, S.; Babovic, V. Effect of catchment-scale green roof deployment on stormwater generation and reuse in a tropical city. J. Water Res. Plan. Manag. 2016, 142, 05016002. [Google Scholar] [CrossRef]
- Gao, J.; Wang, R.; Huang, J.; Liu, M. Application of BMP to urban runoff control using SUSTAIN model: Case study in an industrial area. Ecol. Model. 2015, 318, 177–183. [Google Scholar] [CrossRef]
- Metselaar, K. Water retention and evapotranspiration of green roofs and possible natural vegetation types. Resour. Conserv. Recycl. 2012, 64, 49–55. [Google Scholar] [CrossRef]
- Palla, A.; Sansalone, J.J.; Gnecco, I.; Lanza, L.G. Storm water infiltration in a monitored green roof for hydrologic restoration. Water Sci. Technol. 2011, 64, 766–773. [Google Scholar] [CrossRef]
- Allen, R.G.; Pereira, L.S.; Raes, D.; Smith, M. Crop evapotranspiration-Guidelines for computing crop water requirements-FAO Irrigation and drainage paper 56. FAO: Rome, Italy, 1998. [Google Scholar]
- Pilla, F.; Gharbia, S.S.; Lyons, R. How do households perceive flood-risk? The impact of flooding on the cost of accommodation in Dublin, Ireland. Sci. Total. Environ. 2019, 650, 144–154. [Google Scholar] [CrossRef] [PubMed]
- Basu, B.; Sarkar, A.; Pilla, F. Identification of optimal number of rain gauges and their locations based on different statistical approaches: A case study in Dublin based on hourly and daily rainfall data. Geophys. Res. Abstr. 2019, 21, 1. [Google Scholar]
- Sarkar Basu, A.; Basu, B.; Sannigrahi, S.; Pilla, F. Deployment of Green roof top as a Nature Based Solution in Dublin, Ireland. In Proceedings of the 22nd EGU General Assembly, Vienna, Austria, 4–8 May 2020; p. 12215. [Google Scholar]
- Éireann, M. Climate of Ireland. Met Eireann. 2009. Available online: https://www.met.ie/ (accessed on 21 November 2021).
- Brouwer, C.; Goffeau, A.; Heibloem, M. Irrigation Water Management: Training Manual No. 1—Introduction to Irrigation; Food and Agriculture Organization of the United Nations: Rome, Italy, 1985; pp. 102–103. [Google Scholar]
- Te Chow, V. Applied Hydrology; Tata McGraw-Hill Education: New York, NY, USA, 2010. [Google Scholar]
- Pineda-Martos, R.; Calheiros, C.S. Nature-Based Solutions in Cities—Contribution of the Portuguese National Association of Green Roofs to Urban Circularity. Circ. Econ. Sustain. 2021, 1, 1–17. [Google Scholar] [CrossRef]
- Calheiros, C.S.C.; Castiglione, B.; Palha, P. Nature-based solutions for socially and environmentally responsible new cities: The contribution of green roofs. In Circular Economy and Sustainability; Elsevier: Amsterdam, The Netherlands, 2022; pp. 235–255. [Google Scholar]
- Getter, K.L.; Rowe, D.B.; Andresen, J.A. Quantifying the effect of slope on extensive green roof stormwater retention. Ecol. Eng. 2007, 31, 225–231. [Google Scholar] [CrossRef]
- Van Seters, T.; Rocha, L.; Smith, D.; MacMillan, G. Evaluation of green roofs for runoff retention, runoff quality, and leachability. Water Qual. Res. J. 2009, 44, 33–47. [Google Scholar] [CrossRef]
- Fioretti, R.; Palla, A.; Lanza, L.G.; Principi, P. Green roof energy and water related performance in the Mediterranean climate. Build. Environ. 2010, 45, 1890–1904. [Google Scholar] [CrossRef]
- Morgan, S.; Celik, S.; Retzlaff, W. Green roof storm-water runoff quantity and quality. J. Environ. Eng. 2013, 139, 471–478. [Google Scholar] [CrossRef]
- Fassman-Beck, E.; Voyde, E.; Simcock, R.; Hong, Y.S. 4 Living roofs in 3 locations: Does configuration affect runoff mitigation? J. Hydrol. 2013, 490, 11–20. [Google Scholar] [CrossRef]
- Wong, G.K.; Jim, C.Y. Quantitative hydrologic performance of extensive green roof under humid-tropical rainfall regime. Ecol. Eng. 2014, 70, 366–378. [Google Scholar] [CrossRef]
- Nawaz, R.; McDonald, A.; Postoyko, S. Hydrological performance of a full-scale extensive green roof located in a temperate climate. Ecol. Eng. 2015, 82, 66–80. [Google Scholar] [CrossRef]
- Sobczyk, M.; Mrowiec, M. Retention capacity of extensive green roofs. J. Water Land Dev. 2016, 30, 113–117. [Google Scholar] [CrossRef]
- Shafique, M.; Lee, D.; Kim, R. A field study to evaluate runoff quantity from blue roof and green blue roof in an urban area. Int. J. Control. Autom. 2016, 9, 59–68. [Google Scholar] [CrossRef]
- Li, X.; Cao, J.; Xu, P.; Fei, L.; Dong, Q.; Wang, Z. Green roofs: Effects of plant species used on runoff. Land Degrad. Dev. 2018, 29, 3628–3638. [Google Scholar] [CrossRef]
- Shafique, M.; Kim, R.; Kyung-Ho, K. Green roof for stormwater management in a highly urbanized area: The case of Seoul, Korea. Sustainability 2018, 10, 584. [Google Scholar] [CrossRef] [Green Version]
- Castro, A.S.; Goldenfum, J.A.; da Silveira, A.L.; DallAgnol, A.L.B.; Loebens, L.; Demarco, C.F.; Leandro, D.; Nadaleti, W.C.; Quadro, M.S. The analysis of green roof’s runoff volumes and its water quality in an experimental study in Porto Alegre, Southern Brazil. Environ. Sci. Pollut. Res. 2020, 27, 1–15. [Google Scholar] [CrossRef]


| Precipitation | >50 mm | >40 mm | >30 mm | >20 mm | >10 mm | ||
|---|---|---|---|---|---|---|---|
| Number of Days | Crop Coefficient | 6 | 18 | 44 | 120 | 539 | |
| Shallow soil (80 mm) | Grass/Sedum | 1.0 | 12.10 | 18.23 | 23.94 | 32.77 | 55.09 |
| Strawberries | 0.75 | 11.01 | 16.38 | 21.87 | 29.97 | 51.40 | |
| Cotton | 0.5 | 9.80 | 14.69 | 19.96 | 27.12 | 47.61 | |
| Mint | 1.1 | 12.53 | 18.96 | 24.80 | 33.92 | 56.57 | |
| Medium soil (150 mm) | Grass/Sedum | 1.0 | 24.31 | 38.50 | 47.38 | 60.48 | 77.21 |
| Strawberries | 0.75 | 22.68 | 36.37 | 44.69 | 57.41 | 74.57 | |
| Cotton | 0.5 | 20.64 | 34.03 | 42.27 | 54.51 | 71.87 | |
| Mint | 1.1 | 24.91 | 39.33 | 48.60 | 61.75 | 78.21 | |
Publisher’s Note: MDPI stays neutral with regard to jurisdictional claims in published maps and institutional affiliations. |
© 2021 by the authors. Licensee MDPI, Basel, Switzerland. This article is an open access article distributed under the terms and conditions of the Creative Commons Attribution (CC BY) license (https://creativecommons.org/licenses/by/4.0/).
Share and Cite
Basu, A.S.; Pilla, F.; Sannigrahi, S.; Gengembre, R.; Guilland, A.; Basu, B. Theoretical Framework to Assess Green Roof Performance in Mitigating Urban Flooding as a Potential Nature-Based Solution. Sustainability 2021, 13, 13231. https://doi.org/10.3390/su132313231
Basu AS, Pilla F, Sannigrahi S, Gengembre R, Guilland A, Basu B. Theoretical Framework to Assess Green Roof Performance in Mitigating Urban Flooding as a Potential Nature-Based Solution. Sustainability. 2021; 13(23):13231. https://doi.org/10.3390/su132313231
Chicago/Turabian StyleBasu, Arunima Sarkar, Francesco Pilla, Srikanta Sannigrahi, Rémi Gengembre, Antoine Guilland, and Bidroha Basu. 2021. "Theoretical Framework to Assess Green Roof Performance in Mitigating Urban Flooding as a Potential Nature-Based Solution" Sustainability 13, no. 23: 13231. https://doi.org/10.3390/su132313231
APA StyleBasu, A. S., Pilla, F., Sannigrahi, S., Gengembre, R., Guilland, A., & Basu, B. (2021). Theoretical Framework to Assess Green Roof Performance in Mitigating Urban Flooding as a Potential Nature-Based Solution. Sustainability, 13(23), 13231. https://doi.org/10.3390/su132313231