
Water and the Circular Economy: Learning from Nature

1
Kakovitch Global Business, Chantilly, VA 20151, USA
2
College of Agriculture, Urban Sustainability and Environmental Sciences (CAUSES), University of the District of Columbia, Washington, DC 20008, USA
*
Author to whom correspondence should be addressed.
Sustainability 2021, 13(22), 12597; https://doi.org/10.3390/su132212597
Submission received: 29 August 2021
/
Revised: 8 November 2021
/
Accepted: 10 November 2021
/
Published: 15 November 2021
(This article belongs to the Special Issue Urban Sustainability: Re-envisioning Cities to Lead the Way toward A Circular Economy)
Abstract
:This paper examines the hydrological cycle and its implications for the production capacity of two countries, China and the United States. While it takes a macro-level view, it illustrates the relevance of understanding the circularity of nature as exemplified by the hydrological cycle, for urban and regional circular economy considerations. Taking the circularity of nature as a starting point is a departure from common circular economy conceptions, which take an anthropocentric perspective rather than a nature based one. We calculate the amount of solar energy available for freshwater evaporation and the allocation of freshwater to its key uses in the domestic, industrial, and agricultural sectors. Our calculations indicate that the capacity to generate economic output can be accurately described by the embodied solar energy distribution that determines the availability of freshwater for allocation to different uses. This illustrates the need to take environmental/physical conditions more fully into account in economic development decisions at every level, from local to regional, national, and global. We begin our analysis with a review of circular economy concepts and argue that they reveal a limited understanding of the circularity of nature evident in energy and material cycles and their economic capacity implications. Achieving further expansions of economic capacity may increasingly depend on an improved understanding of nature’s circularity, especially when competing resource pressures and land-use constraint exacerbate economic capacity limits. Our findings suggest three particularly important lessons for decision makers: first, the efficiency increases needed to realize growing economic output will require circular economy models that consider the efficient processing capacity of nature rather than relying solely on technological solutions; second, the non-use of resources may be as valuable or more than their use; and third, price policies can be effective in steering resource use and non-use in the right direction.
1. Introduction
Circular economy concepts have received growing attention in recent years as the negative implications of a linear model that seeks to transform resource inputs into outputs of useful goods and services have become increasingly apparent. The common linear concept of the economic process leaves the emission and waste by-products of economic activity largely unconsidered, despite the fact that some resource use generates economic ‘bads’ instead of useful ‘goods’. Furthermore, some goods are wasted rather than consumed.
Some circular economy concepts seek to minimize useless emissions and waste by reappropriating them as potential resources and by optimizing the production, distribution, and consumption of goods and services to avoid emission and waste by-products in the first place. Both notions embrace the idea of circularity by design rather than as an afterthought and acknowledge the negative implications of a linear economic model. This redesign thinking has implications for decision makers who may seek to redirect resources and initiate alternate production processes to advance circular economy solutions at the local, regional, and national level.
Yet while reducing emissions and waste in circular process designs may be one logical focus of a circular economy concept, understanding the circularity of nature may be another. Every economic process takes place in a context system we commonly refer to as the environment. As a subsystem of the environment, the economy cannot escape the rules and behaviors of the system that forms its context without impacting the context itself. In fact, we observe the impact of economic activity in the growing deterioration of physical, biological, ecological, and social systems. These context systems function according to different timeframes compared to our economic system and use different success measures to indicate their health and vitality. Dominant measures of economic success focus on output and consumption levels measured in monetary units and the number of jobs created, without much concern for their wage level or benefits. The measures of physical environmental context systems may be the volume of water permeable surfaces can absorb, the oxygen levels tree canopies can release, or the parts-per-million of nitrates plants can absorb to reduce eutrophication; social context systems measures may include life expectancy, health outcomes, educational attainment, and a range of quality-of-life measures that capture the well-being of a population or its sub-cohorts of elderly versus young people. Context systems are complex and extremely varied.
This paper focuses on the hydrological cycle to illustrate the relevance of environmental context systems for economic activity. Environmental systems are commonly characterized by circularity. They may therefore offer valuable design lessons for circular economy models. While we focus on the hydrological cycle, similar information regarding the workings and critical parameters of other cycles of nature may also be valuable.
Our reason for focusing on the hydrological cycle and the freshwater flow it sustains is that water drives the economic success of a wide range of sectors, exemplified by the food-water-energy nexus [1,2]. Water, like energy, is almost ubiquitous. Agriculture appropriates large amounts of fresh water; households depend on it for drinking, cleaning, and other hygiene related activities; industry uses water as coolant, production input, and even as an end product. Water therefore exceeds the sector specific focus of many circular economy models that re-envision economic activity as circular one sector at a time [3,4,5]. Water is also closely linked to energy because the availability of fresh water ultimately depends on evaporation and water treatment, processes which require energy [6]. The importance of water is evident in the Sustainable Development Goals (SDGs) of the United Nations, where water has its own goal number 6: Clean Water and Sanitation. In addition, water is closely linked to SDG number 2 ‘Zero Hunger’, number 3 ‘Good Health & Well Being’, numbers 13 and 14 ‘Life below Water’ and ‘Life on Land’, and as conflicts around water have shown, to goal number 16 ‘Peace, Justice & Strong Institutions’ [7]. These connections illustrate that water plays an essential role not only in terms of its economic contributions but also in terms of its value to life on planet earth itself.
In developing our approach, we ask the question whether and how the hydrological cycle impacts economic capacity and what can be learned from examining these impacts. To test our model, we take a macro-level approach and ask whether and how the energy appropriated in freshwater and its allocation to household, industrial, and agricultural uses determine the level of economic activity measured in Gross Domestic Product (GDP). In other words, we seek to describe the entire economic process as circular and introduce an empirical approach that views the economic process as determined by the circular processes of nature as illustrated by the hydrological cycle of our planet. This planetary hydrological cycle forms the physical circular context system within which all economic activity takes place. We test our model by determining the impact of the hydrological cycle on the output production of two countries with different economic characteristics, namely China and the United States. The two countries also constitute the two largest global economies.
Our modeling results suggest that the economic output of final goods and services produced, as measured by GDP, can indeed be predicted by the hydrological cycle, which determines the freshwater available for allocation to household, industrial, and agricultural uses. Our model builds on the previous work of ecological economists who viewed energy as the very basis of all economic activity and argued that available energy is the driver of the conversion of material inputs into outputs of useful goods and services [8,9,10,11]. Because our analysis shows the critical relationship between economic output potential and the allocation of freshwater to key productive and consumptive uses, we argue that regional economies too will benefits from becoming more knowledgeable in terms of the physical/environmental cycles that form their context. This approach differs from circular design approaches that rely chiefly on definitions of circularity that are based on human systems rather than the circularity of nature. Our approach also illustrates the problem of scale associated with nested economic and environmental systems and their differing time frames and success measures [12].
We begin our analysis with a review of prevalent circular economy concepts before we introduce our own model, which is followed by a discussion of modeling results and lessons learned for future circular economy considerations. We conclude that circular economy models that take their cue from nature provide valuable insights for assessing the pressures and limitations posed by environmental context conditions on local and regional economies.
2. Physical and Economic Circularity
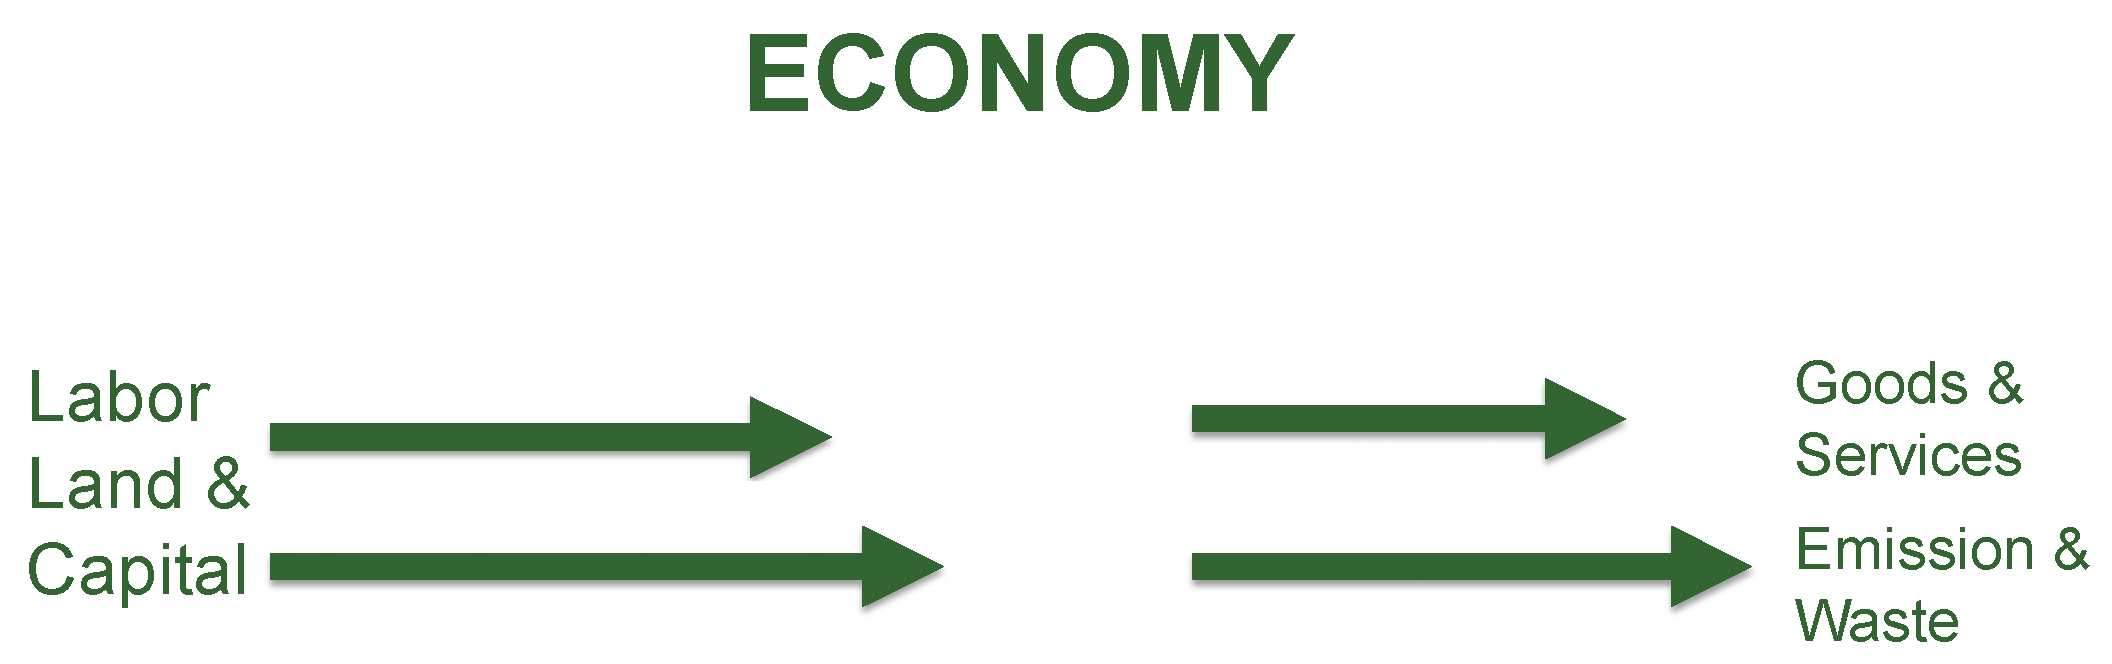
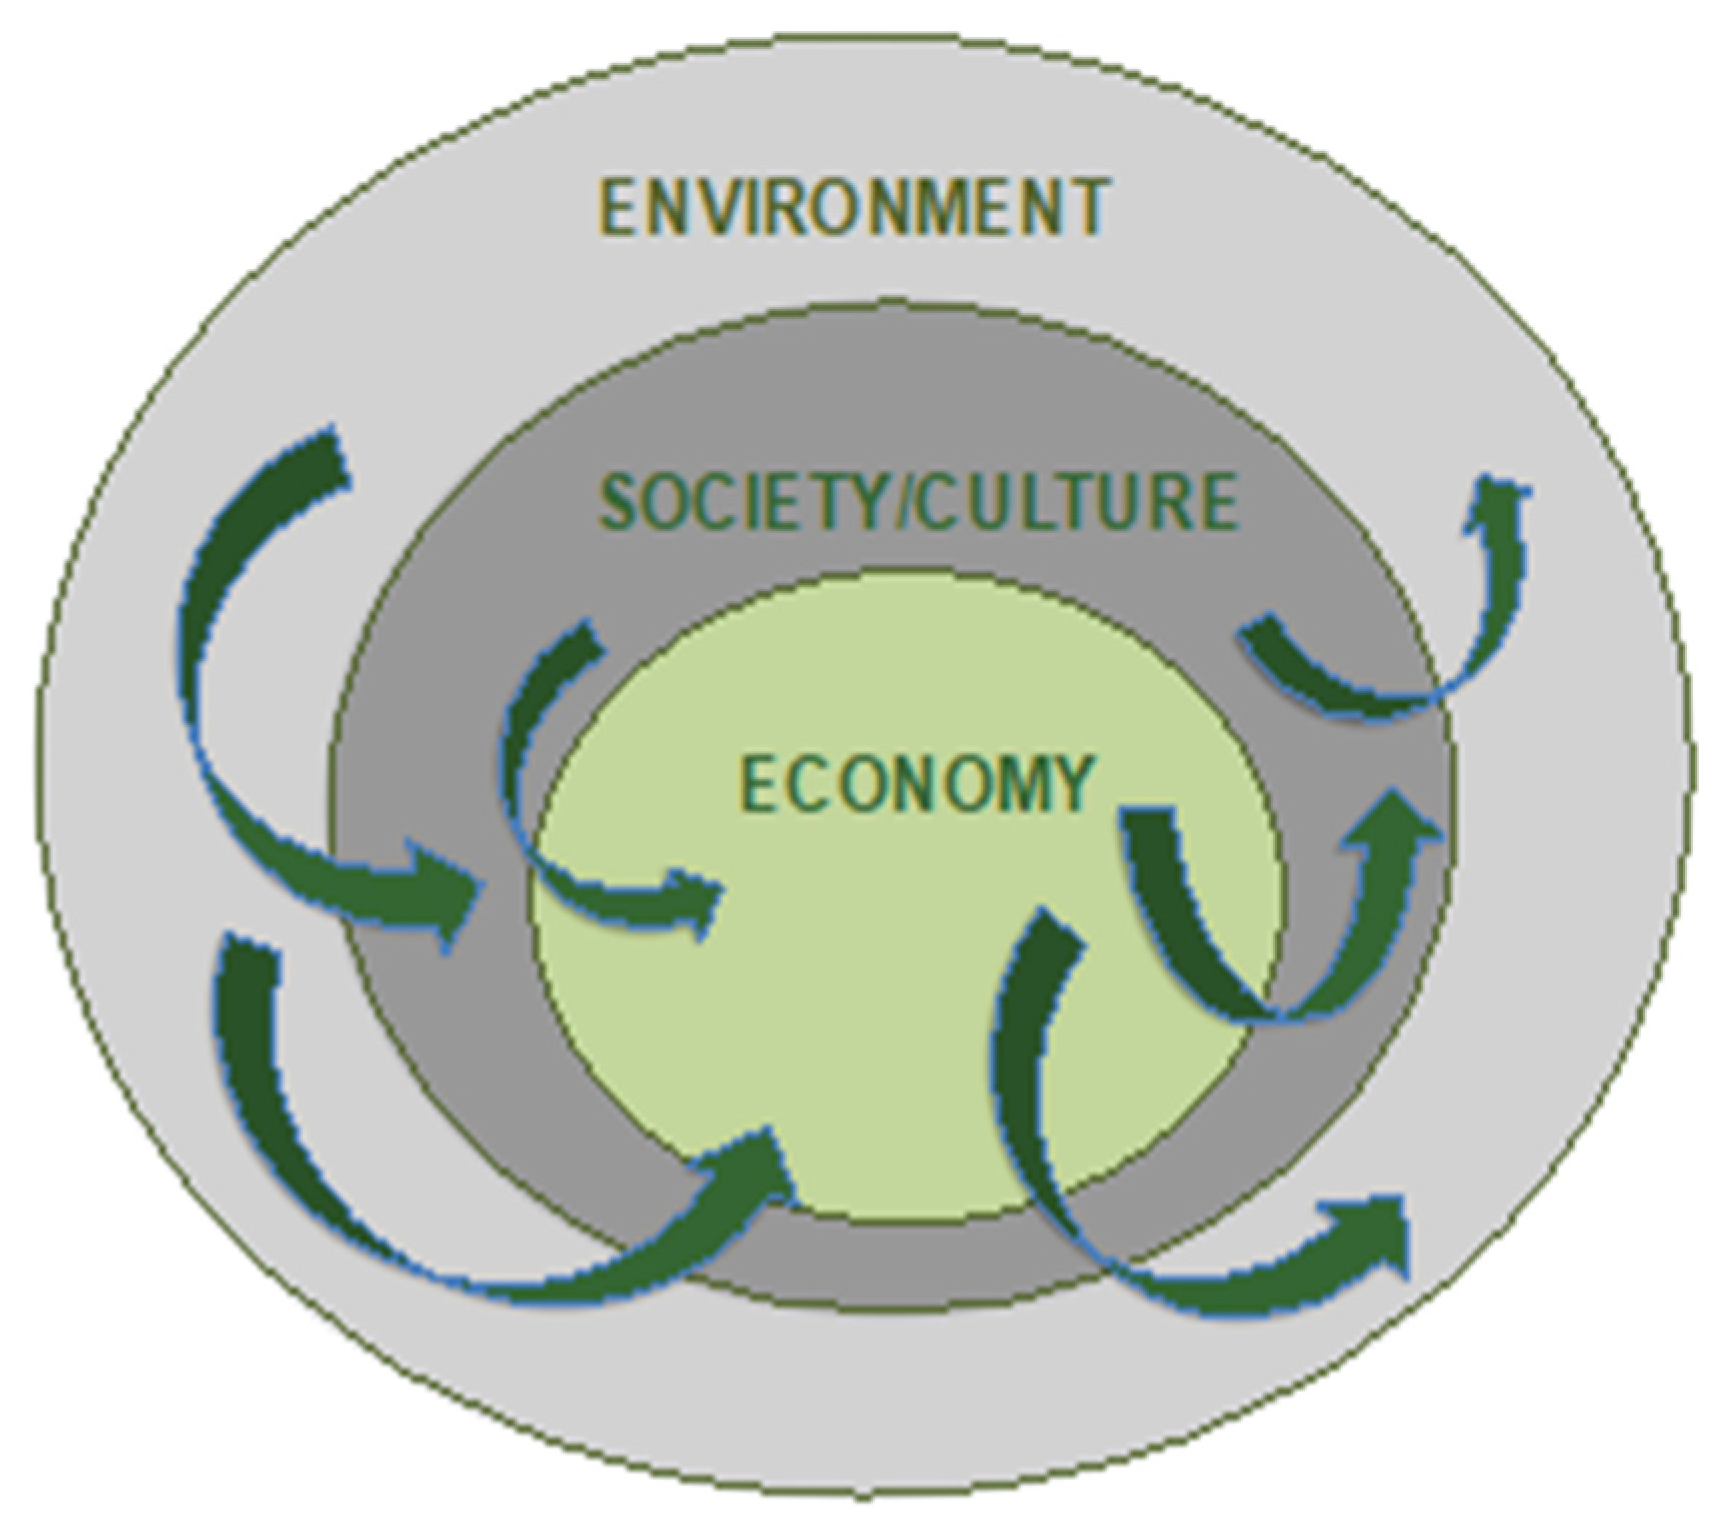
Circular economy concepts are a fundamental departure from the linear resource transformation concept of standard economics. Standard economics views the economic process as a transformation of inputs into outputs of useful goods and services accompanied by an unfortunate by-product of emission and waste. The value of the ‘goods’ produced is positive and not directly influenced by the emission and waste by-product ‘bads’ that invariably accompany the output generation process. Only when the ‘bads’ are explicitly captured in the valuation process as internalized externalities, for example, do they enter the economic valuation framework [13]. This is not an automatic process, and the costs of the negative externalities are not automatically assigned to the economic activities that generate them. They are instead displaced across space and time. This implies that those who benefits from the economic ‘goods’ that generate economic ‘bads’ as by-products do not bear their costs. Their costs are instead born by those unfortunate enough to be exposed to them. Cities are concentrated microcosms of these pitfalls of a linear economy model. Globally, cities consume 75 percent of all natural resources, produce 50 percent of global waste, and generate 75 percent of global greenhouse gases [14]. Figure 1 and Figure 2 illustrate the differing world views of a linear conversion-based versus a circular context-based view of the economy.
Circular economy concepts seek to minimize the co-creation of economic ‘bads’ and, where possible, recapture them as production inputs and co-products. Avoiding emissions and waste by reducing production and consumption activities in the first place instead of reusing and recycling them can also make positive contributions overall. Reconceptualizing the economic process as circular thus implies a systems-approach whereby negative emission and waste by-products are reduced or reallocated by design at the front end of the process rather than as an afterthought. This view builds the value associated with emission and waste reduction and recovery into the economic valuation framework at the outset rather than internalizing it after the fact [15].
Despite general agreement regarding the principles of a circular economy, its definitions have not evolved into one consistent concept [16,17]. In their extensive review of circular economy models, Prieto-Sandoval et al. identified four basic circular economy concepts [18], which can be summarized as follows:
- Resource based circularity: this concept is the most common and seeks to minimize resource use by recirculating resources and energy and recovering waste.
- Technological circularity: this concept views circularity as being closely linked to innovation and relates to fields such as industrial ecology.
- Scale based circularity: this concept argues that circular economy models must consider multiple scales, from local to multi-national and global.
- Ecosystems based circularity: this concept recognizes the need to learn from ecosystems and ideally seeks to strengthen ecosystem services.
These different concepts of circularity are mirrored in the Circular Economy monitoring framework of the European Union, which seeks to measure progress toward the implementation of circular economy models. The framework focuses on linking production, consumption, and waste management; the use of secondary raw materials; and the use of innovation to advance circular economy approaches [19]. In addition, the European Union Circular Economy Action Plan identifies priority sectors suited to advancing the implementation of the concept, including plastics, food waste, critical raw materials, construction and demolition, and biomass and bio-based products [20]. The plan also identifies twenty-four indicators and sub-indicators to advance progress toward the implementation of the different circular economy concepts.
Surprisingly little attention is given to the ecosystem based circular economy concept. Ecosystem based models focus largely on the demand for ecosystem services and on the services delivered as defined by human needs rather than ecosystem processes or processing capacities [21]. Rarely is a strong sustainability position invoked that acknowledges that the substitutability of natural capital through human-made capital may be limited [22,23]. Ecosystem related circular economy measures also tend to focus on human defined impacts. For example, ecosystem services to mitigate heat island effects in cities are primarily examined on the basis of their effectiveness to reduce the negative impacts of increased heat on humans rather than their effectiveness to maintain native species and the biodiverse ecosystems they support.
Two of the four circular economy concepts identified by Prieto-Sandoval et al. appear to be dominant in urban and regional circular economy initiatives. Most commonly, the focus has been on (1) advancing the use/re-use and management of materials, and (2) creating win-win benefits through technological innovation. Much of the focus of these circular economy efforts has been on reconceptualizing sector specific material flows, including food, plastics, and construction. The goal here is to reduce the demand for new resources and expand the resource value of recovered waste materials.
Some of these initiatives also seek to align themselves with other urban programs, such as housing and mobility, to create additional win-win situations. For example, new production methods or redesigned products may reduce emissions and waste, turn waste products into resources, and also create jobs in new reuse and recovery industries [4]. Other efforts to reduce emissions and waste may improve public health outcomes [24] or advance local innovation efforts [25].
Technology based circular economy solutions also seek to create win-win situations. Urban agriculture offers several examples. Hydroponic and aquaponic systems, where food plants are grown in recirculating, nutrient rich water rather than in soil, are built on circular principles. The innovative technology employed by the College of Agriculture, Urban Sustainability, and Environmental Science of the University of the District of Columbia, for example, achieves water savings of ninety percent compared to conventional agriculture. It is also highly energy efficient and saves resources while contributing public health benefits associated with improved food access in underserved urban neighborhoods [4]. Food production on green roofs is another win-win example. The roofs may serve as production space for local produce, while also absorbing heat and water run-off, which can mitigate flooding and heat-island effects. These technology-based circular economy examples illustrate the complexities of circular systems as well as their potential to create win-win outcomes.
Of particular interest is the work on techno-ecological synergies that seeks to close the gap between the demand for ecosystem services and their supply [26,27]. These efforts, however, tend to define ecosystem services more from a weak sustainability perspective, which assumes the substitutability of natural capital through technological capital. A strong sustainability perspective acknowledges the limited substitutability of natural capital and seeks to maintain critical thresholds of ecosystem components that must be preserved at their respective local, regional, and global levels to ensure the continued provision of ecosystem services.
In addition to identifying different circular economy frameworks, a distinction between models and catalyzers may be useful [20]. Catalyzers focus on the implementation of circular economy concepts, including sustainable design and eco-design strategies. Some eco-design efforts expressly orient themselves on circular economy concepts that draw on the circularity of nature. The objective of these strategies is to advance the health and scope of ecosystems and the services they provide. For example, cities and metro areas may use material-flow analysis and energy-flow analysis to gain a better understanding of the materials cycling through their city or region with the goal of reducing resource use, recapturing emissions and waste, and reducing pressure on ecosystems. Recycling nutrients on green roofs, for example, will reduce nutrient run-off and therefore avoid the eutrophication of streams in the watershed or the nitrate contamination of the groundwater, while at the same time saving fertilizer. Yet while these efforts focus on the circularity of nature, their scope is generally defined by human spatial boundaries, which are typically aligned with administrative jurisdictions rather than taking their cue from the permeable boundaries and multi-scale connections of ecosystems.
These brief examples illustrate that the effective utilization and improvement of ecosystem services will require at least a basic understanding of the critical thresholds and processes that impact the functioning of ecosystems and the services they provide. What level of emission reduction, for example, is needed to ensure the health and vitality of critical ecosystems and how can they be sustained? Cities can be viewed as an ideal microcosm for circular economy concepts that bring the complexity, interconnectedness, and adaptability needs of ecosystem-based circular economy concepts to the fore. Natural resource use; energy use; waste; and the production, distribution, and consumption of goods and services constantly interact and impact the human and non-human entities within city and metro areas, as well as those outside of their immediate geographical boundaries.
The complexity and multi-dimensional scale of circular economy concepts also serves as a reminder that understanding nature’s systems is ultimately indispensable to understanding the complex systems parameters of circularity. Nitrogen, carbon, and hydrological cycles are not only circular but also illustrate the multiple use and non-use dimensions built into the design of nature’s circularity. As Stahel points out, “concerns over resource security, ethics and safety as well as greenhouse-gas reductions are shifting our approach to seeing materials as assets to be preserved, rather than continually consumed” [28,29]. These lessons concerning the value of resource conservation rather than resource use are evident in the material cycles of nature. When critical thresholds of ecosystems or systems-components are violated, the entire system will invariably steer toward collapse [22,23].
In taking its cue from nature’s circularity, a circular economy concept must pay attention not only to resource use and emission and waste reduction and reuse, but also to the sink capacities that buffer, absorb, and process the emissions and waste by-products of economic activity. The examples of carbon sequestration, soil enhancement, and heat absorption are a case in point. They illustrate the fact that reducing emissions and reusing waste by-products may not be enough. What is also needed are strengthened sink capacities that increase the absorption of emissions and waste by-products and buffer against their negative impacts. These sink capacities are a critical dimension of a circular economy, especially in densely populated cities and metro areas where absorptive capacities may be limited to begin with [1,5].
We have argued previously that circular economy concepts demand attention to the largely invisible sink functions that escape the standard valuation framework of economics [30]. Assessing the value of resources is therefore not as straight forward as standard economics makes it seem. It is predicated instead on a better understanding of the resourcing and absorptive capacities that are a part of the material and energy cycles of nature. The carbon, nitrogen, and hydrological cycles can all be instructive. While municipal and regional scale systems approaches may be most common for urban and metro area decision makers, much can be gained from an improved understanding of macro-level systems that drive the circularity of nature. As a subsystem of the environment, the economy cannot escape the rules and behaviors of these larger-scale systems that form its context.
Some circular economy initiatives recognize the need to monitor large scale circular systems such as the hydrological cycle or the carbon cycle. For example, China promotes the monitoring and reduction of carbon emission as well as carbon absorption [31]. Germany and Japan promote circular economy policies based on material flow and life cycle analysis [32,33]. Identifying circularity gaps may also provide valuable insights for a critical reassessment of the value of economic inputs and outputs that considers both resourcing and absorptive capacities. This may include the assessment of social benefits associated with the transformation of natural and secondary resources in addition to their economic and environmental benefits. The value of use as well as preservation and non-use can play an important role in this process of identifying gaps and reconceptualizing circular economy models as determined by the cycles of nature [34,35].
Given the critical importance of the hydrological cycles, not only for economic activity but also for life in general, we now turn to the hydrological cycle as an expression of an ecosystem-based circular economy approach and ask the question of what decision makers in cities and metro regions can gain from an improved understanding of the hydrological cycle. This approach seeks to better align the economy with the circular processes of nature. We suggest that a first step in this nature-based redesign process is an understanding of the physical realities that form the boundaries of economic activity at every level, from local to regional, national, and global.
By proposing a focus on the hydrological cycle, we illustrate the importance of recognizing the complexities of nature’s cycles. Our approach also acknowledges that attention to the granular characteristics of ecosystem models will likely exceed the constraints most municipal and regional decision makers face. Our big-picture approach therefore offers a way to highlight the economic implications of the complex physical cycles of nature without the burden of detailed ecosystems data requirements. In addition, water is of particular relevance to most municipalities because cities around the world have been impacted by extreme droughts and flooding events associated with changing hydrological patterns.
3. Methodology: Learning from Nature
Given the relative paucity of ecosystem-based circular economy models (see the fourth concept in our summary of the work of Prieto-Sandoval et al. [18]), we take a strong-sustainability approach and examine the implications of nature’s hydrological cycle for the capacity of two national economies, namely China and the United States. Our approach also relates to the scale-based circular economy concept, which argues that circular economy models must consider multiple scales. Specifically, we argue that the global scale view of the hydrological cycle can provide invaluable insights for the regional and local scale decisions facing population-dense urban and metro-areas, which tend to be disproportionately impacted by shifting hydrological cycles and their economic implications.
Our approach starts with a description of the physical processes of nature, including the energy and material flows involved in the transformation and use of water as fresh water. Our model does not seek to change material cycles, suggest re-use options, or offer technical solutions like the majority of circular economy models. It simply asks the question ‘how does nature work’ and how do the workings of the non-human-made hydrological cycle impact the capacity of two human-made economies.
From a physical perspective, the transformation of energy into freshwater through the hydrological cycle is a fundamental circular process that determines the long-term viability of the economy, and of life on planet earth itself. Earth receives its energy from the sun. This solar energy is the fundamental energy source without which no economic activity takes place. Its conversion into freshwater through the hydrological cycle illustrates how an analysis of nature’s cycles can provide meaningful lessons for regional decision makers.
The hydrological cycle starts with an assessment of the total amount of energy available through the sun. This available energy is determined by the product of the earth’s surface area and the solar constant (Sc), which is defined as the solar irradiance incident on the surface of planet earth perpendicular to the sun’s rays (see Equation (1)) [36]. To transform this available energy into freshwater requires that the available solar energy is transformed into solar energy embodied in freshwater evaporation. The available solar energy and its processing capacity in the hydrological cycle are therefore inextricably linked. Yet a focus on available energy from an energy source (in this case, the sun) is not sufficient. What is also needed is an understanding of the energy demand associated with the processing capacities that first utilize the available energy, in this case, the capacity to process the evaporation of water.
The reason this processing capacity is so important is that approximately seventy percent of the surface of the globe is covered in water, yet the availability of this water supply as freshwater is limited by the processing capacity that converts ocean water into evaporated freshwater. Only three percent of the global water supply is available as freshwater; 2.48 percent is stored in the polar caps of the planet; 0.5 percent is groundwater, and 0.02 percent is freshwater in lakes and rivers. It is only this small amount of fresh water that is considered accessible. Recent droughts have exacerbated the problem, as groundwater replacement rates have dropped far below extraction rates, resulting in the continual decline of groundwater reserves in many regions around the world, including in the western United States [37]. This example illustrates that any freshwater balance is ultimately dependent on the hydrological cycle that drives the evaporation and precipitation cycle of freshwater. Understanding these cycles is critical for planning and decision purposes.
As evaporated fresh water is available as freshwater precipitation, it can be allocated to multiple uses that can be captured in three broad categories: domestic, industrial, and agricultural water use. Similar to the big-picture approach we take with respect to the physical cycles of nature, we concentrate on basic economic uses without expecting the detailed knowledge associated with specific economic models and their often significant data requirements. Globally, close to 70 percent of freshwater use is allocated to agriculture, 23 percent is used for industrial purposes, and an average 7 percent goes to household use. These average allocations vary across different continents, countries, and regions. Countries with a rate of 50 percent or higher for industrial use can be considered highly industrialized; countries with a mid-range allocation of around 30 percent of industrial water use can be considered transitional; and countries with an industrial water use allocation of less than 20 percent can be considered agricultural [38,39,40].
China’s water-use trends are instructive of the changing allocations associated with changing economic development classifications. China’s industrial water use is expected to triple by 2040, while domestic use is expected to increase modestly. This requires a steep decline in the freshwater allocated to agriculture and translates into tremendous pressures to increase agricultural water use efficiency to meet the food demand of a growing population while also freeing up vast amounts of freshwater for industrial use. New food production methods that appropriate water saving technologies, including recirculating aqua- and hydroponic systems, and the use of urban spaces for food production will be needed to meet these challenges [4,25].
The percentage allocation of water to agricultural use does not necessarily indicate a country’s degree of food security. For example, a highly industrialized nation such as the United States with a relatively low water allocation for agricultural use is an exporter of agricultural products, while a country with a high percentage of agricultural water use may experience food insecurity and require food imports to meet domestic demand. The interpretation of industrial water use percentages may therefore require a closer look to assess linkages between industrial and agricultural water use. High water use allocations for industrial use may be considered more of an indicator of the level of technology employed across all uses rather than an indicator of industrial use per se. This may include water saving technology employed in agriculture. By comparison, household use is relatively stable across a wide range of countries.
Understanding the physical parameters that determine the sustained availability of fresh water, which forms the basis for all freshwater use allocations, will therefore be instructive, regardless of current levels of efficiency. The incoming solar energy is a key factor that drives the hydrological cycle and thus the sustained availability of freshwater overall. To calculate the solar energy that is needed to evaporate one gallon of freshwater, we define the solar constant (Sc) as the solar irradiance incident on the surface of planet earth perpendicular to the sun’s rays at the mean orbital distance of the earth [36] as shown in Equation (1):
where:
- SB = 5.670 × 10⁻⁸ J K−4 m−2 s−1 Stephan–Boltzmann Constant
- T = 5784 Kelvin surface temperature of the sun
- Rs = 6.95 × 10⁵ km, radius of the sun
- Dse = 149.6 × 10⁶ km, distance between the sun and earth
The value of Sc equates to 1391 watt/m2. The product of the earth’s surface area times the solar constant (Sc) gives the amount of solar power reaching the earth, as shown by Equation (2):
The global rate of precipitation indicates that approximately 577,000 km3 of water per year evaporate as available fresh water. The ratio of Pearth and the Rainrate gives us the required solar energy that is needed to evaporate one gallon of freshwater, as shown in Equation (3).
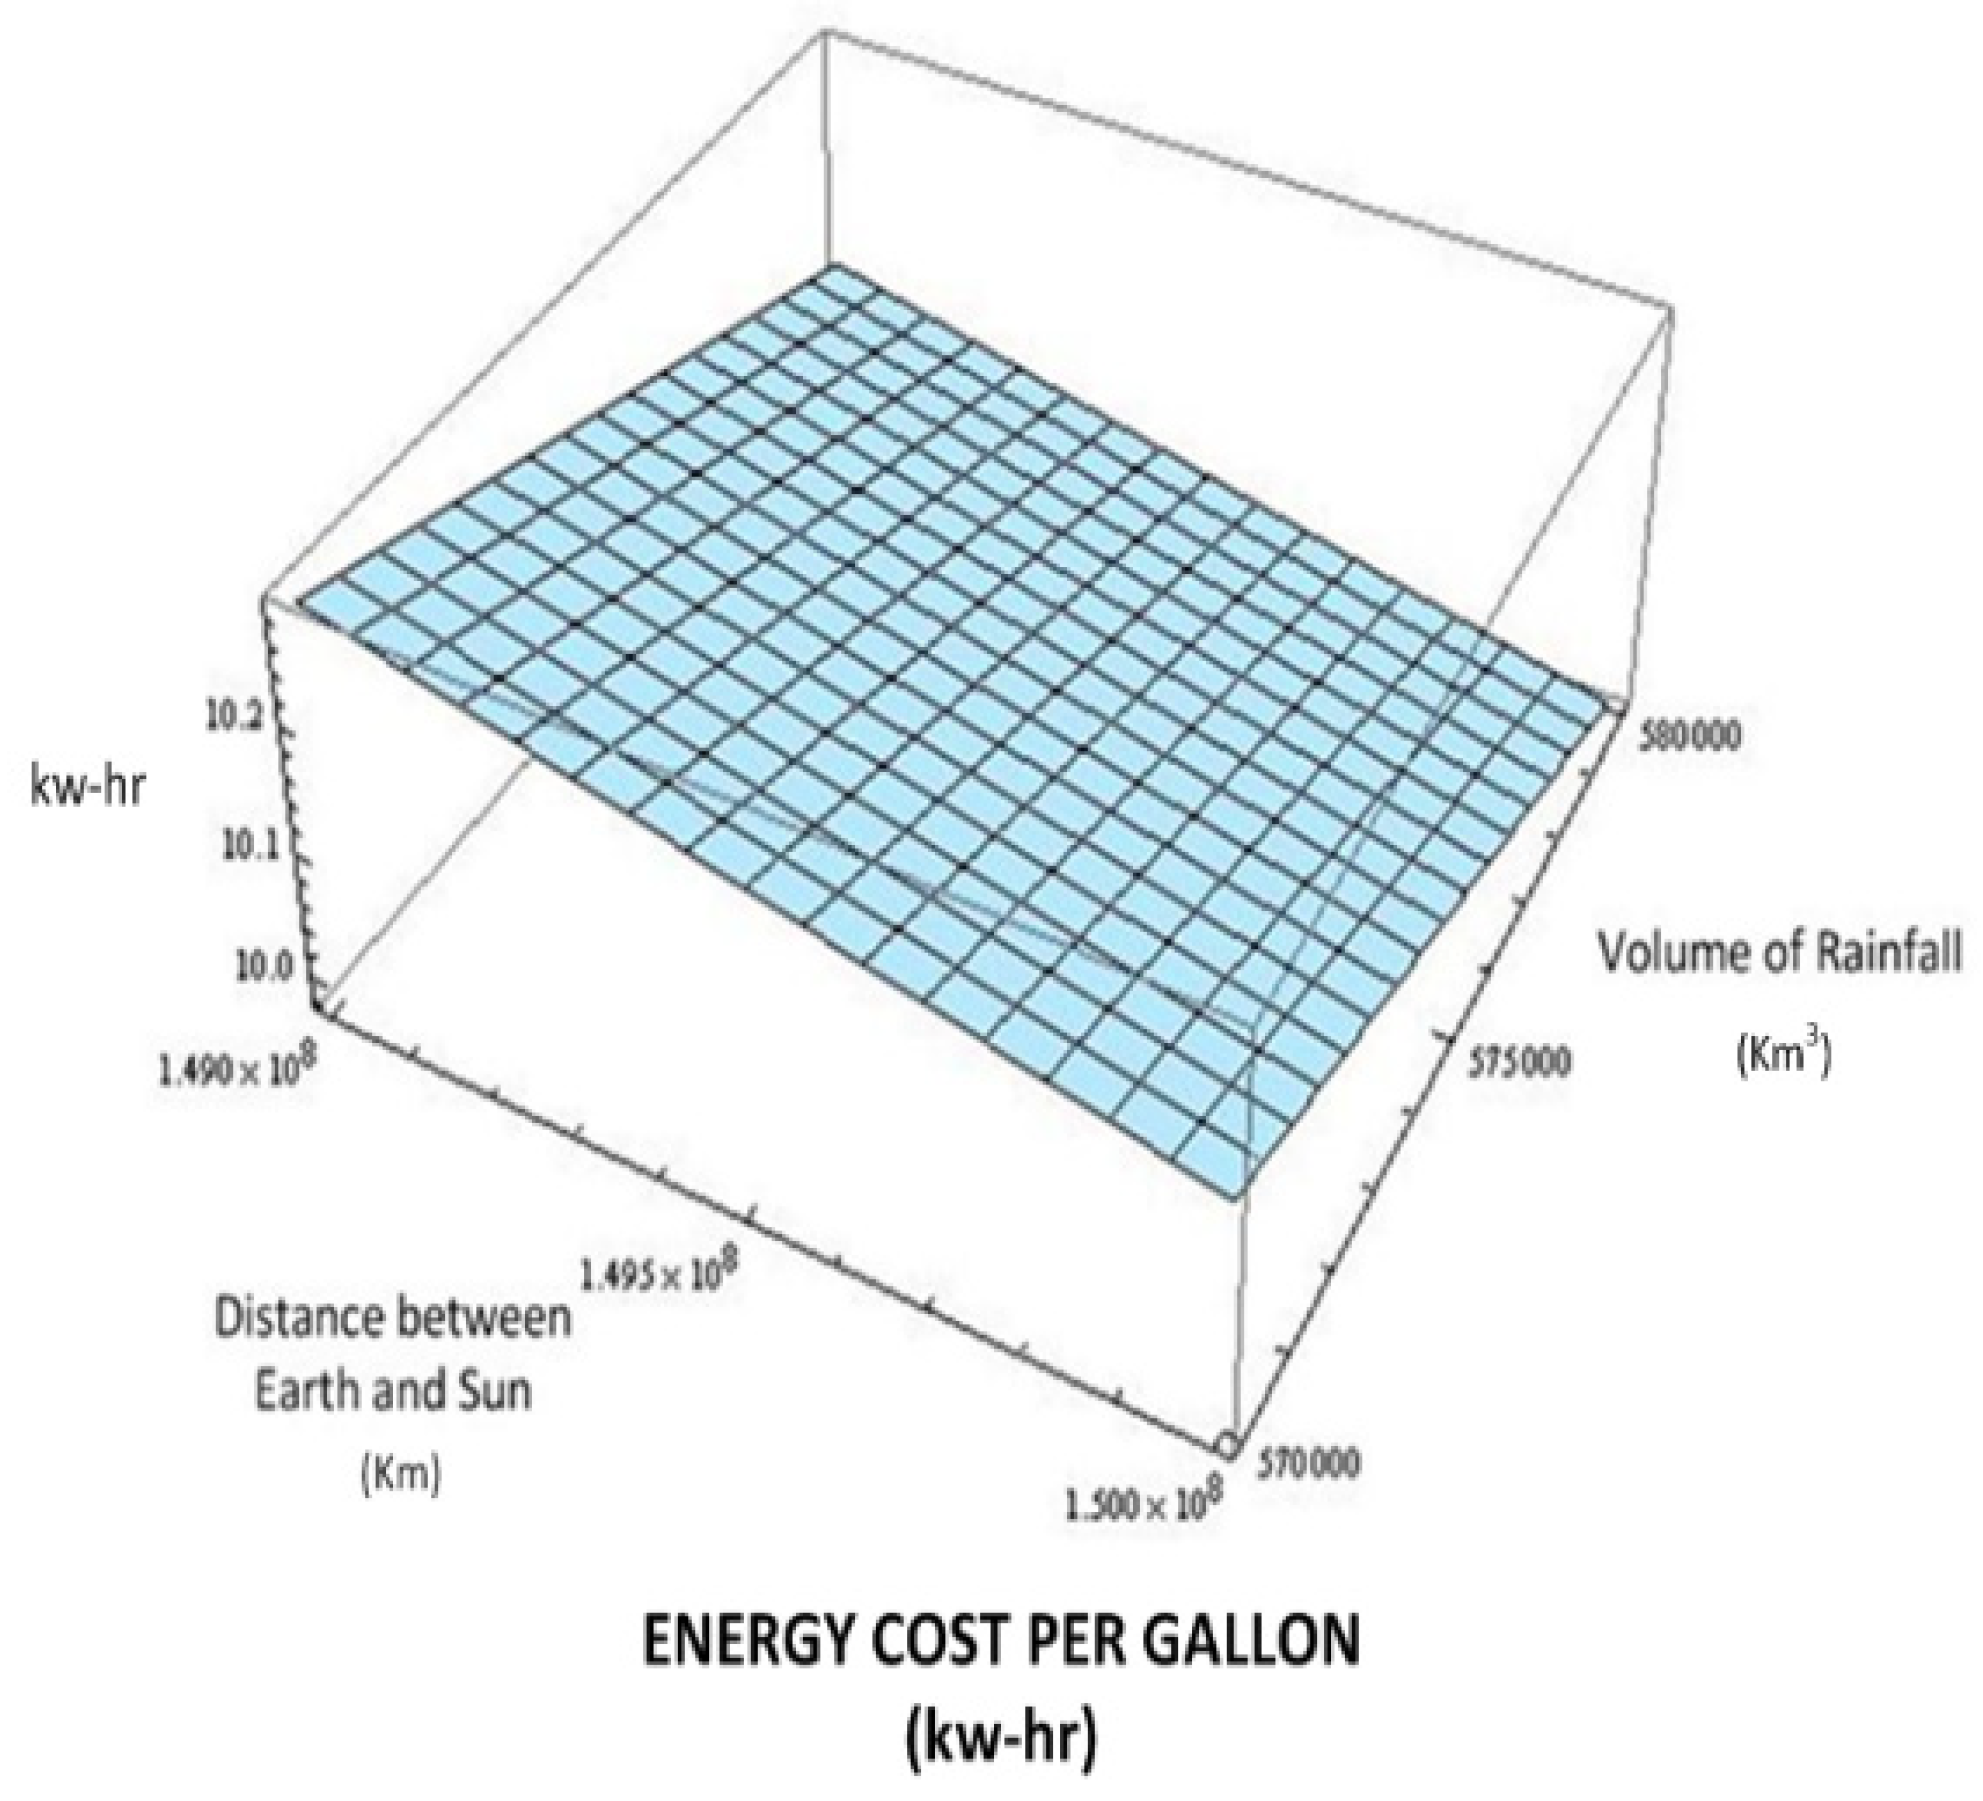
Given the available solar energy, this translates into a requirement of 10 kw-hours of energy to evaporate one gallon of fresh water. This value remains largely unchanged, even when the global rate of precipitation or the distance between the earth and the sun are varied (see Figure 3). The efficiency of nature’s embodied energy value is remarkable. While the evaporation of water in the earth’s hydrological cycle requires 10 kw-hours per gallon of water, the next most efficient way to obtain freshwater from saltwater is through electrolysis, which requires approximately 30 kw-hours per gallon of water [41,42]. Studies also show a considerable range in the costs of desalination, especially when a life cycle cost approach is applied [43]. Across the range of available and potential technologies, the energy required to replicate nature’s hydrological cycle is therefore considerable and illustrates the costs associated with losing the processing capacities of nature.
These results points to the limits of economic output generation imposed by the physical processes that drive the earth’s hydrological cycle. The processes captured in the hydrological cycle place inevitable systems boundaries on output production as measured by its key indicators, GDP (Gross Domestic Product) and GDP per capita. Regardless of whether the goods and services produced represent useful output, defensive expenditures intended to reduce the negative externalities of output production, or infrastructure related goods and services to support economic activity, pressures to increase production persist. This makes the loss of nature’s processing capacity ever more costly.
In developing our physical model of economic output based on the earth’s hydrological cycle, we use a parametric approach utilizing Wolfram Mathematica [44]. Contrary to the more familiar econometric approach, we do not assume a functional form a priori, but instead produce a function-generated algorithm, which underlies our model. The algorithm is generated through a reiterative process of estimating solutions that describe our data points of calculated variables whereby multiple solutions exist that comprise our modeling result. The reiterative calculation process indicates available solutions, no solution, or solutions bounded by a particular range.
Our model uses sixteen variables consisting of a mix of physical, demographic, and economic data we obtain from a variety of data sources [38,39,40] plus the calculated solar constant. Our physical data includes temperature, the radius of the sun, the distance between the sun and the earth, the radius of the earth, and annual rainfall. Our economic data uses the reported water usage per person per day, including the reported range of low and high water-use per capita; the percentage of water allocated to domestic, industrial, and agricultural uses; and the price of electricity per kilowatt-hour reported for our two countries, China and the United States. Missing data for high and low water use is calculated based on the information for total water use per capita for a given year. Finally, we use reported population data as one of our variables.
We then proceed to formulate our model and test the combinations of water use allocations and corresponding GDP levels that constitute possible GDP solutions associated with different water use allocations to the three key uses of domestic, industrial, and agricultural use. Possible solutions are identified through the use of our function generated algorithm, which allows us to identify a functional form that yields the combinations of varying freshwater allocations that form a GDP solution space. We call this solution space of GDP values the ‘landscape’ of possible GDP solutions. This landscape exemplifies a physical circular economy because all available freshwater is dependent on the available energy that drives the hydrological cycle and generates freshwater for its three key uses of household, industrial, and agricultural use. Contrary to existing economic models, which typically do not take physical parameters into account, our model correlates a landscape of potential GDP levels to the distribution of embodied solar energy in the form of fresh water.
4. Nature and Economics: The Hydrological Cycle and the Physical Economy
Our modeling approach is not commonly taken in economics. As discussed in the methodological section of this paper, we formulate the allocation of distributed energy for household, industrial, and agricultural uses parametrically. Commonly, the relationship between different variables that comprise economic production is captured in a predetermined functional form. Empirical data is then used to determine the best fit associated with the coefficients that describe the predetermined functional form. We take a different approach and calculate the possible GDP values that can be obtained based on the physical parameters determining freshwater availability and freshwater use allocation across our three key economic sectors. In addition, we consider high and low water use levels and the Stephan–Boltzmann Constant (SB), which represents the embodied energy in fresh water [45]. Our model, therefore, considers that freshwater is not uniformly distributed but can range from high to low water use across the three principal areas of household, industrial, and agricultural use. The three uses are captured in the parameters x, representing the percentage of domestic water use, y, the percentage of industrial water use, and z, the percentage of agricultural water use. Equation (4) thus depicts the landscape of GDP possibilities based on physical parameters as follows:
Through algebraic manipulation, Equation (4) can be transformed into the Physical Parametric Model for GDP, as represented by Equation (5), which simplifies the model from nine to five parameters.
where:
And the multidimensional parameters representing GDP are:
where by:
- T = 5784 Kelvin surface temperature of the sun
- Rs = 6.95 × 10⁵ km, radius of the sun
- Dse = 149.6 × 10⁶ km, distance between the sun and earth
- Rearth = 6366 × 1000 m, radius of the earth
- Rainrate = 577,000 km3, global annual rainfall
- SB = 5.670 × 10⁻⁸ J K−4 m−2 s−1, Stephan–Boltzmann constant
- Low = in gallons, national reported low water-usage per person per day
- High = national reported high water-usage per person per day in gallons
- a = the frequency of Low
- b = the frequency for High
- x = % of water allocated for domestic use
- y = % of water allocated for industrial use
- z = % of water allocated for agricultural use
- Population = national reported population
- Genrate = the price of electrical energy per kilowatt-hour in U.S. dollars
- Sc = Solar constant = 1391 watts/m2.
Our model predicts the GDP for China and the United States at a level of 98.1 and 98.4 percent accuracy, respectively. This suggests that the physical parameters captured in our model are determinative of the economic capacity of the two countries. Our solution space further indicates that the percentage allocation of freshwater to the three key sectors of domestic, industrial, and agricultural use does generally not add up to 100 percent. This indicates a percentage of available, but unused, freshwater that varies between 5 and 25 percent. We call this unused portion the entropy of embodied freshwater. The percentages of water allocated to household, industrial, and agricultural use vary considerably, with China showing a far higher percentage allocated to agriculture than the United States.
Table 1 summarizes our modeling results, which indicate an entropy range with respect to water use of 16.5 percent unused freshwater for China and 21.5 percent of unused freshwater for the United States. The entropy of embodied water indicates the benefits of overall water use efficiency resulting in savings of embodied water energy. This is counter to the conventional wisdom of economics that assigns value to resources through their use, while non-use or conservation is considered valueless.
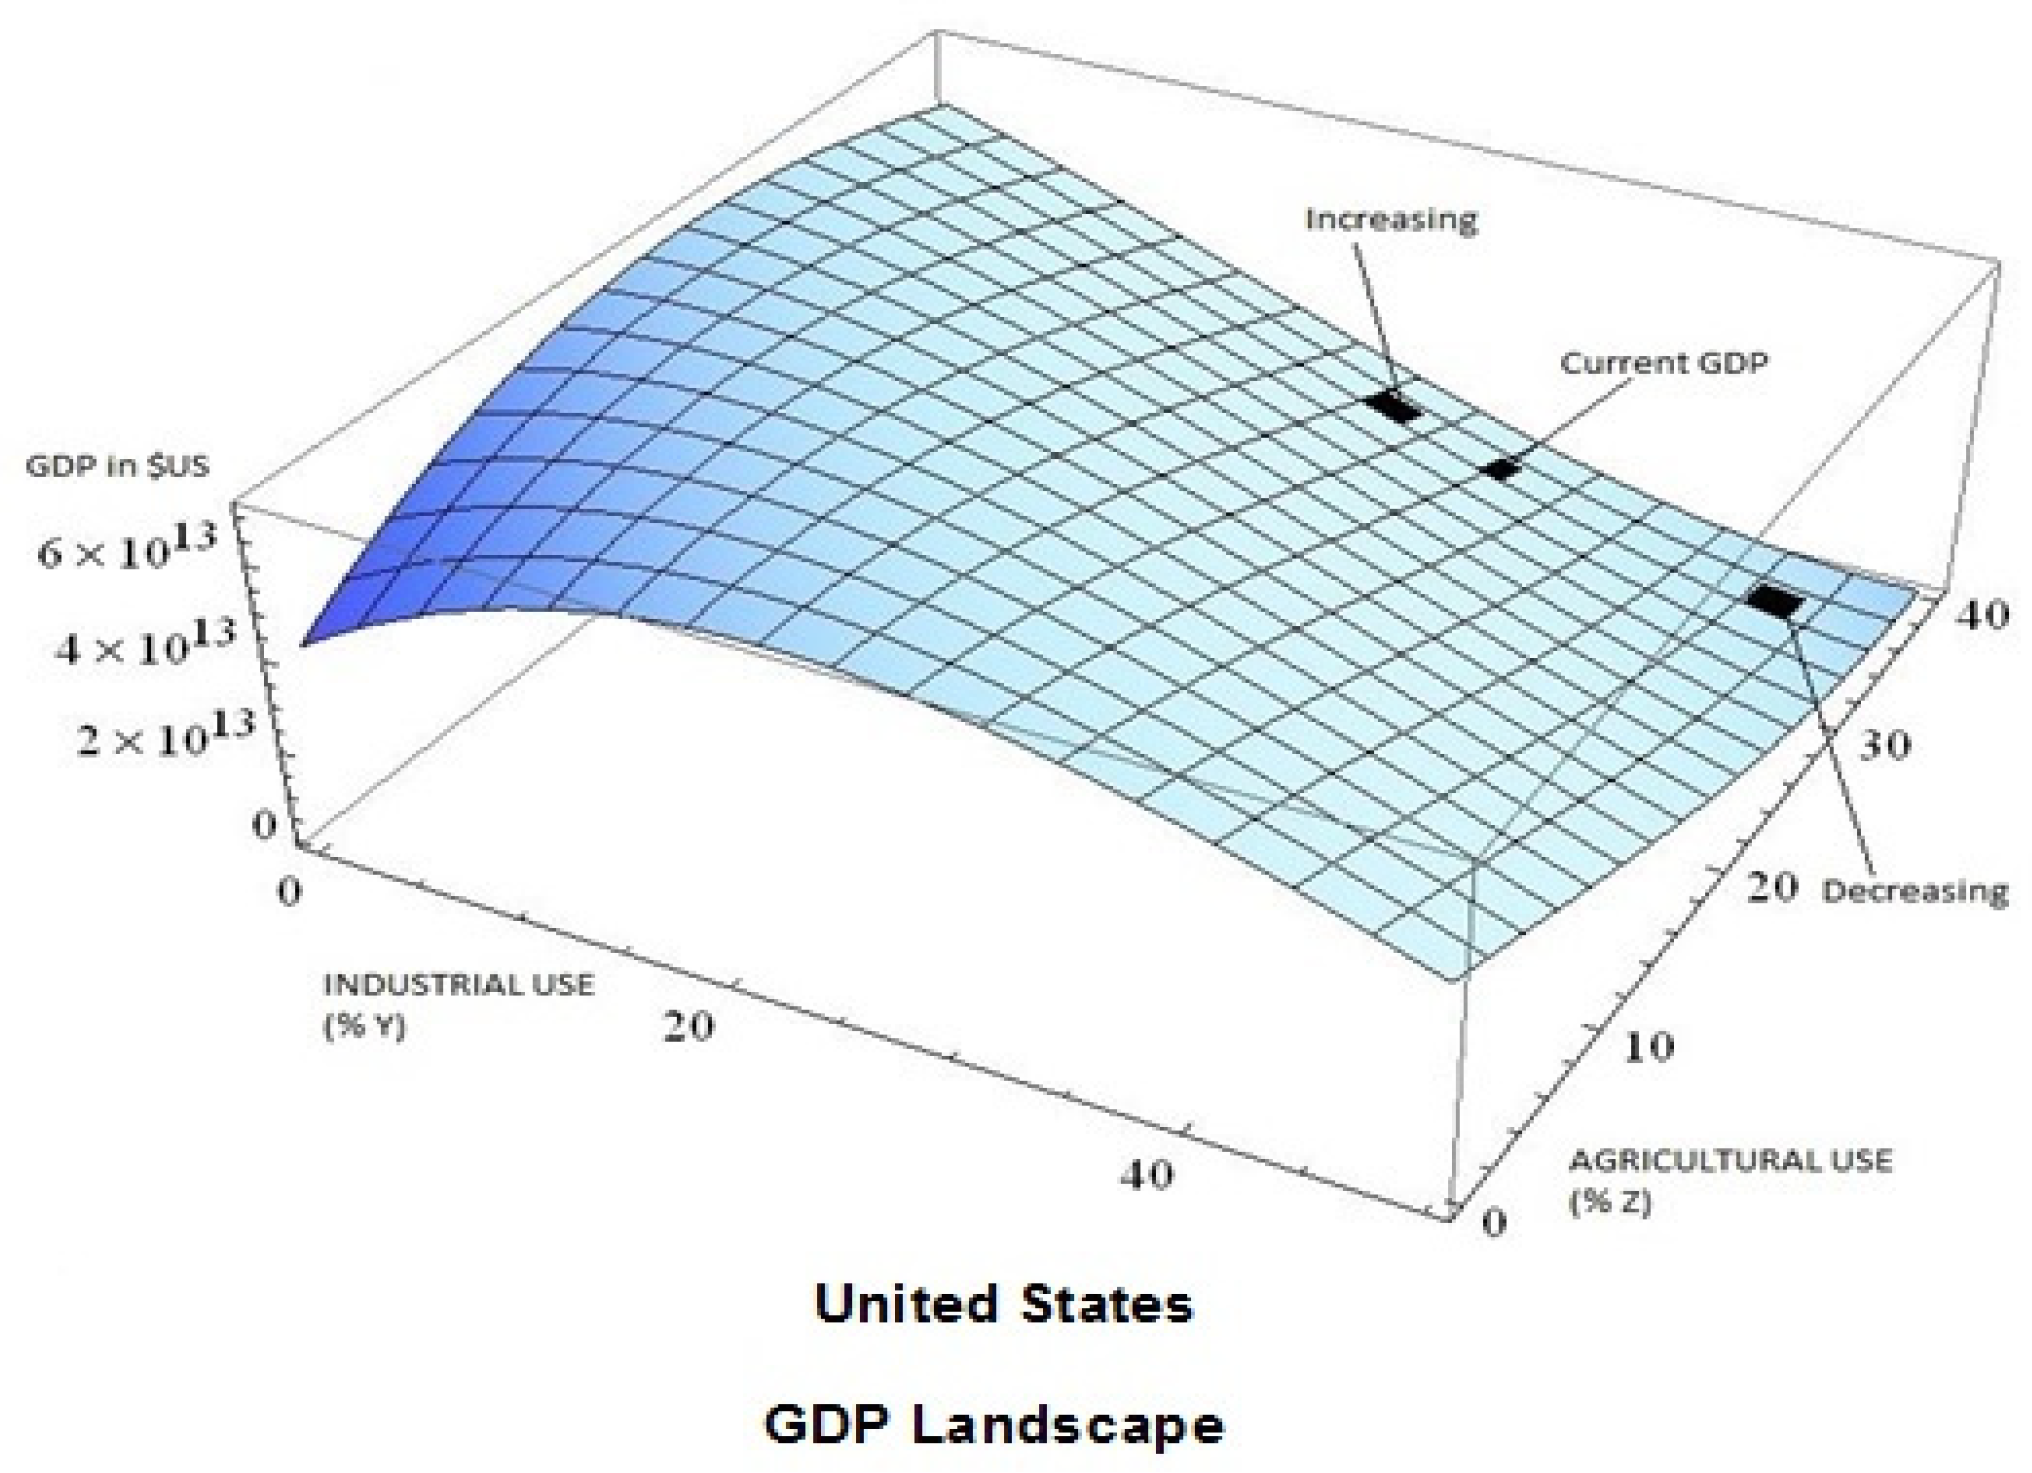
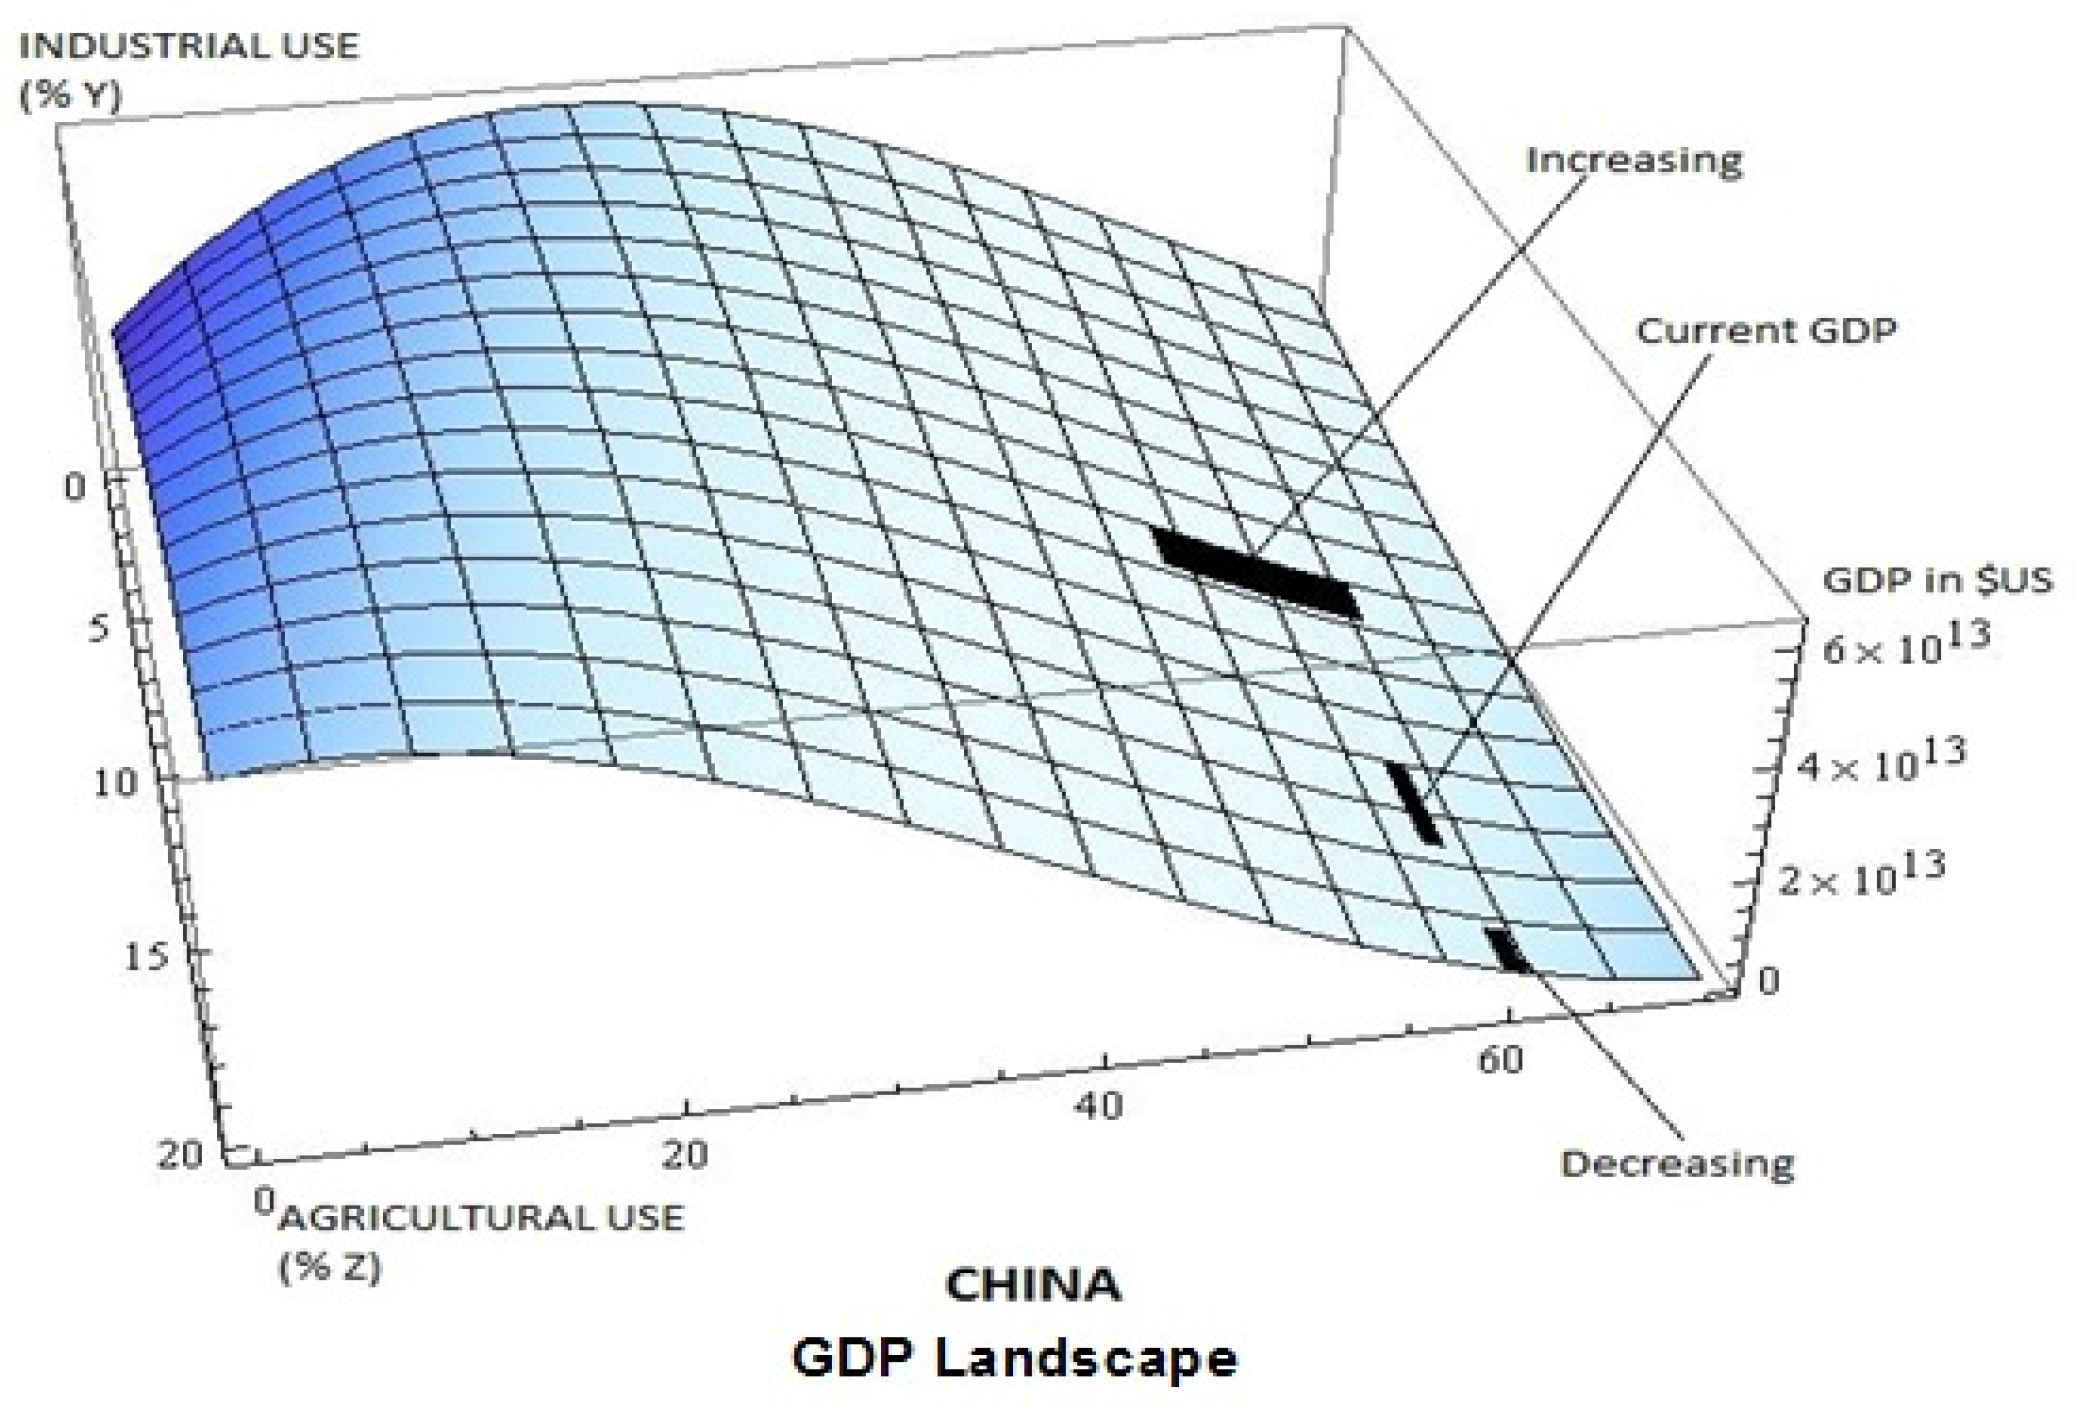
Figure 4 and Figure 5 show a three-dimensional depiction of modeling results for China and the United States. The three-dimensional graphs indicate the multiple combinations of domestic, industrial, and agricultural freshwater use associated with different levels of GDP. The point labeled ‘current’ in the two graphs indicates the calculated GDP values based on current water use allocations. The points labeled ‘increasing’ indicate GDP solutions within the landscape of solutions that are above current GDP levels and their associated freshwater allocations. The points labeled ‘decreasing’ illustrate solutions on the GDP landscape that are below current levels and their associated freshwater allocations. Because the solution space depicted in Figure 4 and Figure 5 is three-dimensional, it shows GDP in USD on the vertical axis, and the percentages of freshwater allocations to industrial (y) and agricultural (z) use on the two horizontal axes. All other variables are captured in the solutions algorithm itself.
As Figure 4 and Figure 5 show, China and the United States have distinct slopes of the solution space associated with the possible GDP values we describe as the GDP landscape. This is reminiscent of the production possibilities frontier of possible combinations of output achievable with a given endowment of resource inputs. Resource inputs in our model represent the physical resource parameters of input allocation (natural capital) as compared to the familiar parameters of capital and labor input allocations (human-made capital).
5. Discussion of Modeling Results
Given the range of 98.4 to 98.1 percent accuracy with which our model predicts observed GDP levels for the United States and China, our results suggest that the physical parameters associated with the hydrological cycle, and the energy demand driving it, are influential in determining the output production capacity of the two countries. The production capacity therefore appears to be determined by physical parameters and not only by economic ones. To sustain the production capacity of a nation or region will therefore require an improved understanding of the physical parameters involved beyond the ability to maintain inputs of natural resources, in this case water and energy.
Our results further suggest that a way to think about the production capacity of a nation or region is to understand it as a field of output as opposed to one distinct value of output. We call this field the landscape of potential output levels associated with varying combinations of domestic, industrial, and agricultural water use. The maximum output level is represented by a cusp that can be reached through a range of combinations of water use allocations. Our model indicates considerable vulnerability outside of a given range. In other words, not every combination of water use allocation is advantageous. Some combinations result in dramatically reduced levels of economic output capacity, as measured in GDP.
Modeling results for the overall GDP potential of the two countries vary considerably. Results for the United States (Figure 4) indicate a more limited GDP expansion potential. Given the efficiency levels already achieved, as indicated by entropy levels of 21.5 percent, it will be more challenging for the United States to realize further growth potential. A considerable reallocation of water use will be necessary to capture the additional GDP expansion potential.
Modeling results for China (Figure 5) indicate its high allocation of freshwater for agricultural use. China also has considerable expansion potential. To capture its potential, China must first and foremost decrease the percentage of agricultural water use. Considerable efficiency increases in both agricultural and industrial use will be necessary to achieve this goal. In addition, a considerable increase in water entropy, or the percentage of unused water, will be necessary to realize the economic potential indicated by the GDP landscape for China.
Results for both countries indicate that realizing an increase in GDP may require not only the reallocation of water between domestic, industrial, and agricultural uses, but also an overall increase in unused water, which we refer to as water entropy. This suggests the limits to economic expansion posed by the physical context conditions that determine the availability of solar energy and its embodied distribution in freshwater. Not the use of water, but the entropy or conservation of water seems to be a key driver of the economic potential expressed in the GDP solutions landscape. Both countries will likely find it challenging to realize the needed growth in water entropy given the increasingly erratic distribution of evaporated water associated with a heating planet.
To test the responsiveness of our model, we simulated an increase in the energy costs (Genrate) for China to USD 0.16, and for the United States to USD 0.20. This constitutes a doubling of the energy costs for both countries. These increased energy rates may not be easily obtained, yet they are still considerably lower than the rates currently in effect in some European countries. Germany’s energy costs, for example, are USD 0.35 per kilowatt hour. Our modeling results indicate significant increases in the output generation potential for both China and the United States as energy rates increase. Because increased energy costs drive efficiency increases in water use, economic capacity expands almost proportionally to the cost increases. While this may be good news for decision makers in terms of the leverage available to drive needed efficiency increases, political pressures may stand in the way of enacting the needed increase in energy rates.
We further simulate an increase in the population of China by 20 percent and an increase in the United States population by 10 percent from our baseline of 2013. These assumptions reflect projected growth rates, leading to a world population of 10 billion within the next 25 years. Modeling results suggest that a 20 percent increase in the population of China is associated with a GDP of USD 11.7 trillion. Modeling results for the United States show that an assumed ten percent increase in population yields GDP levels of USD 19.1 trillion. Given the substantial impact of energy rate increases on the output capacity of both countries, rate increases will be inevitable to maintain the GDP per capita rates associated with our population growth scenarios.
Table 2 summarizes our modeling results. Our findings indicate that the ability to meet the domestic, industrial, and agricultural freshwater uses of our population growth projections will require a significant change in how the value of resources is viewed. Typically, a resource is viewed as valuable when it commands a high market value or is used as a value-added input in a high value product. The higher the market exchange value, the more valuable the resource, according to standard economics. However, as unused water is needed to sustain the hydrological cycle itself, the nonuse value of water must also be considered as economically valuable. This is reminiscent of the findings of natural resource accounting, which suggests that the stock of resources and not only their use determine the economic development capacity of a region or nation [46,47]. At the very least, awareness of the non-use value of resources should alert decision makers to the development constraints of their regions. This is especially relevant for urban and metro-regions where high population density may prove particularly challenging to meeting non-use goals [48].
6. Implications for Decision Makers
Several findings warrant attention. First, our analysis of the hydrological cycle as an example of a fundamental cycle of nature that impacts not only natural capacity but also economic capacity has implications for the types of circular economy models that are most promising in rethinking the current linear take-make-waste model of the economy. Big picture cycles such as the hydrological cycle may prove particularly useful in illustrating the complex connections between economic activity and its physical/environmental context without the information and data requirements associated with ecosystem models that simulate more detailed processing cycles and ecosystem services.
Knowledge of the hydrological cycle may be especially valuable because pressure on water use is expected to increase as the world’s population grows to an estimated 10 billion over the next 25 years. Additional pressures will come from the more erratic evaporation and precipitation patterns resulting from rising ambient air temperatures. Tremendous efficiency increases in water use will therefore be needed to meet the growing freshwater demand, especially in population-dense urban and metro areas. A focus on food systems will be inevitable because agriculture appropriates the bulk of the available freshwater. The dramatic increases in agricultural water use efficiency that will be needed to realize a solution space in the increasing GDP realm will require cities and metro areas to seek highly efficient food production solutions, especially for the most perishable and nutrient dense foods. These solutions can lower the pressure on peri-urban and rural areas that serve as compensatory areas for densely populated urban areas. Both the water-use efficiency of agriculture itself and of the industrial uses associated with agricultural innovations must increase considerably to meet these challenges.
As decision makers contemplate the design of a circular economy, it will become necessary to not only build in the reduced use of resources by introducing recirculating systems, and to recover emissions and waste streams for use as alternate resources, it will also be necessary to ensure that the physical processing capacities that undergird economic capacity are sustained. Restoring ecosystem capacities may be closely tied to this need for additional processing capacities. Further research will be needed to assess the scope of the processing capacities, not only of the hydrological cycle but also of other critical systems cycles (such as carbon and nitrogen) captured in the supporting ecosystem services category, as identified by the United Nations classification system of supporting, regulating, provisioning, and cultural ecosystem services [49,50].
Secondly, the non-use of resources may be as important to economic capacity as their use. Our modelling results indicate that combinations of water use that fall within a high range of GDP levels on the GDP landscape are generally associated with high rates of water entropy, or unused water. This points to the dramatic increase in water use efficiency that is needed in order to sustain the economic growth potential of a region. At maximum capacity, the entropy rate with respect to water use for China is close to 50 percent, and for the United States it is above 50 percent of water savings. This implies that over 50 percent of the available freshwater will have to remain unused in order to increase production capacities to their highest potential. As weather patterns become ever more erratic, it may become increasingly important to allow for a water-use buffer of unused freshwater, as indicated by our results.
The non-use value of water also points to the value of sink capacities, such as the absorption of waste streams, the buffering of emission impacts, and the processing capacities that sustain the future availability of both resourcing and sink capacities. Our calculations suggest that there is no shortage in potential freshwater availability based on the energy available for freshwater evaporation. Utilizing ever-higher rates of available freshwater, however, reduces the potential for further growth in output capacity. As the need for economic output increases, due to population growth for example, tremendous efficiency increases in freshwater use will be necessary to obtain the increased productivity levels needed to meet not only growing water use needs but also growing water savings needs. Declining water savings will significantly increase overall vulnerabilities and lower the potential for future economic capacity. These findings are likely to be applicable not only to the hydrological cycle but also to other cycles of nature. Using up available resources for economic production purposes without leaving a sufficient percentage of resources unused may therefore impact overall processing capacities and constrain the capacity to generate future economic output.
Third, price policies can steer the resource use and non-use needs highlighted by the physical systems that undergird economic capacity in the right direction. Yet while the energy price increases we simulated may be significant, they may proof too low to initiate the efficiency increases needed to accommodate projected population growth rates. Our simulations of population growth rates of 20 percent for China and 10 percent for the United States indicate that both countries have the potential to increase their GDP. However, the economic output capacity, as measured in GDP, will grow at a lower rate than the assumed population growth rates. China will find it especially challenging to maintain current levels of GDP per capita. These results bring not only the effectiveness of energy price policies into focus but also the efficiency of nature, as expressed in the hydrological cycle. As Figure 3 of our modeling results showed, the energy needed to evaporate one gallon of water is 10 kilowatt hours, while recent calculations of the energy demand to turn salt water into freshwater indicate an energy demand of approximately 30 kilowatt hours per gal of water, or almost three times as much as the energy required by the hydrological cycle of nature [6]. This speaks to the advantages of saving and utilizing nature’s processing capacities as compared to relying solely on the technological systems that seek to replicate them. These findings call renewed attention to the precautionary principle that first received wider attention during the United Nations Conference on Environment and Development that was held in Rio de Janeiro in 1992 [51,52]. This principle argues that significant advantages may accrue from preserving the processing capacities of nature, including those captured in ecosystem services, even though they may not be fully understood. Seeking to replace lost processing capacities, even when it is technologically feasible, may be far more costly than avoiding their deterioration or outright destruction in the first place.
All three points indicate information gaps as well as value distortions associated with common models and measures decision makers may consult to guide their efforts toward a circular economy. To achieve economic expansion, increased water-use allocations to industry and reduced agricultural water-use allocations will be imperative. Yet without maintaining considerable levels of unused freshwater or water entropy levels of between 40 and 60 percent, the economic output potential our model suggests cannot be realized. Recent empirical evidence of the pitfalls of water overuse in times of growing climate vulnerabilities seem to corroborate these findings.
Finally, decision makers must become more aware of the problem of scale. Municipal and regional decision makers in high population areas may have no control over the large-scale global processes associated with changes in the hydrological cycle of our planet. Yet every municipality must be prepared to anticipate these changes and will be well served to understand the underlying physical cycles that will invariably impact them. This improved process understanding may be especially needed in urban and metro areas where high population densities exacerbate the vulnerabilities associated with resource overuse and pressures on vital ecosystem processing capacities.
7. Conclusions
Access to affordable freshwater is a key driver of health, food security, economic development success, and life in general. The hydrological cycle exemplifies a key connection between the physical cycles of nature and their economic capacity implications at the macro level. While solar energy in and of itself is indispensable to the global material cycle, and especially to the vital process of photosynthesis, it is the embodied energy in the hydrological cycle that determines the sustained availability of freshwater in the form of evaporation and useable freshwater precipitation. The calculation of the solar energy available for freshwater evaporation, which drives the hydrological cycle, reveals the efficiency of nature. The evaporation of water in the earth’s hydrological cycle requires 10 kw-hours per gallon of water. Obtaining fresh water from salt water through desalination requires at least 30 kw-hours of energy per gal of water. The energy required to replicate nature’s hydrological cycle is therefore considerable, and the ability to utilize the embodied energy of freshwater evaporation is an important factor in achieving economic success.
Contrary to most contemporary economic models, which typically do not take physical parameters into account, our model correlates the total output of goods and services produced to the distribution of embodied solar energy in the form of freshwater. The allocation of the embodied energy in freshwater to the three key uses of household, industrial, and agricultural freshwater use is formulated parametrically for two countries, namely China and the United States. Our model predicts total output of goods and services in US dollars as a function of the embodied solar energy in the allocation of freshwater to domestic, industrial, and agriculture uses for the two countries at a 98.1 to 98.4 percent range of accuracy.
Our results show the current levels of GDP achieved by current freshwater allocations as well as the possible solutions space of GDP levels attainable through other combinations of freshwater allocation to domestic, industrial, and agricultural use. We call this solutions space the landscape of GDP solutions. It indicates that the ability to realize growing level of output in final goods and services is driven, not by the use of water, but by what we call ‘freshwater entropy’, namely by the percentage of unused or conserved water. Even as considerable economic output potential is available, it is not likely to be realized if water use efficiencies remain at current levels. Only through the considerable increase of unused freshwater can the potential output capacity our model identifies be realized.
To further test the implications of our modeling results, we examined two scenarios: an increase in energy costs, and population growth. Our results indicate that higher energy rates increase the potential to move beyond current levels of output along the potential GDP landscape to higher output levels. Additionally, while population growth may drive up the overall output in final goods and services, it will result in a decline in output per capita unless significant increases in water use efficiency are realized.
Further analysis of other countries and regions will be instructive in identifying not only the needed efficiency increases, but also the most promising freshwater use allocation patterns, as well as limitations to the reallocation of freshwater across different uses. Given the relative accessibility of the physical and economic data requirements of our model, we anticipate additional explorations in the future.
The responsiveness of the model to energy price changes may be at least partially good news for decision makers. Price policies can be effective in achieving needed efficiency increases, yet they must focus foremost on a reduction in water use overall rather than on increasing the water use efficiency in the industrial and agricultural sectors. Achieving further expansions of economic capacity may therefore depend on an improved understanding of nature’s circularity, especially when competing resource pressures and land-use constraints exacerbate economic capacity limits.
Our findings suggest three particularly important lessons for decision makers: (1) the tremendous efficiency increases needed to realize increased levels of economic output will require circular economy models that consider the efficient processing capacity of nature rather than relying solely on technological solutions; (2) the non-use of resources may be as valuable (or more) as their use; and (3) price policies can be effective in steering resource use and non-use in the right direction.
Our approach adds to all four circular economy concepts outlined in Section 2 of this articles: it adds to the waste-reduction-and-reuse framework by advocating a circular economy model that more fully utilizes the efficient cycles of nature; it adds to the technological-solutions framework by calling attention to the limits of substituting natural capital through technological capital; it adds to the scale-based circular economy concept by connecting the global hydrological cycle to local and regional implications based on an improved understanding of the fundamental cycles of nature; and most importantly, it adds to the often underexamined ecosystems-based circular economy concept by taking its cue from the hydrological cycle, which undergirds all freshwater generation and the energy it embodies.
While our findings may be counterintuitive from a mainstream economic valuation perspective, they are consistent with the valuation concepts of ecological economics, which hold that the substitutability of natural resources through capital resources is limited [53,54,55,56]. Natural resources, such as freshwater, and the complex processes they support, must therefore be preserved in order to realize any future economic output potential. Realizing future economic capacity, however, will also require a shift in focus to preserving resources, not only for future resource use, but also to sustain the planetary processing capacities that ensure the availability of resources in the first place. Operationalizing these insights will be important for decision makers at every scale, including those who seek to implement circular economy solutions at the local and regional level.
Author Contributions
Conceptualization, S.O. and T.S.K.; methodology, T.S.K. and S.O.; data preparation and modeling, T.S.K.; analysis and interpretation of modeling results, S.O. and T.S.K.; original draft preparation, review and editing, S.O. All authors have read and agreed to the published version of the manuscript.
Funding
This research is not supported by external funding.
Institutional Review Board Statement
Not applicable.
Informed Consent Statement
Not applicable.
Data Availability Statement
Not applicable.
Acknowledgments
We gratefully acknowledge the feedback we received from participants in the bi-annual conference of the International Society for Ecological Economics.
Conflicts of Interest
This research was not supported by external funding. There is no role anyone other than the two authors played in designing the study, analyzing, and interpreting its results, or in writing this manuscript. The manuscript underwent a rigorous peer review process by three reviewers unknown to the authors. The authors had no role in the decision to publish this research.
References
- Huntington, H.P.; Schmidt, J.I.; Loring, P.A. Applying the food-energy-water nexus concept at the local scale. Nat. Sustain. 2021, 4, 672–679. [Google Scholar] [CrossRef]
- Brears, R.C. The Green Economy and the Water-Energy-Food Nexus. In The Green Economy and the Water-Energy-Food Nexus; Palgrave Macmillan: London, UK, 2018. [Google Scholar]
- Santagata, R.; Ripa, M.; Genovese, A.; Ulgiati, S. Food waste recovery pathways: Challenges and opportunities for an emerging bio-based circular economy. A systematic review and an assessment. J. Clean. Prod. 2021, 286, 125490. [Google Scholar] [CrossRef]
- O’Hara, S. The Urban Food Hubs Solution: Building Capacity in Urban Communities. Metrop. Univ. 2017, 28, 69–93. [Google Scholar] [CrossRef] [Green Version]
- Payne, J.; McKeown, P.; Jones, M.D. A circular economy approach to plastic waste. Polym. Degrad. Stab. 2019, 165, 170–181. [Google Scholar] [CrossRef]
- Roland-Mieszkowski, M. Life on Earth-Flow of Energy and Entropy; Digital Recordings: Halifax, NS, Canada, 2003; Available online: http://www.digital-recordings.com/publ/publife.html (accessed on 19 August 2021).
- United Nations. Department of Economic and Social Affairs. Transforming Our World: The 2030 Agenda for Sustainable Development; United Nations: New York, NY, USA, 2015. [Google Scholar]
- Kaufman, R.; Kuhl, B. Energy and the Macroeconomy. In Economics Interactions with Other Disciplines; Gowdy, J.M., Ed.; Encyclopedia of Life Support Systems (EOLSS): Oxford, UK, 2009. [Google Scholar]
- Odum, H.T. Energy, Ecology, and Economics. Ambio 1973, 2, 220–227. [Google Scholar]
- Walker, J. Power and Entropy: The Limits of Ecological Economics. In More Heat than Life: The Tangled Roots of Ecology, Energy, and Economics; Palgrave Macmillan: Singapore, 2020; pp. 285–310. [Google Scholar]
- Daly, H. Steady State Economics, 2nd ed.; Island Press: New York, NY, USA, 1991. [Google Scholar]
- Gain, A.K.; Giupponi, C.; Renaud, F.G.; Vafeidis, A.T. Sustainability of complex social-ecological systems: Methods, tools, and approaches. Reg. Environ. Chang. 2020, 20, 102. [Google Scholar] [CrossRef]
- Gowdy, J.M. The Revolution in Welfare Economics and Its Implications for Environmental Valuation and Policy. Land Econ. 2004, 80, 239. [Google Scholar] [CrossRef]
- National Geographic. The Circular Economy; National Geographic Forum: Washington, DC, USA, 2020. [Google Scholar]
- O’Hara, S. Production in Context: The Concept of Sustaining Production. In Beyond Uneconomic Growth; Vol. 2: A Festschrift in Honor of Herman Daly; Farley, J., Malghan, D., Eds.; University of Vermont: Burlington, VT, USA, 2016; pp. 75–106. [Google Scholar]
- Kirchherr, J.; Reike, D.; Hekkert, M. Conceptualizing the circular economy: An analysis of 114 definitions. Resour. Conserv. Recycl. 2017, 127, 221–232. [Google Scholar] [CrossRef]
- Ghisellini, P.; Cialani, C.; Ulgiati, S. A Review on Circular Economy: The Expected Transition to a Balanced Interplay of Environmental and Economic Systems. J. Clean. Prod. 2016, 114, 11–32. [Google Scholar] [CrossRef]
- Prieto-Sandoval, V.; Jaca, C.; Ormazaba, M. Towards a consensus on the circular economy. J. Clean. Prod. 2018, 179, 605e615. [Google Scholar] [CrossRef]
- European Commission. The EU and Nature-Based Solutions. 2017. Available online: https://ec.europa.eu/info/research-and-innovation/research-area/environment/nature-based-solutions_en (accessed on 8 October 2021).
- European Commission. Communication from The Commission to The European Parliament, The Council, The European Economic and Social Committee, and The Committee of the Regions; A new Circular Economy Action Plan For a cleaner and more competitive Europe COM/2020/98 final; Directorate-General for Environment, European Commission: Brussel, Belgium, 2020. [Google Scholar]
- Moraga, G.; Huysveld, S.; Mathieux, F.; Blengini, G.; Alaerts, L.; Van Acker, K.; de Meester, S.; Dewulf, J. Circular economy indicators: What do they measure? Resour. Conserv. Recycl. 2019, 146, 452–461. [Google Scholar] [CrossRef] [PubMed]
- Sasaki, T.; Furukawa, T.; Iwasaki, Y.; Seto, M.; Mori, A. Perspectives for ecosystem management based on ecosystem resilience and ecological thresholds against multiple and stochastic disturbances. Ecol. Indic. 2015, 57, 395–408. [Google Scholar] [CrossRef]
- Farley, J.; Voinov, A. Economics, socio-ecological resilience and ecosystem services. J. Environ. Manag. 2016, 183, 389–398. [Google Scholar] [CrossRef]
- Kerr, R.B.; Madsen, S.; Stüber, M.; Liebert, J.; Enloe, S.; Borghino, N.; Parros, P.; Mutyambai, D.M.; Prudhon, M.; Wezel, A. Can agroecology improve food security and nutrition? A review. Glob. Food Secur. 2021, 29, 100540. [Google Scholar] [CrossRef]
- O’Hara, S.; Baker, D. Local Economies—Leading the Way to an Ecological Economy. In Sustainable Wellbeing Futures; Costanza, R., Erickson, J., Farley, J., Kubiszewk, I., Eds.; Edward Elgar Publishing: Cheltenham, UK, 2020; pp. 374–385. [Google Scholar]
- Bakshi, B.; Ziv, G.; Lepech, M.D. Techno-Ecological Synergy: A Framework for Sustainable Engineering. Environ. Sci. Technol. 2015, 49, 1752–1760. [Google Scholar] [CrossRef]
- Hernandez, R.R.; Armstrong, A.; Burney, J.; Ryan, G.; Moore-O’Leary, K.; Diédhiou, I.; Grodsky, S.M.; Saul-Gershenz, L.; Davis, R.; Macknick, J.; et al. Techno–ecological synergies of solar energy for global sustainability. Nat. Sustain. 2019, 2, 560–568. [Google Scholar] [CrossRef]
- Stahel, W.R. Policy for material efficiency—sustainable taxation as a departure from the throwaway society. Philos. Trans. R. Soc. A Math. Phys. Eng. Sci. 2013, 371, 20110567. [Google Scholar] [CrossRef] [PubMed]
- Stahel, W. The Performance Economy; Palgrave Macmilan: Basingstoke, UK, 2010. [Google Scholar]
- Kakovitch, T.; O’Hara, S. Physics and the New Economy; HRD Press: Amherst, MA, USA, 2014. [Google Scholar]
- Geng, Y.; Fu, J.; Sarkis, J.; Xue, B. Towards a national circular economy indicator system in China: An evaluation and critical analysis. J. Clean. Prod. 2012, 23, 216–224. [Google Scholar] [CrossRef]
- Ogunmakinde, O.E. A Review of Circular Economy Development Models in China, Germany and Japan. Recycling 2019, 4, 27. [Google Scholar] [CrossRef] [Green Version]
- Circular Economy Initiative Deutschland. The Way Forward. Available online: https://www.circular-economy-initiative.de/english (accessed on 7 October 2020).
- Homrich, A.S.; Galvão, G.; Abadia, L.G.; Carvalho, M.M. The circular economy umbrella: Trends and gaps on integrating pathways. J. Clean. Prod. 2018, 175, 525–543. [Google Scholar] [CrossRef]
- Wit, M.; Hoogzaad, J.; Ramkumar, S.; Friedl, H.; Douma, A. The Circularity Gap Report: An Analysis of the Circular State of the Global Economy. Available online: https://www.greengrowthknowledge.org/research/circularity-gap-report-analysis-circular-state-global-economy (accessed on 29 September 2020).
- Wetherald, R.T.; Manabe, S. The Effects of Changing the Solar Constant on the Climate of a General Circulation Model. J. Atmos. Sci. 1975, 32, 2044–2059. [Google Scholar] [CrossRef]
- Bernstein, J. Critical Groundwater Supplies May Never Recover from Drought. Phys. Org. News and Articles on Science and Technology. 30 September 2021. Available online: https://phys.org/news/2021-09-critical-groundwater-recover-drought.html (accessed on 5 October 2021).
- FAOSTAT. Food and Agriculture Organization of the United Nations. Statistics 2000–2015. Available online: http://www.fao.org/statistics/en (accessed on 15 November 2017).
- AQUASTAT—Food and Agriculture Organization of the United Nations. Global Information System on Water and Agriculture. Available online: http://www.fao.org/aquastat/en/overview/methodology/water-use (accessed on 11 November 2017).
- Miller, T.; Kim, A.B. Index of Economic Freedom: Promoting Economic Opportunity and Prosperity. Available online: https://archive.rai-see.org/wp-content/uploads/2016/01/Economic-Freedom-Index-2015.pdf (accessed on 15 November 2017).
- Mishra, D. The Cost of Desalination. Available online: https://www.advisian.com/en-us/global-perspectives/the-cost-of-desalination (accessed on 14 July 2019).
- National Research Council. Desalination: A National Perspective; The National Academies Press: Washington, DC, USA, 2008. [Google Scholar]
- E Webber, M. The water intensity of the transitional hydrogen economy. Environ. Res. Lett. 2007, 2, 034007. [Google Scholar] [CrossRef] [Green Version]
- Wolfram Mathematica Computational Software Program. Mathematica 12 System Requirements and Platform; Version 8; Wolfram: Champaign, IL, USA, 2010. [Google Scholar]
- Feynman, R.P. The Feynman Lectures on Physics; Feynman, R.P., Leighton, R.B., Sands, M., Eds.; Addison Wesley: Menloy Park, CA, USA, 1970; Volume I, ISBN 978-0-201-02115-8. [Google Scholar]
- Repetto, R.C.; Faeth, P.; Westra, J. Accounting for Natural Resources in Income and Productivity Measurements. In National Academy of Engineering, Measures of Environmental Performance and Ecosystem Condition; The National Academies Press: Washington, DC, USA, 1999. [Google Scholar] [CrossRef]
- Hamilton, K.; Naikal, E.; Lange, G.-M. Natural Resources and Total Factor Productivity Growth in Developing Countries: Testing A New Methodology; Policy Research Working Paper; World Bank: Washington, DC, USA, 2019. [Google Scholar] [CrossRef]
- Agudelo-Vera, C.M.; Mels, A.R.; Keesman, K.J.; Rijnaarts, H. Resource management as a key factor for sustainable urban planning. J. Environ. Manag. 2011, 92, 2295–2303. [Google Scholar] [CrossRef]
- Millennium Ecosystem Assessment (MA). Ecosystems and Human Well-Being; Synthesis Island Press: Washington, DC, USA, 2005; p. 155. [Google Scholar]
- Ojea, E. Classifying Ecosystem Services for Economic Valuation: The case of forest water services. In Proceedings of the BIOECO Conference, Venice, Italy, 27–28 September 2010. [Google Scholar]
- Pinto-Bazurco, J. The Precautionary Principle. International Institute of Sustainable Development (IISD); Earth Negotiations Bulletin: Winnipeg, MB, Canada; Geneva, Switzeland, 2020. [Google Scholar]
- Fisher, E.; Jones, J.; von Schomberg, R. (Eds.) Implementing the Precautionary Principle: Perspectives and Prospects; Edward Elgar: Cheltenham, UK, 2006. [Google Scholar]
- Daly, H. Beyond Growth: The Economics of Sustainable Development; Beacon Press: Boston, MA, USA, 1997. [Google Scholar]
- Gowdy, J.; O’Hara, S. Weak sustainability and viable technologies. Ecol. Econ. 1997, 22, 239–247. [Google Scholar] [CrossRef]
- Ayres, R.; Van den Bergh, J.; Gowdy, J. Viewpoint: Weak Versus Strong Sustainability. Available online: https://papers.tinbergen.nl/98103.pdf (accessed on 7 July 2020).
- Pearce, D.W.; Atkinson, G.D. Capital theory and the measurement of sustainable development: An indicator of “weak” sustainability. Ecol. Econ. 1993, 8, 103–108. [Google Scholar] [CrossRef]
Figure 1.
Linear Economy Model—Inputs turn into outputs and emissions, which disappear.

Figure 2.
Circular Economy Model—Input, outputs, emissions, and waste create feedback loops.

Figure 3.
Energy Cost of Evaporation.

Figure 4.
Modeling Results for the United States.

Figure 5.
Modeling Results for China.


Table 1.
Physical Parametric Output Model for China and the United States.
| Country | Househ. (%) | Industr. (%) | Agric. (%) | Population (Million) | Genrate (USD/Kwh) | GDP (Trillion USD) | Entropy (%) |
|---|---|---|---|---|---|---|---|
| China | 7.8 | 16 | 59.7 | 1330 | 0.08 | 9.75 | 16.5 |
| US | 11 | 31.5 | 36 | 319 | 0.10 | 17.4 | 21.5 |
Table 2.
Modeling Results for Changes in Population and Energy Costs.
| Country | Population (Million) | Genrate (USD/Kwh) | GDP (Trillion USD) | Population (Million) | Genrate (USD/Kwh) | GDP (Trillion USD) |
|---|---|---|---|---|---|---|
| China | 1590 | 0.08 | 11.7 | 1330 | 0.16 | 19.5 |
| US | 350 | 0.10 | 19.1 | 319 | 0.20 | 34.8 |
Publisher’s Note: MDPI stays neutral with regard to jurisdictional claims in published maps and institutional affiliations. |
© 2021 by the authors. Licensee MDPI, Basel, Switzerland. This article is an open access article distributed under the terms and conditions of the Creative Commons Attribution (CC BY) license (https://creativecommons.org/licenses/by/4.0/).
Share and Cite
MDPI and ACS Style
Kakovitch, T.S.; O’Hara, S. Water and the Circular Economy: Learning from Nature. Sustainability 2021, 13, 12597. https://doi.org/10.3390/su132212597
AMA Style
Kakovitch TS, O’Hara S. Water and the Circular Economy: Learning from Nature. Sustainability. 2021; 13(22):12597. https://doi.org/10.3390/su132212597
Chicago/Turabian StyleKakovitch, Thomas S., and Sabine O’Hara. 2021. "Water and the Circular Economy: Learning from Nature" Sustainability 13, no. 22: 12597. https://doi.org/10.3390/su132212597
Note that from the first issue of 2016, this journal uses article numbers instead of page numbers. See further details here.