
Investigating the Drivers of Supply Chain Resilience in the Wake of the COVID-19 Pandemic: Empirical Evidence from an Emerging Economy


Department of Human Resources Management, Collage of Business, University of Jeddah, Jeddah 23454, Saudi Arabia
Sustainability 2021, 13(21), 11939; https://doi.org/10.3390/su132111939
Submission received: 4 September 2021
/
Revised: 19 October 2021
/
Accepted: 21 October 2021
/
Published: 28 October 2021
(This article belongs to the Topic Climate Change and Environmental Sustainability)
Abstract
:The COVID-19 pandemic has disrupted supply chain operations globally. Nevertheless, resilient firms have the capacity to combat an unprecedented situation with the right strategic approach. The current research has developed an integrated research model that combines factors such as supply chain intelligence, supply chain communication, leadership commitment, risk management orientation, supply chain capability and network complexity to investigate supply chain resilience. The research model of this study was empirically tested with 309 responses collected from supply chain managers. Results revealed that supply chain resilience is measured with supply chain intelligence, supply chain communication, leadership commitment, risk management orientation, supply chain capability and network complexity and demonstrated a substantial variance
of 0.548% towards supply chain resilience. Practically, this study suggests that supply chain managers should focus on factors such as big data analytics, risk management orientation,1 supply chain communication and leadership commitment to enhance supply chain resilience and sustainable supply chain performance.
1. Introduction
In this dynamic environment, the major challenge for supply chain practitioners is to deal with supply chain upheavals, disruption, and unforeseen events [1]. If a firm faces upheavals in supply chain operations and continue to perform, that situation is characterized by resilience [2]. Supply chain resilience is defined as operational capacity of a firm to return to its initial state after being disrupted and be stronger than before in a supply chain process [3]. The importance of supply chain resilience is highlighted in earlier studies [1,3,4,5]. According to Brandon-Jones et al. [1] firms are facing more disruption due to natural and manmade events and therefore resilience phenomenon should be investigated to understand how resilience help firms to recover quickly after disruption. In current situation wherein COVID-19 pandemic has left devastated impact global economy and badly affected supply chain operations and therefore organizations are now seeking resilient kind of strategies to confront unforeseen events [6,7].
Concerning supply chain disruption, the literature indicates that the pandemic has destabilized supply chain operations and negatively impacted customer needs requirements and satisfaction [5,8,9]. Therefore, the current study fills a research gap and develops an integrated supply chain resilience model with a combination of factors such as supply chain intelligence, supply chain communication, leadership commitment, risk management orientation, supply chain capability, network complexity and big data analytics to investigate supply chain resilience during the COVID-19 pandemic and sustainability supply chain performance in a post-pandemic context. To enhance supply chain resilience, the researcher has paid attention to supply chain intelligence and communication strategies. Supply chain intelligence is a process of integrating knowledge that is derived from suppliers, customers and competitors and using that knowledge to manage supply chain operations [10,11]. Therefore, communication is the extent to which a firm facilitates supply chain partners through communication, messages, and communication networks [12]. The impact of leadership commitment is found to be positive in measuring supply chain resilience. For instance, authors such as Speier, Whipple, Closs, and Voss [13] postulated that leadership commitment has been used as a foundation in designing and implementing supply chain strategies. Similarly, prior research conducted by Wieland and Marcus Wallenburg [14] confirmed that risk orientation reduces the failure chances in the supply chain process. Furthermore, supply chain capability and network complexity have shown a positive influence on measuring supply chain resilience [15,16].
The research model as shown in Figure 1 is extended with the moderating role of big data analytics. Big data analytics is identified as a combination of technologies, processes and techniques that enable organizations to collect, organize, visualize and analyze data and bring swiftness into supply chain operations [17]. The moderating effect of big data analytics is examined between supply chain resilience and sustainable supply chain performance. To the best of the authors knowledge, this study is the first that integrates factors such as leadership, technology and network factors altogether to investigate supply chain resilience and sustainable supply chain performance. This study is significant as it investigates the role of supply chain resilience and sustainable supply chain performance during the COVID-19 pandemic. In addition to that, the results of this research disclose several useful findings for the manufacturing industry to understand how to bring resilience in supply chain operations whenever they confront unforeseen events. The remaining part of the research is included in the literature review, methodology, data analysis, discussion and the conclusion of this study.
2. Literature Review
2.1. Supply Chain Intelligence and Communication
The concept of supply chain intelligence is extracted from knowledge-based resources and is explained as the extent to which a firm integrates knowledge that is derived from suppliers, customers and competitors and uses this to manage supply chain operations [11]. Supply chain intelligence is a process of knowledge integration among supply chain partners [11,18]. The use of a supply chain intelligence strategy gives a holistic view of the supply chain process and reduces disruption in supply chain operations [18,19,20]. Earlier studies have established that intelligence characteristics enable organizations to forecast accurately, reduce risk and make firms more resilient in response to supply chain uncertainty [18,19,21]. Therefore, communication is the extent to which a firm facilitates supply chain partners through communication, messages and communication networks [12] The literature has shown that intelligence and communication bring supply chain integration, responsiveness, information exchange and leverage to a higher supply chain performance [12,21,22]. A recent study conducted by Asamoah et al. [22] has confirmed that both communication and supply chain intelligence positively impact supply chain resilience. Therefore, the following hypotheses are proposed:
Hypothesis 1 (H1).
Supply chain intelligence significantly impacts SC resilience.
Hypothesis 2 (H2).
Supply chain communication significantly impacts SC resilience.
2.2. The Role of Leadership Commitment and Risk Management Orientation
The importance of leadership commitment is vital in planning, designing and implementing a supply chain strategy [15]. As suggested by Speier et al. [13] leadership commitment is considered as a foundation in the supply chain process. The literature has confirmed that a leader’s commitment motivates employees, brings pro-activeness and ensures that resources are being used adequately [13,23,24,25]. It is established that leadership commitment assists supply chain managers in implementing decisions transparently to avoid supply chain disruption, which, in turn, enhances resilience in operations [26,27]. Concerning risk orientation, earlier studies have confirmed that risk orientation reduces the failure chances in a supply chain process [14]. Organizations can handle uncertainty in a supply chain process through risk orientation, which ultimately boosts supply chain resilience [28,29,30]. Therefore, the following hypotheses are proposed:
Hypothesis 3 (H3).
Leadership commitment significantly impacts SC resilience.
Hypothesis 4 (H4).
Risk management orientation significantly impacts SC resilience.
2.3. Supply Chain Capability and Network Complexity
Supply chain capability denotes to the ability of a firm to identify, manage, and synchronize information that facilitates a firms internal and external supply chain operations [16]. The literature provides abundant evidence that the supply chain capability improves a firm’s operational and financial performance by reducing cost and enhancing resilience in supply chain operations [2,16,31]. Therefore, in the current research, we centered our attention toward the supply chain capability and resilience. According to Nishat Faisal, Banwet, and Shankar [32] strong coordination is required among supply chain partners to manage, forecast and replenish inventory. Authors such as Bhamra et al. [2] asserted that supply chain capability plays a vital role in the flow of goods, reduces lead time, brings transparency in supply chain operations, speeds up the payment cycle, reduces inventory and avoids over production. The network complexity is identified as the degree of connectivity between the network length and the number of nodes [15]. The complexity of the network is increased with an increase in the number of nodes and network length [4,13]. Thus, the researcher assumed that supply chain resilience may enhance with a decrease in the numbers of nodes and the network length. Therefore, the following hypotheses are proposed:
Hypothesis 5 (H5).
Supply chain capability significantly impacts supply chain resilience.
Hypothesis 6 (H6).
Decrease in network complexity significantly impacts supply chain resilience.
2.4. Big Data Analytics
Big data analytics is an emerging concept and is being acknowledged as a process that enables organizations to collect, process, store and analyze data further to obtain useful insights [17]. In a supply chain setting, big data analytics is conceptualized as a combination of technologies, processes and techniques that enable organizations to collect, organize, visualize and analyze data and bring swiftness to their supply chain operations [17]. The extant literature has confirmed the significant influence of big data in reducing SC disruption while increasing SC resilience [33,34,35,36,37,38]. According to Janssen et al. [34] data analytics is significantly related to the supply chain innovation process. Another study conducted by Dubey et al. [17] has confirmed that big data analytics positively impacts the predication of supply chain resilience. Following the above arguments and supported by [17]. the current research tests the moderating effect of BDA on the relationship of supply chain resilience and sustainable supply chain performance. Thus, the following hypotheses are proposed:
Hypothesis 7 (H7).
Resilience significantly impacts sustainable SC performance.
Hypothesis 8 (H8).
Big data analytics has a moderating impact on SC resilience and sustainable SC performance.
3. Research Methods
3.1. Designing Questionnaire and Instrument Development
In line with research objectives, the research framework of this study is developed under a quantitative and cross-sectional research approach. The researcher has followed a positivist paradigm to design the research in line with [39]. In addition to this, data are collected through research questionnaires. The research questionnaire in this study comprises construct items and demographic characteristics of the respondents. Construct items were developed by reviewing the literature and previously established scales. Scale items for network complexity were adopted from [15]. Risk management orientation scale is adopted from Wieland and Marcus Wallenburg [14] and then slightly adapted into the current research context. Supply chain resilience scale items were adopted from a previously developed scale by Brandon-Jones et al. [1] then slightly adapted. Scale items for the construct big data analytics were adopted from [17]. Supply chain communication scale items were adopted from [21]. Similarly, supply chain intelligence items were adopted from [22]. Therefore, supply chain capability scale was adapted from [16,22]. Scale items for leadership commitment were adapted from [7]. Construct items for sustainable supply chain performance were adopted from [40,41]. The scale items are measured using a 7-point Likert scale, where 1 denotes strongly disagree and 7 denotes strongly agree [42].
3.2. Sampling and Data Collection
This study uses an empirically tested research framework to examine supply chain resilience and sustainable supply chain performance. Therefore, manufacturing firms are selected as the unit of analysis in this research. Earlier studies have emphasized that manufacturing companies provide in depth understanding about supply chain operations and organizational performance [2,16,31]. The population of this research comprises supply chain managers working in manufacturing companies in Saudi Arabia. As suggested by M. Yamin [43] and consistent with prior power analysis, a sample of 300 respondents was selected for data analysis. Research data of this study were collected through an online research survey. Data were collected during the month of May 2021. The research survey was designed and conducted during COVID-19 pandemic; consequently, the researcher used online tools such as social media platforms, Google forms and email for data collection. Concerning respondent selection, the researcher selected respondents through a convenience sampling approach. For data collection, 750 questionnaires were forwarded to supply chain managers with a request to fill out an online research questionnaire according to their knowledge about supply chain resilience and sustainable supply chain performance. In response to the online research survey, 317 questionnaires were retrieved from respondents. Nonetheless, 8 questionnaires were discarded due to inadequate and inappropriate filling. Thus, a total of 309 responses were used for inferential analysis. Descriptive analyses were conducted with SPSS software. The results of the descriptive analysis revealed that the data set comprised 198 males and 111 females among 309 respondents. Similarly, the respondents’ ages were considered. The results indicate that the majority of the respondents 143 were found to be between 21 and 30 years. Next to this, 35 respondents were found to be between 41 and 50 years old. Furthermore, 131 respondents were aged between 31 and 40 years. Finally, data were estimated with a structural equation modeling (SEM) approach.
4. Data Analysis
4.1. Common Method Bias
The common method variance bias (CMV) needed to be examined before the inferential analysis to ensure that the research data had no bias [44]. Since the data were collected from a single source, a CMV issue may occur in this research [45,46]. Referring to the CMV issue, the literature has suggested two well-known methods, namely, procedural and statistical remedies [45,47,48,49]. Following the procedural method, the questionnaire items were jumbled up, consistent with [48]. Therefore, CMV is statistically confirmed with Harman’s single factor solution. Harman’s single factor solution suggests that the variance explained by the first factor must not be higher than 50% [48]. The results, as depicted in Table 1, indicate that the variance explained by the first factor is less than the threshold value (50%), hence confirming that CMV is not a potential issue in this study.
4.2. Structural Equation Modeling
The theoretical framework of this study was tested with a structural equation modeling (SEM) approach [42]. The researcher opted for a two-stage approach for the structural equation modeling computation, which included the assessment of a measurement model and a structural model [43,50]. The reliability and validity of the constructs was tested with a measurement model [43]. Therefore, the hypothesized relationship was confirmed with a structural model [51]. The data were evaluated with Smart PLS software using a partial least square (PLS) approach [52].
4.2.1. Assessing Measurement Model
The measurement model was examined to establish the construct’s validity and reliability. The convergent validity of the constructs was achieved with average variance extracted (AVE) following the criterion that that AVE values must be higher than 0.50. Nevertheless, the construct’s reliability was achieved following the values of (α) and composite reliability in line with Mohammad Ali Yousef Yamin and Sweiss [53] who suggested that the CR and Cronbach’s alpha values should be higher than 0.70, reflecting adequate construct reliability and validity. The findings, as depicted in Table 2, revealed the adequate reliability, validity and convergent validity of the constructs.
The measurement model had established the construct’s convergent validity and reliability. Therefore, Fornell and Larcker analysis was incorporated for the assessment of the construct’s discriminant validity [24,54]. The Fornell and Larcker analysis suggests that the square root values of the average variance extracted must be higher than the other constructs correlations [24]. The findings indicate that the square root of AVE is higher when compared with other constructs correlations, thus establishing the discriminant validity of the measure. The findings of the Fornell and Larcker analysis are tabulated in Table 3.
Although the Fornell and Larcker analysis was used extensively, it has some deficiencies in computation [54,55,56]. The cross-loading method was used in this study as an alternative method and consistent with earlier studies by [54]. The cross-loading method suggests that the indicator loading of the construct must be higher than corresponding constructs loading [57]. The results of the cross-loading method revealed that construct loadings are satisfactory when compared with the corresponding constructs loading and, therefore, establish the discriminant validity of the constructs. The results of the cross loading are exhibited in Table 4.
Prior studies have proposed Heterotrait-monotrait (HTMT) analysis for the testing of discriminant validity. HTMT analysis was introduced by Gold, Malhotra, and Segars [55] and suggests that the HTMT ratios must be lower than 0.85 or 0.90 to indicate the adequate discriminant validity of the constructs [55,56]. The results of the HTMT ratio analysis show that the HTMT values are less than 0.90 and hence, confirm the adequate discriminant validity of the variables. The values of HTMT are presented in Table 5.
4.2.2. Assessing Structural Model
The structural model tests the hypothesized relationship between variables. In order to mitigate the normality issue, data were bootstrapped with dummy data of 4000, as suggested by [58]. The results of the structural model are given in Table 6 comprising path value, standard error, t-statistics and the significance of the hypotheses.
The results of the structural model indicate that although the exogenous variables have a significant impact on supply chain resilience, the relationship between network capacity and supply chain resilience is insignificant. The following results indicate that supply chain intelligence significantly impacts supply chain resilience and support H1: β = 0.113 path; significance, p < 0.001 and t-statistics, 2.634. Supply chain communication has a positive impact on supply chain resilience and confirms H2: β = 0.183 path; significance, p < 0.001 and t-statistics, 2.859. Similarly, leadership commitment has revealed a positive impact on measuring supply chain resilience and statistically confirms H3: β = 0.210 path; significance, p < 0.001 and t-statistics, 2.635. The statistics show that both risk management orientation and supply chain capability have a positive impact on supply chain resilience and are supported by β = 0.326 path; significance, p < 0.001 and t-statistics, 4.012; β = 0.116 path, significance, p < 0.05 and t-statistics, 1.933, hence establishing H4 and H5. Contrary to the researcher, the relationship between the expected network complexity and supply chain resilience was found to be insignificant (β = 0.028 path; significance, p > 0.05 and t-statistics, 0.679) and, therefore, H6 is rejected. Finally, the supply chain resilience has shown a positive impact toward sustainable supply chain performance and confirms H7: β = 0.667 path; significance, p < 0.001 and t-statistics, 2.678, the results of hypotheses including path coefficient and significant level are shown in Appendix A.
4.2.3. Assessing Effect Size, Predictive Power and Coefficient of Determination
The effect size of the variables is examined through analysis [50,51]. According to Samar Rahi et al. [58] the coefficient of determination, reveals the collective impact of all the exogenous variables towards the criterion variable. Nevertheless, variable size as a single factor should be assessed with effect size analysis. The results demonstrate that in measuring the supply chain sustainable performance, the effect size of supply chain resilience is substantial and, therefore, a potential construct for managerial implication.
Concerning the coefficient of determination, the results of the structural model revealed that exogenous variables have a substantial variance of 0.548% on supply chain resilience. Similarly, the findings indicate a substantial variance of 0.550% in measuring sustainable supply chain performance, which was predicted by supply chain resilience and big data analytics. Aside from the substantial coefficient of determination for supply chain resilience and sustainable supply chain performance, the predictive power of the framework was computed. The result of the blindfolding method has established that the research model has substantial power to predict supply chain resilience and sustainable supply chain performance. The results of the effect size, predictive power and coefficient of determination are shown in Table 7.
4.2.4. Importance and Performance Analysis
The current research model has integrated numerous factors to determine sustainable supply chain performance. Therefore, the importance and performance of the variable are tested with importance performance matrix analysis (IPMA) consistent with earlier studies by [42,59]. Before applying IPMA analysis, it was important to choose an outcome variable. In this study, the researcher selected supply chain sustainable performance as the outcome variable. The findings of the importance performance analysis indicate that supply chain resilience has the highest importance/total effect in measuring sustainable supply chain performance. Therefore, the importance of big data analytics, risk management orientation, supply chain communication and leadership commitment show an intermediate level of importance. The results of the IPMA analysis are exhibited in Table 8 with the importance and performance indexes.
The importance of the constructs is observed through an IPMA map. The IPMA map exhibits that supply chain capability, intelligence and network complexity have less importance in measuring sustainable supply chain performance. Therefore, the importance of big data analytics, risk management orientation, supply chain communication, leadership commitment and supply chain resilience is considerable. Thus, managers and policy makers should focus on factors such as the importance of big data analytics, risk management orientation, supply chain communication, leadership commitment and supply chain resilience to enhance the sustainable supply chain performance in their organization. The IPMA map exhibited in Figure 2 clearly shows the performance of the constructs on the Y-axis and importance on the X-axis.
4.3. Moderating Effect of Big Data Analytics
The impact of technology is substantial in achieving the strategic goals of a firm [60]. In line with the above argument, this study has outlined big data analytics in a research model as moderating the variables between supply chain resilience and sustainable supply chain performance. The moderating effect of big data analytics was tested through a product indicator approach consistent with earlier studies by [53]. For statistical computation, the orthogonalization method was selected. The findings indicate that BD analytics moderates the relationship outlined between supply chain resilience and sustainable supply chain performance and statistically confirms H8 (β = 0.138; significant at p < 0.001; t-statistics, 4.094). Figure 3 exhibits the findings of the moderating effect.
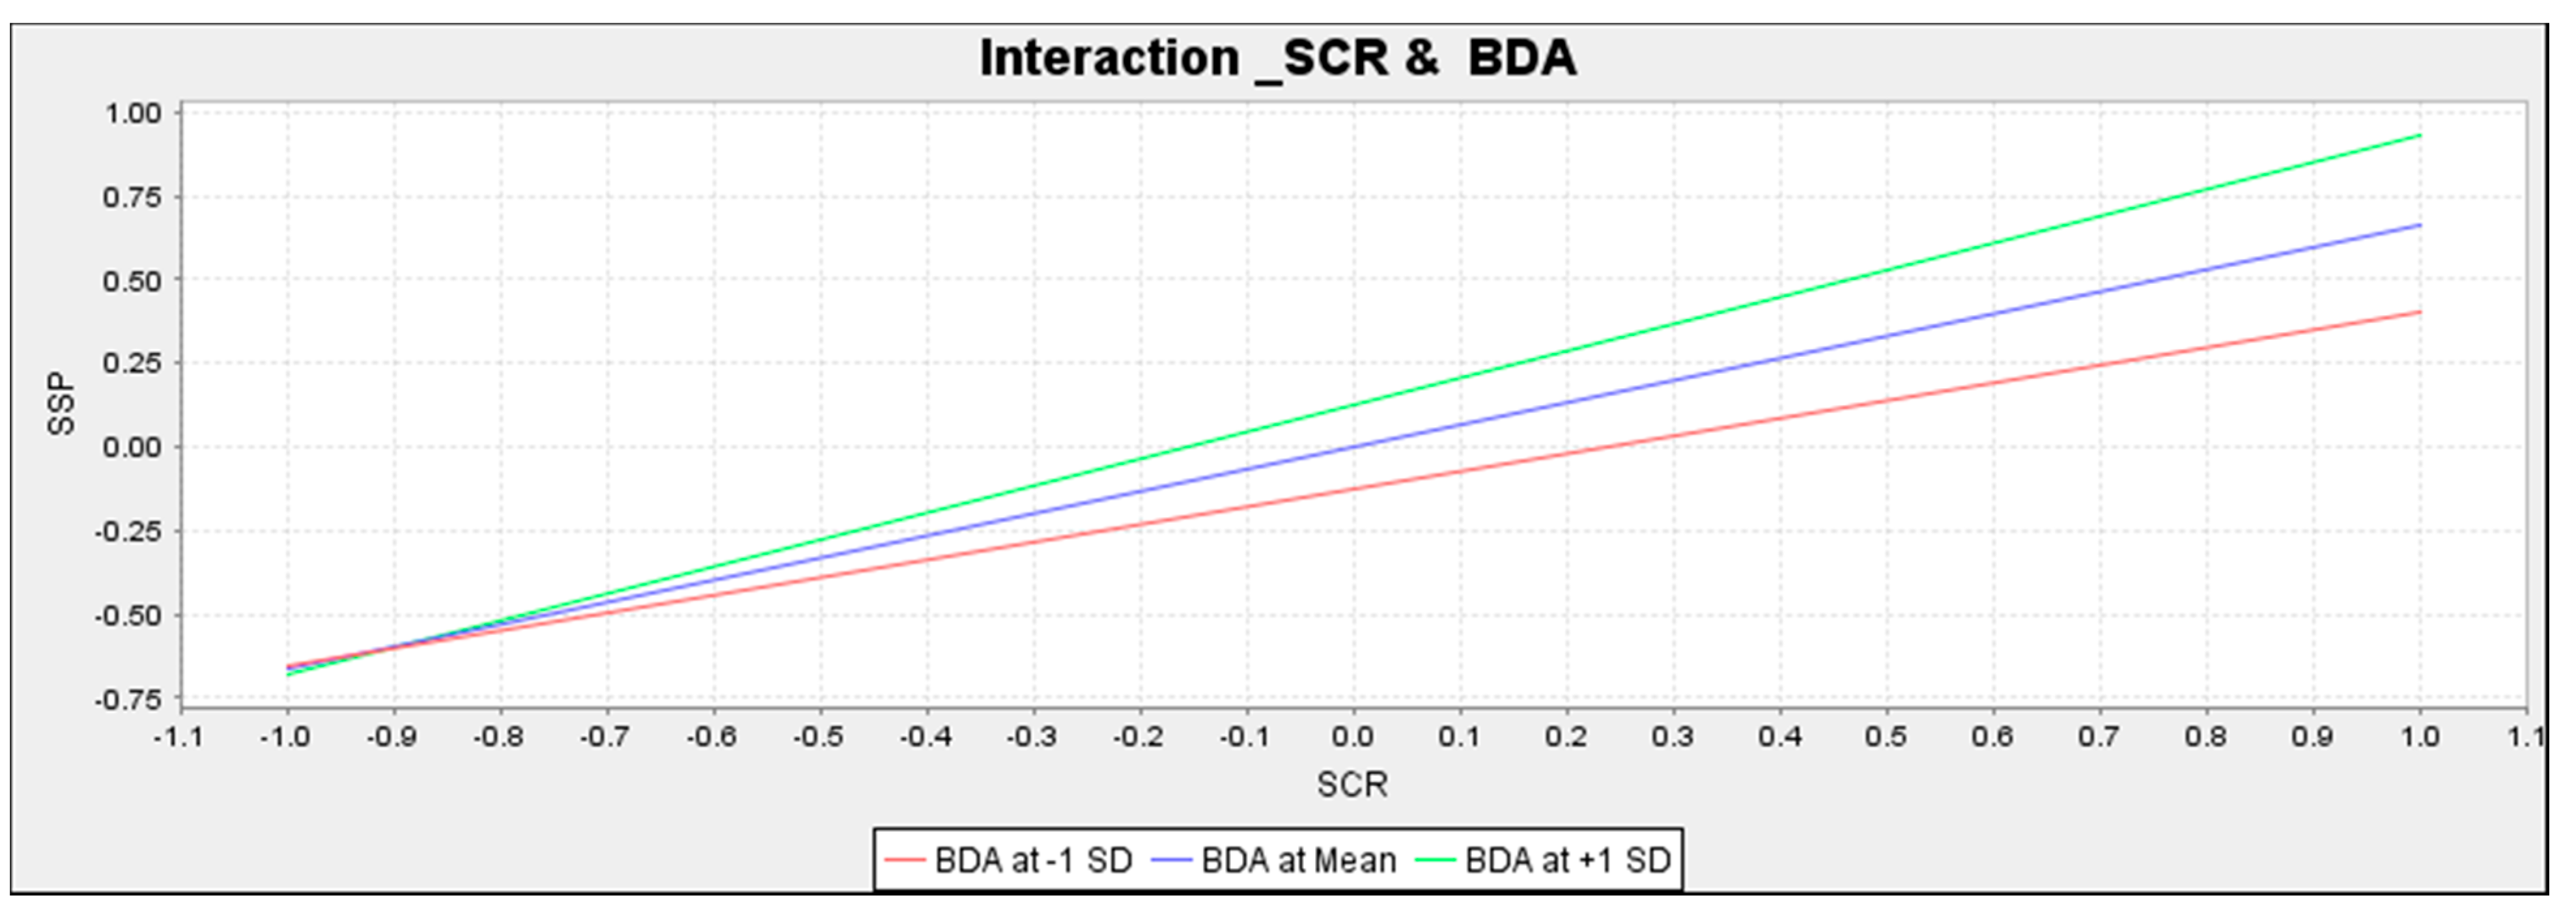
The moderating effect was further analyzed with simple slope analysis to test the strength of the moderating effect. According to S. Rahi [61] simple slope analysis reveals the trend of the moderating effect i.e., whether it moderates strongly or weakly. Nevertheless, the result of the simple slope analysis shows an upward BDA trend of +1SD on the green line compared to the negative BDA at −SD on the red line, which means that simple slope analysis has a declining trend. Nonetheless, the blue line indicates a neutral impact between the highest and lowest moderating effect. Hence, the result of the moderating effect establishes that the higher use of big data analytics in a supply chain operation will increase the supply chain resilience and sustainable supply chain performance. The simple slope analysis graph is displayed in Figure 4.
5. Discussion
The results of this research unfold interesting facts for both academic researchers and practitioners. The current research has synthesized the literature into two main streams. At the first stage, supply chain resilience is determined by supply chain intelligence, supply chain communication, leadership commitment, risk management orientation, supply chain capability, network complexity and the substantial variance of 54.8%. Therefore, the second stream of the literature focused on sustainable supply chain performance with supply chain resilience and big data analytics and revealed a considerable variance of 55.0% in sustainable supply chain performance. These findings established the theoretical validity of the research model in determining supply chain resilience and sustainability supply chain performance. Similarly, the literature has confirmed the moderating role of big data analytics between the relationship of supply chain resilience and sustainable supply chain performance. The moderating effect of big data analytics indicates that the higher use of BD analytics in supply chain operations will raise supply chain resilience and sustainable supply chain performance.
Concerning the hypothesized relationships, the findings of the structural model indicate that supply chain intelligence positively influences supply chain resilience, which is consistent with earlier studies by [11,18]. Similarly, supply chain communication has shown a positive impact on supply chain resilience, which is in line with [12,22,38]. Leadership commitment had revealed a positive impact on measuring supply chain resilience, which supports prior studies by [13,15]. Pointing to risk management orientation and supply chain capability, both factors have shown a positive impact on supply chain resilience, which was supported by earlier studies by [28,29,30]. Nevertheless, network complexity has shown an insignificant influence supply chain resilience that was beyond our expectations. Therefore, supply chain resilience has shown a positive impact toward sustainable supply chain performance, which is consistent with an earlier study by [17]. Following IPMA and effect size analysis, this research suggests that during the COVID-19 pandemic, supply chain resilience and sustainable supply chain process could be enhanced by focusing on factors such as big data analytics, risk management orientation, supply chain communication and leadership commitment.
Research Contribution to Theory and Practice
The findings of this research have contributed to theory and practice. For instance, the current research shows that factors such as supply chain intelligence, communication, leadership commitment, risk orientation, supply chain capability and network complexity positively relate to supply chain resilience. These findings clearly indicate that policy makers and supply chain managers should focus on the outlined factors to enhance supply chain resilience in supply chain operations. Another aspect of this research is to shed light on sustainable supply chain performance. The results of this study reveal that a sustainable supply chain is determined by supply chain resilience and big data analytics. Therefore, supply chain managers should improve supply chain resilience in order to improve sustainable supply chain performance. Aside from industry utilization, this research contributes to the academic literature by developing an integrated supply chain model that comprises market-oriented factors to determine supply chain resilience and sustainable supply chain performance. In addition to that, the variance explained by exogenous variables was substantial for supply chain resilience and sustainable supply chain performance, which, in turn, confirms the validity of the research model. Furthermore, this study contributes to information system literature by testing the moderating effect of big data analytics between supply chain resilience and sustainable supply chain performance. The findings establish that a higher use of big data analytics in supply chain operations will increase supply chain resilience and sustainable supply chain performance. Therefore, managers and policy makers should introduce big data analytics tools in supply chain operations to boost supply chain resilience and sustainable supply chain performance.
6. Conclusions
The aim of this study was to investigate factors that influence supply chain resilience and sustainable supply chain performance during the COVID-19 pandemic. The current study developed an integrated research model that combined factors such as supply chain intelligence, supply chain communication, leadership commitment, risk management orientation, supply chain capability and network complexity to investigate supply chain resilience. On the other side, the research model was extended with the moderating effect of big data analytics between the relationship of supply chain resilience and sustainable supply chain performance. The research model of this study was tested using structural equation modeling. The results of the structural model computation revealed that supply chain intelligence, supply chain communication, leadership commitment, risk management orientation, supply chain capability and network complexity have shown a substantial variance of 0.548% toward supply chain resilience. Therefore, supply chain resilience and big data analytics have an explanation to the variance of 0.550% in measuring sustainable supply chain performance. In addition to that, the validity of the research model was tested with predictive analysis using a blind folding procedure. The results of the predictive analysis revealed that the research model has large predictive power to predict supply chain resilience and sustainable supply chain performance 37.4% and 40.0%, respectively. This research contributes to the theory by developing an integrated research model toward supply chain resilience and sustainable supply chain performance. Therefore, for practical implications, this study suggests that supply chain managers should focus on factors such as big data analytics, risk management orientation, supply chain communication and leadership commitment to enhance supply chain resilience and sustainable supply chain performance. In addition to that, the moderating effect of big data analytics is confirmed between the relationship of supply chain resilience and sustainable supply chain performance. These findings established that the use of big data analytics in a supply chain operation will increase supply chain resilience and sustainable supply chain performance. Thus, supply chain managers and policy makers should incorporate big data analytics in supply chain operations to enhance supply chain resilience and sustainable supply chain performance.
Research Limitations and Future Direction
This research has some limitations that reveal a potential area of future research. First, this study was developed as an integrated supply chain research model that combined factors such as supply chain intelligence, supply chain communication, leadership commitment, risk management orientation, supply chain capability, network complexity and big data analytics to investigate supply chain resilience and sustainable supply chain performance phenomenon. Nevertheless, there are some other factors that could impact supply chain resilience such as supplier relationship, uncertainty and inter departmental coordination. Thus, extending the current research model with some additional factors could reveal interesting findings. Another limitation of this research is related to research design. The research design was based on a cross-sectional design and, therefore, respondents were restrained to participate at once in the research survey. It is expected that results may differ in a longitudinal research design. Therefore, the supply chain resilience phenomenon should be investigated with a longitudinal research design. The data were collected through a convenience sampling approach, which is a non-probability sampling approach. It is suggested that future researchers collect data through a probability sampling approach to mitigate any kind of sampling risk. The research model was designed from a developing countries perspective and tested the resilience behavior of a Saudi manufacturer. However, a future researcher may test the current research model in the context of other developing countries to enhance the generalizability of the research model.
Funding
This work is funded by the University of Jeddah, Jeddah, Saudi Arabia, under grant No. (UJ-21-DR-46). The authors, therefore, acknowledge with thanks the University of Jeddah technical and financial support.
Institutional Review Board Statement
Not Applicable.
Informed Consent Statement
Not Applicable.
Data Availability Statement
Delivered on demand.
Acknowledgments
Author would like to thank anonymous reviewers for the critical and constructive suggestions which in turn give an opportunity to rethink and reconstruct manuscript. In addition to that, author is grateful to the editor-in-chief and assistant editor for their humbleness during the revision process.
Conflicts of Interest
The author declares no conflict of interest. The authors declare that they have no known competing financial interests or personal relationships that could have appeared to influence the work reported in this paper.
Appendix A. Path Coefficient and Significance Level

References
- Brandon-Jones, E.; Squire, B.; Autry, C.W.; Petersen, K. A Contingent Resource-Based Perspective of Supply Chain Resilience and Robustness. J. Supply Chain Manag. 2014, 50, 55–73. [Google Scholar] [CrossRef] [Green Version]
- Bhamra, R.S.; Dani, S.; Burnard, K.J. Resilience: The concept, a literature review and future directions. Int. J. Prod. Res. 2011, 49, 5375–5393. [Google Scholar] [CrossRef]
- Bode, C.; Wagner, S.; Petersen, K.; Ellram, L.M. Understanding Responses to Supply Chain Disruptions: Insights from Information Processing and Resource Dependence Perspectives. Acad. Manag. J. 2011, 54, 833–856. [Google Scholar] [CrossRef]
- Blackhurst, J.; Dunn, K.S.; Craighead, C.W. An Empirically Derived Framework of Global Supply Resiliency. J. Bus. Logist. 2011, 32, 374–391. [Google Scholar] [CrossRef]
- Karmaker, C.L.; Ahmed, T.; Ahmed, S.; Ali, S.M.; Moktadir, M.A.; Kabir, G. Improving supply chain sustainability in the context of COVID-19 pandemic in an emerging economy: Exploring drivers using an integrated model. Sustain. Prod. Consum. 2021, 26, 411–427. [Google Scholar] [CrossRef]
- Belhadi, A.; Kamble, S.; Jabbour, C.J.C.; Gunasekaran, A.; Ndubisi, N.O.; Venkatesh, M. Manufacturing and service supply chain resilience to the COVID-19 outbreak: Lessons learned from the automobile and airline industries. Technol. Forecast. Soc. Chang. 2021, 163, 120447. [Google Scholar] [CrossRef] [PubMed]
- Kaynak, H. The relationship between total quality management practices and their effects on firm performance. J. Oper. Manag. 2003, 21, 405–435. [Google Scholar] [CrossRef]
- Butt, A.S. Strategies to mitigate the impact of COVID-19 on supply chain disruptions: A multiple case analysis of buyers and distributors. Int. J. Logist. Manag. 2021, ahead-of-print. [Google Scholar] [CrossRef]
- Jabbour, A.B.L.D.S.; Jabbour, C.J.C.; Hingley, M.; Vilalta-Perdomo, E.; Ramsden, G.; Twigg, D. Sustainability of supply chains in the wake of the coronavirus (COVID-19/SARS-CoV-2) pandemic: Lessons and trends. Mod. Supply Chain Res. Appl. 2020, 2, 117–122. [Google Scholar] [CrossRef]
- Paul, S.K.; Chowdhury, P.; Moktadir, A.; Lau, K.H. Supply chain recovery challenges in the wake of COVID-19 pandemic. J. Bus. Res. 2021, 136, 316–329. [Google Scholar] [CrossRef]
- Yang, J.; Xie, H.; Yu, G.; Liu, M. Achieving a just–in–time supply chain: The role of supply chain intelligence. Int. J. Prod. Econ. 2020, 231, 107878. [Google Scholar] [CrossRef]
- Barki, H.; Pinsonneault, A. A Model of Organizational Integration, Implementation Effort, and Performance. Organ. Sci. 2005, 16, 165–179. [Google Scholar] [CrossRef]
- Speier, C.; Whipple, J.M.; Closs, D.J.; Voss, M.D. Global supply chain design considerations: Mitigating product safety and security risks. J. Oper. Manag. 2011, 29, 721–736. [Google Scholar] [CrossRef]
- Wieland, A.; Wallenburg, C.M. Dealing with supply chain risks. Int. J. Phys. Distrib. Logist. Manag. 2012, 42, 887–905. [Google Scholar] [CrossRef] [Green Version]
- Durach, C.F.; Wieland, A.; Machuca, J.A. Antecedents and dimensions of supply chain robustness: A systematic literature review. Int. J. Phys. Distrib. Logist. Manag. 2015, 45, 118–137. [Google Scholar] [CrossRef] [Green Version]
- Wu, F.; Yeniyurt, S.; Kim, D.; Cavusgil, S.T. The impact of information technology on supply chain capabilities and firm performance: A resource-based view. Ind. Mark. Manag. 2006, 35, 493–504. [Google Scholar] [CrossRef]
- Dubey, R.; Gunasekaran, A.; Childe, S.J.; Wamba, S.F.; Roubaud, D.; Foropon, C. Empirical investigation of data analytics capability and organizational flexibility as complements to supply chain resilience. Int. J. Prod. Res. 2021, 59, 110–128. [Google Scholar] [CrossRef]
- Schoenherr, T.; Swink, M. The Roles of Supply Chain Intelligence and Adaptability in New Product Launch Success. Decis. Sci. 2015, 46, 901–936. [Google Scholar] [CrossRef]
- Handfield, R. Supply Market Intelligence: A Managerial Handbook for Building Sourcing Strategies, 1st ed.; CRC Press: New York, NY, USA, 2006. [Google Scholar]
- Yamin, M.A.Y.; Mahasneh, M.S. The Impact of Values-based Leadership on Ethical Loyalty in Saudi Arabian Health Organizations. Int. Rev. Manag. Mark. 2018, 8, 6–13. [Google Scholar]
- Zhang, Q.; Cao, M. Exploring antecedents of supply chain collaboration: Effects of culture and interorganizational system appropriation. Int. J. Prod. Econ. 2018, 195, 146–157. [Google Scholar] [CrossRef]
- Asamoah, D.; Agyei-Owusu, B.; Andoh-Baidoo, F.; Ayaburi, E. Inter-organizational systems use and supply chain performance: Mediating role of supply chain management capabilities. Int. J. Inf. Manag. 2021, 58, 102195. [Google Scholar] [CrossRef]
- Benedek, Z.; Fertő, I.; Marreiros, C.G.; de Aguiar, P.M.; Pocol, C.B.; Čechura, L.; Põder, A.; Pääso, P.; Bakucs, Z. Farm diversification as a potential success factor for small-scale farmers constrained by COVID-related lockdown. Contributions from a survey conducted in four European countries during the first wave of COVID-19. PLoS ONE 2021, 16, e0251715. [Google Scholar] [CrossRef]
- Fornell, C.; Larcker, D.F. Structural Equation Models with Unobservable Variables and Measurement Error: Algebra and Statistics. J. Mark. Res. 1981, 18, 382–388. [Google Scholar] [CrossRef]
- Yamin, M.A.Y. Examining the effect of organisational innovation on employee creativity and firm performance: Moderating role of knowledge sharing between employee creativity and employee performance. Int. J. Bus. Innov. Res. 2020, 22, 447–467. [Google Scholar] [CrossRef]
- Grötsch, V.M.; Blome, C.; Schleper, M.C. Antecedents of proactive supply chain risk management—A contingency theory perspective. Int. J. Prod. Res. 2013, 51, 2842–2867. [Google Scholar] [CrossRef]
- Hall, D.J.; Skipper, J.B.; Hazen, B.; Hanna, J.B. Inter-organizational IT use, cooperative attitude, and inter-organizational collaboration as antecedents to contingency planning effectiveness. Int. J. Logist. Manag. 2012, 23, 50–76. [Google Scholar] [CrossRef]
- Jüttner, U.; Maklan, S. Supply chain resilience in the global financial crisis: An empirical study. Supply Chain Manag. Int. J. 2011, 16, 246–259. [Google Scholar] [CrossRef]
- Lin, C.-C.; Wang, T.-H. Build-to-order supply chain network design under supply and demand uncertainties. Transp. Res. Part B Methodol. 2011, 45, 1162–1176. [Google Scholar] [CrossRef]
- Schmitt, A.J. Strategies for customer service level protection under multi-echelon supply chain disruption risk. Transp. Res. Part B Methodol. 2011, 45, 1266–1283. [Google Scholar] [CrossRef]
- Brusset, X.; Teller, C. Supply chain capabilities, risks, and resilience. Int. J. Prod. Econ. 2017, 184, 59–68. [Google Scholar] [CrossRef]
- Faisal, M.N.; Banwet, D.K.; Shankar, R. Information risks management in supply chains: An assessment and mitigation framework. J. Enterp. Inf. Manag. 2007, 20, 677–699. [Google Scholar] [CrossRef]
- Akter, S.; Wamba, S.F.; Gunasekaran, A.; Dubey, R.; Childe, S.J. How to improve firm performance using big data analytics capability and business strategy alignment? Int. J. Prod. Econ. 2016, 182, 113–131. [Google Scholar] [CrossRef] [Green Version]
- Janssen, M.; van der Voort, H.; Wahyudi, A. Factors influencing big data decision-making quality. J. Bus. Res. 2017, 70, 338–345. [Google Scholar] [CrossRef]
- Lai, Y.; Sun, H.; Ren, J. Understanding the determinants of big data analytics (BDA) adoption in logistics and supply chain management. Int. J. Logist. Manag. 2018, 29, 676–703. [Google Scholar] [CrossRef]
- Snapp, S. Is Big Data the Silver Bullet for Supply-Chain Forecasting? In Business Forecasting: The Emerging Role of Artificial Intelligence and Machine Learning; Gilliland, M., Tashman, L., Sglavo, U., Eds.; Wiley: Hoboken, NJ, USA, 2021; pp. 136–141. [Google Scholar]
- Wamba, S.F.; Akter, S.; Edwards, A.; Chopin, G.; Gnanzou, D. How ‘big data’ can make big impact: Findings from a systematic review and a longitudinal case study. Int. J. Prod. Econ. 2015, 165, 234–246. [Google Scholar] [CrossRef]
- Yu, W.; Zhao, G.; Liu, Q.; Song, Y. Role of big data analytics capability in developing integrated hospital supply chains and operational flexibility: An organizational information processing theory perspective. Technol. Forecast. Soc. Chang. 2021, 163, 120417. [Google Scholar] [CrossRef]
- Rowley, J. Designing and using research questionnaires. Manag. Res. Rev. 2014, 37, 308–330. [Google Scholar] [CrossRef]
- Gunasekaran, A.; Papadopoulos, T.; Dubey, R.; Wamba, S.F.; Childe, S.J.; Hazen, B.; Akter, S. Big data and predictive analytics for supply chain and organizational performance. J. Bus. Res. 2017, 70, 308–317. [Google Scholar] [CrossRef]
- Bag, S.; Wood, L.C.; Xu, L.; Dhamija, P.; Kayikci, Y. Big data analytics as an operational excellence approach to enhance sustainable supply chain performance. Resour. Conserv. Recycl. 2020, 153, 104559. [Google Scholar] [CrossRef]
- Hair, J.F., Jr.; Hult, G.T.M.; Ringle, C.; Sarstedt, M. A Primer on Partial Least Squares Structural Equation Modeling (PLS-SEM), 2nd ed.; Sage Publications: Thousand Oaks, CA, USA, 2016. [Google Scholar]
- Yamin, M. Examining the role of transformational leadership and entrepreneurial orientation on employee retention with moderating role of competitive advantage. Manag. Sci. Lett. 2020, 10, 313–326. [Google Scholar] [CrossRef]
- Rahi, S.; Mansour, M.M.O.; Alharafsheh, M.; Alghizzawi, M. The post-adoption behavior of internet banking users through the eyes of self-determination theory and expectation confirmation model. J. Enterp. Inf. Manag. 2021, ahead-of-print. [Google Scholar] [CrossRef]
- Podsakoff, P.M.; Organ, D.W. Self-Reports in Organizational Research: Problems and Prospects. J. Manag. 1986, 12, 531–544. [Google Scholar] [CrossRef]
- Sweiss, M.I.K.; Yamin, M.A.Y. The influence of organisational and individual factors on organisational innovation with moderating role of innovation orientation. Int. J. Bus. Innov. Res. 2020, 23, 103. [Google Scholar] [CrossRef]
- Podsakoff, P.M.; Bommer, W.H.; Podsakoff, N.P.; MacKenzie, S.B. Relationships between leader reward and punishment behavior and subordinate attitudes, perceptions, and behaviors: A meta-analytic review of existing and new research. Organ. Behav. Hum. Decis. Process. 2006, 99, 113–142. [Google Scholar] [CrossRef]
- Podsakoff, P.M.; MacKenzie, S.B.; Lee, J.-Y.; Podsakoff, N.P. Common method biases in behavioral research: A critical review of the literature and recommended remedies. J. Appl. Psychol. 2003, 88, 879–903. [Google Scholar] [CrossRef] [PubMed]
- Rahi, S.; Khan, M.M.; Alghizzawi, M. Extension of technology continuance theory (TCT) with task technology fit (TTF) in the context of Internet banking user continuance intention. Int. J. Qual. Reliab. Manag. 2020, 38, 986–1004. [Google Scholar] [CrossRef]
- Rahi, S.; Mansour, M.M.O.; Alghizzawi, M.; Alnaser, F.M. Integration of UTAUT model in internet banking adoption context. J. Res. Interact. Mark. 2019, 13, 411–435. [Google Scholar] [CrossRef]
- Yamin, M.A.Y. The relationship between right ethical behavior perspective, demographic factors, and best ethical performance. Int. Rev. Manag. Mark. 2020, 10, 27–39. [Google Scholar] [CrossRef]
- Ringle, C.M.; Wende, S.; Becker, J.-M. SmartPLS 3. Boenningstedt: SmartPLS. Available online: https://www.smartpls.com (accessed on 22 May 2021).
- Yamin, M.A.Y.; Sweiss, M.I.K. Investigating employee creative performance with integration of DeLone and McLean information system success model and technology acceptance model: The moderating role of creative self-efficacy. Int. J. Bus. Excel. 2020, 22, 396. [Google Scholar] [CrossRef]
- Yamin, M.A.Y.; Alyoubi, B.A. Adoption of telemedicine applications among Saudi citizens during COVID-19 pandemic: An alternative health delivery system. J. Infect. Public Health 2020, 13, 1845–1855. [Google Scholar] [CrossRef] [PubMed]
- Gold, A.H.; Malhotra, A.; Segars, A.H. Knowledge Management: An Organizational Capabilities Perspective. J. Manag. Inf. Syst. 2001, 18, 185–214. [Google Scholar] [CrossRef]
- Kline, R.B. Principles and Practice of Structural Equation Modeling, 3rd ed.; The Guilford Press: New York, NY, USA, 2011. [Google Scholar]
- Rahi, S.; Ghani, M.A.; Ngah, A.H. Factors propelling the adoption of internet banking: The role of e-customer service, website design, brand image and customer satisfaction. Int. J. Bus. Inf. Syst. 2020, 33, 549. [Google Scholar] [CrossRef]
- Rahi, S.; Ghani, M.A. Integration of DeLone and McLean and self-determination theory in internet banking continuance intention context. Int. J. Account. Inf. Manag. 2019, 27, 512–528. [Google Scholar] [CrossRef]
- Hair, J.F.; Ringle, C.M.; Sarstedt, M. Partial least squares structural equation modeling: Rigorous applications, better results and higher acceptance. SSRN J. 2013, 46, 1–12. [Google Scholar] [CrossRef]
- Ranjan, J.; Foropon, C. Big Data Analytics in Building the Competitive Intelligence of Organizations. Int. J. Inf. Manag. 2021, 56, 102231. [Google Scholar] [CrossRef]
- Rahi, S. Structural Equation Modeling Using SmartPLS, 1st ed.; CreateSpace Independent Publishing Platform: Scotts Valley, CA, USA, 2017. [Google Scholar]
Figure 1.
Research framework.
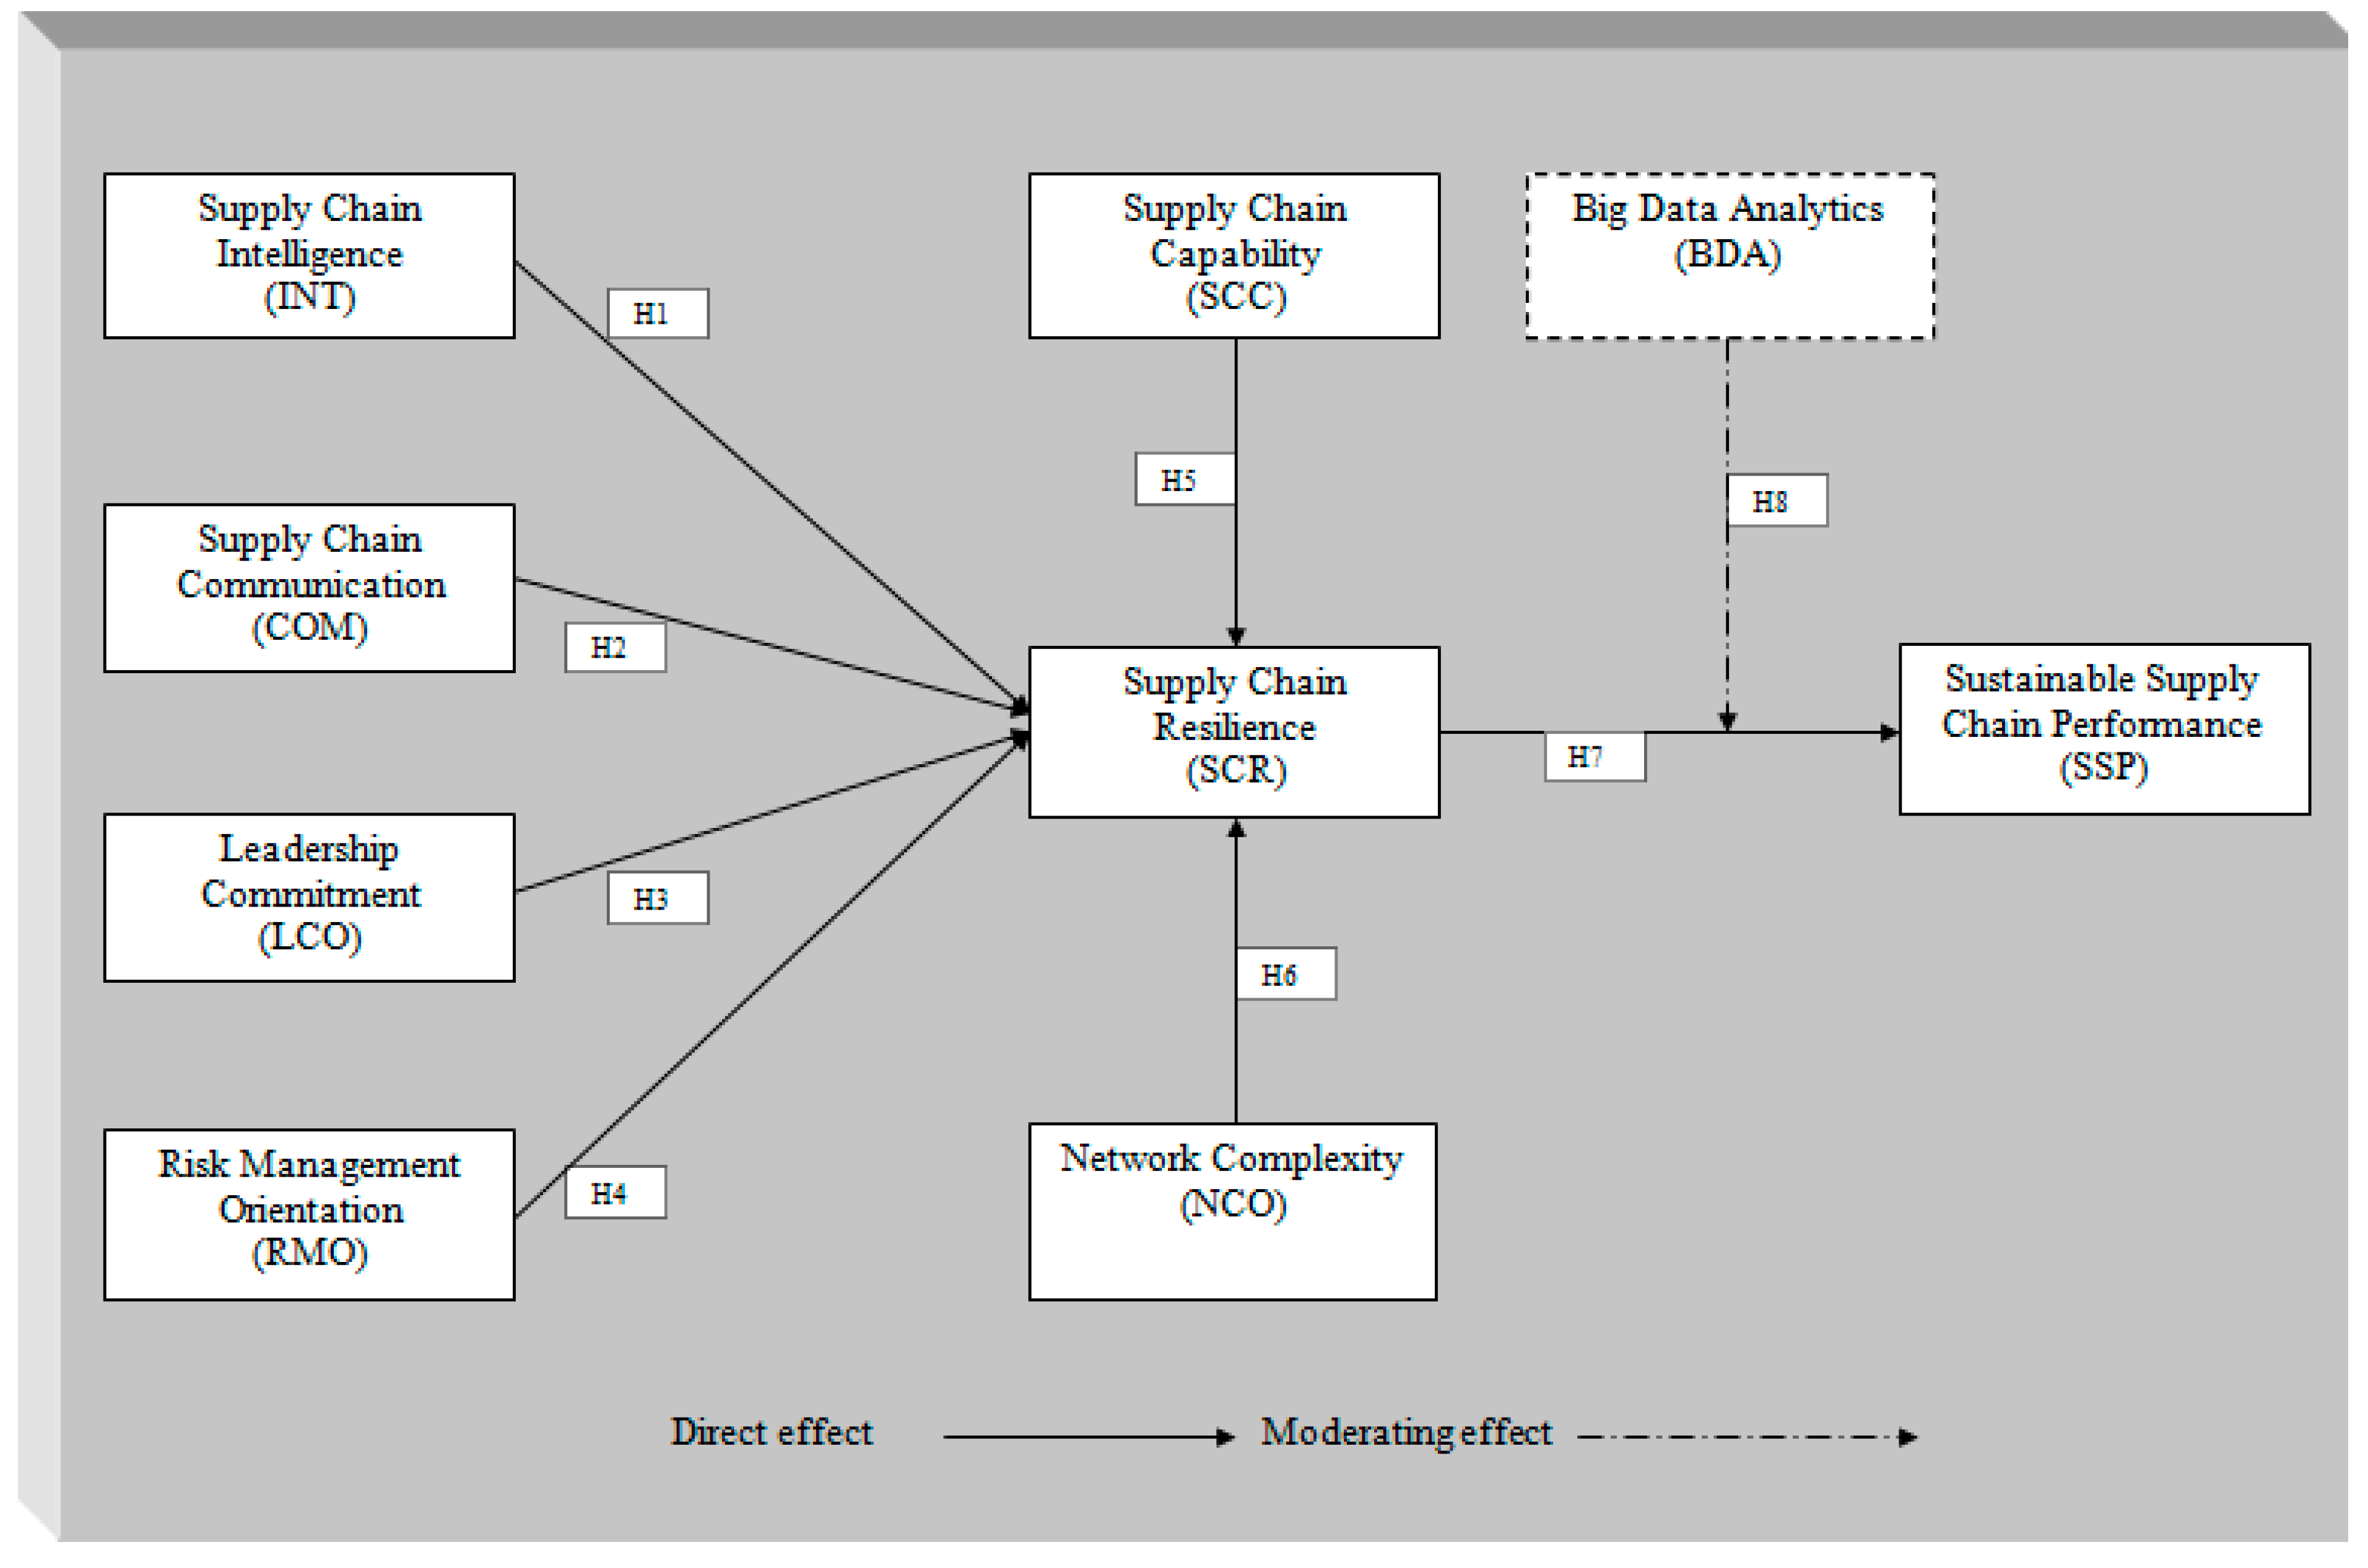
Figure 2.
IPMA analysis map.

Figure 3.
Moderating analysis.
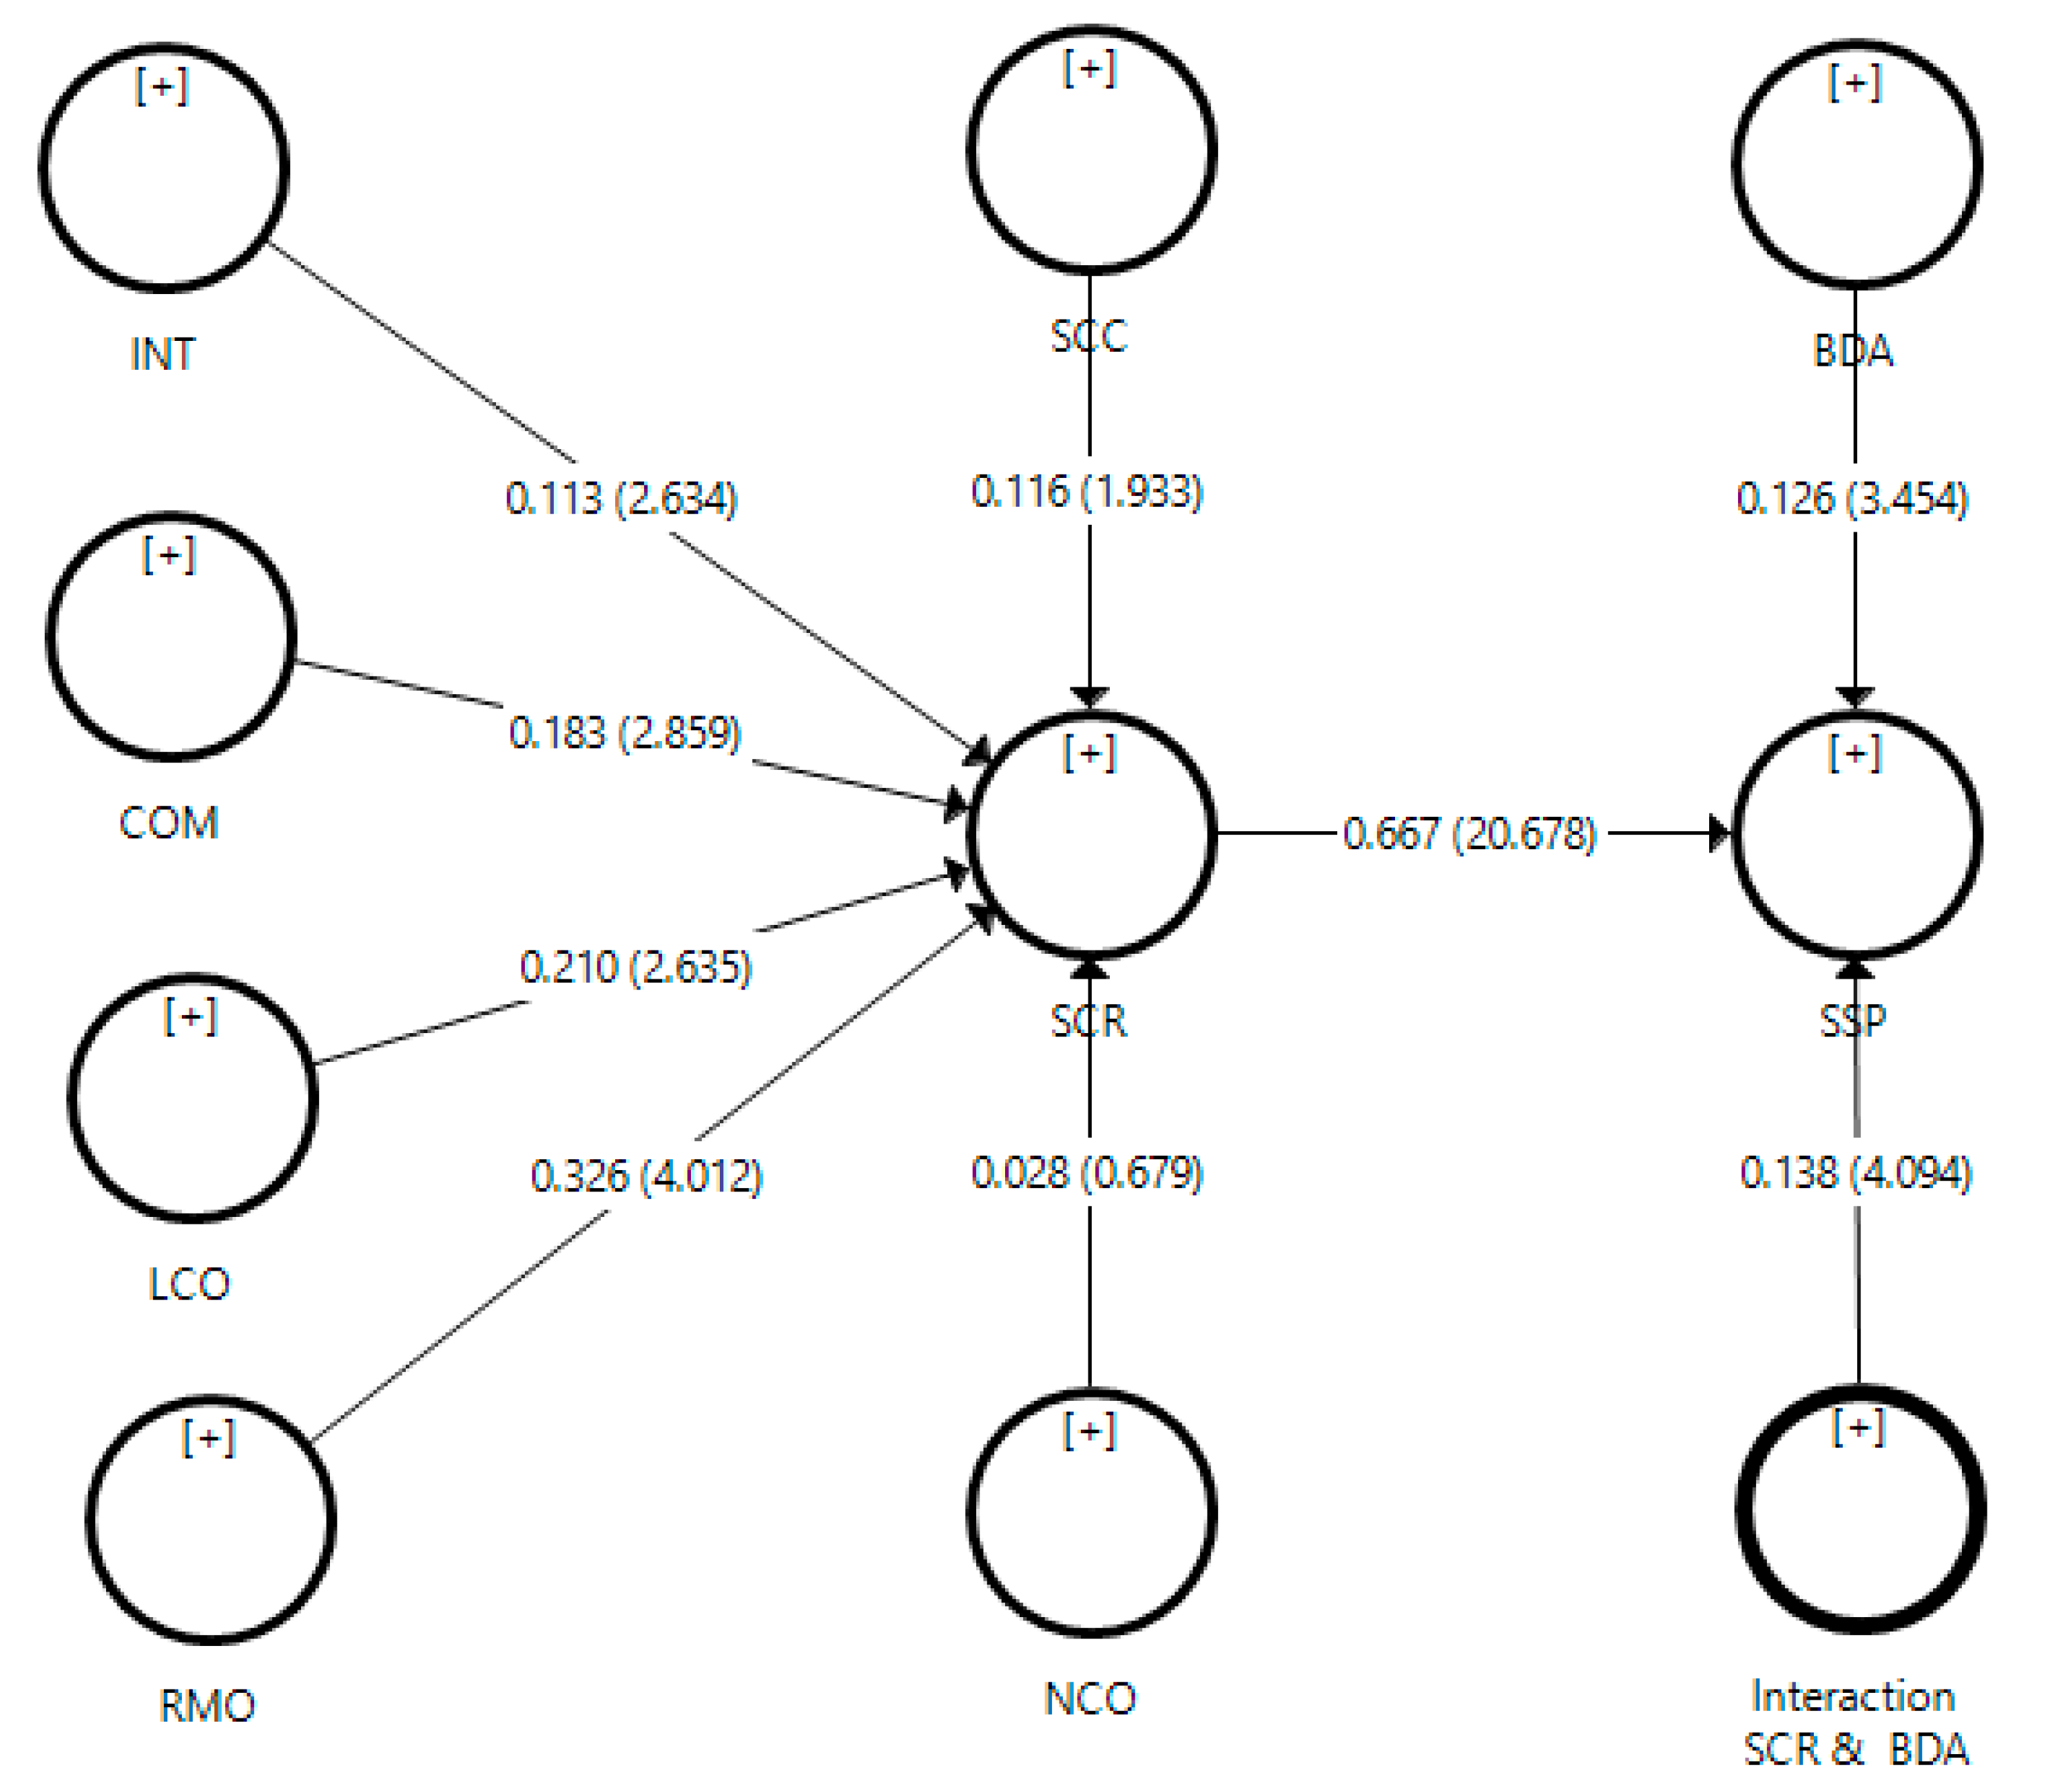
Figure 4.
Output of simple slope analysis.

Table 1.
Harman’s single factor analysis.
| Total Variance Explained | ||||||
|---|---|---|---|---|---|---|
| Factors | Eigenvalues | Extraction Sums of Squared Loadings | ||||
| Total | % of Variance | Cumulative % | Total | % of Variance | Cumulative % | |
| 1 | 9.422 | 23.737 | 23.737 | 9.422 | 23.737 | 23.737 |
Table 2.
Measurement model.
| Indicator | Loadings | (α) | CR | AVE |
|---|---|---|---|---|
| Big Data Analytics (BDA) | ||||
| BDA1: In this firm, advance data analytics tools are used to take decisions. | 0.824 | 0.757 | 0.861 | 0.673 |
| BDA2: In this firm, information is extracted using big data analytics to take decision. | 0.843 | |||
| BDA3: For data visualization, this firm use dashboard display to assist supply chain managers. | 0.793 | |||
| Supply Chain Communication (COM) | ||||
| COM1: This firm has multiple communication channels to facilitate supply chain operations. | 0.826 | 0.854 | 0.902 | 0.696 |
| COM2: This firm uses an integrated organizational system to communicate with stakeholders. | 0.841 | |||
| COM3: This firm uses the latest integrated communication tools for channel communication. | 0.825 | |||
| COM4: The use of frequent communication among supply chain partners enhances firm resilience. | 0.845 | |||
| Supply Chain Intelligence (INT) | ||||
| INT1: This firm is able to search, retrieve and store business information to boost supply chain operation. | 0.717 | 0.700 | 0.834 | 0.628 |
| INT3: This firm is ability to understand sales trends and customer preferences using integrated supply chain tools. | 0.869 | |||
| INT4: This firm uses integrated information retrieved from past events to deal with any kind of unprecedented situation. | 0.784 | |||
| Leadership Commitment (LCO) | ||||
| LCO1: The leadership of this organization is committed to handling all kinds of profit and loss. | 0.752 | 0.785 | 0.860 | 0.606 |
| LCO2: Leaders of this organization take responsibility for all the departments to tackle with unprecedented situation. | 0.798 | |||
| LCO3: Leaders of this organization support long term organizational goals. | 0.752 | |||
| LCO4: Leadership of this organization shows pro-activeness to recover business operations. | 0.809 | |||
| Network Complexity (NCO) | ||||
| NCO2: This organization invests heavily on infrastructure to reduce network complexity. | 0.802 | 0.788 | 0.876 | 0.702 |
| NCO3: In this organization, network complexity occurred due to unexpected changes in supply chain operations. | 0.853 | |||
| NCO4: This organization has a strategic plan to deal with supply chain nodes that reduce network complexity. | 0.858 | |||
| Risk Management Orientation (RMO) | ||||
| RMO2: Risks in this organization are monitored continuously and managed proactively. | 0.748 | 0.736 | 0.849 | 0.652 |
| RMO3: This organization has the ability to identify the source of disruption in a systematic way. | 0.820 | |||
| RMO4: This organization is efficient in assessing own risk, customer risk and supplier risk. | 0.852 | |||
| Supply Chain Capability (SCC) | ||||
| SCC1: In this firm, the information flow is more effective between the firm and supply chain partners. | 0.796 | 0.848 | 0.898 | 0.687 |
| SCC2: This firm has the capacity to handle follow-up activities proactively. | 0.836 | |||
| SCC3: This firm has strong coordination with stake holders for planning and forecasting. | 0.850 | |||
| SCC4: This firm has the competency to respond quickly to changing customer needs and demands. | 0.832 | |||
| Supply Chain Resilience (SCR) | ||||
| SCR1: This firm has the competency to recover supply chain operations quickly. | 0.845 | 0.876 | 0.915 | 0.729 |
| SCR2: In this firm, inventory flow would not take long to restore. | 0.863 | |||
| SCR3: This firm is able to restore operating performance. | 0.867 | |||
| SCR4: This firm has the capacity to deal with all kinds of supply chain disruption without any delay. | 0.840 | |||
| Sustainable Supply Chain Performance (SSP) | ||||
| SSP1: This firm has reduced buffer stock in the supply chain process. | 0.882 | 0.851 | 0.910 | 0.770 |
| SSP2: This firm is following all environmental standards according to customer requirements. | 0.889 | |||
| SSP3: This firm has controlled the supply chain wastage significantly. | 0.862 | |||
Table 3.
Discriminant validity.
| BDA | COM | INT | LCO | NCO | RMO | SCC | SCR | SSP | |
|---|---|---|---|---|---|---|---|---|---|
| BDA | 0.820 | ||||||||
| COM | 0.299 | 0.834 | |||||||
| INT | 0.465 | 0.244 | 0.792 | ||||||
| LCO | 0.400 | 0.323 | 0.386 | 0.778 | |||||
| NCO | 0.595 | 0.277 | 0.513 | 0.396 | 0.838 | ||||
| RMO | 0.390 | 0.315 | 0.384 | 0.897 | 0.352 | 0.808 | |||
| SCC | 0.271 | 0.706 | 0.262 | 0.318 | 0.279 | 0.325 | 0.829 | ||
| SCR | 0.407 | 0.470 | 0.408 | 0.653 | 0.367 | 0.662 | 0.455 | 0.854 | |
| SSP | 0.398 | 0.500 | 0.346 | 0.543 | 0.335 | 0.519 | 0.471 | 0.719 | 0.878 |
Table 4.
Cross loadings.
| BDA | COM | INT | LCO | NCO | RMO | SCC | SCR | SSP | |
|---|---|---|---|---|---|---|---|---|---|
| BDA1 | 0.824 | 0.232 | 0.388 | 0.360 | 0.564 | 0.371 | 0.257 | 0.365 | 0.352 |
| BDA2 | 0.843 | 0.273 | 0.332 | 0.298 | 0.442 | 0.284 | 0.229 | 0.306 | 0.311 |
| BDA3 | 0.793 | 0.233 | 0.422 | 0.322 | 0.450 | 0.298 | 0.177 | 0.325 | 0.312 |
| COM1 | 0.212 | 0.826 | 0.200 | 0.320 | 0.218 | 0.288 | 0.562 | 0.391 | 0.432 |
| COM2 | 0.242 | 0.841 | 0.186 | 0.264 | 0.195 | 0.266 | 0.533 | 0.415 | 0.409 |
| COM3 | 0.295 | 0.825 | 0.221 | 0.293 | 0.254 | 0.298 | 0.619 | 0.377 | 0.427 |
| COM4 | 0.252 | 0.845 | 0.210 | 0.202 | 0.259 | 0.199 | 0.646 | 0.384 | 0.400 |
| INT1 | 0.342 | 0.187 | 0.717 | 0.268 | 0.327 | 0.263 | 0.233 | 0.287 | 0.270 |
| INT3 | 0.409 | 0.190 | 0.869 | 0.328 | 0.433 | 0.332 | 0.187 | 0.352 | 0.282 |
| INT4 | 0.351 | 0.205 | 0.784 | 0.317 | 0.451 | 0.313 | 0.210 | 0.327 | 0.274 |
| LCO1 | 0.309 | 0.258 | 0.296 | 0.752 | 0.361 | 0.540 | 0.245 | 0.433 | 0.385 |
| LCO2 | 0.345 | 0.262 | 0.329 | 0.798 | 0.340 | 0.700 | 0.233 | 0.464 | 0.415 |
| LCO3 | 0.256 | 0.208 | 0.239 | 0.752 | 0.219 | 0.725 | 0.186 | 0.497 | 0.415 |
| LCO4 | 0.335 | 0.276 | 0.333 | 0.809 | 0.323 | 0.793 | 0.312 | 0.608 | 0.464 |
| NCO2 | 0.391 | 0.228 | 0.439 | 0.292 | 0.802 | 0.287 | 0.245 | 0.288 | 0.299 |
| NCO3 | 0.491 | 0.195 | 0.445 | 0.316 | 0.853 | 0.274 | 0.214 | 0.290 | 0.244 |
| NCO4 | 0.599 | 0.267 | 0.410 | 0.381 | 0.858 | 0.321 | 0.242 | 0.340 | 0.297 |
| RMO2 | 0.310 | 0.257 | 0.324 | 0.711 | 0.291 | 0.748 | 0.237 | 0.429 | 0.388 |
| RMO3 | 0.304 | 0.233 | 0.278 | 0.721 | 0.240 | 0.820 | 0.241 | 0.531 | 0.408 |
| RMO4 | 0.333 | 0.275 | 0.334 | 0.748 | 0.323 | 0.852 | 0.302 | 0.621 | 0.456 |
| SCC1 | 0.245 | 0.570 | 0.233 | 0.275 | 0.211 | 0.271 | 0.796 | 0.380 | 0.384 |
| SCC2 | 0.219 | 0.619 | 0.154 | 0.221 | 0.216 | 0.241 | 0.836 | 0.351 | 0.382 |
| SCC3 | 0.208 | 0.582 | 0.246 | 0.255 | 0.229 | 0.285 | 0.850 | 0.369 | 0.369 |
| SCC4 | 0.225 | 0.569 | 0.230 | 0.295 | 0.263 | 0.277 | 0.832 | 0.403 | 0.423 |
| SCR1 | 0.346 | 0.360 | 0.301 | 0.610 | 0.294 | 0.633 | 0.383 | 0.845 | 0.554 |
| SCR2 | 0.331 | 0.331 | 0.342 | 0.532 | 0.283 | 0.559 | 0.369 | 0.863 | 0.535 |
| SCR3 | 0.355 | 0.435 | 0.324 | 0.498 | 0.352 | 0.502 | 0.404 | 0.867 | 0.616 |
| SCR4 | 0.354 | 0.465 | 0.416 | 0.582 | 0.320 | 0.566 | 0.393 | 0.840 | 0.726 |
| SSP1 | 0.335 | 0.445 | 0.280 | 0.466 | 0.318 | 0.457 | 0.420 | 0.633 | 0.882 |
| SSP2 | 0.362 | 0.455 | 0.382 | 0.527 | 0.306 | 0.476 | 0.423 | 0.676 | 0.889 |
| SSP3 | 0.351 | 0.414 | 0.240 | 0.430 | 0.254 | 0.431 | 0.396 | 0.578 | 0.862 |
Table 5.
Heterotrait-Monotrait analysis.
| BDA | COM | INT | LCO | NCO | RMO | SCC | SCR | SSP | |
|---|---|---|---|---|---|---|---|---|---|
| BDA | |||||||||
| COM | 0.374 | ||||||||
| INT | 0.637 | 0.318 | |||||||
| LCO | 0.516 | 0.394 | 0.518 | ||||||
| NCO | 0.757 | 0.336 | 0.690 | 0.503 | |||||
| RMO | 0.519 | 0.398 | 0.536 | 0.170 | 0.460 | ||||
| SCC | 0.335 | 0.832 | 0.343 | 0.381 | 0.339 | 0.406 | |||
| SCR | 0.496 | 0.537 | 0.516 | 0.771 | 0.437 | 0.810 | 0.525 | ||
| SSP | 0.494 | 0.585 | 0.446 | 0.656 | 0.406 | 0.651 | 0.553 | 0.821 |
Table 6.
Results of the hypotheses.
| Hypothesis | Relationship | Path Coefficient | STDEV | T-Statistics | Significance | Decision |
|---|---|---|---|---|---|---|
| H1 | INT → SCR | 0.113 | 0.043 | 20.634 | 0.005 | Accepted |
| H2 | COM → SCR | 0.183 | 0.064 | 20.859 | 0.003 | Accepted |
| H3 | LCO → SCR | 0.210 | 0.080 | 20.635 | 0.005 | Accepted |
| H4 | RMO → SCR | 0.326 | 0.081 | 40.012 | 0.000 | Accepted |
| H5 | SCC → SCR | 0.116 | 0.060 | 10.933 | 0.028 | Accepted |
| H6 | NCO → SCR | 0.028 | 0.042 | 0.679 | 0.249 | Not Accepted |
| H7 | SCR → SSP | 0.667 | 0.032 | 20.678 | 0.000 | Accepted |
Table 7.
Measuring R2, f2 and Q2.
| Supply Chain Resilience | ||||
|---|---|---|---|---|
| Constructs | Findings | |||
| Supply Chain Resilience | 54.8% | 37.4% | ||
| Supply chain communication | 0.036 | Small | ||
| Supply chain intelligence | 0.019 | Small | ||
| Leadership commitment | 0.018 | Small | ||
| Network complexity | 0.001 | Small | ||
| Risk management orientation | 0.045 | Small | ||
| Supply chain capability | 0.014 | Small | ||
| Sustainable Supply Chain Performance | ||||
| Constructs | Findings | |||
| Sustainable Supply Chain Performance | 55.0% | 40.0% | ||
| Big data analytics | 0.030 | Small | ||
| Supply chain resilience | 0.826 | Substantial | ||
Table 8.
Results of IPMA.
| Constructs | Total Effects of Constructs | Total Performance of the Constructs |
|---|---|---|
| Big data analytics | 0.157 | 7.890 |
| Supply chain communication | 0.128 | 73.379 |
| Supply chain intelligence | 0.095 | 69.381 |
| Leadership commitment | 0.167 | 67.870 |
| Network complexity | 0.023 | 72.166 |
| Risk management orientation | 0.261 | 68.990 |
| Supply chain capability | 0.086 | 71.953 |
| Supply chain resilience | 0.690 | 66.904 |
Publisher’s Note: MDPI stays neutral with regard to jurisdictional claims in published maps and institutional affiliations. |
© 2021 by the author. Licensee MDPI, Basel, Switzerland. This article is an open access article distributed under the terms and conditions of the Creative Commons Attribution (CC BY) license (https://creativecommons.org/licenses/by/4.0/).
Share and Cite
MDPI and ACS Style
Yamin, M.A. Investigating the Drivers of Supply Chain Resilience in the Wake of the COVID-19 Pandemic: Empirical Evidence from an Emerging Economy. Sustainability 2021, 13, 11939. https://doi.org/10.3390/su132111939
AMA Style
Yamin MA. Investigating the Drivers of Supply Chain Resilience in the Wake of the COVID-19 Pandemic: Empirical Evidence from an Emerging Economy. Sustainability. 2021; 13(21):11939. https://doi.org/10.3390/su132111939
Chicago/Turabian StyleYamin, Mohammad Ali. 2021. "Investigating the Drivers of Supply Chain Resilience in the Wake of the COVID-19 Pandemic: Empirical Evidence from an Emerging Economy" Sustainability 13, no. 21: 11939. https://doi.org/10.3390/su132111939
Note that from the first issue of 2016, this journal uses article numbers instead of page numbers. See further details here.