Article

Stand Structure and Local Landscape Variables Are the Dominant Factors Explaining Shrub and Tree Diversity in Mediterranean Forests

1
Department of Agricultural & Forest Engineering, Universitat de Lleida, 25003 Lleida, Spain
2
Department of Agricultural and Forest Engineering-JRU CTFC-AGROTECNIO, Universitat de Lleida, 25003 Lleida, Spain
3
Department of Crop and Forest Science, University of Lleida, 25003 Lleida, Spain
4
USDA Forest Service International Visitor Program, College of Forestry, Oregon State University, Corvallis, OR 97333, USA
*
Author to whom correspondence should be addressed.
Sustainability 2021, 13(21), 11658; https://doi.org/10.3390/su132111658
Submission received: 20 September 2021 / Revised: 12 October 2021 / Accepted: 13 October 2021 / Published: 21 October 2021

Abstract

:
Plant diversity is a core value of forests and is rapidly becoming a primary management goal under the threat of global environmental changes. Changing conditions, including forestry interventions, or lack of them, may endanger its preservation. Abandonment of management in forests previously subjected to a multipurpose silviculture and secondary succession is hypothesized to have altered the biodiverse Mediterranean forests in recent years and affected plant diversity. We used data in national forest inventory plots and local landscape ecology metrics from forest cartography, combined with artificial neural networks, to predict richness and Shannon diversity indices for the tree and shrub layers of several Mediterranean forest types. We found that richness and diversity depend on forest structure and on local landscape patterns, and also, though to a lesser degree, on site conditions (mainly soil pH), but not on forest intervention. In order to benefit plant diversity in the forest landscapes analyzed, forest management practices need to promote diameter variety, the presence of large trees, tree cover, variation in the height of trees and shrubs, and a heterogeneous local landscape at the stand level. Aleppo pine forests and Scots pine forests showed more consistent results in their models than cork oak and black pine forests, both of which require further research.

1. Introduction

Biodiversity is an essential target for applied forestry, particularly after the United Nations Conference on Environment and Development in Rio de Janeiro, Brazil, in 1992 [1], but major forest threats persist, and biodiversity is expected to decline in this century [2]. The Mediterranean forests, with very high plant diversity (>100 tree species) and exceptionally rich in endemics [3], remain highly threatened [4,5], due to processes such as intensive agriculture, infrastructure development, tourism or urban sprawl, but particularly due to the pervasive rural exodus that has triggered extensive transformations on the previously fine-grained cultural Mediterranean mosaics since the 1950s [6] and the overarching climate change trends [7]. Forests under traditional silviculture (i.e., black pine forests) or multiple-use exploitation (i.e., cork oak forests) have been left largely unmanaged and consequently face an uncertain future. Forest expansion has taken place over agricultural and pasture land [8,9], joining past reforestations and wildfires in creating denser even-aged structures [10,11], in coarse-grained landscapes in which fuel build-up and a total fire exclusion policy have changed fire regimes [12]. Abandonment due to the increasingly marginal value of forests has become the main driver of the “inherent and associated biodiversity” of the Mediterranean forests [13], along with climate change [7]. Instead of leading towards rewilding or a forest transition to higher successional stages, abandonment has often led to landscape deterioration and ecosystem degradation [14], so it has been proposed that “biodiversity conservation in Mediterranean transition forests depends on finding viable ways of reversing the negative effects of rural land abandonment” [15], at landscape and stand scales. Environmental factors, such as the variable response of poor, marginal soils to abandonment [14,16], add complexity to decisions on how to manage fragile forest ecosystems in order to preserve diversity in the Mediterranean.
Plant diversity in forests is deeply related to forest functioning, so that forests with greater diversity are, in general, more productive [17], and their production is more stable [18,19]. Moreover, highly diverse forests are better able to cope with disturbances [20]; they are also more resilient (i.e., more ready to recover once a disturbance has ceased) [21]. Management of Mediterranean forests should therefore incorporate diversification as one of the goals of adaptive silviculture in a context of climate change [22]. Forest stewardship is needed to conserve Mediterranean forests, since it is recognized that appropriate silvicultural disturbances may aid in preserving and enhancing their diversity [23]. However, decreasing levels of management due to abandonment have introduced uncertainty in the current relations between receding forest management and plant diversity. The well-founded, Mediterranean adaptive forest management applied in the past was based on the preventive analysis of species composition, stand structure, site-index and main forest function to approximate a desirable state though successive interventions; the silvicultural practice aimed at the preservation of structure and species diversity and the “enhancement of elementary aggregates, namely the cohorts scattered inside each management unit”, besides protection against risks [13]. Under the current unmanaged state of many forests, we do not have a good understanding of how structural features relate to actual plant diversity across a wide variety of Mediterranean forest types. It is our hypothesis that forest stands with structures created under past management practices, later progressively abandoned, may have lower plant diversity when compared to stands that have retained even low-level management interventions.
Previous studies have shown the connection between forest structure and plant diversity, which we also wanted to test, and how it is linked to variables such as diameter size distribution, heights, basal area, wood stock, vegetation cover in different layers of the forest (vertical structure [24]), or tree density and age [25,26,27], all of which are modifiable by management [28]. Management directed at changing stand structure variables can significantly affect plant diversity in the understory by altering environmental factors such as light and water availability [29,30,31,32,33,34]. Nevertheless, factors other than forest structure, such as soil characteristics or stage of development (crop age [24]) can influence plant community composition and diversity. Recently, Wei et al. [35] found few differences in understory diversity between managed and unmanaged stands abandoned 20 to 40 years before. They found soil micro-environment and stand characteristics (basal area, shrub cover) more influential on understory diversity than management in temperate oak forests in northern France. Previous work also suggests that not only soils or stand structure but also local landscape characteristics influence Mediterranean plant diversity [15,36,37], and these are also modifiable by management. Landscape ecology has provided many indices or metrics to measure the heterogeneity and spatial characteristics of local patterns around stands, which can help explain disparities in forest composition and related biodiversity [38]. Katayama et al. [39] found heterogeneity metrics to be “good surrogates of species diversity because, in ecology, habitat diversity is associated with an increase in niche availability for species”. The use of landscape metrics as explanatory variables when analyzing the diversity associated with different forest types can improve diversity models’ performance [36,40]. Understanding how changes in local landscape patterns affect species diversity at the stand level is critical to efficiently improve forestry practices linked to sound environmental policies and landscape management [36]. A better knowledge of relations between local metrics and plant diversity could provide alternative ways to approach monitoring and predictive modelling of plant diversity [41].
Hence, there is a critical need for quantitative indicators of desirable features in forest stand structures and best local landscape configurations to implement effective monitoring and management programs for the maintenance or improvement of plant diversity, as the support system for other forms of biodiversity [42,43]. Given the scarcity of studies for Mediterranean abandoned or secondary succession forests on plant diversity and their association with forest characteristics and landscape structure, the purpose of this work was to test the relations between stand-level features and local landscape characteristics with plant diversity measures, namely, richness and Shannon diversity indices for the tree and shrub layers of several Mediterranean extensive forest types in the northeast of Spain. “Plant diversity” is used here in relation to trees and shrubs only, as data for herbs, grasses, and forbs was not available in our data sources. The identification of forest features significantly related to plant diversity, in conjunction with management evidence or absence, would allow us to test our hypothesis and improve conservation measures through forest management interventions targeting said features and the formulation of management priorities under the reduced budgets affecting the increasingly marginal Mediterranean forests.

2. Materials and Methods

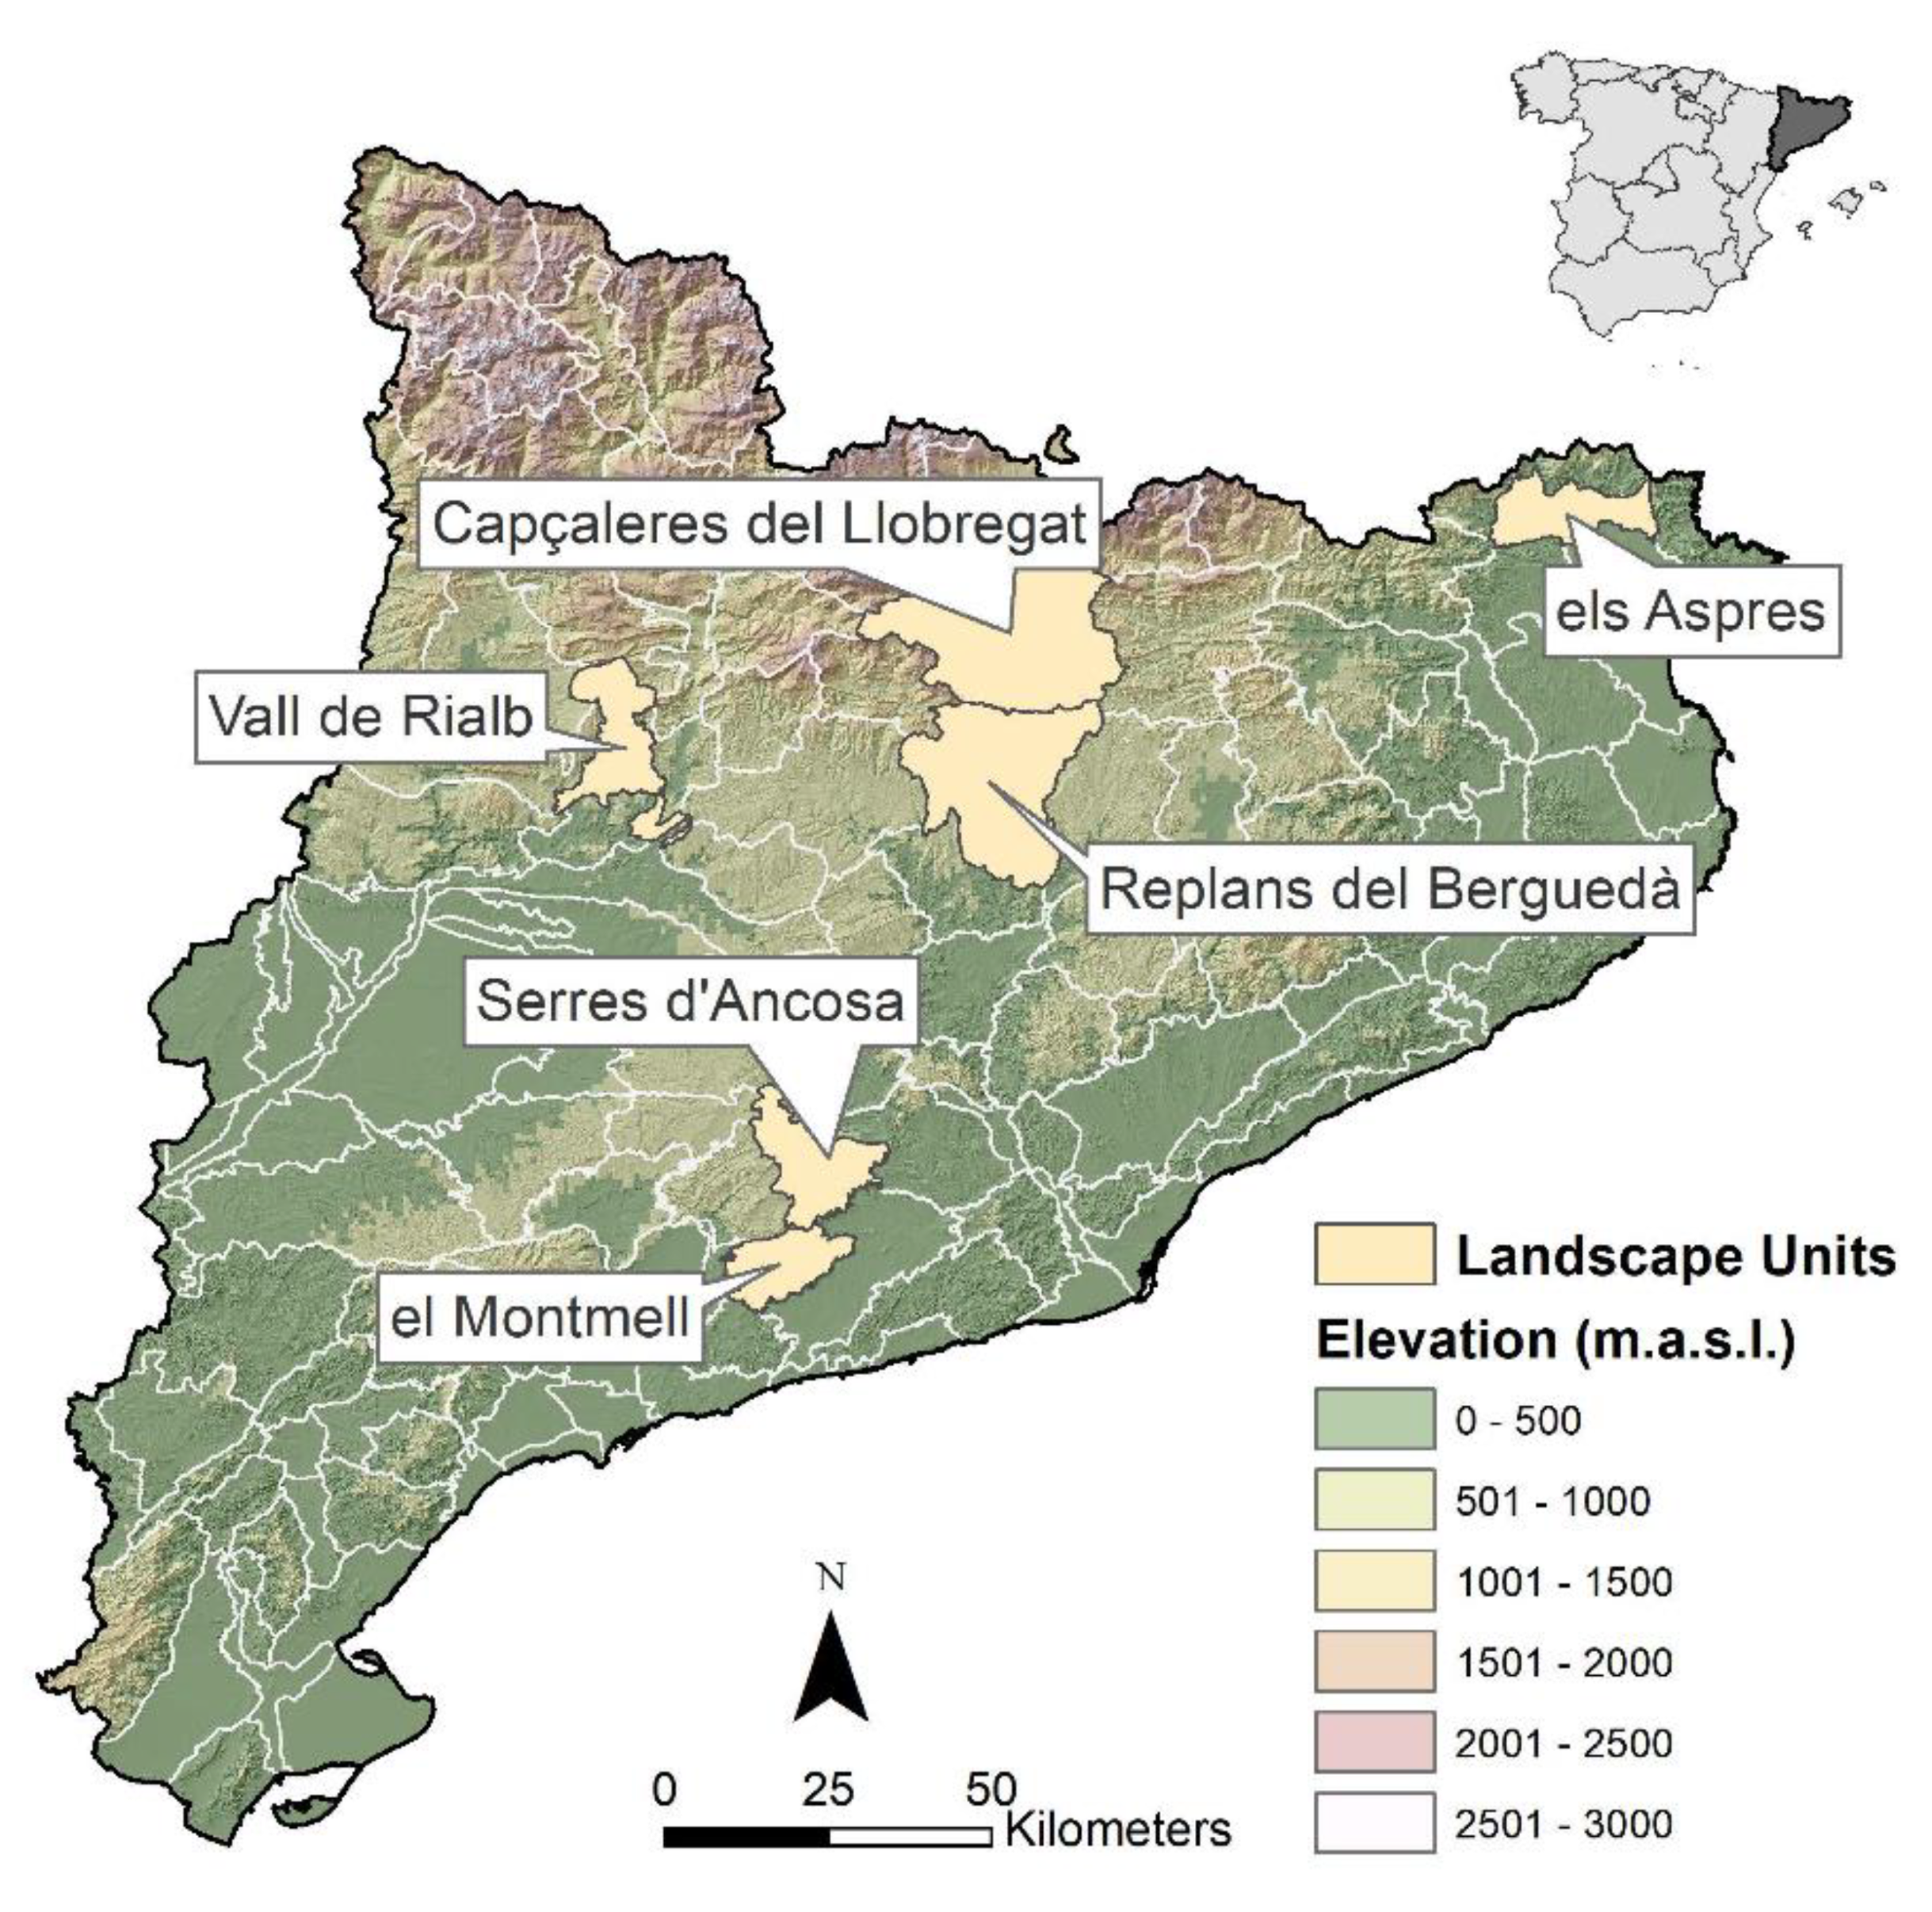
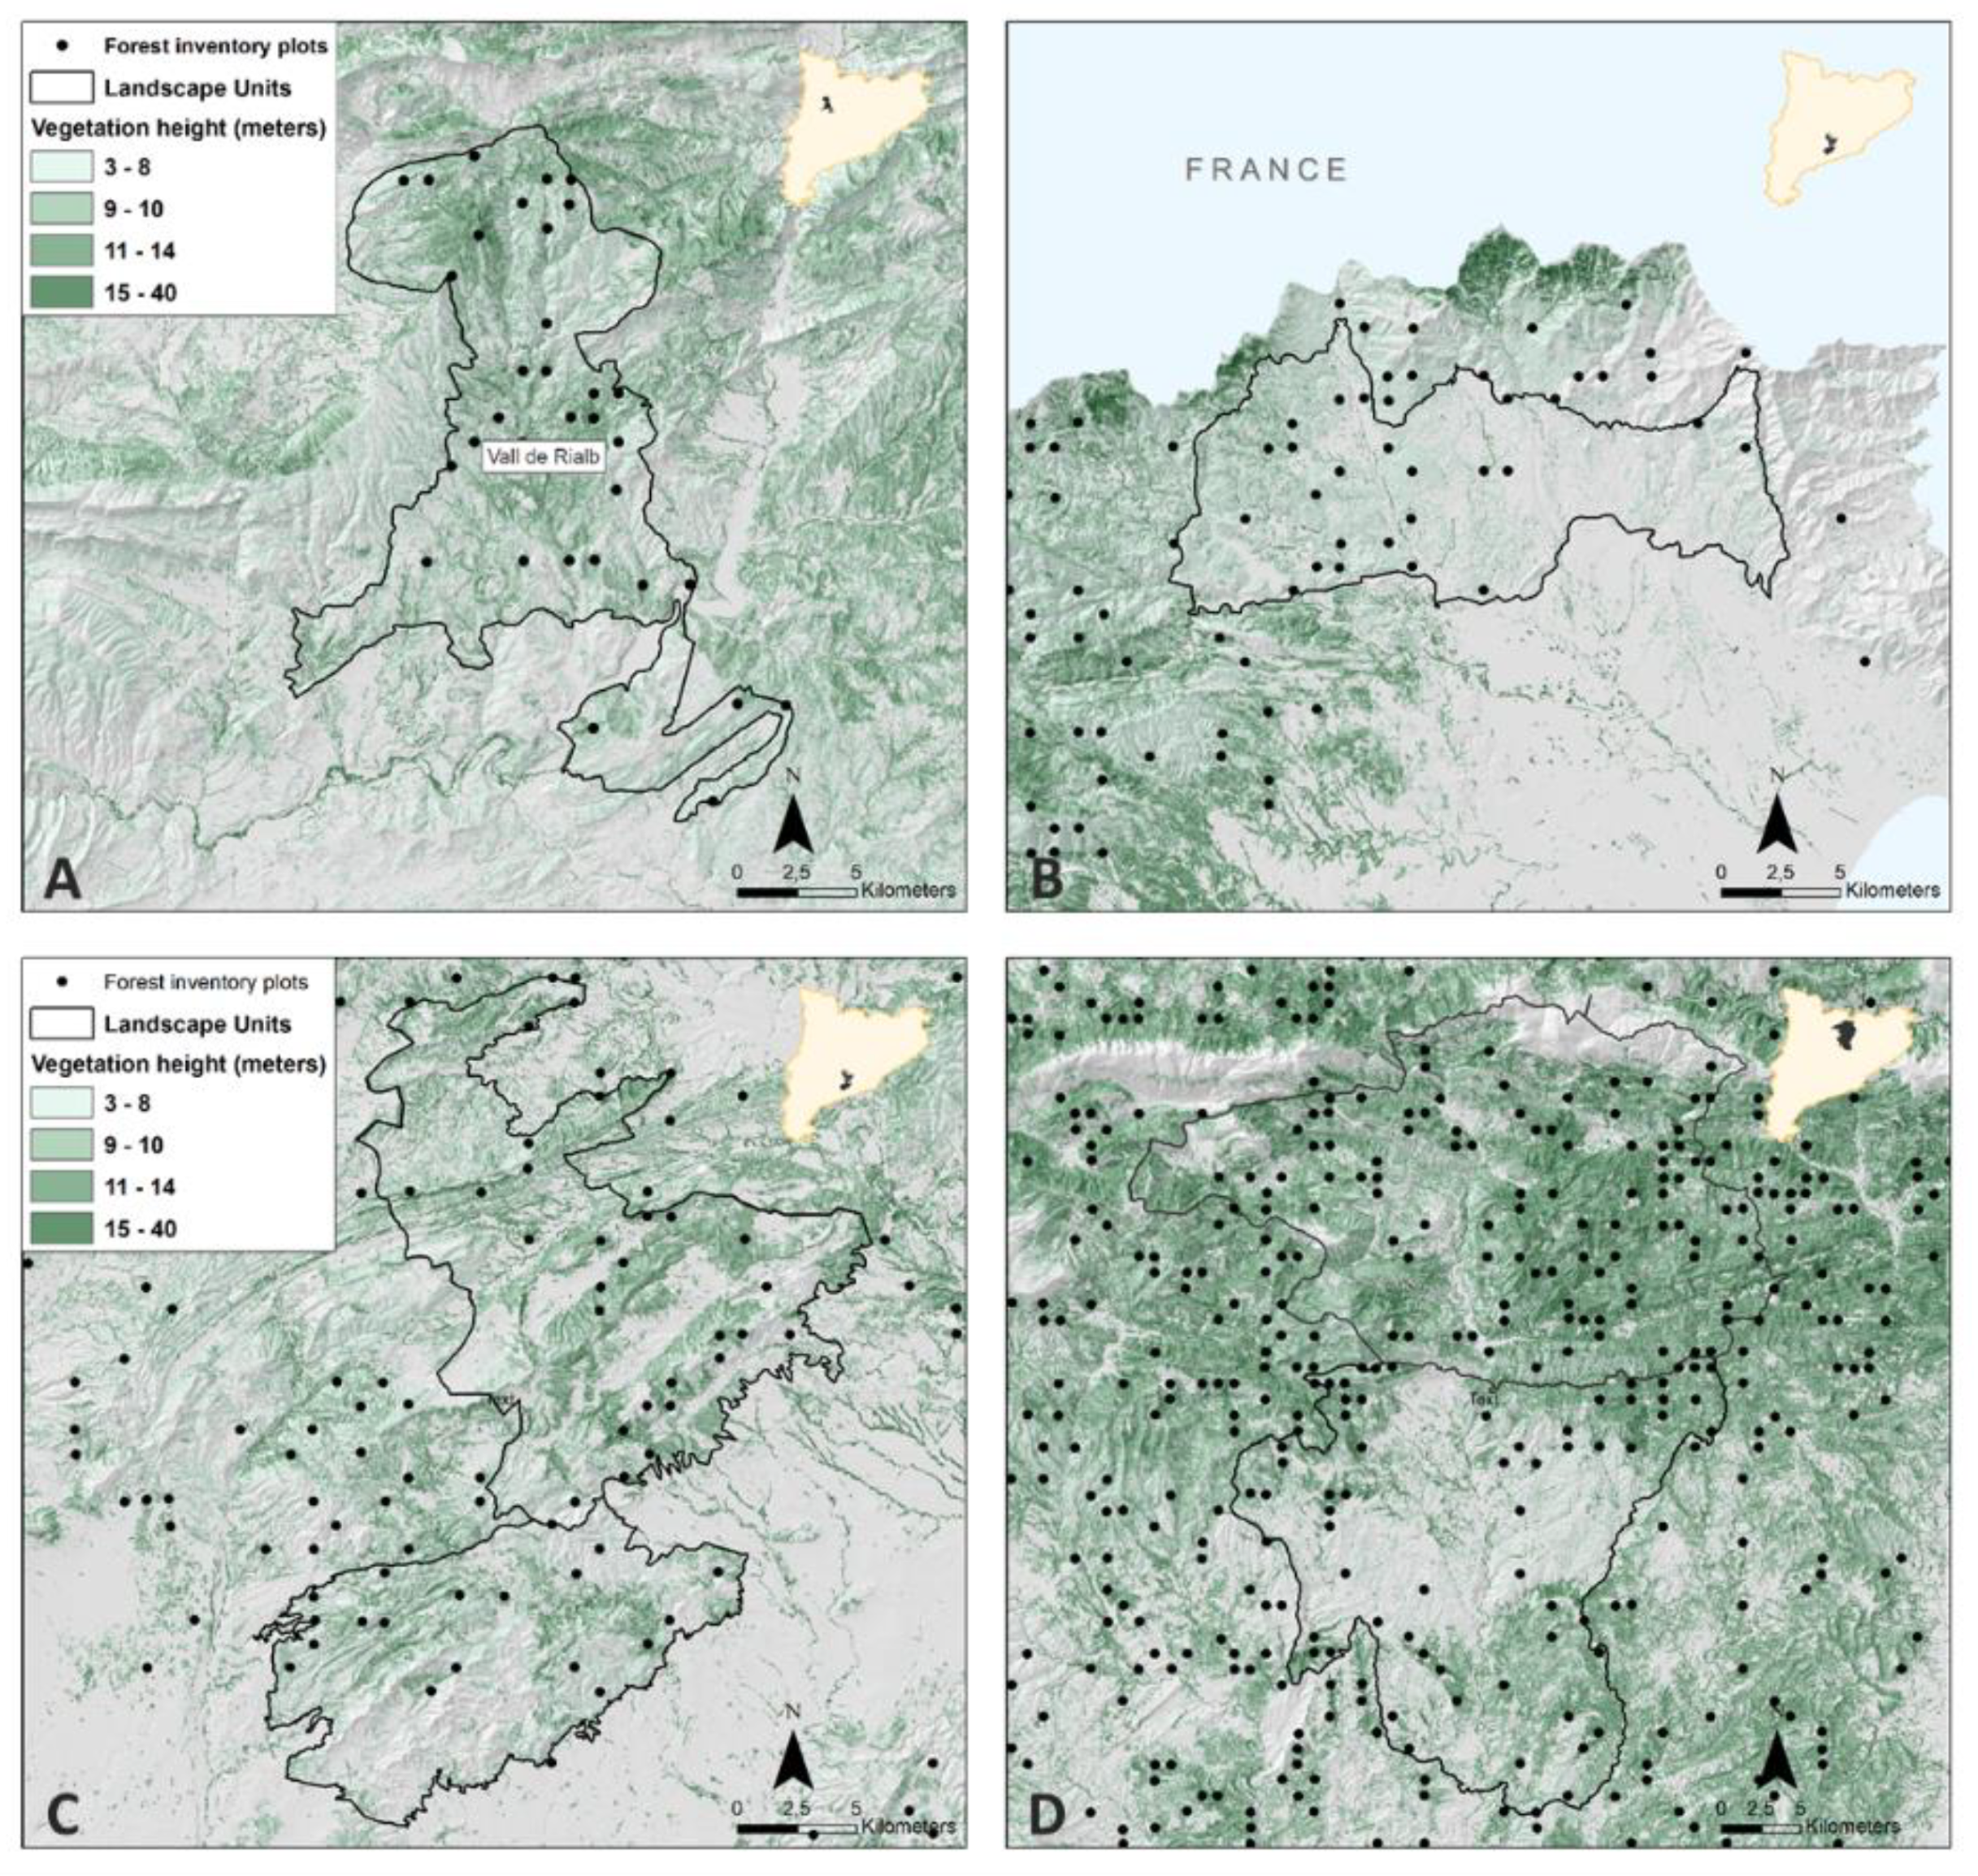
2.1. Study Area and Data Source

We selected six landscape units (LUs) in the region of Catalonia (NE Spain), located within 0°15′ E and 3°15′ E longitude and 40°30′ N and 42°40′ N latitude, encompassing several Mediterranean forest types (Figure 1). The landscape units were a distinctive representation of pervasive Mediterranean forest types under continental Mediterranean conditions and were delimited in a landscape character assessment catalogue published by the Govern of Catalonia [Link], containing internally homogeneous ecological, managerial and socioeconomic conditions. These landscape units were the selected sites for a LIFE project (CLIMARK LIFE16 CCM/ES/000065, in Catlonia and Veneto, Italy) focused on forest management promotion through a climatic credit based on carbon, water and biodiversity as main ecosystem services, which warranted the biodiversity and representative value of the units for our study.
Montmell LU (35,163 ha) mainly contained stands of Aleppo pine (Pinus halepensis Mill.) in varied condition and several stages after post-fire regeneration, alternating with crops and maquias. Serres d’Ancosa LU (52,888 ha) had mature stands of Aleppo pine, a secondary forest with a shrub layer often described as rich, including Pistacea lentiscus, Viburnum tinus, Quercus coccifera, Erica multiflora, and many other shrub species. Vall de Rialb LU (120,051 ha) encompassed extensive mature stands of adult black pine (Pinus nigra Arn.), irregularly and scarcely mixed with oaks (Quercus faginea L., Quercus ilex L.) prevented from gaining more presence by a marginal forest explotation in decline. Aspres LU (43,431 ha) was covered by young, post-fire and adult stands of cork oak (Quercus suber L.) traditionally managed for cork production. Replans de Berguedà LU (118,862 ha) alternated young stands under post-fire regeneration and mature stands of Scots pine (Pinus sylvestris L.), while Capçaleres del Llobregat LU (152,325 ha) was covered predominantly by mature stands of Scots pine, with intermittent presence of other species depending on the varied altitudinal gradient (Quercus pubescens, Acer opalus, Sorbus domestica, Populus tremula, Acer campestris, Tilia platyphyllos, Fagus sylvatica, Abies alba). A full list of species identified in each LU is included in Appendix A.
We used National Forest Inventory (NFI) data to characterize the general structure of the selected forest types. National Forest Inventories (NFIs) have gained value over the last decades in natural resources management [44], particularly in biodiversity conservation [45,46]. As these regular periodic surveys compile relevant information that can be used to estimate forest diversity measures at 5- to 10-year intervals, they are ideal also in ecological research [47]. Forest surveys employ precise statistical methods based on scientific and systematic bases for estimating forest features, with the possibility of knowing the measurement error quantitatively, and taking into account the spatial changes in stand structure [48]. As inventory data is the usual basis for forest interventions, these data make it possible to track or plan changes in forest features that may measurably benefit plant diversity.
We used the most recent survey, the Fourth Spanish National Forest Inventory (SNFI4 [49]), as a source of field information for the forests’ structure and composition present in the LUs. SNFI4 is a network of permanent field plots at the intersections of a 1 km × 1 km UTM grid established over digital maps (1:25,000) [50]. Each plot consists of four concentric fixed circles with radii of 5, 10, 15 and 25 m, used for acquisition of different stand and site variables. For management status, the SNFI4 provides information on regeneration treatments applied, but based on what can be observed in the field, so it was not possible to accurately estimate the intervention time, the only evidence being that a treatment had been applied at an earlier time in managed plots. Unmanaged plots showed no sign of treatment, for instance, stumps from felled or thinned trees, and given that they should be evident for many years in our climate, they were considered abandoned. We used all the SNFI4 plots located within windows delimiting the limits of the 6 LUs (Figure 2), which included 875 plots distributed as follows: Serres d’Ancosa, 64 plots (with 37.5% of the plots of the SNFI4 showing evidences of previous management, regeneration felling, 62.5% unmanaged); Aspres, 87 plots (21.8% managed, 78.2% unmanaged); Replans de Berguedà, 231 plots (62% managed, 38% unmanaged); Capçaleres del Llobregat, 309 plots (49.3% managed, 50.7% unmanaged); Montmell, 34 plots (23.5% managed, 76.5% unmanaged); and Vall de Rialb, 150 plots (44.1% plots managed, 55.9% unmanaged). All forest types had a tree canopy cover over 70%, except the black pine stands in Vall de Rialb, with 60%.

2.2. Stand-Level Diversity and Structure Variables

From the SNFI4 data, we computed four common plant diversity indicators related to the tree and shrub layers: tree species richness (TreeRich), tree species Shannon diversity index (TreeShDI), shrub species richness (ShrubRich) and shrub Shannon diversity index (ShrubShDI), following the literature on the topic [36,51,52,53,54,55,56]. Tree richness was computed as the number of different tree species in the plot, considering trees with a height > 1.30 m, shrub richness as the number of different shrub species in a plot. We calculated the Shannon diversity index (H’) for trees using the relative abundance of tree species from density counts, as in [57,58]. As for shrubs, individuals are not counted in SNFI4, so Shannon diversity index was determined using the proportion of cover for each species as the term for relative abundance.
We also extracted stand-level variables potentially related to plant diversity from the SNFI4, including commonly recorded (in all SNFIs) and easily acquired variables indicative of stand origin and development status of the dominant trees (natural age class), canopy and shrub cover data, average shrub and tree height, diameter characteristics (diameter at breast height, DBH) of the surveyed trees (height > 1.30 m), soil indicators, and evidence of past silvicultural treatment of regeneration felling. Regeneration feeling leaves traceable signs (i.e., stumps) over many years and was reliably recorded in the SNFI4. The set of 17 variables selected as potential predictors of tree and shrub diversity are listed in Table 1.

2.3. Local Landscape Variables

We used a forest type classification map elaborated by the Centre de la Propietat Forestal of the Catalan Government [59,60] as a source of land cover information at the landscape scale. Rectangular windows of variable extent were created around each LU, and the forest type layer was transformed into raster format (10 × 10 m pixel resolution) for further processing of landscape features and metrics. We calculated a set of 18 class-level metrics and 19 landscape-level metrics using FRAGSTATS 4.2 [61]. We set a 100 m buffer around the central position of each forest plot (X,Y-UTM coordinates) and applied an eight cell-neighborhood rule for computing the metrics around the plots. The set of variables included area-edge metrics, shape metrics, aggregation metrics and diversity metrics (Table 2). Class metrics (Clas.) consider only patches of the same forest type within the 100 m buffer, whereas landscape metrics (Land.) include all patches, without differentiating forest types.

2.4. Model Building with Artificial Neural Networks

Since variables taken within a plot or its near area are likely to be highly correlated, we used artificial neural networks (ANNs) to disentangle the effect of explanatory variables on tree and shrub diversity. ANNs are a robust analytical technique, with high potential for pattern recognition and not affected by multicollinearity problems. ANNs have been often used in the forestry field, in studies related to tree mortality [62,63], height and diameter estimation [64,65], and wildfire prediction [66,67].
We built 24 models, one ANN model for each combination of the dependent variable (TreeRich, TreeShDI, ShrubRich, ShrubDI) and each landscape unit (4 dependent variables × 6 LUs = 24 models). Models for different forest types (i.e., young and mature Aleppo pine, mixed black pine, cork oak, young and mature Scotch pine) were built using Neural Works Predict® 3.30 software [68] to relate stand structure and local landscape predictors with tree and shrub diversity indices.
We used multilayered feed-forward cascade-correlation networks, as defined by Fahlman and Lebiere [69], and following the same model building procedure as in other applications by Alcázar et al. [70] and Vega-Garcia et al. [71]. The number of layers was set to three (an input, a hidden layer, and an output layer), fully connected, with a weight decay function to speed up the convergence of the networks. The iterative learning algorithm was based on an adaptative gradient learning rule [69], a variant of the general algorithm of back-propagation [72]. As the number of observations (plots) was not too high in each LU, we developed explicative models for assessing plant diversity; models were built with all data in the validation dataset (100%), 70% of the data in the train set, and 30% in the test set. Data splitting into sets was conducted randomly at least three times for each model to avoid problems linked to uneven distribution of plots in the sets. Several transformations of the input variables were tested, and a genetic algorithm for variable selection preceded each model training trial, with network weights starting at different randomized values (at least three). In the selection of the best models, we analyzed as main diagnostics the Pearson product-moment correlation (r) of the datasets, measuring the linear association between observed and predicted outputs (the higher, the better), and the root mean square error (RMSE). Under equivalent performance, we preferred parsimonious models with lower numbers of input variables and processing elements and layers, in order to support managerial decisions based on the lowest number of forest features. The best models for each forest type were chosen combining criteria based on higher correlation and lower RMSE between observed and predicted responses in train, test and validation datasets and the simplicity of the network architecture. The signs and relative importance of the significant variables within the best models was evaluated through a sensitivity analysis tool provided by NeuralWare [68], which is based on the computation of the matrix of the partial derivatives of the richness or diversity output variable for each of the input variables in the corresponding model [71]. Some variables were selected as inputs to the models more than once, using different transformations (i.e., linear and log), which was also indicative of the relevance of the variable.

3. Results

Successful richness and Shannon diversity indices (Rich and ShDI) models were built for trees (Table 3) and shrubs (Table 4) for the six main forest types in each LU. All models had good correlation values (r > 0.5) between predicted and observed values across all datasets (training, test and validation), though the best results were found for TreeShDI of young Aleppo pine forest types in Montmell (r > 0.85). RMSE values were <1 for all tree models, and <3 for shrub models. In the model building process, some of the 37 variables initially considered were systematically excluded by the variable selection process with the GA (i.e., stand origin) as they proved not relevant or did not present enough variability. The best models included 20 independent variables globally, but only four were local landscape metrics, and no more than nine entered any given model. The variables more frequently included in models (>10) were, in decreasing order, maximum tree diameter (D.Max), canopy cover (Fcc.Trees), standard deviation of shrub height (Std.Hshrub), mean shrub height (Mean.Hshrub), standard deviation of tree height (Std.Htrees), standard deviation of diameter (Std.D), and soil pH. The sensitivity analysis of the models highlighted differences in the relative influence of variables across forest types with different main species composition.
As a general rule, plant richness and diversity in the tree canopy (overstory) of these Mediterranean forest types were positively linked to variety in heights (Std.Htrees) and diameters (Std.D) (Table 3). Large trees (high D.Max) were relevant in Pinus sylvestris and Pinus halepensis forests, as was an advanced development stage (pole-mature natural age class, Develop). Lack of evidence of previous silvicultural treatments (RegFelling) was related to TreeShDI in the model for mature Aleppo pine forests.
Plant diversity in the shrub layer generally depended on the presence of a sparse tree canopy, except for forest types with a presence of Quercus spp., in which shrub diversity was favored by denser canopy cover (Table 4). A taller shrub layer was favorable to diversity in Pinus halepensis and Quercus suber forests (Ancosa and Aspres) but unfavorable for Pinus sylvestris (Bergueda and Llobregat). Large-diameter trees were negatively related to shrub richness, except in Quercus suber forests (Aspres). Evidence of previous silvicultural treatment was positively related to shrub ShDI in the model for mixed mature black pine and oak forest in Rialb.
Structural stand variables predominated in the models, but four local landscape variables (Class.PLAND, Class.SPLIT, Land.SHDI, Land.NP) were included in most of them. These four variables were often the most influential variables in the corresponding model (Table 3 and Table 4). The exceptions were models for tree diversity in cork oak forest and shrub diversity in mature Scots pine forest (both for Rich and ShDI).

4. Discussion

The fitted ANN models allowed us to identify the stand structure variables and local landscape metrics most closely linked to tree and shrub diversity in targeted Mediterranean forest types, providing valuable insights to inform species assemblies and to guide management to foster higher species diversity. About half of the 37 variables explored were selected in the final models, but each model was unique, and therefore the combination of relevant variables varied across the forest types and landscape units (LUs). All the models presented high values of the Pearson product-moment correlation, although models for the shrub layers showed higher RMSE than the tree models for all forest types. This may reflect the higher natural variability of shrub species in any site as compared to tree species (Appendix A), which could affect prediction accuracy. However, it must be noted that shrub-related variables are not measured in the Spanish National Forest Inventories with the same accuracy as tree variables, as pointed out by Torras et al. [53,73]. Some of these limitations include issues such as the identification of rare shrub species or the estimation of species-level coverage and height, rather than the measurement of each individual shrub, which could have led to an underestimation of shrub richness in some plots.

4.1. Structural and Landscape Predictors of Tree and Shrub Diversity

In our study, both tree diameter and height variability played a relevant role in the specific diversity of the tree layer, as well as tree canopy cover and the presence of large trees in the diversity of the shrub layer. Our results agree with Özçelik et al. [74], who found that large diameters and diameter variability were positively related to tree diversity in Turkey, although they found the relationship between tree species diversity and stand structural parameters highly variable (r = 0.02–0.70). Neuman et al. [75] also found that variation of tree diameter showed a strong correlation with species diversity in permanent plots in Austrian forests. Variation in tree size is an important feature of stand structure because diversity in tree diameter arises from diversity in tree ages and species, thus increasing the variety of micro-wildlife environments [76]. Shater [77] found a positive correlation between average diameter and richness in Pinus sylvestris and Pinus nigra forests in southern France. Conversely, this variable was negatively related to tree diversity in our Pinus sylvestris models, although the positive effect of maximum tree diameter suggests that it is the presence of large trees, as well as high diameter variability, that ultimately drives tree species diversity in these forests.
Most models (15 out of 24) included between one and three landscape metrics, either at the class or landscape level. Selected variables included the percentage of the landscape occupied by the same forest type (Class.PLAND), the class-level splitting index (Class.SPLIT) or landscape diversity metrics such as the number (Land.NP) and diversity (Land.SHDI) of patches around the inventory plots. In agreement with Katayama et al. [39], who found heterogeneity metrics to be “good surrogates of species diversity”, we found that Land.SHDI played a role in four of the Mediterranean forest types. Indeed, the model for Montmell, a fire-prone area containing P. halepensis stands in different stages of post-fire regeneration, included Land.SHDI as the main predictor. In these areas, wildfire induces a mosaic of different forest types at the local level, indicating that wildfire can act as an intermediate disturbance and favor diversity in Mediterranean landscapes [78]. In line with Torras et al. [53], a composition metric, such as percentage of landscape area occupied by the focal forest type (Class.PLAND), was a significant predictor in seven of the models; however, we did not find them “much more relevant to explain biodiversity patterns” than configuration metrics like Land.NP or Class.SPLIT, both included in six models.
We observed that stand structure variables were present in our models more often than landscape variables and soil factors. However, soil-related variables were relevant for some forest types (mainly soil pH, but occasionally also other variables, such as texture and organic matter), as observed in Tiscar-Oliver [79] and Wei et al. [35]. pH was particularly relevant in LUs with Quercus species, where the sign of the pH effect matched the specific soil requirements of the main Quercus species in the LU (Table 4). While Quercus ilex and Quercus faginea require soils with a pH range of 4.5–8.5, the presence of secondary species like Acer monspessulanum has been linked to higher pH in NE Spain [80]. Quercus suber, on the contrary, generally occur in soils developed from siliceous substrates [81].
Though the models were calibrated separately for trees and shrubs, the interaction of the shrub layer with trees found in previous work [82,83] was manifest here by the entry of variables related to shrub height (Mean.Hshrub, Std.Hshrub) in all tree models, except for Quercus suber forests. Shrub development is usually considered a relevant variable in the evaluation of plant diversity [35,84]. We also found a decrease in shrub and tree diversity with increasing total cover and tree canopy cover in pine stands, in agreement with studies by Vilà et al. [85], Smee [86], and Coll et al. [87], which found limitations for shrub development below dense canopy covers. Since the understory–overstory relationship is mostly controlled by the tree layer [87], and shrubs do compete with trees for light, water, and nutrients [57,79,81], the negative sign of the tree cover variables on the shrub models was also to be expected. These results support the warning by other authors on the effects of abandonment—and subsequent forest densification—on diversity [13]. Again, Quercus species displayed a different pattern, with a positive influence of the tree cover on the Shannon diversity index of the shrub layer. While these results may be explained by the more umbrophilic character of the black pine–oak forest in Vall de Rialb LU, the current state of most Quercus suber stands is the evolution of a traditional management for productive reasons (cork extraction), which has favored relatively low densities with scarce shrub layers. Our results indicate that the current higher tree cover may thus be more favorable to plant diversity.

4.2. Structural and Landscape Target Characteristics for Tree and Shrub Diversity in Specific Mediterranean Forest Types

The variable directly related to our hypothesis, and to management (RegFelling), was only retained in two of 24 models, which agrees with Wei et al. [35], who found that in France managed and unmanaged forests do not differ substantially in plant diversity. Evidence of previous silvicultural treatment was negatively related to TreeShDI in the mature Aleppo pine forests in Ancosa, but positively associated with shrub ShDI in the mixed black pine and oak forest in Vall de Rialb. These forest types with similar management intensity in past years differ in that mature Aleppo pine stands mainly originated in secondary succession after abandonment or wildfire. In contrast, mature black pine stands have been exposed to silvicultural management for decades followed by a decline in forest exploitation. These processes need to be investigated further in the future, since management legacies are likely to exert an influence on forest structure and diversity that go well beyond the period of time in which the direct signs of the harvest (mainly stumps) can be detected. Indeed, the most influential independent variables in our study were related to stand structure and reflect this legacy of forest management in the past followed by abandonment or the lack of it in cases of “new forests” generated after land abandonment. We believe that these structural variables already capture the effects of past management and could have made RegFelling redundant. In this regard, it would be useful to explicitly monitor the effects of management decline on plant diversity over time, but information about time since the last treatment was not available in the SNFI4.
Stand structure variables can be modified by forest management to favor plant diversity conservation and enhancement in our Mediterranean stands and provide better guidance to managers. Consequently, and based on our models’ results, we can formulate some recommendations regarding stand structure and local landscape configuration for the forest types analyzed. The mature Pinus halepensis forests (Serres d’Ancosa) (37.5% plots treated) benefit—in terms of canopy diversity—from reaching an advanced stage of development without intervention, with an even-aged but varied canopy height, with large and small diameters present, a low canopy cover that allows for a well-developed shrub layer, and local landscape diversity in nearby stands. Plant diversity in the shrub layer also depends on the even-age low tree cover, good development (height) of the shrub layer, and especially on local patch diversity. For younger stands of the same species (P. halepensis in Montmell) (23.5% plots treated), tree diversity similarly relies on varied canopy heights, variety in tree diameter, diverse shrub heights, and a diverse or divided local landscape. The presence of prominent individuals seems detrimental to tree richness but favorable to Shannon diversity for both trees and shrubs. The benefits of even-aged structure, an advanced stage of stand development, and local landscape heterogeneity obtained for shrub diversity are also in agreement with recommendations for the more mature stands in Serres de Ancosa. However, high tree cover improves tree richness and decreases shrub richness in young stands, so it seems advisable to apply treatments that progressively open the tree canopy over time, while monitoring the persistence of the tree species present in the early stages of development.
The young and mature stands of Scots pine forest (P. sylvestris) in Replans de Berguedà appear to hold more tree diversity when uneven-aged, with young and mature trees mixed, and a variety of tree canopy and shrub heights. Both tree and shrub diversity improved with nearness to other forest types in undivided local landscapes and with openness of the tree cover. Shrubs also benefit from variety in tree canopy height, but richness is decreased by large trees, and Shannon diversity increases when the shrub layer is low and varies little in height. The more mature Pinus sylvestris forest in Capçaleres del Llobregat (49.3% treated) shows higher tree diversity with an advanced stage of development, diameter variety, varied shrub height and local heterogeneity. Shannon diversity for trees also increases with tree height and varied canopy height. As in the Aleppo pine forest types, richness and Shannon diversity for shrubs are linked to lower tree cover. In these mature stands, maximum diameter (D.max) shows a negative sign, suggesting that big dominant trees are not favorable to shrub diversity, while acid soils with more organic matter clearly are. In these mature stands shrub richness increased with tree height and varied shrub height, but the lower shrub height linked to higher Shannon diversity agrees with results in the younger Scots pine forests in Replans de Berguedà.
Cork oak (Q. suber) forest in Aspres include young and adult stands in which tree richness is related to diverse tree diameters and acid soils. Shannon diversity also depends on the varied diameters present in the first stages of development (young forest) and on soils that are sandy and rich in organic matter. Richness for shrubs is dependent on shrub height, low variety in shrub height, larger trees, less acidic soil, and an undivided and homogeneous local landscape. Shannon diversity for shrubs also relies on a well-developed layer (shrub height) but with higher variety in shrub height, higher tree cover, less acidic soil, and an undivided but diverse local landscape. As the treatment traditionally applied for cork production in Catalonia tends to open the stands, clear the understory, and keep productive cork oak trees as long as they are profitable and have good technological characteristics, eliminating competing species (i.e., other Quercus sp., Pinus pinea or Pinus pinaster), younger stands regenerating after fire and less modified by management apparently hold more plant diversity than older abandoned stands. It has to be noted that these Catalonian stands do not resemble either the characteristic physiognomy of open savannas found elsewhere in the Western Mediterranean Basin [88] or the potential rich mixed cork oak forests with very dense and tall tree cover which could develop if these forests had not been intensively modified; aging, wildfires [89] and rapid socioeconomic changes [90] make it very difficult to formulate management recommendations for plant diversity in these stands at this time.
The mature black pine forests in Vall de Rialb (P. nigra, irregularly mixed with Q. faginea, and Q ilex) showed a clear preference for basic soils in the tree models, in agreement with the usual distribution of the species. However, in this forest type, the models for richness and Shannon diversity differed in relevant variables. Richness for trees and shrubs mainly depends on diameter distribution. Richness is increased with varied but not large diameters, tall shrubs and varied canopy height or unevenness, which would seem to point to increased richness by abandonment of the traditional even-aged management that allows the advance of the Quercus species. Shannon diversity for trees and shrubs relies on lower general cover but higher tree cover (though it was lowest across the stands studied, 60%) and local landscape heterogeneity. For shrubs, low variety in shrub height and evidence of previous silvicultural treatment also benefit Shannon diversity. As discussed before, this may indicate a dependence on periodic management disturbance [78], which requires further research, since management intervention is declining.

5. Conclusions

Our analyses suggest that plant diversity in Mediterranean forests, estimated through richness and Shannon diversity for trees and shrubs, depends on forest structure and on local landscape patterns, and, though to a lesser degree, on site conditions (mainly soil pH). Tree diameter distribution, the presence of large trees, tree cover, and variation in tree and shrub height were the best predictors of tree and shrub diversity, and should be carefully considered on a site-by-site basis by managers aiming at preserving/improving biodiversity under changing conditions. Aleppo pine and Scots pine forests displayed consistent results in their models that allowed us to formulate some recommendations regarding stand structure and local landscape to foster plant diversity, while cork oak and black pine forests require further research.
Forest management did not seem to positively and generally affect the diversity of trees or shrubs, contrary to expectations, but this may be due to its being based on visual evidence of regeneration felling, this being the only available indicator.
Our findings confirm that some key variables (tree diameter distribution, presence of large trees, canopy cover, and variation in tree and shrub height) should be retained in the design of future inventories for plant diversity, and in forest management and planning aiming at preserving/improving biodiversity under changing conditions. Forest management shapes landscape patterns, but the creation of these patterns is not usually a management goal. Since some simple metrics certainly contributed to diversity, they should also be taken into account, since forestry intervention may benefit local biodiversity (i.e., by setting a maximum stand size, or by creating gaps and a more heterogeneous tree and shrub layer), or undermine it by promoting extended homogeneous and excessively shadowed structures or simply letting abandonment progress.
In closing, SNFI4 variables and landscape ecology metrics allowed the quantitative estimation of two plant diversity indicators useful for preserving plant diversity in selected Mediterranean forest types. Our findings suggest that the local spatial patterns of forest stands need to be considered in plant diversity management along with forest structure variables that are more traditionally considered to prescribe treatments.

Author Contributions

S.G. compiled references and processed data resources (4IFN) and models, and produced a first draft; C.C. contributed conceptualization and methodology for plant diversity analysis; A.A. and F.A. contributed SNFI4 and forest structure expertise to the methodology, analysis, and discussion; M.R. designed the figures and contributed to the methodology, analysis and discussion; C.V.-G. contributed to the conceptualization of the study, designed the methodology, supervised the research and writing, project administration, and funding acquisition. All authors contributed to writing, editing, and reviewing the draft submitted. All authors have read and agreed to the published version of the manuscript.

Funding

Financial support was provided as a scholarship to Siba Ghadban by the Erasmus Mundus Programme MEDfOR funded by the European Commission (https://www.medfor.eu/, accessed on 18 October 2021). This work was conducted under the project CLIMARK (LIFE16 CCM/ES/000065)-Forest management promotion for climate change mitigation through the design of a local market of climatic credits, funded by the European Commission.

Institutional Review Board Statement

Not applicable.

Informed Consent Statement

Not applicable.

Data Availability Statement

Not applicable.

Acknowledgments

We gratefully acknowledge comments and suggestions from four anonymous reviewers.

Conflicts of Interest

The authors declare no conflict of interest. The funders had no role in the design of the study; in the collection, analyses, or interpretation of data; in the writing of the manuscript; or in the decision to publish the results.

Appendix A

Figure A1. Relative abundance of tree species at each landscape unit.
Sustainability 13 11658 g0a1
Figure A2. Relative abundance of shrub species at each landscape unit.
Sustainability 13 11658 g0a2

References

  1. Pitkanen, S. Correlation between stand structure and ground vegetation: An analytical approach. Plant Ecol. 1997, 131, 109–126. [Google Scholar] [CrossRef]
  2. Pereira, H.M.; Leadley, P.W.; Proença, V.; Alkemade, R.; Scharlemann, J.; Fernandez-Manjarrés, J.F.; Araújo, M.B.; Balvanera, P.; Biggs, R.; Cheung, W.W.L.; et al. Scenarios for Global Biodiversity in the 21st Century. Science 2010, 330, 1496–1501. [Google Scholar] [CrossRef] [Green Version]
  3. Fady-Welterlen, B. Is there really more biodiversity in Mediterranean forest ecosystems? Taxon 2005, 54, 905–910. [Google Scholar] [CrossRef]
  4. Mittermeier, R.A.; Turner, W.R.; Larsen, F.W.; Brooks, T.M.; Gascon, C. Global Biodiversity Conservation: The Critical Role of Hotspots. In Biodiversity Hotspots; Zachos, F., Habel, J., Eds.; Springer: Berlin/Heidelberg, Germany, 2011. [Google Scholar] [CrossRef]
  5. Bellard, C.; Leclerc, C.; Leroy, B.; Bakkenes, M.; Veloz, S.; Thuiller, W.; Courchamp, F. Biodiversity hotspots and global change. Glob. Ecol. Biogeogr. 2014, 23, 1376–1386. [Google Scholar] [CrossRef]
  6. Beilin, R.; Lindborg, R.; Stenseke, M.; Pereira, H.M.; Llausàs, A.; Slätmo, E.; Cerqueira, Y.; Navarro, L.; Rodrigues, P.; Reichelt, N.; et al. Analysing How Drivers of Agricultural Land Abandonment Affect Biodiversity and Cultural Landscapes Using Case Studies from Scandinavia, Iberia and Oceania. Land Use Policy 2014, 36, 60–72. [Google Scholar] [CrossRef]
  7. MedECC. Climate and Environmental Change in the Mediterranean Basin–Current Situation and Risks for the Future; First Mediterranean Assessment Report; Cramer, W., Guiot, J., Marini, K., Eds.; Union for the Mediterranean, Plan Bleu, UNEP/MAP: Marseille, France, 2020; 600p, in press. [Google Scholar]
  8. Ameztegui, A.; Brotons, L.; Coll, L. Land-Use Changes as Major Drivers of Mountain Pine (Pinus uncinata Ram.) Expansion in the Pyrenees. Glob. Ecol. Biogeogr. 2010, 19, 632–641. [Google Scholar] [CrossRef] [Green Version]
  9. Cervera, T.; Pino, J.; Marull, J.; Padró, R.; Tello, E. Understanding the Long-Term Dynamics of Forest Transition: From Deforestation to Afforestation in a Mediterranean Landscape (Catalonia, 1868–2005). Land Use Policy 2019, 80, 318–331. [Google Scholar] [CrossRef]
  10. Poyatos, R.; Latron, J.; Llorens, P. Land Use and Land Cover Change after Agricultural Abandonment: The Case of a Mediterranean Mountain Area (Catalan Pre-Pyrenees). Mt. Res. Dev. 2003, 23, 362–368. [Google Scholar] [CrossRef] [Green Version]
  11. Amici, V.; Santi, E.; Filibeck, G.; Diekmann, M.; Geri, F.; Landi, S.; Scoppola, A.; Chiarucci, A. Influence of secondary forest succession on plant diversity patterns in a Mediterranean landscape. J. Biogeogr. 2013, 40, 2335–2347. [Google Scholar] [CrossRef]
  12. Vega-Garcia, C.; Chuvieco, E. Applying local measures of spatial heterogeneity to Landsat-TM images for predicting wildfire occurrence in Mediterranean landscapes. Landsc. Ecol. 2006, 21, 595–605. [Google Scholar] [CrossRef]
  13. Fabbio, G.; Merlo, M.; Tosi, V. Silvicultural management in maintaining biodiversity and resistance of forests in Europe—The Mediterranean region. J. Environ. Manag. 2003, 67, 67–76. [Google Scholar] [CrossRef]
  14. Sluiter, R.; de Jong, S.M. Spatial Patterns of Mediterranean Land Abandonment and Related Land Cover Transitions. Landsc. Ecol. 2007, 22, 559–576. [Google Scholar] [CrossRef]
  15. Otero, I.; Marull, J.; Tello, E.; Diana, G.L.; Pons, M.; Coll, F.; Boada, M. Land abandonment, landscape, and biodiversity: Questioning the restorative character of the forest transition in the Mediterranean. Ecol. Soc. 2015, 20, 7. [Google Scholar] [CrossRef] [Green Version]
  16. Van Leeuwen, C.E.; Cammeraat, E.L.H.; de Vente, J.; Boix-Fayos, C. The evolution of soil conservation policies targeting land abandonment and soil erosion in Spain: A review. Land Use Policy 2019, 83, 174–186. [Google Scholar] [CrossRef]
  17. Liang, J.; Crowther, T.W.; Picard, N.; Wiser, S.; Zhou, M.; Alberti, G.; Schulze, E.-D.; McGuire, A.D.; Bozzato, F.; Pretzsch, H.; et al. Positive biodiversity–productivity relationship predominant in global forests. Science 2016, 354, aaf8957. [Google Scholar] [CrossRef] [Green Version]
  18. Morin, X.; Fahse, L.; Mazancourt, C.; Scherer-Lorenzen, M.; Bugmann, H. Temporal stability in forest productivity increases with tree diversity due to asynchrony in species dynamics. Ecol. Lett. 2014, 17, 1526–1535. [Google Scholar] [CrossRef]
  19. Schnabel, F.; Schwarz, J.A.; Dănescu, A.; Fichtner, A.; Nock, C.A.; Bauhus, J.; Potvin, C. Drivers of productivity and its temporal stability in a tropical tree diversity experiment. Glob. Chang. Biol. 2019, 25, 4257–4272. [Google Scholar] [CrossRef]
  20. Jactel, H.; Bauhus, J.; Boberg, J.; Bonal, D.; Castagneyrol, B.; Gardiner, B.; Gonzalez-Olabarria, J.R.; Koricheva, J.; Meurisse, N.; Brockerhoff, E.G. Tree Diversity Drives Forest Stand Resistance to Natural Disturbances. Curr. For. Rep. 2017, 3, 223–243. [Google Scholar] [CrossRef]
  21. Sánchez-Pinillos, M.; Coll, L.; Cáceres, M.D.; Ameztegui, A. Assessing the persistence capacity of communities facing natural disturbances on the basis of species response traits. Ecol. Indic. 2016, 66, 76–85. [Google Scholar] [CrossRef] [Green Version]
  22. Coll, L.; Ameztegui, A.; Collet, C.; Löf, M.; Mason, B.; Pach, M.; Verheyen, K.; Abrudan, I.; Barbati, A.; Barreiro, S.; et al. Knowledge gaps about mixed forests: What do European forest managers want to know and what answers can science provide? For. Ecol. Manag. 2018, 407, 106–115. [Google Scholar] [CrossRef] [Green Version]
  23. Torras, O.; Saura, S. Effects of silvicultural treatments on forest biodiversity indicators in the Mediterranean. For. Ecol. Manag. 2008, 255, 3322–3330. [Google Scholar] [CrossRef]
  24. Ferris, R.; Peace, A.J.; Humphrey, J.W.; Broome, A.C. Relationships between vegetation, site type and stand structure in coniferous plantations in Britain. For. Ecol. Manag. 2000, 136, 35–51. [Google Scholar] [CrossRef]
  25. Lowman, M.D.; Nadkarni, N.M. Forest Canopies; Academic Press: San Diego, CA, USA, 1995; ISBN 0-12-457650-8. [Google Scholar]
  26. Hashemi, S.A. Evaluating plant species diversity and physiographical factors in natural broad leaf forest. Am. J. Environ. Sci. 2010, 6, 20–25. [Google Scholar] [CrossRef]
  27. Hashemi, S.A. Biodiversity Indices of natural Hornbeam stands in relation to stand volume in management area. Middle East J. Sci. Res. 2011, 10, 64–69. [Google Scholar]
  28. Rago, M.M.; Urretavizcaya, M.F.; Lederer, N.S.; Defossé, G.E. Plant Community Response to Forest Fuel Management in Patagonian Pine Plantations. Front. For. Glob. Chang. 2020, 3, 55. [Google Scholar] [CrossRef]
  29. Nieppola, J.J.; Carleton, T.J. Relations between Understory Vegetation, Site Productivity, and Environmental Factors in Pinus Sylvestris L. Stands in Southern Finland. Vegetatio 1991, 93, 57–72. [Google Scholar]
  30. Guitton, J.L.; Ruchaud, F. Conséquences Écologiques de L’éclaircie des Peuplements de réSineux (Ecological Consequences of Thinning in Coniferous Plantations). Recherch Eisidore Website. 1996. Available online: http://www.rechercheisidore.fr/search/resource/?uri=10670/1.sjmcpq (accessed on 10 May 2021).
  31. Rameau, J.C. Aménagement Forestier. Importance de L’écologie, Prise en Compte de la Biodiversité. 1999. Available online: http://documents.irevues.inist.fr/bitstream/handle/2042/5507/87_101.pdf?sequence=1 (accessed on 10 May 2021).
  32. Van Pelt, R.; Franklin, J. Influence of canopy structure on the understory environment in tall, old growth, conifer forests. Can. J. For. Res. 2000, 30, 1231–1245. [Google Scholar] [CrossRef]
  33. Shater, Z. Studying the Effect of Stand Characteristics on Plant Species diversity in the Median Part of Natural Pinus brutia Ten. (Brutia pine) Forests in Al-Bayer and Al-Bassit Regions-Syria. Tishreen Univ. J. Res. Sci. Stud. Biol. Sci. Ser. 2013, 35, 72–84. [Google Scholar]
  34. Bohn, F.J.; May, F.; Huth, A. Species composition and forest structure explain the temperature sensitivity patterns of productivity in temperate forests. Biogeosciences 2018, 15, 1795–1813. [Google Scholar] [CrossRef] [Green Version]
  35. Wei, L.; Archaux, F.; Hulin, F.; Bilger, I.; Gosselin, F. Stand attributes or soil micro-environment exert greater influence than management type on understory plant diversity in even-aged oak high forests. For. Ecol. Manag. 2020, 460, 117897. [Google Scholar] [CrossRef]
  36. Amici, V.; Rocchini, D.; Filibeck, G.; Bacaro, G.; Santi, E.; Geri, F.; Landi, S.; Scoppola, A.; Chiarucci, A. Landscape structure effects on forest plant diversity at local scale: Exploring the role of spatial extent. Ecol. Complex. 2015, 21, 44–55. [Google Scholar] [CrossRef]
  37. Malavasi, M.; Bartak, V.; Carranza, M.L.; Simova, P.; Acosta, A.T.R. Landscape pattern and plant biodiversity in Mediterranean coastal dune ecosystems: Do habitat loss and fragmentation really matter? J. Biogeogr. 2018, 45, 1367–1377. [Google Scholar] [CrossRef]
  38. Robert, K.; Jones, D.O.B.; Huvenne, V.A.I. Megafaunal distribution and biodiversity in a heterogeneous landscape: The iceberg-scoured Rockall Bank, NE Atlantic. Mar. Ecol. Prog. Ser. 2014, 501, 67–88. [Google Scholar] [CrossRef] [Green Version]
  39. Katayama, N.; Amano, T.; Naoe, S.; Yamakita, T.; Komatsu, I.; Takagawa, S.; Sato, N.; Ueta, M.; Miyashita, T. Landscape Heterogeneity–Biodiversity Relationship: Effect of Range Size. PLoS ONE 2014, 9, e93359. [Google Scholar] [CrossRef]
  40. Turner, M.G. Landscape ecology: What is the state of the science? Annu. Rev. Ecol. Evol. Syst. 2005, 36, 319–344. [Google Scholar] [CrossRef]
  41. Austin, M.P. Spatial prediction of species distribution: An interface between ecological theory and statistical modeling. Ecol. Model. 2002, 157, 101–118. [Google Scholar] [CrossRef] [Green Version]
  42. McElhinny, C.H. Forest and Woodland Structure as an Index of Biodiversity: A Review. A Literature Review Commissioned by NSW NPWS; Department of Forestry, Australian National University: Canberra, Australia, 2002. [Google Scholar]
  43. Curzon, M.T.; D’Amato, A.W.; Fraver, S.; Palik, B.J.; Bottero, A.; Foster, J.R.; Gleason, K.E. Harvesting influences functional identity and diversity over time in forests of the northeastern U.S.A. For. Ecol. Manag. 2017, 400, 93–99. [Google Scholar] [CrossRef]
  44. Vidal, C.; Alberdi, I.; Redmond, J.; Vestman, M.; Lanz, A.; Schadauer, K. The role of European National Forest Inventories for international forestry reporting. Ann. For. Sci. 2016, 73, 793–806. [Google Scholar] [CrossRef] [Green Version]
  45. Corona, P.; Chirici, G.; McRoberts, R.E.; Winter, S.; Barbati, A. Contribution of large-scale forest inventories to biodiversity assessment and monitoring. For. Ecol. Manag. 2011, 262, 2061–2069. [Google Scholar] [CrossRef] [Green Version]
  46. Alberdi, I.; Vallejo, R.; Álvarez-González, J.G.; Condés, S.; González-Ferreiro, E.; Guerrero, S.; Hernández, L.; Martínez-Jauregui, M.; Montes, F.; Oliveira, N.; et al. The multi-objective Spanish National Forest Inventory. For. Syst. 2017, 26, e04S. [Google Scholar] [CrossRef]
  47. Larsson, T.-B.; Angelstam, P.; Balent, G.; Barbati, A.; Bijlsma, R.J.; Boncina, A.; Bradshaw, R.; Bücking, W.; Ciancio, O.; Corona, P.; et al. Biodiversity Evaluation Tools for European Forests; Blackwell Science: Oxford, UK, 2001; Volume 50, p. 237. [Google Scholar]
  48. Barrett, T.M.; Gray, A.N. Potential of a national monitoring program for forests to assess change in high-latitude ecosystems. Biol. Conserv. 2011, 144, 1285–1294. [Google Scholar] [CrossRef]
  49. Alberdi, I.; Sandoval, V.; Condés, S.; Cañellas, I.; Vallejo, R. El Inventario Forestal Nacional español, una herramienta para el conocimiento, la gestión y la conservación de los ecosistemas forestales arbolados. Ecosistemas 2016, 25, 88–97. [Google Scholar] [CrossRef]
  50. Alberdi, I.; Cañellas, I.; Condes, S. A long-scale biodiversity monitoring methodology for Spanish national forest inventory. Application to Álava region. For. Syst. 2014, 23, 93–110. [Google Scholar] [CrossRef]
  51. Saura, S.; Martín-Queller, E.; Hunter, M.L. Forest landscape change and biodiversity conservation. In Forest landscapes and Global Change; Springer: New York, NY, USA, 2014; pp. 167–198. [Google Scholar]
  52. Chiarucci, A.; Bacaro, G.; Filibeck, G.; Landi, S.; Maccherini, S.; Scoppola, A. Scale dependence of plant species richness in a network of protected areas. Biodivers. Conserv. 2012, 21, 503–516. [Google Scholar] [CrossRef]
  53. Torras, O.; Martín-Queller, E.; Saura, S. Relating landscape structure, environment and management to biodiversity indicators estimated from forest inventory data in Catalonia (NE Spain). Investig. ÓN Agrar. Sist. Y Recur. For. 2009, 18, 322–337. [Google Scholar] [CrossRef] [Green Version]
  54. Dauber, J.; Hirsch, M.; Simmering, D.; Waldhardt, R.; Otte, A.; Wolters, V. Landscape structure as an indicator of biodiversity: Matrix effects on species richness. Agric. Ecosyst. Environ. 2003, 98, 321–329. [Google Scholar] [CrossRef]
  55. Spellerberg, I.F.; Fedor, P.J. A tribute to Claude Shannon (1916–2001) and a plea for more rigorous use of species richness, species diversity and the ‘Shannon–Wiener’Index. Glob. Ecol. Biogeogr. 2003, 12, 177–179. [Google Scholar] [CrossRef] [Green Version]
  56. Yeboah, D.; Chen, H.Y.H.; Kingston, S. Tree species richness decreases while species evenness increases with disturbance frequency in a natural boreal forest landscape. Ecol. Evol. 2016, 6, 842–850. [Google Scholar] [CrossRef]
  57. Magurran, A.E. Diversidad ecológica y su Medición; Vedrà: Barcelona, Spain, 1989. [Google Scholar]
  58. Margalef, R.; Daget, J. Les modèles mathématiques en écologie. Masson, Paris. 172 p. 90F. Limnol. Oceanogr. 1978, 23, 575–576. [Google Scholar] [CrossRef]
  59. Vericat, P.; Piqué, M.; Koua, O.; Pla, M. Mapa de Formacions Forestals Pures i Mixtes de Catalunya a partir del Mapa Forestal de España 1:50.000 digitalitzat; Centre de Ciència i Tecnologia Forestal de Catalunya: Solsona, Spain, 2010. [Google Scholar]
  60. Piqué, M.; Vericat, P.; Cervera, T.; Baiges, T.; Farriol, R. Tipologies Forestals Arbrades. Sèrie: Orientacions de Gestió Forestal Sostenible per a Catalunya (ORGEST); Centre de la Propietat Forestal, Departament d’Agricultura, Ramaderia, Pesca, Alimentació i Medi Natural, Generalitat de Catalunya: Barcelona, Spain, 2011. [Google Scholar]
  61. McGarigal, K.; Cushman, S.A.; Ene, E. FRAGSTATS v4: Spatial Pattern Analysis Program for Categorical and Continuous Maps. Computer Software Program Produced by the Authors at the University of Massachusetts, Amherst. 2012. Available online: http://www.umass.edu/landeco/research/fragstats/fragstats.html (accessed on 18 October 2021).
  62. Hasenauer, H.; Merkl, D.; Weingartner, M. Estimating tree mortality of Norway spruce stands with neural networks. Adv. Environ. Res. 2001, 5, 405–414. [Google Scholar] [CrossRef]
  63. Soares da Rocha, S.J.S.; Eleto Torres, C.M.M.; Jacovine, G.; Leite, H.; Gelcer, E.; Neves, K.; Schettini, B.; Villanova, P.H.; Silva, L.; Reis, L.; et al. Artificial neural networks: Modeling tree survival and mortality in the Atlantic Forest biome in Brazil. Sci. Total Environ. 2018, 645, 655–661. [Google Scholar] [CrossRef]
  64. Özçelik, R.; Diamantopoulou, M.J.; Brooks, J.R.; Wiant, H.V. Estimating tree bole volume using artificial neural network models for four species in Turkey. J. Environ. Manag. 2010, 91, 742–753. [Google Scholar] [CrossRef]
  65. Correia Vieira, G.; Ribeiro de Mendonça, A.; Fernandes da Silva, G.; Zanetti, S.S.; Marques da Silva, M.; Rosa dos Santos, A. Prognoses of diameter and height of trees of eucalyptus using artificial intelligence. Sci. Total Environ. 2018, 619–620, 1473–1481. [Google Scholar] [CrossRef]
  66. Vega-Garcia, C.; Lee, B.S.; Woodard, P.M.; Titus, S.J. Applying neural network technology to human-caused wildfire occurrence prediction. AI Appl. 1996, 10, 9–18. [Google Scholar]
  67. Bisquert, M.; Caselles, E.; Sánchez, J.M.; Caselles, V. Application of artificial neural networks and logistic regression to the prediction of forest fire danger in Galicia using MODIS data. Int. J. Wildland Fire 2012, 21, 1025–1029. [Google Scholar] [CrossRef]
  68. NeuralWare, 2001–2014. NeuralSIM, the Complete Solution for Neural Data Modelling. In User Guide; NeuralWare: Pittsburgh, PA, USA, 2001–2014.
  69. Fahlman, S.E.; Lebiere, C. The cascade-correlation learning architecture. In Advances in Neural Information Processing Systems; Morgan Kaufmann Publishers Inc.: San Francisco, CA, USA, 1990; Volume 2, pp. 524–532. [Google Scholar]
  70. Alcázar, J.; Palau, A.; Vega-Garcia, C. A neural net model for environmental flow estimation at the Ebro River Basin, Spain. J. Hydrol. 2008, 349, 44–55. [Google Scholar] [CrossRef]
  71. Vega-Garcia, C.; Decuyper, M.; Alcázar, J. Applying cascade-correlation neural networks to in-fill gaps in Mediterranean daily flow data series. Water 2019, 11, 1691. [Google Scholar] [CrossRef] [Green Version]
  72. Werbos, P.J. The Roots of Backpropagation: From Ordered Derivatives to Neural Networks and Political Forecasting; John Wiley & Sons, Inc.: New York, NY, USA, 1994; 319p. [Google Scholar]
  73. Torras, O.; Gil-Tena, A.; Saura, S. How does forest landscape structure explain tree species richness in a Mediterranean context? Biodivers. Conserv. 2008, 17, 1227–1240. [Google Scholar] [CrossRef]
  74. Özçelik, R.; Gul, A.U.; Merganic, J.; Merganicova, K.J. Tree species diversity and its relationship to stand parameters and geomorphology features in the eastern Black Sea region forests of Turkey. J. Environ. Biol. 2008, 29, 291–298. [Google Scholar]
  75. Neumann, M.; Starlinger, F. The significance of different indices for stand structure and diversity in forests. For. Ecol. Manag. 2001, 145, 91–106. [Google Scholar] [CrossRef]
  76. Zenner, E.K. Do residual trees increase structural complexity in Pacific Northwest coniferous forests? Ecol. Appl. 2000, 10, 800–810. [Google Scholar] [CrossRef]
  77. Shater, Z. Diversité Végétale et Sylviculture: Effet de la Plantation et de la Gestion D’espèces Forestières Introduites sur la Diversité Végétale. Etude du cas D’anciennes Châtaigneraies des Cévennes, Midi de la France. Ph.D. Thesis, Faculté des Sciences et Techniques de Saint Jérôme, Marseille, France, 2001. [Google Scholar]
  78. Blondel, J. The ‘Design’ of Mediterranean Landscapes: A Millennial Story of Humans and Ecological Systems during the Historic Period. Hum. Ecol. 2006, 34, 713–729. [Google Scholar] [CrossRef]
  79. Tiscar-Oliver, P.A. Patterns of shrub diversity and tree regeneration across topographic and stand-structural gradients in a Mediterranean forest. For. Syst. 2015, 24, 11. [Google Scholar] [CrossRef] [Green Version]
  80. Olarieta, J.R.; Bargués Tobella, A.; Rodríguez-Ochoa, R.; Antúnez, M. Soil control over the distribution of Mediterranean oak forests in the Montsec mountains (notheastern Spain). Geoderma 2017, 291, 11–20. [Google Scholar] [CrossRef]
  81. Pons, J.; Pausas, J.G. Oak regeneration in heterogeneous landscapes: The case of fragmented Quercus suber forests in the eastern Iberian Peninsula. For. Ecol. Manag. 2006, 231, 196–204. [Google Scholar] [CrossRef]
  82. Riegel, G.M.; Miller, R.F.; Krueger, W.C. Competition for resources between understory vegetation and overstory Pinus ponderosa in northeastern Oregon. Ecol. Appl. 1992, 2, 71–85. [Google Scholar] [CrossRef]
  83. Nilsson, M.C.; Wardle, D.A. Understory vegetation as a forest ecosystem driver: Evidence from the northern Swedish boreal forest. Front. Ecol. Environ. 2005, 3, 421–428. [Google Scholar] [CrossRef]
  84. Shater, Z.; Gondard, H.; Amorini, E.; Romane, F. Effects of afforestation by introduced species in the old sweet chestnut (Castanea sativa Miller) groves of Cevennes, southern France, on plant species diversity. Zb. Gozdarstva Lesar. 2002, 68, 149–169. [Google Scholar]
  85. Vilà, M.; Vayreda, J.; Comas, L.; Ibáñez, J.J.; Mata, T.; Obón, B. Species richness and wood production: A positive association in Mediterranean forests. Ecol. Lett. 2007, 10, 241–250. [Google Scholar] [CrossRef]
  86. Smee, D. Species with a large impact on community structure. Nat. Educ. Knowl. 2012, 3, 40. [Google Scholar]
  87. Coll, L.; González-Olabarría, J.R.; Mola-Yudego, B.; Pukkala, T.; Messier, C. Predicting understory maximum shrubs cover using altitude and overstory basal area in different Mediterranean forests. Eur. J. For. Res. 2011, 11, 55. [Google Scholar] [CrossRef] [Green Version]
  88. Bugalho, M.N.; Caldeira, M.C.; Pereira, J.S.; Aronson, J.; Pausas, J.G. Mediterranean cork oak savannas require human use to sustain biodiversity and ecosystem services. Front. Ecol. Environ. 2011, 9, 278–286. [Google Scholar] [CrossRef] [Green Version]
  89. Salis, M.; Arca, B.; Alcasena-Urdiroz, F.; Massaiu, A.; Bacciu, V.; Bosseur, F.; Caramelle, P.; Dettori, S.; De Oliveira, A.S.F.; Molina-Terren, D.; et al. Analyzing the recent dynamics of wildland fires in Quercus suber L. woodlands in Sardinia (Italy), Corsica (France) and Catalonia (Spain). Eur. J. For. Res. 2019, 138, 415–431. [Google Scholar] [CrossRef] [Green Version]
  90. Aronson, J.; Pereira, J.S.; Pausas, J.G. Cork Oak Woodlands on the Edge: Ecology, Adaptive Management, and Restoration; Island Press: Washington, DC, USA, 2009. [Google Scholar]
Figure 1. Distribution of the landscape units within Catalonia, NE Spain.
Sustainability 13 11658 g001
Figure 2. Windows for analysis with SNFI4 plots and LU limits overlayed. (A) Vall de Rialb LU. (B) Aspres LU. (C) Montmell LU and Serres d’Ancosa LU. (D) Capçaleres del Llobregat LU and Replans de Berguedà LU.
Sustainability 13 11658 g002
Table 1. List of the independent variables derived from SNFI4 [49].
Abbreviation of VariableVariable DescriptionType of Variable
Dominant tree species data
DevelopDevelopment status of the dominant species (seedling, sapling, thicket, pole, mature stand)Categorical
Even/UnevenCoetaneous, even-aged, mixed-aged, uneven-agedCategorical
OriginNatural, artificial, naturalizedCategorical
Shrubs data
Mean.HShrubMean shrub heightInterval
Std.HShrubStandard deviation of shrub heightInterval
Trees data
D.MaxMaximum tree diameterInterval
D.MinMinimum tree diameterInterval
Mean.DDiameter meanInterval
Std.DDiameter standard deviationInterval
Mean.HTreesMean tree canopy heightInterval
Std.HTreesStandard deviation of tree canopy heightInterval
Cover and site data
Fcc.TotFraction cover of total vegetationInterval
Fcc.TreesFraction cover of tree canopyInterval
TextureSoil texture of the plot (1, sand; 2, mixed; 3, clay)Categorical
MatOrgOrganic matter present in the plot soil (1, high humus content; 2, moderate humus; 3, low humus)Categorical
pHSoilpH level of the soil in the plot (1–14)Interval
RegFellingEvidence of regeneration fellings applied (dummy; no, 0; yes, 1)Categorical
Table 2. List of FRAGSTATS metrics computed for class and landscape levels, the independent variables for analysis (all of them numeric).
Class
Metrics (Clas.)
DescriptionLandscape
Metrics (Land.)
Description
CATotal (Class) AreaTATotal Area
PLANDPercentage of Landscape
NPNumber of PatchesNPNumber of Patches
LPILargest Patch IndexLPILargest Patch Index
TETotal EdgeTETotal Edge
AREA_MNMean Patch AreaAREA_MNMean Patch Area
AREA_SDStandard Deviation in Patch AreaAREA_SDStandard Deviation in Patch Area
SHAPE_MNMean patch areaSHAPE_MNMean Patch Area
SHAPE_SDStandard deviation in patch areaSHAPE_SDStandard Deviation in Patch Area
ENN_MNEuclidean Nearest-Neighbor Distance—meanENN_MNEuclidean Nearest-Neighbor Distance—mean
ENN_SDEuclidean Nearest-Neighbor Distance—standard deviationENN_SDEuclidean Nearest-Neighbor Distance—standard deviation
CLUMPYClumpiness IndexCONTAGContagion
PLADJPercentage of Like AdjacenciesPLADJPercentage of Like Adjacencies
IJIInterspersion and Juxtaposition IndexIJIInterspersion and Juxtaposition Index
COHESIONPatch Cohesion IndexCOHESIONPatch Cohesion Index
DIVISIONLandscape Division IndexDIVISIONLandscape Division Index
SPLITSplitting IndexSPLITSplitting Index
AIAggregation IndexAIAggregation Index
SHDIShannon Diversity Index
SHEIShannon Evenness Index
Table 3. Model results by forest type for the tree species richness (TreeRich) and diversity (TreeShDI). Model performance was evaluated by parsimony in network architecture (Net Arch) and the Pearson product-moment correlation (r) of the training, test and validation datasets. Numbers indicate times a variable enters the corresponding model, and sign in the model, whereas numbers in bold identify the highest impact predictor for each model in the sensitivity analysis.
VariablesLURichShDILURichShDILURichShDILURichShDILURichShDILURichShDITotal times in tree models
ModelsNet Arch8–14–16–6–1Net Arch6–3–17–17–1Net Arch7–2–16–17–1Net Arch8–19–19–9–1Net Arch2–12–17−20−1Net Arch9−3−17–12–1
rTrain0.920.7rTrain0.80.88rTrain0.60.53rTrain0.580.4rTrain0.470.55rTrain0.60.56
rTest0.750.7rTest0.90.89rTest0.70.55rTest0.650.6rTest0.480.71rTest0.60.56
rValid0.860.6rValid0.80.85rValid0.60.54rValid0.600.5rValid0.470.58rValid0.600.55
DevelopSerres d’Ancosa Mature P.halepensis11Montmell Young P. halepensis Replans de BerguedàYoung and mature P. sylvestris Capçaleres del LlobregatMature P. sylvestris11Aspres Young and adult Q. suber −1Vall de Rialbmature P. nigra mixed with Q. faginea, Q ilex 5
Even/Uneven−1 1 2
Mean.Hshrub2 1 3
Std.Hshrub 11121 6
D.Max 1−111 21 −1 8
D.Min−2 −1 −1−1 1 6
Mean.D −1−1−1−1−1 −1 6
Std.D 1 1 1122 8
Mean.HTrees −1 −1 1 −2 5
Std.HTrees111111 1 1 8
Fcc.Tot −1−1 −1 −14
Fcc.Trees 1 12
Texture −1 1
MatOrg −1 1 −1 3
PhSoil −1 214
RegFelling −1 1
Class.PLAND −1 −1 −13
Class.SPLIT 1 1
Land.SHDI 11 −13
Land.NP 1 12
Table 4. Model results by forest type for the shrub species richness (ShrubRich) and diversity (ShrubShDI). Model performance was evaluated by parsimony in network architecture (Net Arch) and the Pearson product-moment correlation (r) of the training, test, and validation datasets. Numbers indicate times a variable enters the corresponding model, and sign in the model, whereas numbers in bold identify the highest impact predictor for each model in the sensitivity analysis.
VariablesLURichShDILURichShDILURichShDILURichShDILURichShDILURichShDITotal times in shrub models
ModelsNet Arch9–15–13–19–1Net Arch3–23–16–0–1Net Arch7–15–16–13–1Net Arch8–3–17–19–1Net Arch8–7–18–9–1Net Arch5–23–17–17–1
rTrain0.660.57rTrain0.620.5rTrain0.620.55rTrain0.50.53rTrain0.50.6rTrain0.520.5
rTest0.580.73rTest0.870.9rTest0.570.54rTest0.60.52rTest0.50.8rTest0.570.53
rValid0.620.62rValid0.720.6rValid0.60.55rValid0.540.52rValid0.50.6rValid0.540.51
DevelopSerres d’AncosaMature P.halepensis Montmell Young P. halepensis1 Replans de BerguedàYoung and mature P. sylvestris Capçaleres del LlobregatMature P. sylvestris Aspres Young and adult Q. suber Vall de Rialbmature P. nigra mixed with Q. faginea, Q ilex 1
Even/Uneven −1 −1 1 3
Mean.Hshrub2 −1 −1 −211 8
Std.Hshrub −11 −12 −16
D.Max−1 −2 −1−11 −1 7
D.Min 1 1 1 3
Mean.D −1 1
Std.D −1 1 2
Mean.HTrees 3 3
Std.HTrees 11 1 3
Fcc.Tot−1 −23
Fcc.Trees −1−1 −1−2−1−1 2 110
Texture −1 1 2
MatOrg 11 2
PhSoil 1 −1−121 6
RegFelling 11
Class.PLAND−1 −1−1 3
Class.SPLIT −1 −1−1 −14
Land.SHDI3 −11 5
Land.NP 1 −1−1 14
Publisher’s Note: MDPI stays neutral with regard to jurisdictional claims in published maps and institutional affiliations.

