Relationships between Logistics Performance and Aspects of Sustainability: A Cross-Country Analysis

Department of SCM, University of Manitoba, 632 Drake Centre, Winnipeg, MB R3T 5V4, Canada
Sustainability 2021, 13(2), 623; https://doi.org/10.3390/su13020623
Submission received: 29 November 2020
/
Revised: 31 December 2020
/
Accepted: 6 January 2021
/
Published: 11 January 2021
(This article belongs to the Special Issue Sustainable Logistics and Supply Chain Management in the Aspect of Globalization)
Abstract
:The purpose of this study is to investigate relationships between national logistics performance and dimensions of sustainability. A series of hypotheses are developed and tested using regression analysis of secondary data. The sources of data are the Sustainable Society Index (SSI) and the World Bank’s Logistics Performance Index (LPI). Fundamental aspects of social sustainability and well-being—a healthy, educated population, equality, good governance, and reasonable income distribution—are related to higher levels of logistics performance. In addition, while logistics performance is a driver of economic activity and success, it is also a contributor to environmental degradation in the form of harmful emissions. If economic growth is among a nation’s goals, its leaders are advised to support social well-being, along with technologies and practices for greater energy efficiency (and lower emissions) in transportation.
1. Introduction
Adapting Russell’s “short” definition of the term [1], logistics can be defined most simply as the management of inventory, in motion, and at rest, to serve customers. Inventory in motion is usually in or on transportation vehicles, while inventory at rest is in storage, typically in warehouses. Thus, transportation, warehousing, inventory management, and customer service are among the primary logistics functions [2].
Logistics looms large, in terms of its economic and environmental impact. Annual worldwide logistics spending has been estimated to range from 8 to 12 trillion U.S. dollars, or approximately 12 percent of global gross domestic product (GDP). Armstrong & Associates Inc. pegged global logistics spending at $9.6 trillion in 2018, with the following breakdown by logistics functions: 43 percent for transportation by truck; 33 percent for inventory and warehousing; 14 percent for transportation by air, rail and water; and 10 percent for various administrative functions [3]. In 2020, global logistics spending is forecast to reach $10.6 trillion, with transportation accounting for 70 percent of the total [4].
Energy consumption is by far the largest source of human-made greenhouse gas (GHG) emissions, accounting for 73 percent of global emissions. Within energy consumption, three sectors—electricity and heat generation (30 percent), transportation (15 percent), and manufacturing/construction (12 percent)—make up 57 percent of global emissions. Two of those sectors, transportation and manufacturing/construction, are also among the top three in GHG emissions growth, at 71 percent and 55 percent, respectively [5]. Climate Watch and the World Resources Institute report 2016 global greenhouse gas (GHG) emissions of around 50 billion tonnes, in carbon dioxide equivalents (CO2e) [6].
While logistics activities, such as warehousing and inventory control, occur across various industries, the majority of logistics-related emissions are from transportation. In the United States, transportation is the leading source of GHG emissions, accounting for 28.2 percent of the total [7]. The International Energy Agency (IEA) estimates the three largest contributors of carbon emissions to be electricity production at 42 percent, transportation at 23 percent, and the industrial sector at 19 percent [8]. The bulk of transportation emissions result from burning fossil fuel to power vehicles—e.g., planes, trains, and automobiles, as well as trucks, buses, ships, and barges.
There is increasing academic attention being paid to sustainable logistics [9,10]; however, most research has a micro orientation (i.e., organizational or inter-organizational focus) rather than a macro orientation (i.e., national or international focus). In a recent exception, Havenga elevates logistics to the macroeconomic realm, with a focus on national logistics cost [11]. Inspired by such work, this paper extends macro-logistics to include social and environmental considerations.
In addition, the logistics literature typically focuses on environmental sustainability [12] or on inter-relationships between environmental and economic sustainability [13], to the neglect of social sustainability. In terms of contributions, this paper appears to be the first to attempt a truly global analysis of both antecedents and consequences of national logistics performance, from a broad sustainability perspective. It also helps clarify the connection between logistics performance and GHG emissions.
The purpose of this study is to investigate relationships between logistics performance and the triple bottom line dimensions, i.e., social, economic and environmental sustainability. The research question is: How is national logistics performance inter-related with elements of social, economic and environmental sustainability? Thus, the study has a macro orientation. The paper is organized into five more sections, starting with a review of recent literature on logistics and sustainability. This review adopts a macro focus, and it includes development of eight hypotheses. Section 3 is next, outlining statistical methods and describing secondary data sets to be analyzed. This is followed by presentation of the statistical results. Section 5 provides a discussion, focusing on practical and theoretical implications of the results, and several directions for future research. The sixth and final section is a brief conclusion, highlighting the primary contributions of the study.
2. Logistics and Sustainability
As noted above, the sustainable logistics literature leans heavily toward an organizational or inter-organizational focus on the environmental dimension of sustainability. These studies have used a variety of research methods, including systematic literature review [14], case studies [15,16], survey research [17,18], content analysis [19], simulation [20], and optimization modeling [21]. These micro-level logistics studies have investigated organizations in several (mostly European) countries, such as Austria [16], Finland [18], Ghana [17], Ireland, Italy, and Sweden [15].
2.1. What Is Logistics Performance?
Traditionally, micro or organizational logistics performance has been defined in terms of cost and service [22]. Total logistics costs contain all costs incurred in the performance or provision of transportation, warehousing, inventory management, product quality, and customer service [23]. Regarding logistics service, primary elements of performance include: inventory availability, lead time, on-time delivery and order accuracy, along with customer satisfaction, e.g., effective response to customer complaints [24]. Beamon adds aspects of sustainability, such as energy consumption and emissions, to the list of logistics performance measures [22].
At the macro or national level, logistics performance literature is relatively rare. The recently introduced macro-logistics concept focuses largely on calculating national logistics costs, i.e., transportation, storage or warehousing, inventory carrying, and management/administration costs [11]. Similar cost categories are covered in the annual Council of Supply Chain Management Professionals (CSCMP) state of logistics report [25]. Currently, the Logistics Performance Index (LPI) remains the only available global, macro-level assessment of logistics service performance [26].
Inspired by Beamon [22], this paper links national logistics performance to various indicators of environmental sustainability, e.g., energy use and emissions. It also links logistics performance to important elements of social sustainability.
Drawing on a biennial World Bank survey of freight forwarders and carriers, the LPI measures perceived logistics performance of nations. It is the only measure of national logistics performance available for a large number of countries, enabling comparison of performance across nations, along with identification of national challenges and opportunities [26]. The LPI relies on perceptions of experienced logistics professionals as qualified informants.
The six indicators of the LPI, all rated on five-point scales from very low performance to very high performance, are: (1) efficiency of customs and border management clearance; (2) quality of trade and transport infrastructure; (3) ease of arranging competitively priced international shipments; (4) competence and quality of logistics services; (5) ability to track and trace consignments; and (6) frequency with which shipments reach consignees within scheduled or expected delivery times.
Several researchers have either compared the LPI to alternative indices or used LPI data to create an alternative index. Markovits-Somogyi and Bokor apply data envelopment analysis (DEA) to assess logistics efficiency at the macro level. Their study covers 29 European nations, using new DEA-PC (pairwise comparison) methodology, as well as the original DEA methods. The model includes nicely matched inputs (e.g., length of roads and railways) and outputs (tonne-km. moved by road and rail). They conclude that DEA yields a very different ranking of European countries in terms of logistics performance, compared to the LPI [27]. In essence, DEA models expect less output from nations with meager inputs.
Martí et al., provide a thorough review of the LPI methodology and propose a synthetic index of logistics performance using DEA techniques for international benchmarking purposes. Given the six LPI indicators, the approach is also a tool for multiple criteria decision making (MCDM). As might be expected, their results in comparing 141 countries reveal that logistics performance depends largely on national income and geographical area (e.g., Europe vs. Africa). The higher income countries are among the best logistics performers [28].
2.2. What Is Sustainability?
According to Keating, “Sustainability is about meeting the needs of today without undermining the ability of future generations to meet their own needs. It requires a sound economic system, healthy people in an equitable society and a healthy environment to support humanity [29].” This definition aligns with the triple bottom line (TBL) sustainability framework, introduced in 1994 by John Elkington, to both examine and make more favorable the social, environmental, and economic impact of organizations [30].
The Global Reporting Initiative (GRI) adopts the TBL categories and expands each category into more detailed aspects of sustainability [31]. Aspects of the economic category include economic performance, market presence, indirect impacts and procurement practices. The environmental category contains energy and emissions, along with materials, water, biodiversity, transport, supplier environmental assessment, and several other specific aspects.
With four sub-categories, each consisting of numerous aspects, the social category is the most ambitious of the three categories. The GRI social subcategories are: labor practices and decent work, human rights, society, and product responsibility. While anti-corruption and public policy are aspects of the society subcategory; issues of gender equality (such as equal remuneration), Indigenous rights, diversity and equal opportunity, and non-discrimination span the GRI human rights and labor practices subcategories [31].
Carter and Rogers also adopt and extend the TBL, by adding four “supporting facets” to the three dimensions. These supporting facets are: transparency, organizational culture, strategy (i.e., inclusion of sustainability in strategy), and risk management (e.g., contingency planning and dealing with disruptions) [32]. The current paper is focused on certain aspects of the three TBL dimensions, particularly the environmental and social dimensions, without explicitly addressing the supporting facets.
A sustainable society or nation is economically viable, environmentally sound and socially responsible [33]. Thus, the Sustainable Society Index (SSI) is comprised of three dimensions: human (or social) well-being; environmental well-being and economic well-being. The social dimension consists of three sub-indices (and nine indicators): basic needs (sufficient food, sufficient to drink and safe sanitation); personal development and health (education, healthy life and gender equality); and well-balanced society (income distribution, population growth and good governance).
The environmental dimension is comprised of two sub-indices (and seven indicators): natural resources (biodiversity, renewable water resources and consumption) and climate and energy (energy use, energy savings, greenhouse gases and renewable energy). Finally, the economic dimension also consists of two sub-indices (and five indicators): transition (organic farming and genuine savings) and economy (gross domestic product, employment and public debt). Table 1, adapted from [34], shows the sources and descriptions of all twenty-one SSI indicators.
2.3. Antecedents to Logistics Performance
There are relatively few studies linking aspects of social sustainability to logistics performance at the macro level. In a rare example of such research, Koh et al. adopt the resource-based view (RBV) by considering corruption control and good governance as resource factors, which could impact logistics performance. Using the LPI, Transparency International’s Corruption Perceptions Index (CPI) and the World Bank government effectiveness (GE) indicators from 2007 to 2014 for 26 Asian countries, they conclude that CPI significantly affects LPI; and GE moderates the CPI/LPI relationship. (Note: CPI and GE indicators are similar to the “good governance” indicators in the SSI). Surprisingly, the study supports a “greases the wheels” hypothesis—i.e., more corruption and weaker governance yield higher logistics performance, among Asian nations [35].
Guided by the RBV as well as institutional theory, Wong and Tang compile a data set including the LPI and CPI for 93 countries over four years. They find lower corruption (i.e., better institutional quality) and more political stability related to higher national logistics performance. By complementing the RBV with the institutional quality concept, corruption is seen as an obstacle to economic and social progress. Public sector institutions, as regulators and law enforcers, influence a nation’s level of corruption [36].
With data on 139 countries across all continents, Larson reports significant links among corruption, gender inequality and logistics performance. Specifically, significant direct effects are evident between the CPI and LPI, as well as the United Nations Development Programme (UNDP) gender inequality index (GII) and LPI. Corruption and gender inequality are detrimental to logistics. There is also evidence of an indirect CPI → LPI effect, via gender inequality [37].
Using the SSI, this study expands the concept (and measurement) of social sustainability, beyond gender inequality and corruption. Social sustainability includes governance and equality. In addition, it includes education and health, as well as reasonable income distribution and population growth.
In this broader sense, greater social sustainability or well-being supports higher logistics performance. The more a society mistreats or neglects some of its people, including prospective logisticians, the more difficult it will be to achieve a high level of logistics performance. Social sustainability is an antecedent; social well-being enables logistics performance. Thus, the first four hypotheses are:
Hypothesis 1 (H1).
Well-balanced societies have higher national logistics performance.
Hypothesis 2 (H2).
Well-balanced societies provide greater personal development and health.
Hypothesis 3 (H3).
Societies with greater personal development and health have higher national logistics performance.
Hypothesis 4 (H4).
Personal development and health mediates the well-balanced society/logistics performance relationship.
2.4. Consequences of Logistics Performance
Several research teams have extended the LPI by adding environmental indicators to create hybrid or composite indices. For instance, Kim and Min compute their “green logistics performance index” (GLPI) for 146 countries by combining two of the six LPI indicators (infrastructure and timeliness) with five Environmental Performance Index (EPI) indicators that measure GHG and other emissions. They conclude that greater logistics efficiency and higher national income levels could lead to environmental degradation in the form of more emissions [13]. This is the activity effect. Economic growth implies more logistics activity, which means higher fuel consumption and more emissions [38].
Mariano et al., use eight variables to construct their “low carbon logistics performance index” (LCLPI) for 104 countries. The eight variables are: all six LPI indicators, GDP and transportation CO2 emissions. These researchers note that logistics enables economic output, which is a cause of CO2 emissions [39]. More recently, Lu et al. develop an “environmental logistics performance index” (ELPI) to represent trade-offs between logistics efficiency and protection of the environment. The ELPI combines all six LPI indicators with CO2 emissions intensity and oil consumption intensity in transportation. Similar to GLPI and LCLPI, this index is related to national income [40].
Zaman and Shamsuddin compile panel data for 27 European countries from 2007 to 2014 to study the impact of logistics performance on energy use, emissions and economic well-being. The LPI indicators are found to have varying effect on energy use and emissions. Surprisingly, they report that greater logistics “competence” reduces fuel consumption but increases carbon emissions [41]. In a somewhat similar study, Liu et al. assemble data for 42 Asian countries from 2007 to 2016. Their results show that logistics performance, measured by various LPI indicators, is connected to environmental degradation. Further, greater industrialization and urbanization bring higher CO2 emissions [42].
In another recent study, Rashidi and Cullinane observe that the logistics sector is: a notable contributor to GDP, a large-scale employer, a major user of energy, and a substantial contributor to GHG emissions. They propose a sustainable operational logistics performance (SOLP) metric to supplement the LPI, and compute their SOLP for 22 Organization for Economic Co-operation and Development (OECD) nations. The SOLP accounts for logistics activity, energy consumption, emissions, and job creation in logistics [43]. Kahn et al. conducted a panel study of Asian “emerging economy” nations, with data from 2001 to 2017. They found three (of the six) LPI indicators to have positive, significant correlations with GDP per capita. However, logistics performance was found to have a negative relationship with environmental concerns, such as CO2 emissions. These researchers also discuss the impact of political instability on logistics, and the impact of logistics—and the emissions it produces—on human health [44].
In addition, Kahn and collaborators use data from the World Bank to study relationships between the LPI and elements of sustainability, including use of renewable energy and public health spending, across ten member countries of the Association of Southeast Asian Nations (ASEAN). They connect higher logistics performance to improved environmental performance, better health and economic growth [45]. Other researchers analyze the impact of the LPI on CO2 emissions per capita in 11 Balkan countries over four years: 2010, 2012, 2014, and 2016. Despite positive Pearson correlation between LPI and CO2 emissions (p < 0.01), higher LPI scores are linked to lower CO2 emissions in a regression model that includes GDP per capita and urbanization as control variables [46].
Another current study, using data on 42 countries from 2007 to 2018, reports similar results—positive bivariate correlation between LPI and CO2 emissions (0.42), but a negative relationship between LPI and CO2 emissions in a multivariate regression model. Two predictors of LPI, energy consumption and CO2 emissions, had very high positive bivariate correlation (0.81). Such a result is expected, since it is well-known that energy consumption is the leading cause of GHG emissions. However, in the multivariate regression model, with LPI as the dependent variable, energy consumption is positive and significant; while emission of CO2 is negative and significant [47]. Perhaps this rather puzzling result is due to multi-collinearity among the predictors.
The literature adopting a macro-orientation regarding the impact of logistics performance on economic and environmental sustainability suggests that logistics “has the potential to increase and/or decrease the overall economic and environmental performance” of nations [45] (p. 835). Inspired by the extant literature, this study extends prior research by modeling economic and environmental sustainability or well-being as consequences of logistics performance, with economic performance as a mediator of the logistics/environmental performance link. Logistics drives economic activity; logistics, along with the economic activity it enables, consumes fuel and contributes to GHG emissions.
According to Sustainable Development Technology Canada, three effects determine the impact of transportation and logistics on energy consumption and emissions: the activity effect, the structural effect, and the energy efficiency effect [38] (p. 21). In transportation and logistics, the major driver of energy use and emissions is the volume of freight shipped, i.e., demand for logistics services. This is the activity effect. In a world of growing population, and a global economy keen on growth, the activity effect is increasing. According to the UN Population Division, global human population more than tripled over the last seventy years, from 2.54 billion in 1950 to 7.79 billion people in 2020 [48]. To accommodate these folks, global GDP has also risen dramatically, from 11.36 trillion in 1960 to 84.94 trillion in 2019, with both figures in constant 2010 U.S. $ [49].
The structural effect pertains to shifts among modes of transportation in the movement of freight. For instance, moving freight by rail is generally more fuel efficient (and less intense in terms of emissions), compared to movement by truck [39], particularly for heavy loads over long distances. Finally, the energy efficiency effect is driven by policies, practices and technologies that yield reduced energy consumption (and fewer emissions) to move given volumes of freight from origin to destination. Drivers of this effect include everything from fuel taxes to slowing vehicles down to engine technology and more aerodynamic vehicle design [50,51].
The following hypotheses on the impact of logistics on the environment imply that the activity effect trumps structural and energy efficiency effects. Logistics performance is viewed as an antecedent to economic activity and growth, enabling economic well-being while adding to environmental degradation in the form of emissions. Thus, the next four hypotheses are:
Hypothesis 5 (H5).
Higher logistics performance reduces environmental well-being within nations.
Hypothesis 6 (H6).
Higher logistics performance increases economic activity within nations.
Hypothesis 7 (H7).
Greater economic activity reduces environmental well-being within nations.
Hypothesis 8 (H8).
Economic activity mediates the logistics performance/environmental well-being link.
3. Materials and Methods
The hypotheses are tested using regression techniques to analyze secondary data. The Hayes PROCESS macro is used to test for indirect effects [52]. As described further below, secondary data is drawn from two published and widely available sources: the World Bank’s Logistics Performance Index (LPI) and the Sustainable Society Index (SSI).
3.1. Logistics Performance Index (LPI)
In the LPI survey, each practitioner/respondent evaluates the logistics performance of eight countries on all six indicators. Countries are assigned to survey respondents in quasi-random fashion, accounting for income level (low, middle or high) of their home country and whether the respondent is from a coastal or a land-locked country. Principal components analysis (PCA) of the normalized ratings generates weights for the six LPI items, which range from 0.40 to 0.42. In other words, the LPI is basically an average rating across the six elements [26]. PCA of the 2018 LPI raw data reveals that a single factor explains 92.3 percent of the variance in these six items, with factor loadings ranging from 0.932 to 0.980. The six LPI items appear to be highly unidimensional. Thus, unlike other recent studies e.g., [42,44], this study uses the complete six-item LPI rather than its individual indicators to test hypotheses.
The latest LPI report observes significant correlation between LPI and the natural log of GDP/capita among the included countries. For this study, the 2016 LPI data are used to match the most recent available SSI data. The 2016 LPI is calculated for 160 countries [53].
3.2. Sustainable Society Index (SSI)
The SSI was developed as a useful, transparent tool to estimate the level of sustainability of a nation. It was published for the first time in 2006 and has been updated every two years. The most recent version is the 2016 edition, for which it is available for 154 countries [34].
Given the objective of the SSI, to estimate the sustainability of nations, indicator scores are aggregated into measures of the three dimensions. For the aggregations, geometric means (rather than arithmetic means) are used, to suppress possible compensation, i.e., low score on one indicator being compensated by high score on another indicator. Based on advice from the Joint Research Centre of the European Commission, the three SSI dimensions are not aggregated into a single overall index. With no scientific basis for differential weighting of the indicators, all of the indicators are equally weighted for aggregation into the three dimensions.
The SSI uses the most recent available data from public sources. While it may be reasonable to assume published data is accurate and reliable, reliability remains a concern. Based on their audit, Saisana and Philippas concluded the SSI “is a conceptually and statistically sound tool, (and) that is widely applicable for ongoing assessment of the human-environmental systems and a key benchmark against which to … inform comprehensive societal policies” [33].
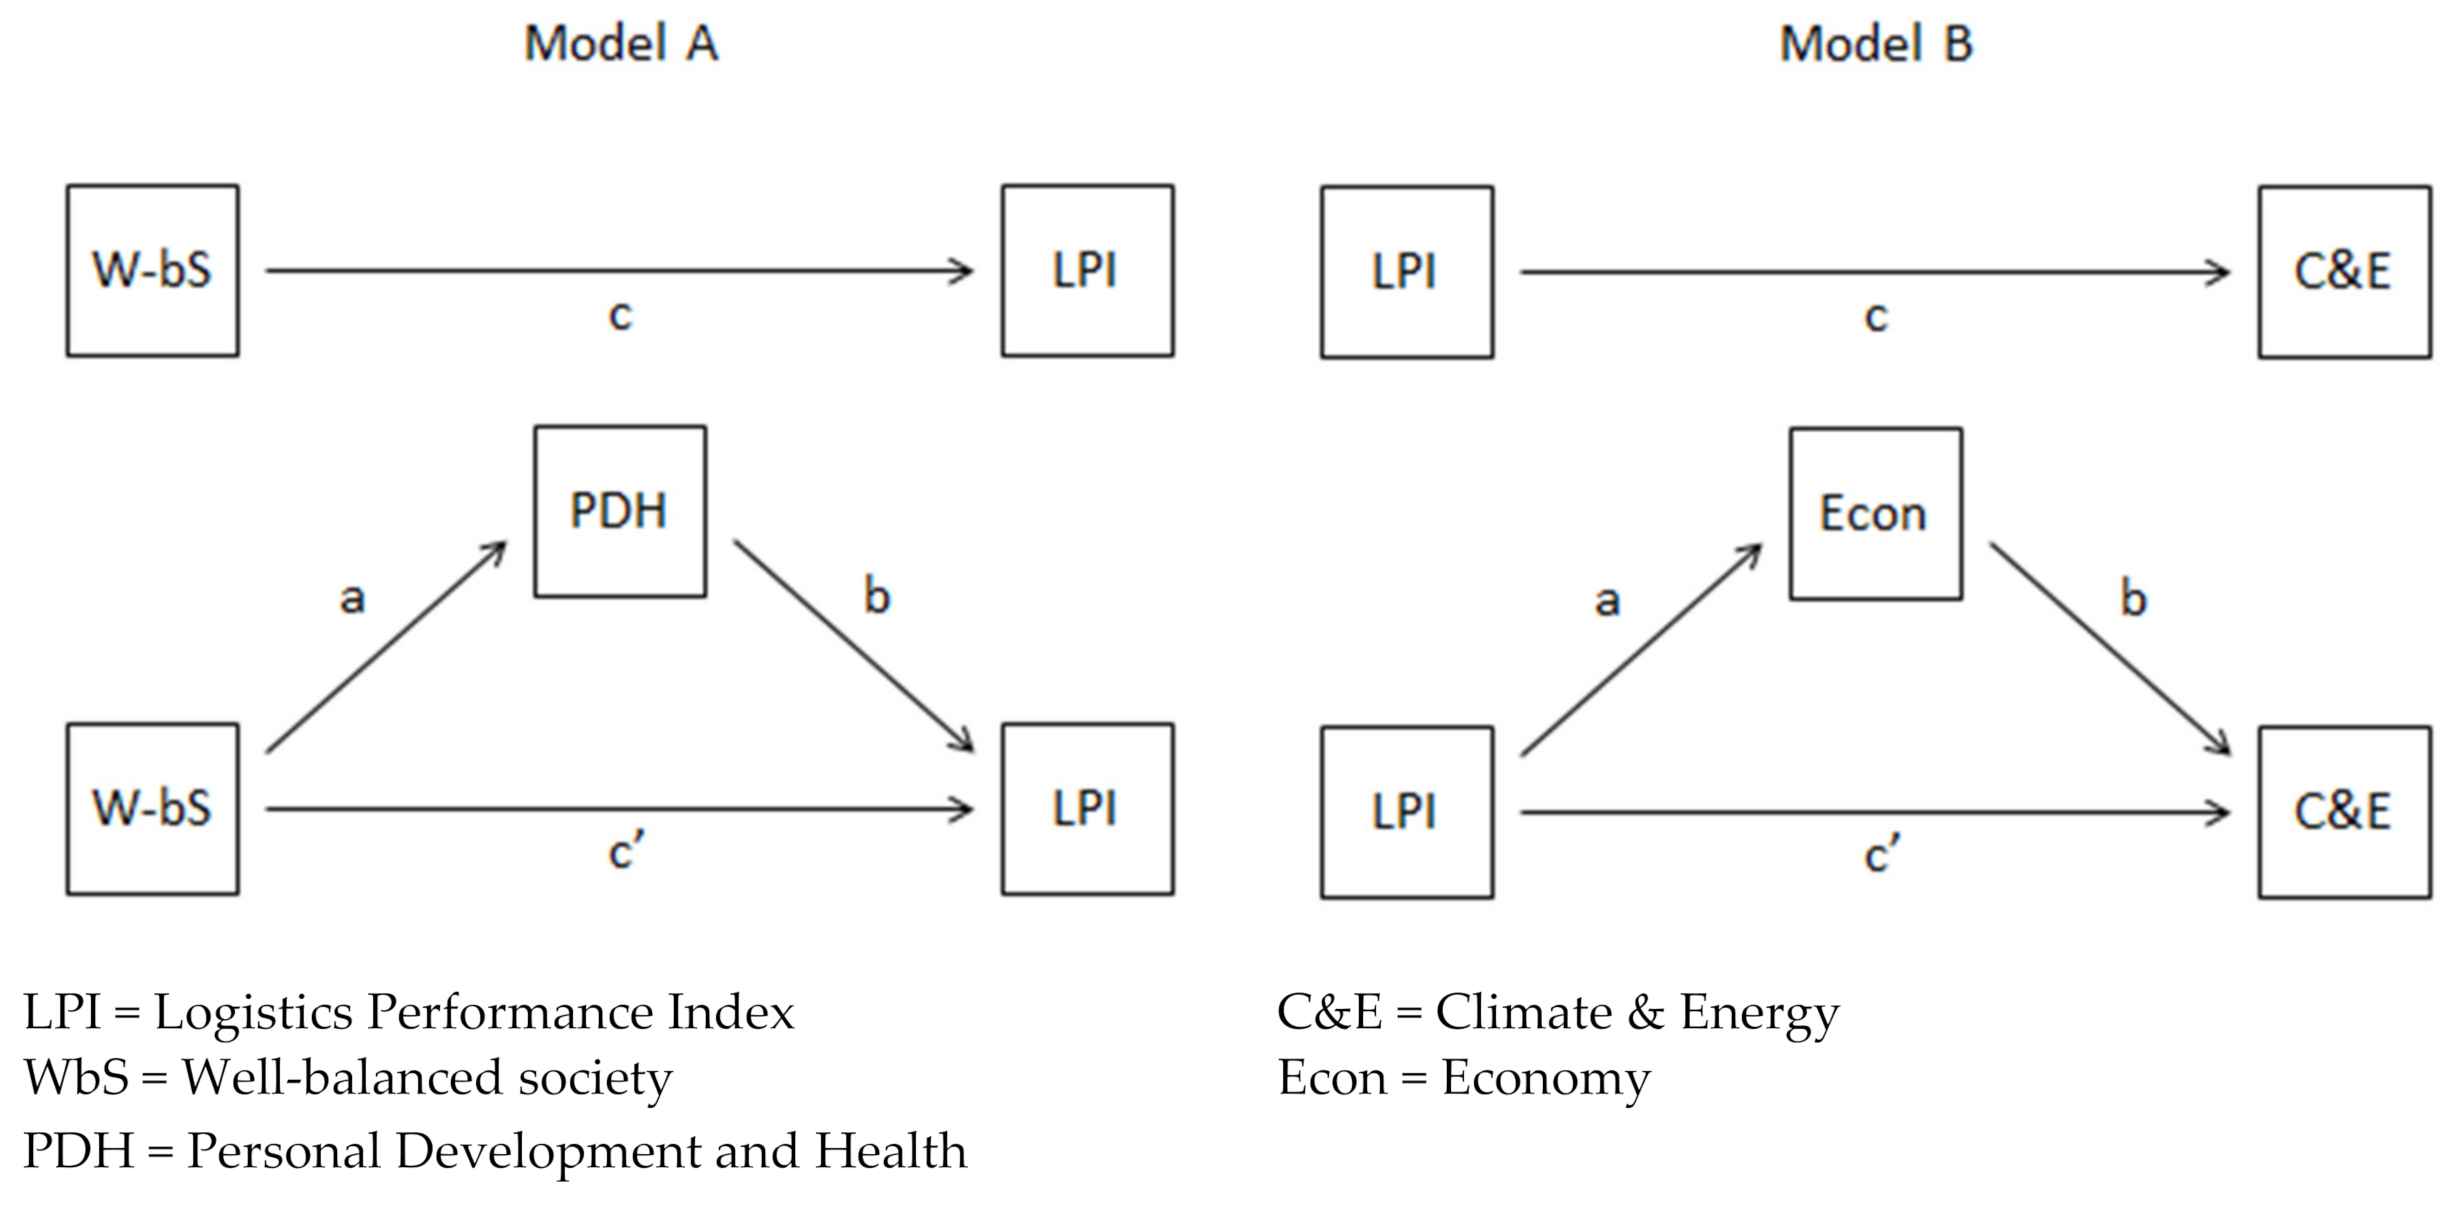
As shown in Figure 1, two regression models—one with logistics performance as a consequence of social sustainability (Model A); the other with logistics performance as an antecedent of both economic and environmental sustainability (Model B)—are analyzed to test the eight hypotheses. Model A is inspired by institutional theory and the RBV [35,36,37]. In Model A, well-balanced society (WbS), a sub-index of the SSI (see Table 1), serves as the independent variable. Personal development and health (PDH), another SSI sub-index, is the mediator. PDH is hypothesized to have a direct effect on LPI, while mediating the effect of WbS on LPI, the dependent variable. Model B suggests that the activity effect, as opposed to structural or energy efficiency effects, dominates the impact of logistics performance on economies and the environment [38]. In Model B, LPI is now the independent variable, climate and energy (C&E) is the dependent variable, and economy (Econ) is the mediator. C&E and Econ are also sub-indices of the SSI.
4. Results
Regression analysis was used to investigate the hypothesis that personal development and health (PDH) mediates the effect of a well-balanced society (WbS) on LPI. The first step is to test for a direct link between WbS and LPI (path c in Figure 1, Model A). As shown in Table 2, this direct link is positive and significant (β = 0.198; t = 8.087; p-value < 0.001). Therefore, the data support H1: well-balanced societies have better logistics. The second step is to test path a, the link between WbS and PDH. This link is also positive and significant (β = 0.412; t = 12.272; p-value < 0.001). Thus, H2 is also supported. As expected, well-balanced societies provide for personal development and health.
Next, a third regression is run, with both WbS and PDH as predictors of LPI. Path b, the link between PDH (the mediator) and LPI is positive and significant (β = 0.351; t = 6.548; p-value < 0.001). Thus, the data support H3 as well. Enhanced personal development and health yield better logistics. Finally, path c’, the relationship between WbS and LPI, while controlling for PDH, is positive but not significant (β = 0.053; t = 1.728; p-value = 0.086). This gives evidence of full mediation, supporting H4. There is a strong indirect effect. Note that nearly half of the variance in LPI is accounted for by the predictors (R2 = 0.473).
The ratio of indirect effect to total effect provides an estimate of the mediator effect size or the amount of mediation [54]. The ratio is calculated as βa × βb/βc, using β coefficients for paths a, b and c in Model A. In this case, magnitude of mediation is (0.412 × 0.351)/0.198 = 0.7304. Thus, the mediator (i.e., indirect effect) accounts for 73 percent of the total effect. The bootstrapped confidence interval of the indirect effect provides a statistical test for mediation [55]. Using the Hayes PROCESS macro [52], an SPSS add on, indicates that the indirect coefficient is significant (β = 0.145; CI = 0.102, 0.196), since the 95 percent confidence interval (CI) does not include zero (0). This further supports H4: PDH is a mediator of the relationship between WbS and LPI.
Regression analysis was also used to test the hypothesis that Economy (Econ) mediates the effect of LPI on climate and energy (C&E). Here, the first step involves testing for a direct link between LPI and C&E (path c in Figure 1, Model B). As presented in Table 3, this direct relationship is negative and significant (β = −1.733; t = −7.600; p-value < 0.001). Thus, the data support H5: high logistics performance yields environmental degradation in the form of more emissions. Path a, the relationship between LPI and Econ is positive and significant (β = 0.941; t = 4.181; p-value < 0.001). Therefore, H6 is also supported. Logistics performance enables economic activity.
Again, a third regression is run, with both LPI and Econ as predictors of C&E. Path b, the link between Econ (the mediator) and C&E is negative and significant (β = −0.360; t = −4.535; p-value < 0.001). The data support H7 as well. Finally, path c’, the link between LPI and C&E, controlling for Econ, is negative and significant (β = −1.394; t = −6.153; p-value < 0.001). This suggests any mediation is partial at best. In addition, almost 38 percent of the variance in C&E is accounted for by the predictors (R2 = 0.378).
The ratio of indirect effect/total effect, i.e., the magnitude of mediation, is (0.941 × −0.360)/−1.733 = 0.1955. The mediator accounts for about twenty percent of the total effect. The PROCESS macro indicates that the indirect coefficient is significant (β = −0.339; CI = −0.590, −0.152), since the 95 percent confidence interval (CI) does not include zero (0). This provides partial support for H8, i.e., Econ partially mediates the link between LPI and C&E.
5. Discussion
Logistics performance is both an antecedent and a consequence of various elements of sustainability. Social well-being and sustainability enhances logistics performance. While logistics performance drives economic activity and national income, it yields environmental degradation in the form of emissions. Thus, this study confirms, clarifies and extends the results of prior research on the impact of logistics performance on economic and environmental well-being, e.g., [41,42,44,46], as well as the impact of social well-being on logistics performance [35,36,37].
5.1. Practical Implications
National leaders looking for ways to improve their countries’ logistics performance are advised to think about social sustainability. Healthy, educated, and respected people are the best logisticians. For instance, gender inequality has been shown to have a negative impact on logistics performance [37]. Leaders looking for ways to improve their environmental performance, with special reference to emissions, are advised to carefully consider opportunities in transportation and logistics. Results of this study indicate that the activity effect is driving the logistics performance/environmental well-being link. If economic growth is on the agenda, i.e., the plan calls for more logistics activity, then leaders should support policies, practices and technologies toward greater energy efficiency in transportation, along with possible structural (i.e., modal) shifts to greener transportation. In other words, public policy should focus on the structural and energy efficiency effects to control GHG and other harmful emissions [38].
5.2. Theoretical Implications
The results of this study clarify conflicting results of previous research guided by the RBV and institutional theory. Does poor governance and societal imbalance strengthen [35] or weaken [36] national logistics performance? Using SSI indicators, this study finds that well-balanced societies, with good governance and more equitable income distribution, tend to have stronger logistics performance. This study also introduces the “three effects” (activity, structural, energy efficiency) concept [38] to explain the impact of logistics on GHG emissions. Does strong logistics performance increase or decrease emissions? The results suggest the activity effect dominates the link between logistics performance and emissions. Better national logistics performance attracts more activity, yielding more GHG emissions.
5.3. Limitations
A noteworthy limitation of this study is its analysis of secondary data to investigate antecedents and consequences of macro-logistics performance. However, both secondary data sources can be considered credible. The SSI has been the subject of a third-party audit [33], while the LPI has been complied by the World Bank biennially since 2010. Another limitation pertains to the indicators available from the SSI and LPI. Future research is needed to expand the set of variables that explain national logistics performance, to include additional social and environmental variables, along with cultural variables. There are also opportunities to study specific nations as cases, with an ultimate objective of improving societal well-being, logistics performance, and environmental sustainability.
6. Conclusions
Recall the research question which guided this study: how is national logistics performance inter-related with elements of social, economic, and environmental sustainability? In addressing that question, several novel contributions have been made. This study appears to feature the first use of the “three effects” concept to explain the impact of logistics on the environment, in terms of GHG emissions. It is also the first to use indicators of the SSI to test both antecedents and consequences of logistics performance vis-à-vis aspects of sustainability. Finally, this study clarifies some conflicting results of previous research, regarding relationships between logistics and governance, as well as between logistics and GHG emissions.
Sustainability is a topic of great breadth and depth. Like all studies on sustainability, this one focused on a limited set of sustainability aspects or issues, including societal balance, development and health, and climate and energy. Future research is needed to investigate how logistics is related to other aspects of sustainability, such as the risk and resilience of nations or the rights of Indigenous peoples.
Funding
The author is the CN Professor of SCM. The Professorship funded this study.
Institutional Review Board Statement
Not applicable.
Informed Consent Statement
Not applicable.
Data Availability Statement
Publicly available datasets were analyzed in this study, available at: https://ssi.wi.th-koeln.de/history.html; https://lpi.worldbank.org/international/global/2016.
Conflicts of Interest
The author declares no conflict of interest.
References
- Russell, S.H. Growing World of Logistics: A General Theory of Logistics Practices. Air Force J. Logist. 2000, 24, 12–17. [Google Scholar]
- Coyle, J.J.; Langley, C.J.; Novack, R.A.; Gibson, B. Supply Chain Management: A Logistics Perspective, 9th ed.; Cengage Learning: Boston, MA, USA, 2013. [Google Scholar]
- Maiden, T. How Big Is the Logistics Industry? FreightWaves. Available online: https://www.freightwaves.com/news/how-big-is-the-logistics-industry (accessed on 11 January 2020).
- Henderson, J. Global Logistics Spending Set to Soar to $10.6 Trillion by 2020. The Wheels Report. Available online: https://wheels.report/news/global-logistics-spending-set-to-soar-to-dollar10.6trn-by-2020/4277 (accessed on 30 March 2018).
- Ge, M.; Friedrich, J. 4 Charts Explain Greenhouse Gas Emissions by Countries and Sectors; World Resources Institute: Washington, DC, USA, 2020; Available online: https://www.wri.org/blog/2020/02/greenhouse-gas-emissions-by-country-sector (accessed on 7 January 2021).
- Ritchie, H. Sector by Sector: Where Do Global Greenhouse Gas Emissions Come From? Our World in Data. Available online: https://ourworldindata.org/ghg-emissions-by-sector (accessed on 18 September 2020).
- EPA. Inventory of U.S. GHG Emissions and Sinks: 1990–2018; U.S. Environmental Protection Agency: Washington, DC, USA, 2020. Available online: https://www.epa.gov/ghgemissions/inventory-us-greenhouse-gas-emissions-and-sinks-1990-2018 (accessed on 7 January 2021).
- Herold, D.M.; Lee, K.H. Carbon management in the logistics and transportation sector: An overview and new research directions. Carbon Manag. 2017, 8, 79–97. [Google Scholar] [CrossRef]
- Yu, M.C.; Wang, C.N.; Ho, N.N. A Grey Forecasting Approach for the Sustainability Performance of Logistics Companies. Sustainability 2016, 8, 866. [Google Scholar] [CrossRef] [Green Version]
- Rad, S.T.; Gülmez, Y.S. Green Logistics for Sustainability. Int. J. Manag. Econ. Bus. 2017, 13, 603–614. [Google Scholar] [CrossRef]
- Havenga, J.H. Logistics and the future: The rise of macrologistics. J. Transp. Supply Chain Manag. 2018, 12, a336. [Google Scholar] [CrossRef]
- Lambrechts, W.; Son-Turan, S.; Reis, L.; Semeijn, J. Lean, Green and Clean? Sustainability Reporting in the Logistics Sector. Logistics 2019, 3, 23. [Google Scholar] [CrossRef] [Green Version]
- Kim, I.; Min, H. Measuring supply chain efficiency from a green perspective. Manag. Res. Rev. 2011, 34, 1169–1189. [Google Scholar] [CrossRef]
- Delmonico, D.V.D.G.; Bezerra, B.S. A Systematic Literature Review on Sustainable Logistics. Lat. Am. J. Manag. Sustain. Dev. 2020, 5, 47–57. [Google Scholar] [CrossRef]
- Huge-Brodin, M.; Sweeney, E.; Evangelista, P. Environmental Alignment between Logistics Service Providers and Shippers—A Supply Chain Perspective. Int. J. Logist. Manag. 2020, 31, 575–605. [Google Scholar] [CrossRef]
- Oberhofer, P.; Dieplinger, M. Sustainability in the Transport and Logistics Sector: Lacking Environmental Measures. Bus. Strategy Environ. 2014, 23, 236–253. [Google Scholar] [CrossRef] [Green Version]
- Agyabeng-Mensah, Y.; Ahenkorah, E.; Afum, E.; Dacosta, E.; Tian, Z. Green Warehousing, Logistics Optimization, Social Values and Ethics and Economic Performance: The Role of Supply Chain Sustainability. Int. J. Logist. Manag. 2020, 31, 549–574. [Google Scholar] [CrossRef]
- Laari, S.; Töyli, J.; Ojala, L. The Effect of a Competitive Strategy and Green Supply Chain Management on the Financial and Environmental Performance of Logistics Service Providers. Bus. Strategy Environ. 2018, 27, 872–883. [Google Scholar] [CrossRef]
- Centobelli, P.; Cerchione, R.; Esposito, E.; Shashi. Evaluating Environmental Sustainability Strategies in Freight Transport and Logistics Industry. Bus. Strategy Environ. 2020, 29, 1563–1574. [Google Scholar] [CrossRef]
- Arya, P.; Srivastava, M.K.; Jaiswal, M.P. Modelling environmental and economic sustainability of logistics. Asia Pac. J. Bus. Admin. 2019, 12, 73–94. [Google Scholar] [CrossRef]
- Jaiswal, A.; Samuel, C.; Ganesh, G.A. Pollution Optimisation Study of Logistics in SMEs. Manag. Environ. Qual. 2019, 30, 731–750. [Google Scholar] [CrossRef]
- Beamon, B.M. Designing the green supply chain. Logist. Inf. Manag. 1999, 12, 332–342. [Google Scholar] [CrossRef] [Green Version]
- Kenderdine, J.M.; Larson, P.D. Quality and Logistics: A Framework for Strategic Integration. Int. J. Phys. Distrib. Mater. Manag. 1988, 18, 5–10. [Google Scholar] [CrossRef]
- Lambert, D.M.; Harrington, T.C. Establishing Customer Service Strategies within the Marketing Mix: More Empirical Evidence. J. Bus. Logist. 1989, 10, 44–60. [Google Scholar]
- Ward, J.; Oca, A.; Acar, K.; Zimmerman, M.; Sonthalia, B.; Sun, Y. Cresting the Hill: CSCMP’s Annual State of Logistics Report; ATKearney: Chikago, IL, USA, 2019; p. 66. [Google Scholar]
- Arvis, J.-F.; Ojala, L.; Wiederer, C.; Shepherd, B.; Raj, A.; Dairabayeva, K.; Kiiski, T. Connecting to Compete: Trade Logistics in the Global Economy; The World Bank: Washington, DC, USA, 2018. [Google Scholar]
- Markovits-Somogyi, R.; Bokor, Z. Assessing the logistics efficiency of European countries by using the DEA-PC methodology. Transport 2014, 29, 137–145. [Google Scholar] [CrossRef] [Green Version]
- Martí, L.; Martín, J.C.; Puertas, R. A DEA-logistics performance index. J. Appl. Econ. 2017, 20, 169–192. [Google Scholar] [CrossRef]
- Keating, M. About the Sustainability Report. Available online: http://sustreport.org/about/ (accessed on 7 January 2021).
- Elkington, J. 25 Years Ago I Coined the Phrase ‘Triple Bottom Line.’ Here’s Why It’s Time to Rethink It. Harv. Bus. Rev. 2018, 25, 2–5. [Google Scholar]
- GRI. Sustainability Reporting Guidelines: Reporting Principles and Standard Disclosures; Global Reporting Initiative: Amsterdam, The Netherlands, 2013; p. 9. [Google Scholar]
- Carter, C.R.; Rogers, D.S. A framework of sustainable supply chain management: Moving toward new theory. Int. J. Phys. Distrib. Logist. Manag. 2008, 38, 360–387. [Google Scholar] [CrossRef]
- Saisana, M.; Philippas, D. Sustainable Society Index (SSI): Taking societies’ pulse along social, environmental and economic issues—The Joint Research Centre audit on the SSI, European Commission. Environ. Impact Assess. Rev. 2012, 32, 94–106. [Google Scholar]
- Sustainable Society Index—Your Compass to Sustainability. Available online: http://www.ssfindex.com/ssi/ssi-2016/ (accessed on 15 November 2020).
- Koh, B.H.; Wong, W.P.; Tang, C.F.; Lim, M.K. The double-edge resource based view of logistics performance and governance in Asian countries. Asia Pac. J. Mark. Logist. 2018, 30, 652–668. [Google Scholar] [CrossRef]
- Wong, W.P.; Tang, C.F. The major determinants of logistic performance in a global perspective: Evidence from panel data analysis. Int. J. Logist. Res. Appl. 2018, 21, 431–443. [Google Scholar] [CrossRef]
- Larson, P.D. Corruption, Gender Inequality and Logistics Performance. Int. J. Logist. Manag. 2019, 31, 381–397. [Google Scholar] [CrossRef]
- SDTC. Sectoral Overview. In Industrial Freight Transportation: SD Business Case; Sustainable Development Technology Canada: Ottawa, ON, Canada, 2009; Chapter 3; pp. 12–22. [Google Scholar]
- Mariano, E.B.; Gobbo, J.A., Jr.; Camioto, F.C.; Rebelatto, D.A.N. CO2 emissions and logistics performance: A composite index proposal. J. Clean. Prod. 2017, 163, 166–178. [Google Scholar] [CrossRef]
- Lu, M.; Xie, R.; Chen, P.; Zou, Y.; Tang, J. Green transportation and logistics performance: An improved composite index. Sustainability 2019, 11, 2976. [Google Scholar] [CrossRef] [Green Version]
- Zaman, K.; Shamsuddin, S. Green logistics and national scale economic indicators: Evidence from a panel of selected European countries. J. Clean. Prod. 2017, 143, 51–63. [Google Scholar] [CrossRef]
- Liu, J.; Yuan, C.; Hafeez, M.; Yuan, Q. The relationship between environment and logistics performance: Evidence from Asian countries. J. Clean. Prod. 2018, 204, 282–291. [Google Scholar] [CrossRef]
- Rashidi, K.; Cullinane, K. Evaluating the sustainability of national logistics performance using data envelopment analysis. Transp. Policy 2019, 74, 35–46. [Google Scholar] [CrossRef] [Green Version]
- Khan, S.A.R.; Sharif, A.; Golpîra, H.; Kumar, A. A green ideology in Asian emerging economies: From environmental policy and sustainable development. Sustain. Dev. 2019, 27, 1063–1075. [Google Scholar] [CrossRef]
- Khan, S.A.R.; Zhang, Y.; Kumar, A.; Zavadskas, E.; Streimikiene, D. Measuring the impact of renewable energy, public health expenditure, logistics, and environmental performance on sustainable economic growth. Sustain. Dev. 2020, 28, 833–843. [Google Scholar] [CrossRef]
- Karaduman, H.A.; Karaman-Akgül, A.; Çağlar, M.; Akbaş, H.E. The Relationship between Logistics Performance and Carbon Emissions: An Empirical Investigation on Balkan Countries. Int. J. Clim. Chang. Strateg. Manag. 2020, 12, 449–461. [Google Scholar] [CrossRef]
- Khan, S.A.R.; Zhang, Y.; Nathaniel, S. Green Supply Chain Performance and Environmental Sustainability: A Panel Study. LogForum 2020, 16, 141–159. [Google Scholar] [CrossRef]
- World Population Prospects 2019; United Nations, Department of Economic and Social Affairs, Population Division: New York, NY, USA. Available online: https://population.un.org/wpp/ (accessed on 7 January 2021).
- The World Bank. GDP (Constant 2010 US$). Available online: https://data.worldbank.org/indicator/NY.GDP.MKTP.KD (accessed on 7 January 2021).
- Larson, P.D.; Elias, A.; Viáfara, J. Toward Sustainable Trucking: Reducing Emissions and Fuel Consumption. Transp. J. 2013, 52, 108–120. [Google Scholar] [CrossRef]
- Inkinen, T.; Hämäläinen, E. Reviewing Truck Logistics: Solutions for Achieving Low Emission Road Freight Transport. Sustainability 2020, 12, 6714. [Google Scholar] [CrossRef]
- Hayes, A.F. The PROCESS Macro for SPSS and SAS. Available online: www.processmacro.org/ (accessed on 11 December 2019).
- Arvis, J.-F.; Saslavsky, D.; Ojala, L.; Shepherd, B.; Busch, C.; Raj, A.; Naula, T. Connecting to Compete: Trade Logistics in the Global Economy; International Bank for Reconstruction and Development/The World Bank: Washington, DC, USA, 2016. [Google Scholar]
- Shrout, P.E.; Bolger, N. Mediation in experimental and nonexperimental studies: New procedures and recommendations. Psychol. Methods 2002, 7, 422–445. [Google Scholar] [CrossRef]
- Mackinnon, S.P. Mediation in health research: A statistics workshop using SPSS. In Proceedings of the Crossroads Interdisciplinary Health Research Conference, Halifax, NS, Canada, 27–28 March 2015. [Google Scholar]
Figure 1.
Antecedents and Consequences of Logistics Performance.

Table 1.
Sustainable Society Index (SSI) Indicators.
| Item | Name | Measure | Source |
|---|---|---|---|
| Basic Needs | Sufficient Food | Percent of population undernourished | FAO FSI |
| Sufficient Drink | Percent of population with sustainable access to an improved water source | FAO FSI | |
| Safe Sanitation | Percent of population with sustainable access to improved sanitation | FAO FSI | |
| Personal Development and Health (PDH) | Education | Gross enrollment ratio for primary, secondary & tertiary education | UNESCO |
| Healthy Life | Life expectancy at birth (number of healthy years) | WHO HALE | |
| Gender Equality | Gender Gap Index | WEF | |
| Well-balanced Society (WbS) | Income Distribution | Ratio of income: richest 10% to poorest 10% | World Bank |
| Population Growth | 5-year change in population (% of total population) | World Bank | |
| Good Governance | Sum of the 6 Worldwide Governance Indicators | World Bank | |
| Natural Resources | Biodiversity: forest and protected area | 10-year change in forest area; size of protected land area (% total land area) | Protected Planet |
| Renewable Water Resources | Annual water withdrawals (m3 per capita) as % of renewable water resources | FAO Aquastat | |
| Consumption | Ecological footprint minus carbon Footprint | GFN | |
| Climate and Energy (C&E) | Energy Use | Energy use (tonnes of oil equivalent per capita) | IEA |
| Energy Savings | Change in energy use over 4 years (%) | IEA | |
| GHG | CO2 emissions per person per year | IEA | |
| Renewable Energy | Renewable energy as % of energy consumption | IEA | |
| Transition | Organic Farming | Area for organic farming (% of agricultural area) | FiBL |
| Genuine Savings | Adjusted net savings as % of GNI | World Bank | |
| Economy (Econ) | GDP | GDP per capita, PPP, current international $ | IMF |
| Employment | Number of unemployed people (% of labor force) | World Bank | |
| Public Debt | National public debt (% of GDP) | IMF |
GDP = gross domestic product; GHG = greenhouse gas; GNI—gross national income; FAO = Food and Agriculture Organization; FSI = Index on Food & Sustainability; WHO = World Health Organization; WEF = World Economic Forum; IEA = International Energy Agency; IMF = International Monetary Fund; FIBL = Forschungsinstitut fur biologischen Landbau (Research Institute of Organic Agriculture); GFN = Global Footprint Network.
Table 2.
Summary of Regression to Explain LPI, with PDH as mediator.
| Path | R2 | F-Stat. | Beta | Std. Error | t-Statistic | p-Value | CI (95%) |
|---|---|---|---|---|---|---|---|
| c (WbS → LPI) | 0.314 | 65.40 | 0.198 | 0.025 | 8.087 | 0.000 | 0.150, 0.247 |
| a (WbS → PDH) | 0.513 | 150.61 | 0.412 | 0.034 | 12.272 | 0.000 | 0.346, 0.479 |
| b (PDH|WbS → LPI) | 0.473 | 63.72 | 0.351 | 0.054 | 6.548 | 0.000 | 0.245, 0.457 |
| c’ (WbS|PDH → LPI) | 0.053 | 0.031 | 1.728 | 0.086 | −0.008, 0.114 |
LPI = Logistics Performance Index (dependent variable); WbS = Well-balanced society, from SSI; PDH = Personal Development and Health, from SSI (mediator).
Table 3.
Summary of Regression Results, with Econ as mediator.
| Path | R2 | F-Stat. | Beta | Std. Error | t-Statistic | p-Value | CI (95%) |
|---|---|---|---|---|---|---|---|
| c (LPI → C&E) | 0.288 | 57.76 | −1.733 | 0.228 | −7.600 | 0.000 | −2.18, −1.28 |
| a (LPI → Econ) | 0.109 | 17.48 | 0.941 | 0.225 | 4.181 | 0.000 | 0.496, 1.385 |
| b (Econ|LPI → C&E) | 0.378 | 43.12 | −0.360 | 0.079 | −4.535 | 0.000 | −0.518, −0.203 |
| c’ (LPI|Econ → C&E) | −1.394 | 0.227 | −6.153 | 0.000 | −1.84, −0.946 |
LPI = Logistics Performance Index; C&E = Climate and Energy, from SSI (dependent variable); Econ = Economy, from SSI (mediator).
Publisher’s Note: MDPI stays neutral with regard to jurisdictional claims in published maps and institutional affiliations. |
© 2021 by the author. Licensee MDPI, Basel, Switzerland. This article is an open access article distributed under the terms and conditions of the Creative Commons Attribution (CC BY) license (http://creativecommons.org/licenses/by/4.0/).
Share and Cite
MDPI and ACS Style
Larson, P.D. Relationships between Logistics Performance and Aspects of Sustainability: A Cross-Country Analysis. Sustainability 2021, 13, 623. https://doi.org/10.3390/su13020623
AMA Style
Larson PD. Relationships between Logistics Performance and Aspects of Sustainability: A Cross-Country Analysis. Sustainability. 2021; 13(2):623. https://doi.org/10.3390/su13020623
Chicago/Turabian StyleLarson, Paul D. 2021. "Relationships between Logistics Performance and Aspects of Sustainability: A Cross-Country Analysis" Sustainability 13, no. 2: 623. https://doi.org/10.3390/su13020623
Note that from the first issue of 2016, this journal uses article numbers instead of page numbers. See further details here.