Article

Population Flow Mechanism Study of Beijing-Tianjin-Hebei Urban Agglomeration from Industrial Space Supply Perspective

1
Institute of Architectural Design & Urban Planning of Architecture, Tianjin University Research Co., Ltd., Tianjin 300073, China
2
School of Architecture, Tianjin University, Tianjin 300072, China
*
Authors to whom correspondence should be addressed.
Sustainability 2021, 13(17), 9949; https://doi.org/10.3390/su13179949
Submission received: 7 July 2021 / Revised: 2 September 2021 / Accepted: 2 September 2021 / Published: 4 September 2021
(This article belongs to the Section Sustainable Urban and Rural Development)

Abstract

:
The growing demographic dividend is declining worldwide due to global population shrinkage. However, with the enhancement of spatial connection, industry-oriented population flow is becoming more and more active. The floating demographic dividend will bring new opportunities to regional development. Population flow has become an important field of urban research. We selected the Beijing-Tianjin-Hebei urban agglomeration as the study area and conducted the study of the interaction relationship between population flow and industry space supply. Considering that it takes time for space supplies to be industrial entities and then to affect population flow, this study built a fixed-effects model with annual space supply and “t + 1” population flow to perform regression analysis. The main findings of the research can be concluded as below. The regional population flow was mainly rural population and floated mainly to rural areas. It is difficult to complete the urbanization of floating population through land urbanization due to China’s household registration system. The population flow is sensitive to industry space supply and its spatial development conditions. As the study area is an important global urban agglomeration and China’s political, economic, and cultural center, its regional population flow is representative and typical. Guiding its population flow to form a coordinated spatial and social network can provide scientific support for regional industry space supply and allocation, and can provide a reference for the development of other urban agglomerations.

1. Introduction

Though the global population trend is changing from growth to reduction (shown as birth rate decrease and population contraction), the speed of population flow is accelerated due to globalization in last decades (regardless of the impact of COVID-19) [1,2,3,4,5,6,7,8]. Therefore, in addition to the slowing or even negative growth of the natural population growth rate, population outflow in areas with imperfect development or weak development potential has also led to the intensified population contraction trend. However, in this macro contracting trend, thanks to the progress of science and technology, transportation, open-market environments, and other advantages, the population of urban agglomerations has not declined, and its population is still increasing because of population inflow. In this context, population flow has increasingly become an important research field of multi-level (international, national, regional, metropolitan, urban, and rural) urban development research.
Human beings are the creators, builders, and users of the city, so most studies about population flow focus on the relationship between population and urban space development. Researchers are committed to revealing urban and rural space development regulations by studying the evolution of the population temporal-spatial pattern, including driving factors, regulations, spatial distribution models of population flow/change, and the relationship between population flow and land use. They developed interdisciplinary methods to study these various aspects, including politics, economy, folklore, geography, environment, history, agriculture, and urban planning.
The first scholars conducted research on population flow’s laws, dynamics, and its relationship with urban development, and laid the foundational theoretical framework for later and current research. Starting from migration, Ravenstein put forward seven rules about the phenomenon of migration in 1885 [9]. Later researchers paid more attention to the impact of population flow on urban scale and spatial structure, and also explored and summarized the interactive mode of urban space and urban population flow, forming a number of classic theories. In 1925, Burges developed concentric ring theory and identified invasion and succession [10]. Then, in 1938, Louis Wirth, the sociology representative of the Chicago School, defined urbanism from the perspective of urban lifestyle, pointing out that population size, density, heterogeneity, and their interaction are the main factors leading to urban growth [11]. Hoyt adopted the filtering theory in the sector model [12]. Alonso proposed trade-off theory, stating that residents would prefer to trade off the accessibility to urban center to obtain more land [13]. Lee (1966) developed Bagne’s push-and-pull theory and determined that both inflow sites and outflow sites have the force of pull and push [14].
Since then, globalization has extended the above mechanisms and laws to more macroscopic studies. Expansion of population and urban areas is a global trend and affects both cities and the natural environment. The changes of population patterns have revealed the laws of population flow, urban scale, and hierarchical structure of cities in the region [15,16]. Zipf’s law is one of the most early and popular rules adopted to population change [17], and Batty summarized it as a scaling law of population flow in his article and thought it was applicable to various models [18]. Gonzalez et al. employed mobile phone data to study human mobility patterns and found that there are inherent similarities in different patterns and that the similarities influence urban development and planning [19].
Thanks to the support of big data and government public data, research objectives are more diversified and detailed, shifting from the macro driving factor model to more detailed multi-level (international, intercity, urban, rural) laws and driving forces, policy influence, urbanization, population patterns, etc. [18,20,21]. Xiao-Yong et al. formulated a universal model for multi-scale population flow to reveal different flow patterns’ dynamics [22]. Jonathan and Laura studied the impact of population flow in Stockholm on social integration, and they suggested that the city needs to introduce spatial connectivity to revise ethnic segregation [23].
Population flow is also an important tool to study urbanization process. Scholars studied population flow in various countries and regions [24,25], interpreting the stages and characteristics of urbanization through destination changes and quantitative changes of population flow, to illuminate the characteristics and influencing factors of urbanization [26] and counter-urbanization [25,27,28,29,30,31], rural gentrification [32] etc. China’s rapid urbanization has also led to rapid and multiple changes in population pattern and network in a short period. Therefore, research on China’s population flow has been a hotspot in related fields in recent years. Jayson S studied the spatial-temporal evolution of the COVID-19 in China using population flow data to help with the allocation of resource at this emergency period [3]. Zeng et al. used the Baidu heat map to study population flow patterns in and after COVID-19 in Tianjin, China, and found that the virus caused the large-living-circle pattern of population distribution transformed to multiple small-living circles [7]. Wang et al. studied populating pattern difference and identified a national hierarchical structure of flowing population aggregation, using population flow data prior to and during the Chinese Spring Festival [33]. The change in population pattern also reflects the urbanization process of cities at different levels. He et al. studied the shortage of registered residence urbanizing systems and found it led to the lack of ability to prevent population outflow [34]. Chen et al. (2016) studied the spreading effect of different administrative combinations and found that cities were more likely to expand while they were adjacent to a county-level administrative [35].
At the same time, more researchers focus on population changes and spatial changes caused by land urbanization and population urbanization. Song and Liu studied the spatial changes in rural settlements from the interactive relationship of rural register population change and rural settlement area change, and they found that rural population flow leads to land use change in both urban and rural areas [36]. Congmou Zhu found that the urbanization process would be stabilized by regulating rural-urban population flow and urban-rural construction land transformation [8]. Chengcheng et al. found that rural population would decrease with the increment of urban population, urban construction land, and rural settlement land. They also suggested to add time-series data and pay more attention to the population flow in future studies [37].
The above studies included various types, such as tidal population flow around holidays, policy-oriented population flow led by rural-urban space transformation, and intra-city population flow during the epidemic. However, there is still space for improvement in the current research on population flow. First, there are relatively few studies conducted based on continuous time-series data [37]. Current studies use long-interval annual cross-sectional data or big data before and after a special period to study population flow or distribution. These two types of research have obtained scientific conclusions on the macro and micro time scales respectively, but there is still a lack of continuous time series related research to form comparison.
Second, although many scholars focus on the population-land relationship, few studies refined it to relationship between regional population flow and industrial space supply. “People follow industry” is the basic feature of population flow. In this context, urban space supply for housing, green space, public services, education, and medical care reflects more residence intentions. Paniagua found that the main reason for the urban-rural migration is the desire to be self-employed [38]. China’s population flow is also driven by career development. It would be more accurate to judge the direction of future population flow by studying it from an industry perspective.
Third, there is still a lack of research on rural population flow both in China and worldwide. The rural population accounts for 36.11% of China’s total population. Rural floating population is the main component of China’s current and future population flow [39]. However, due to the difficulty of obtaining data in rural areas, previous studies have paid less attention to this field. Existing studies focus more on the “rural-urban” population flow, but it is usually a policy-oriented flow of rural to residential brought about by urbanization, rather than an active physical spatial flow.
According to the latest data from the 7th Census, China’s population is growing at a low speed, from 1.34 billion (2010) to 1.41 billion (2020), with an average annual growth rate of 0.53%. However, at the same time, China is also facing the trend of decreasing birth population, declining fertility willingness, and a declining number of childbearing-age women. In 2020, the number of births in China was only 12 million. Compared with the 17.86 million reached by the “comprehensive two-child” policy in 2016, the number of births has dropped sharply. At the same time, cities, as well as most towns and villages, have been experiencing shrinkage caused population flow to metropolitan areas.
Under this complex demographic trend, this research focused on the above shortcomings and selected the Beijing-Tianjin-Hebei urban agglomeration as the research area. As the research area is an important global urban agglomeration, guiding its population flow to form a coordinated spatial and social network can provide scientific support for regional industry space supply and allocation. The study attempted to answer the question of how population flows in China and the urbanization of the floating population, and how industry space supply affects regional population flow in China. We studied the interactive relationship between regional population flow (which is mainly composed of rural population flow) and industry space supply to reveal the population-space interaction relationship and the changing urban-rural relationship.

2. Materials and Methods
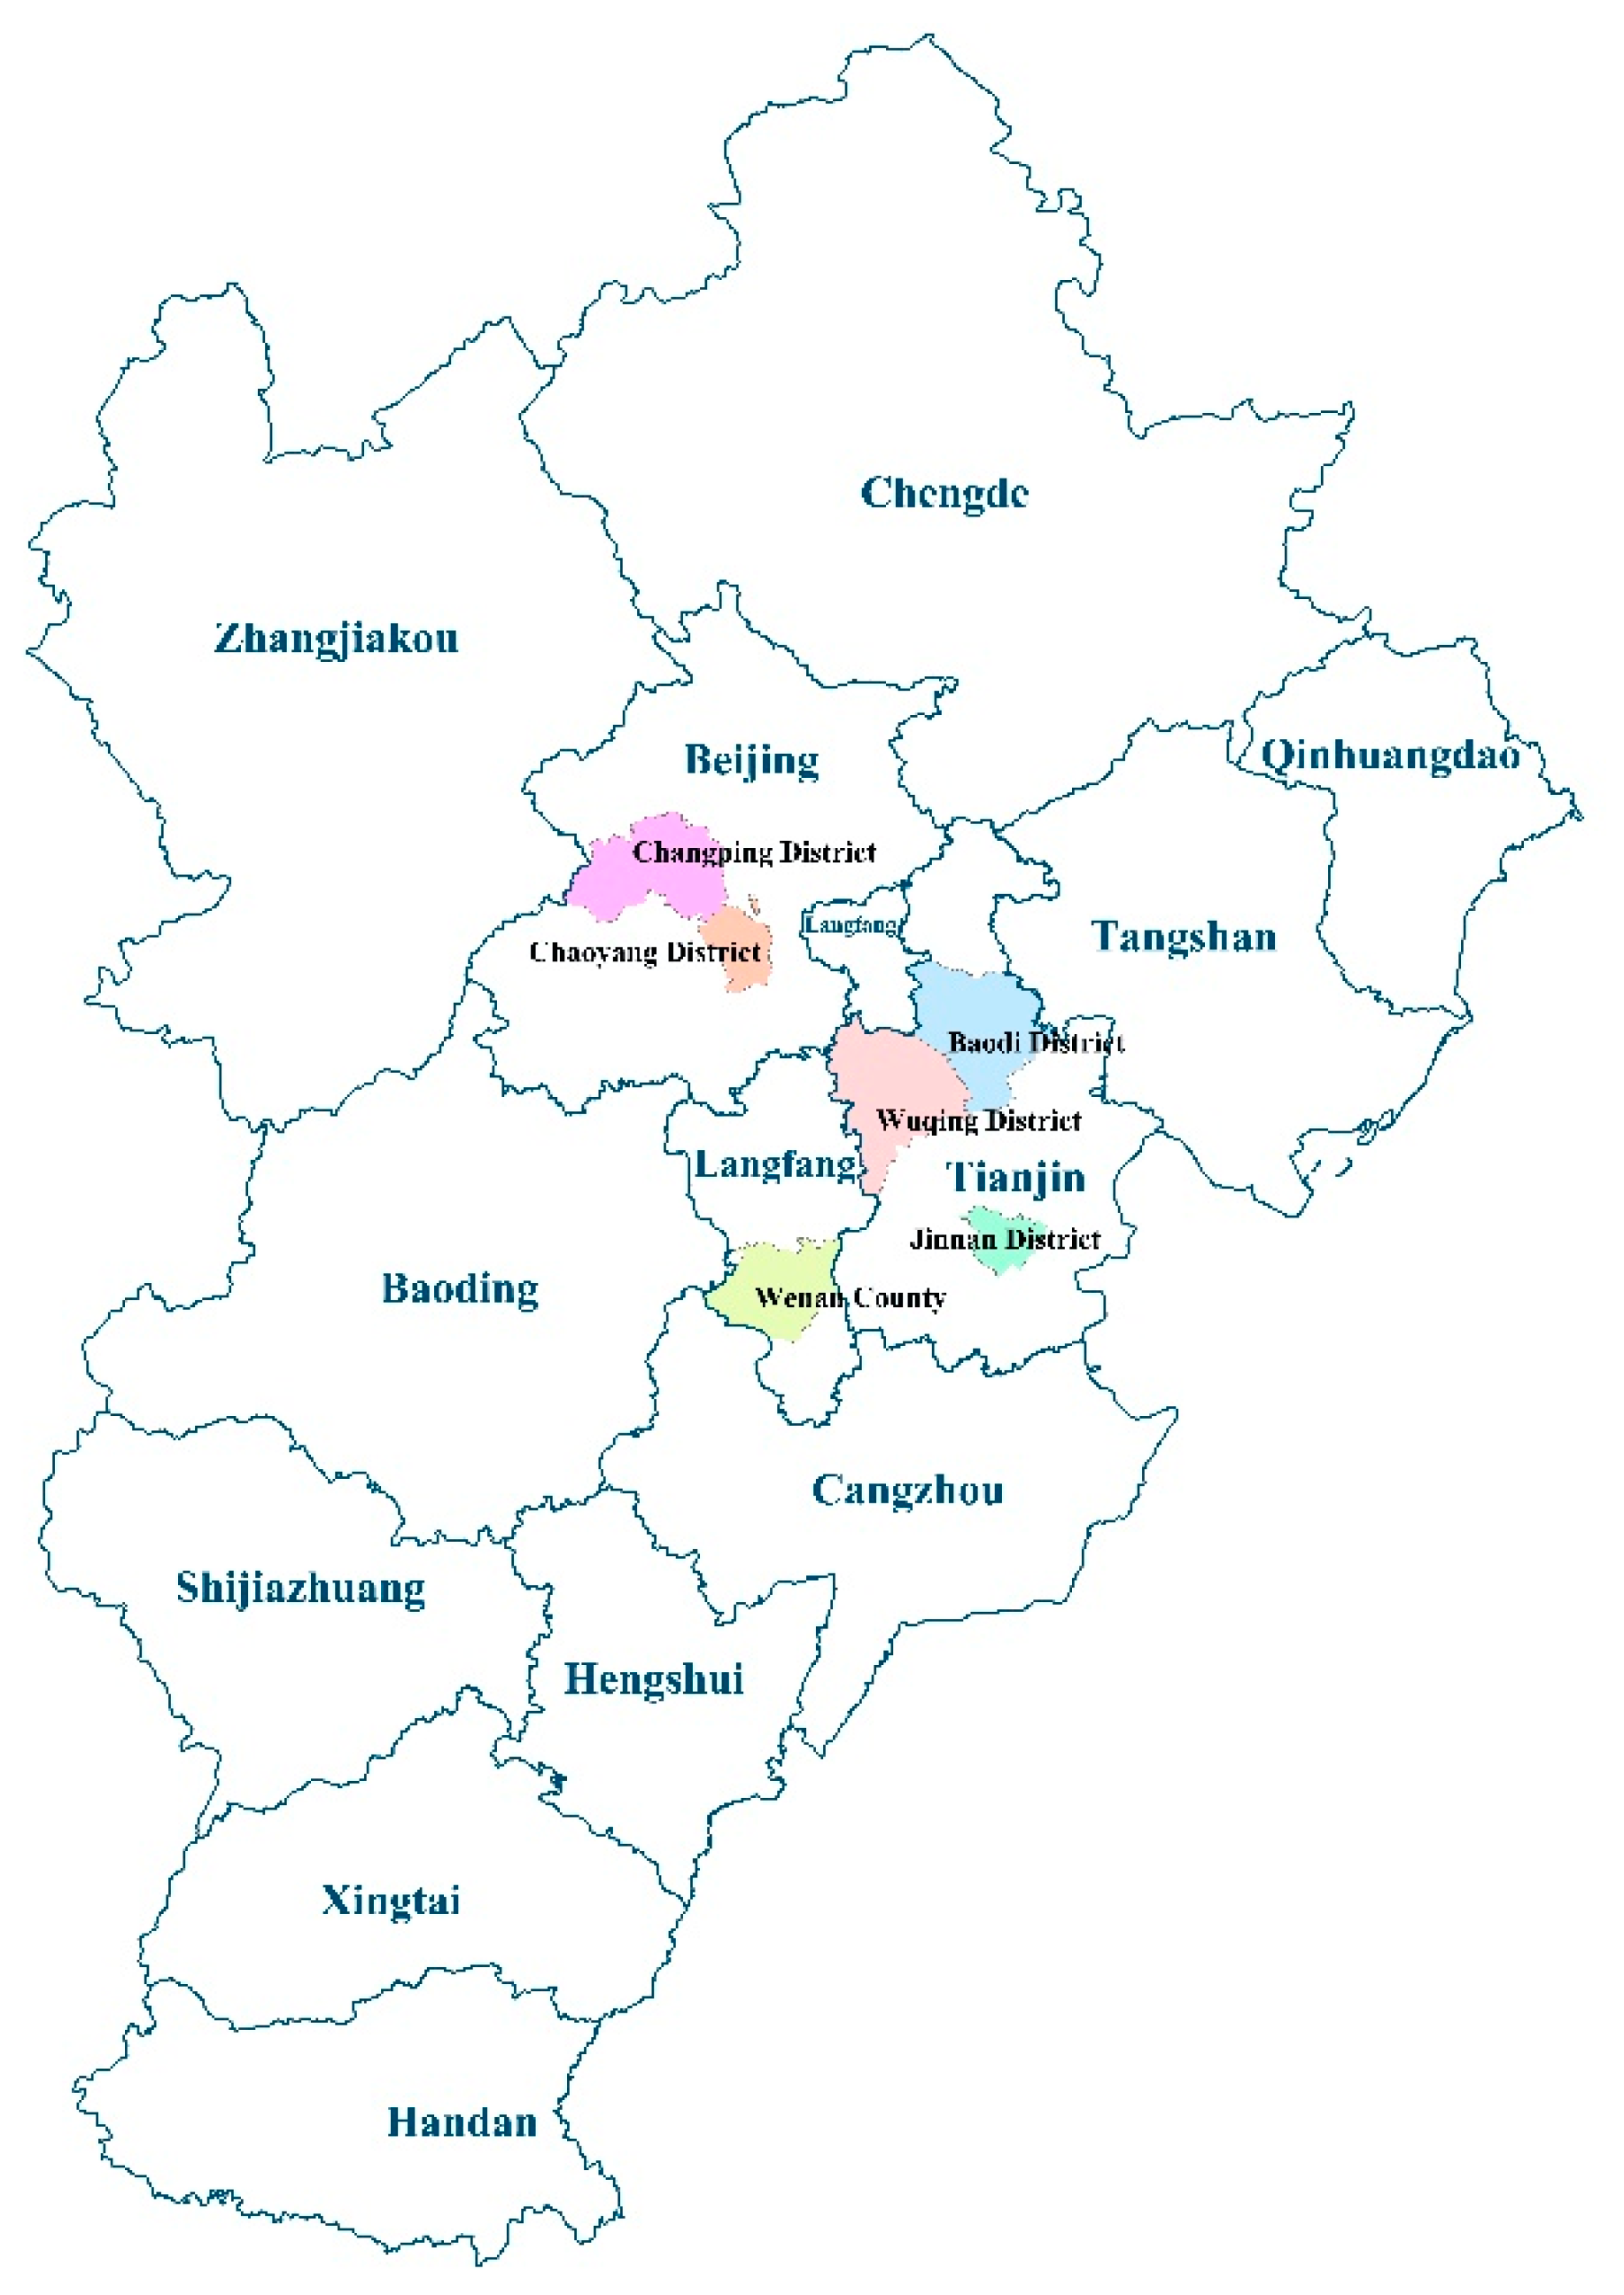
2.1. Study Area

We selected the Beijing-Tianjin-Hebei urban agglomeration as study area, with an administrative area of 218,000 km², including 13 cities; the total population of the area was 110 million, as announced in the seventh census. As an important integrated urban agglomeration in North China, the population flow and land supply of the Beijing-Tianjin-Hebei Urban Agglomeration is more dynamic, and it can better reflect the spatial development logic and population flow mechanism of China’s political, economic, and cultural core. Additionally, it can be used as a prediction tool and reference for population flow mechanisms in other regions. At the same time, the Beijing-Tianjin-Hebei urban agglomeration is an important global urban agglomeration. The study of its interaction between population flow and industry space can guide population flow to form coordinated spatial and social networks, and provide scientific support for the supply and allocation of regional industry space.

2.2. Data

The population flow data frame was sampled by the PPS (Probability-Proportional-to-Size Sampling) method, and the total floating population was 76,992 (including historical and new population flow). Then, we cleaned and processed the original data to establish a new population flow database of the study area from 2014 to 2017, including a total of 6185 samples (1824 samples in 2014, 2131 samples in 2015, 1051 samples in 2016, and 1179 samples in 2017). Then, the study area was divided into 200 spatial units by the county administrative boundary, and the samples were collected, matched, and analyzed in spatial units, forming 292 spatial unit samples in total (60 samples in 2014, 91 samples in 2015, 71 samples in 2016, and 70 samples in 2017).
We cleaned land transaction data and established the space supply database of secondary industry and tertiary industry in the study area from 2014 to 2017, and formed a total of 34,336 industrial space supply data after screening and calculating (17,582 for secondary industry and 16,754 for tertiary industry). Based on above two databases, this study conducted basic research and analysis to form the basic law of regional population flow and industry space supply.

2.3. Methods

As the basic law of population flow is that population flows with industry development, we took the flow as consequence, since it takes certain periods from space supplies to industrial entities to affect the population inflow. We employed the average time of construction after contract signing. Therefore, this study employed the “t” annual space supply, the “t” population flow, and the “t + 1” population flow to perform regression analysis. For example, we employed population flow in 2015 as dependent variable, and accordingly, population flow in 2014 and space supply in 2014 as independent variables. Then, we associated the new population flow data with the industrial space supply data of each district and county, and generated a total of 166 spatial samples (55 samples in 2015, 58 samples in 2016, and 53 samples in 2017).
Due to the large gap in the magnitude of data, the data were first processed by taking the logarithm. As the value of some sample indicators was zero, such as industry space supplies, the logarithm was taken after adding 1 to all data. As the population flow data were an Unbalanced Panel data formed by random sampling of counties in study area, we selected FEM (fixed-effects model) for regression after establishing the basic regression logic.
The basic model of panel data is as below,
Y i t = α + β X i t + μ i + v i t
Y ¯ i = α + β X ¯ i + μ i + v ¯ i
Y i t Y ¯ = β ( X i t X ¯ i ) + ( v i t v ¯ i )
In Equation (1), i stands for space sample and t stands for year, β is the coefficient matrix to be estimated, X i t is the observation value of the ith space sample of the kth explanatory variable in year t , μ i is the effects of the unobserved space sample, and v i t is the random error term. Then, all variables were de-averaged to eliminate μ i , Equation (1) and (2). Then we used FEM (Equation (3)) to perform regression. The regression took “New Flow Number” and “Rural Destination Proportion” as dependent variables and divided independent variables into five types (31 indicators in total). After eliminating collinearity with the standard of VIF < 10, five types of independent variable sets (20 indexes in total) were formed to build FEM (Table 1).

3. Results

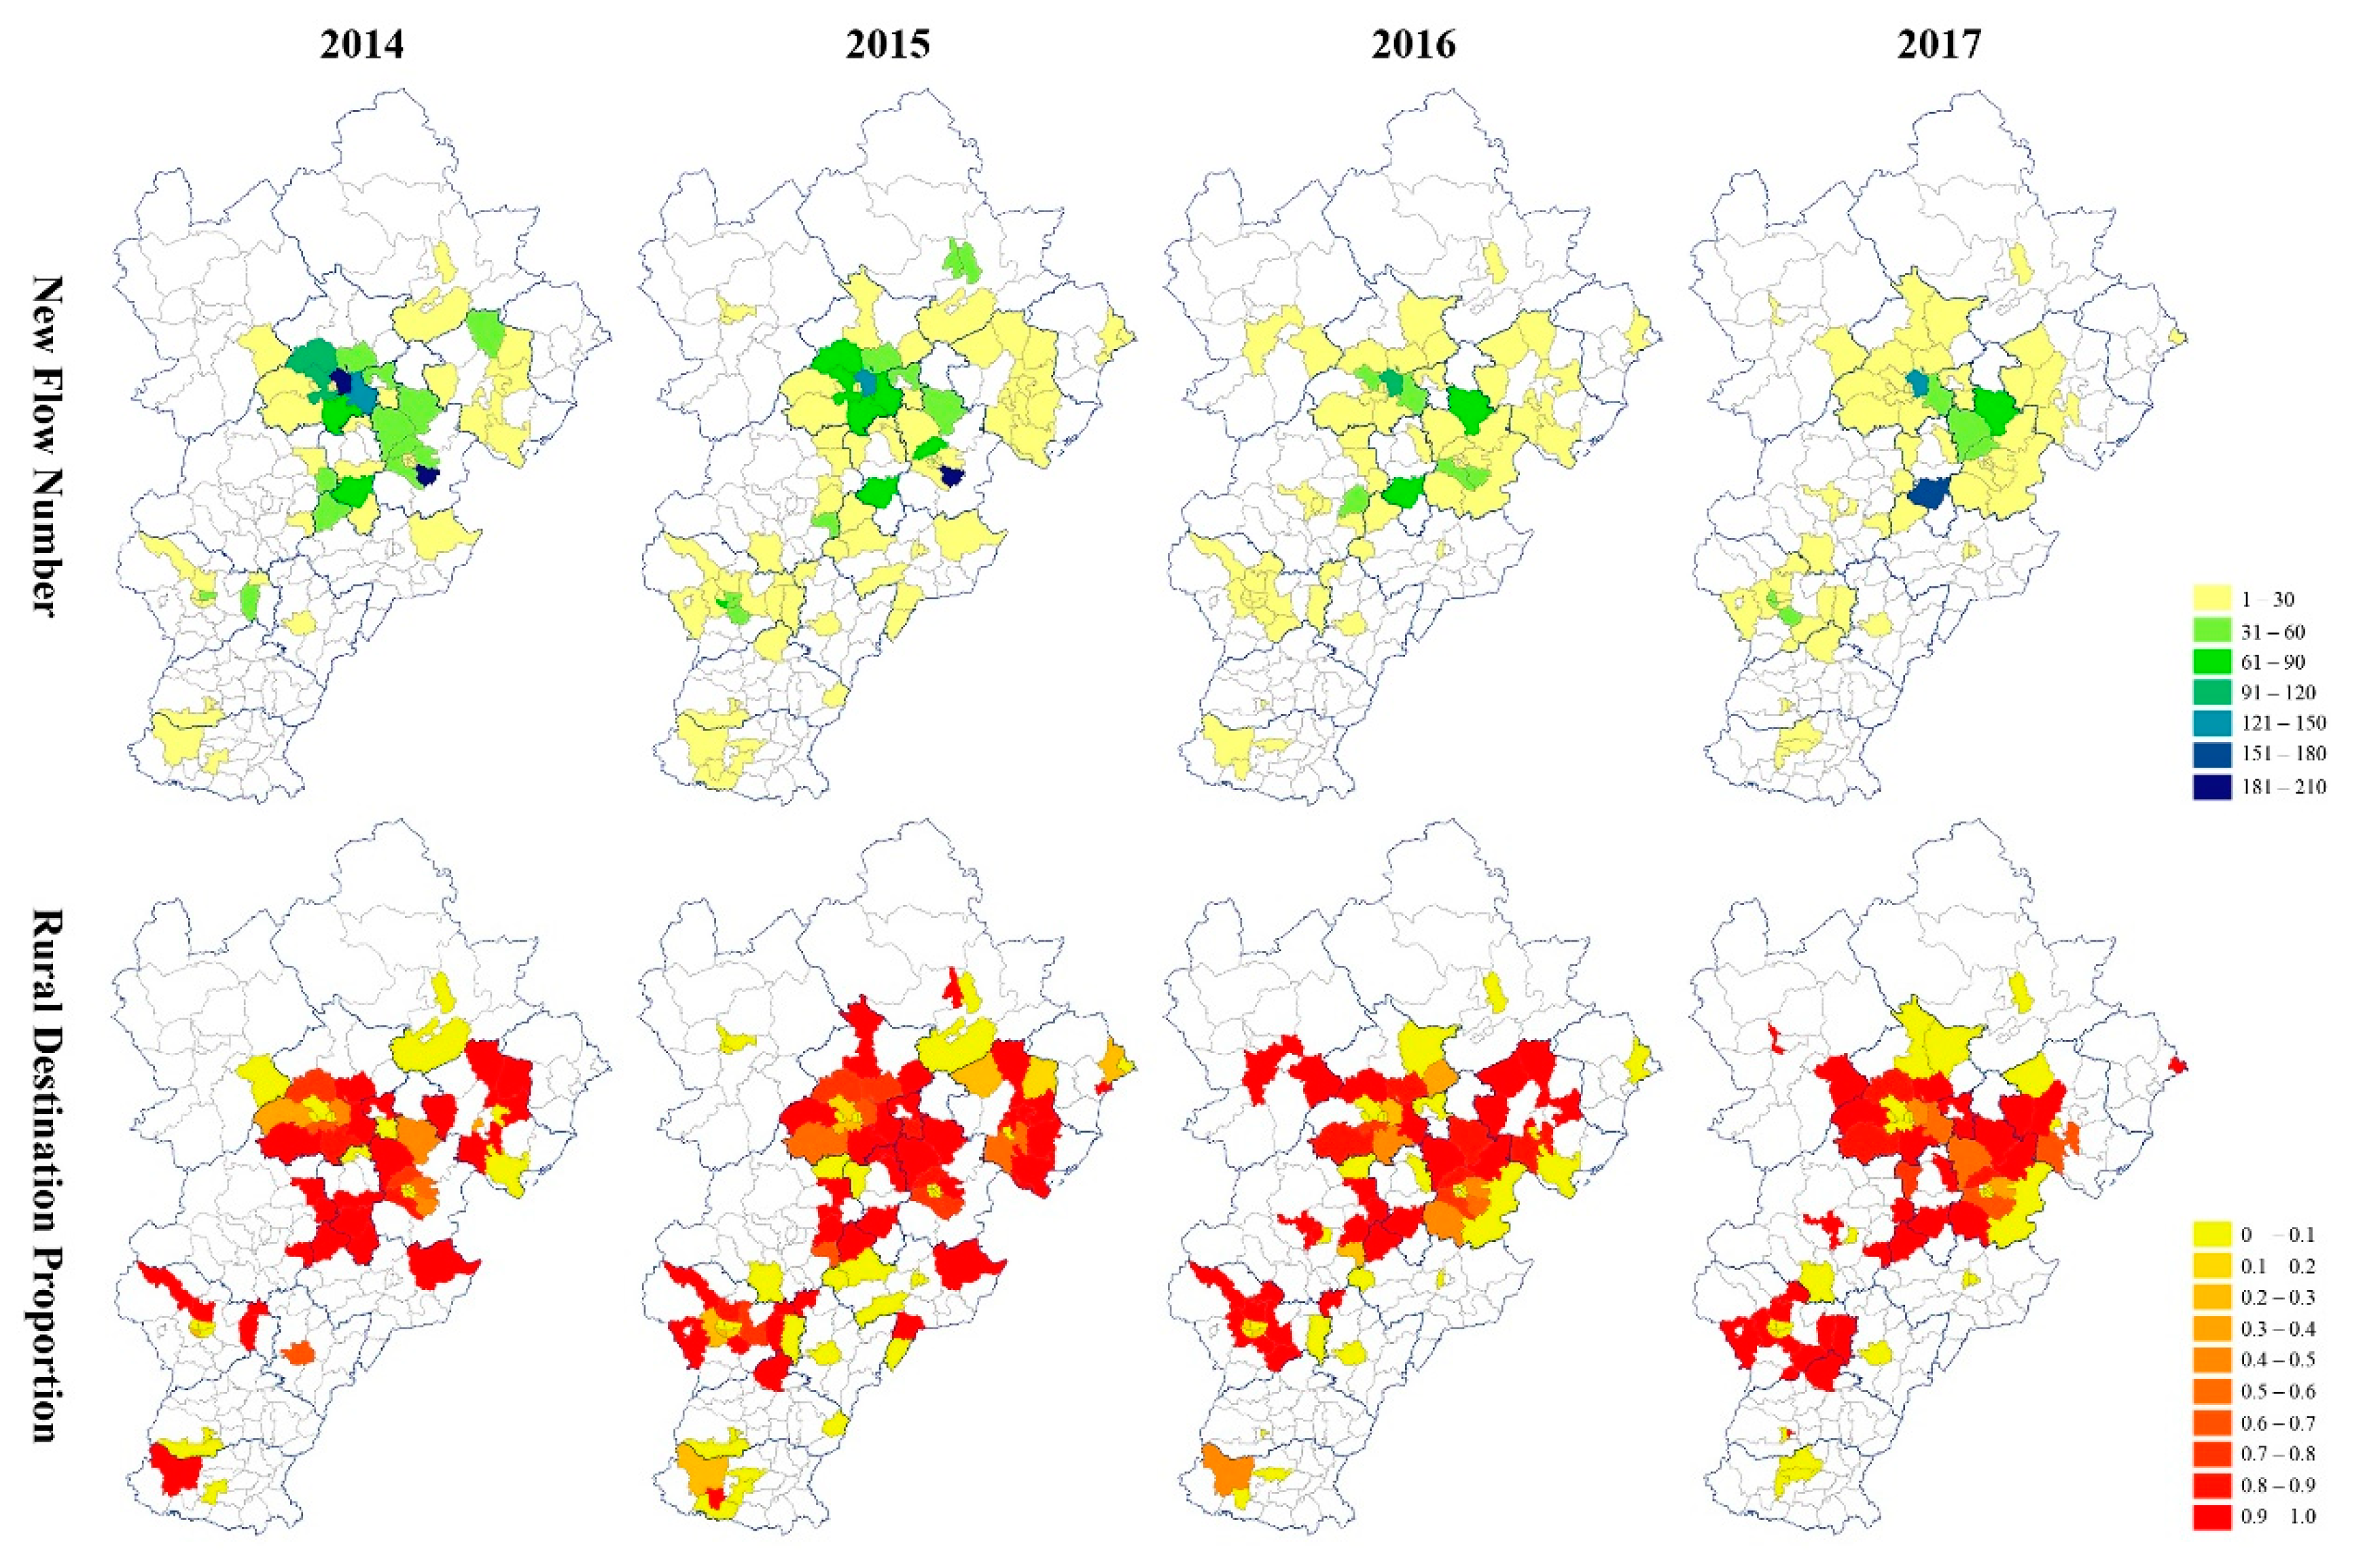
3.1. Population Flow

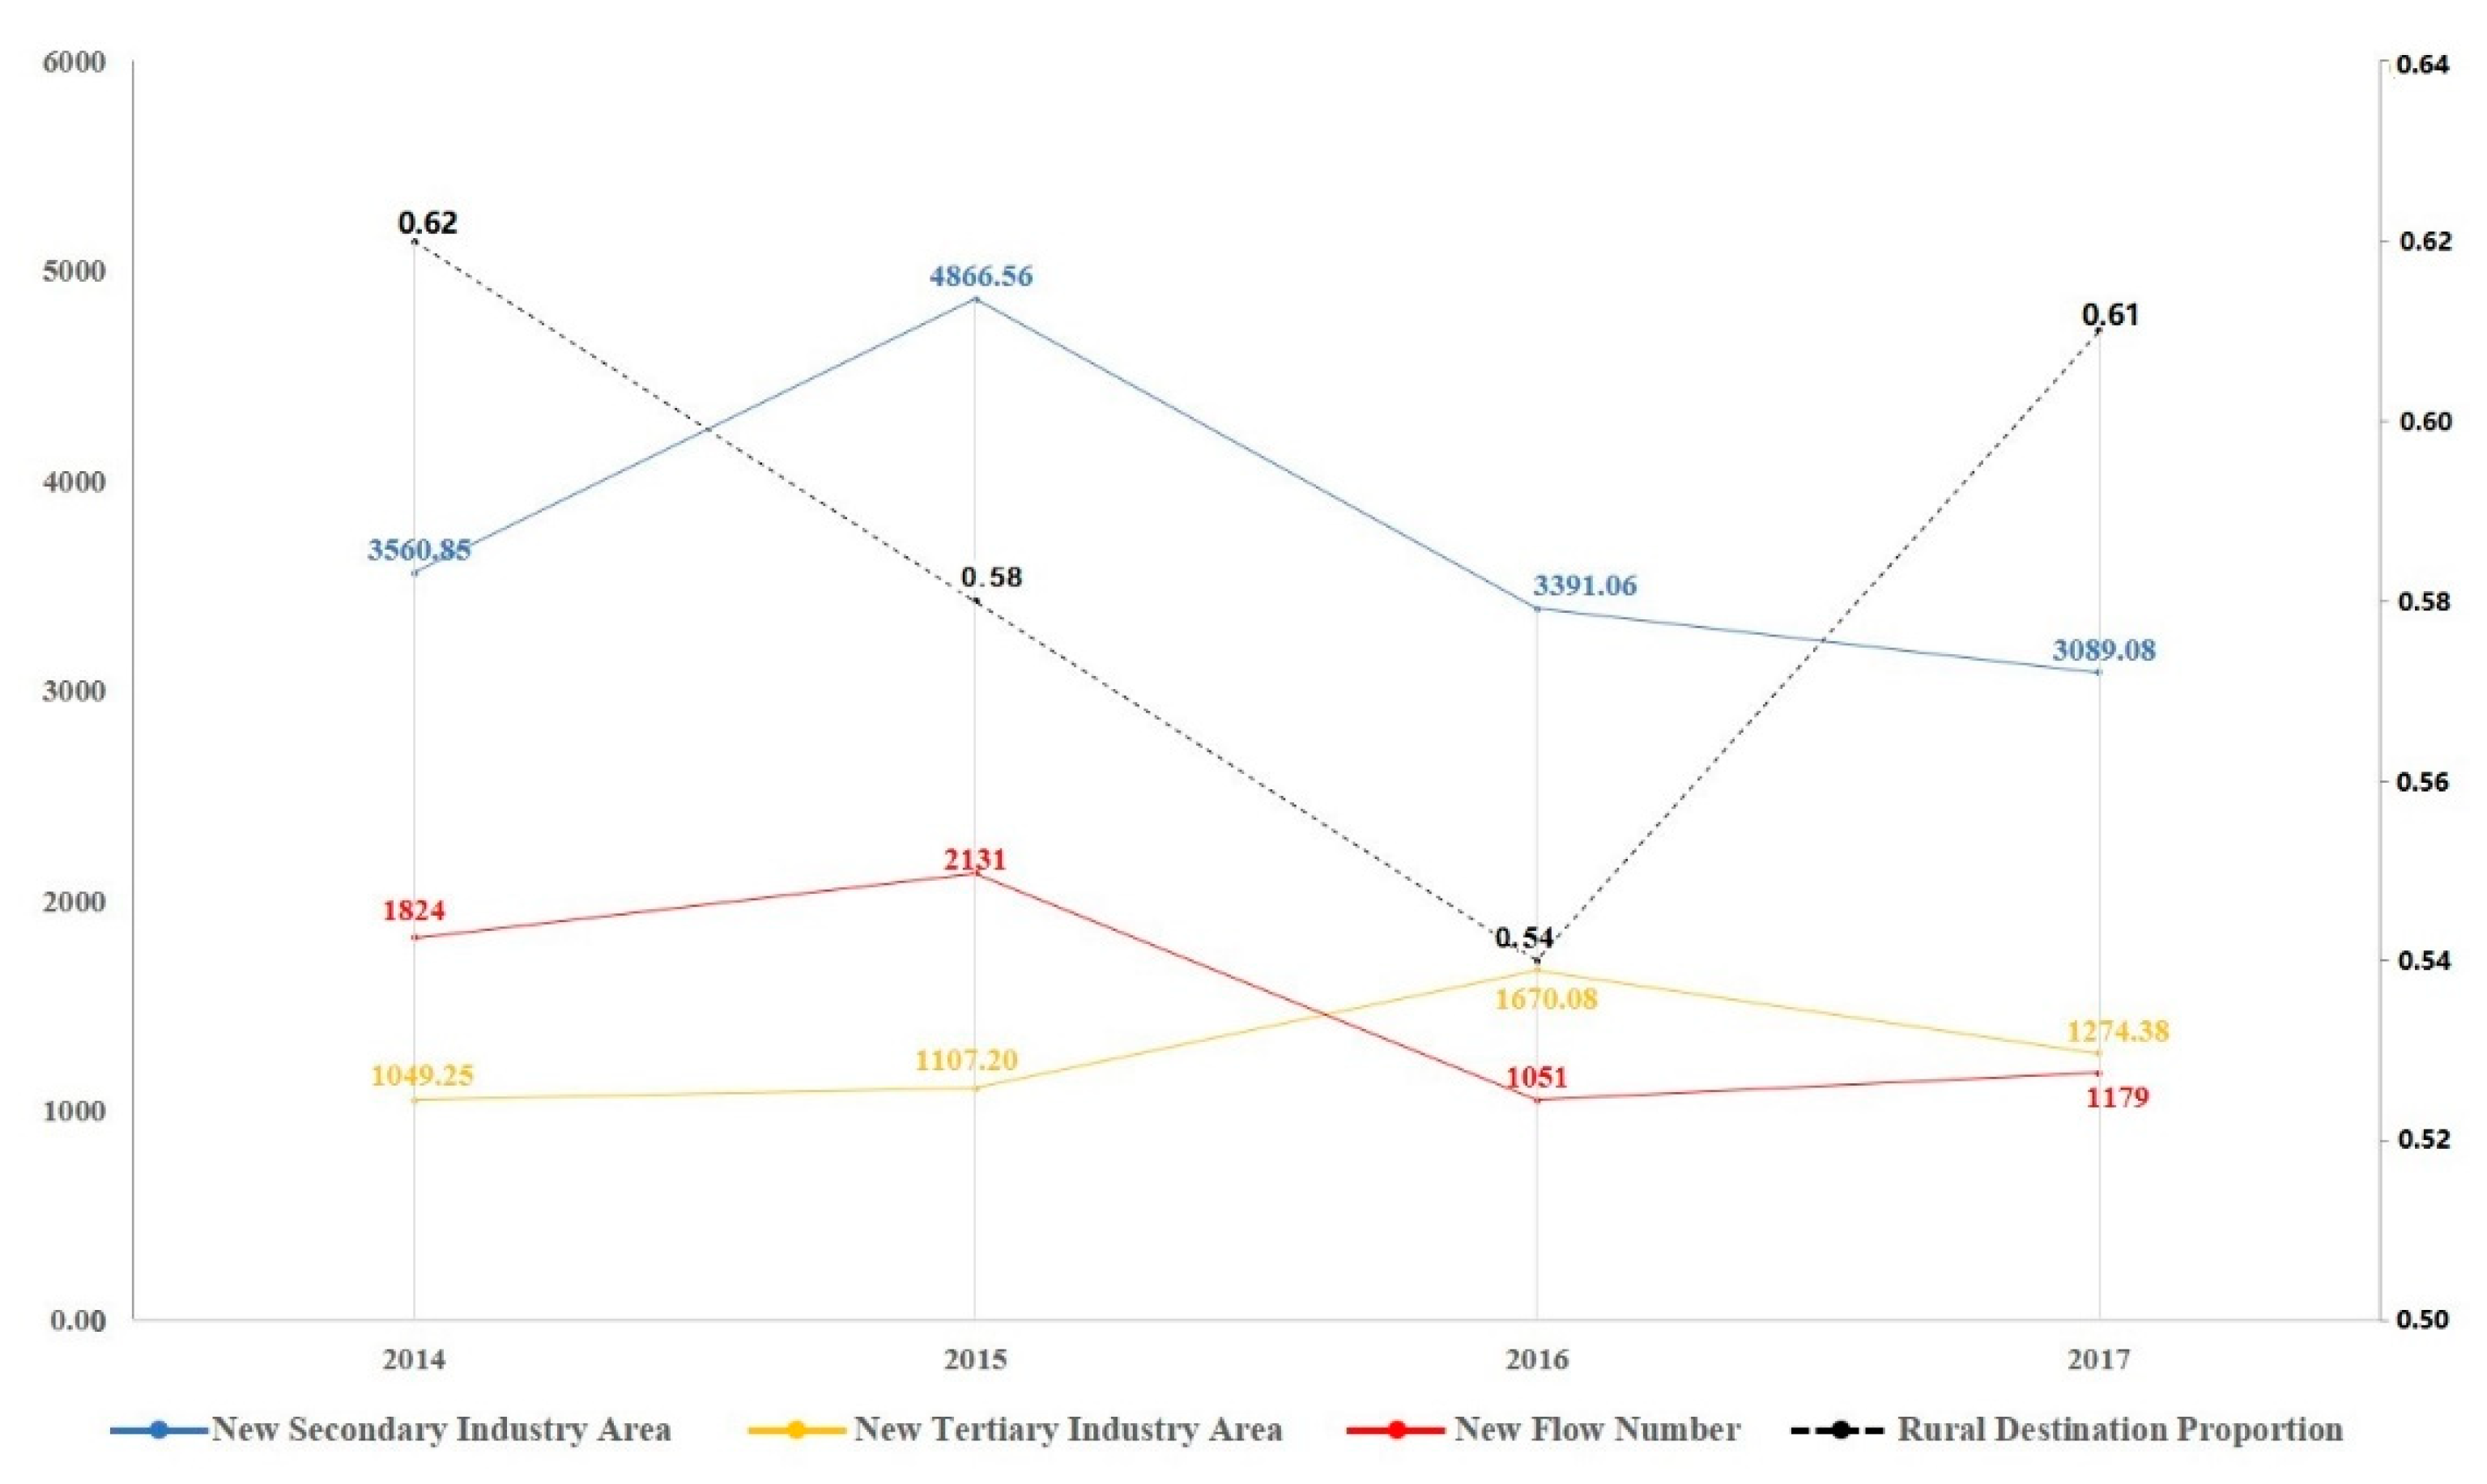
3.1.1. Overall Characteristics and Composition of Population Flow

The population flow of the Beijing-Tianjin-Hebei urban agglomeration has formed a regional inflow core with Beijing-Tianjin-Xiongan as the fulcrum in space. The high value space of new population flow is mainly distributed in Chaoyang District of Beijing, Wuqing District of Tianjin, Jinnan District of Tianjin, and Wenan County of Langfang(Figure 1). These regions are still the core of regional inflow (Figure 2), even after a sharp decline of New Flow Number in 2016 (Figure 3). Shijiazhuang is the inflow core in south part of the Beijing-Tianjin-Hebei urban agglomeration. With the decrease of new inflow, the maximum inflow population in the whole region decreased from 210 in 2014 to 151 in 2017.
From the perspective of a new inflow destination spatial pattern, except for some areas in Beijing and Tianjin, jurisdictional areas of the village committee were still the destination for most new floating people from 2014 to 2017. Although the number of inflows has decreased, the proportion of rural area destinations decreased and then rebounded to 0.61 in 2017, returning to the original level.
New population flow in the Beijing-Tianjin-Hebei urban agglomeration continued decreasing (Figure 3). New flow number increased from 2014 to 2015, and then the number fell by nearly half in 2016. The overall trend of new flow number is consistent with the trend of secondary industry land supply. In 2016 to 2017, the tertiary industry space supply increased first and then dropped slightly, the downward trend of secondary industry space supply slowed down, and the number of new floating population increased slightly.
From 2014 to 2017, the agricultural registered residence still kept the majority of new population flow in the study area (the agricultural registered residents proportion was 0.86 in 2014, 0.88 in 2015, 0.86 in 2016, and 0.90 in 2017, respectively). In 2017, the proportion of agricultural registered residence even rose to 0.90, and the rural destination proportion was 0.61, meaning that the main flow form in the area was still “rural-rural” flow. The average age of the new population flow in the region was relatively stable, and the population between 30–40 years old constituted the main body of the flow. The education level of the new population flow increased in the 4 years: the proportion of people with high school education or below decreased, and the proportion of people with bachelor’s degrees increased. However, graduate degrees were still rare in annual population flow, and highly educated people gathered in the central area of major cities.

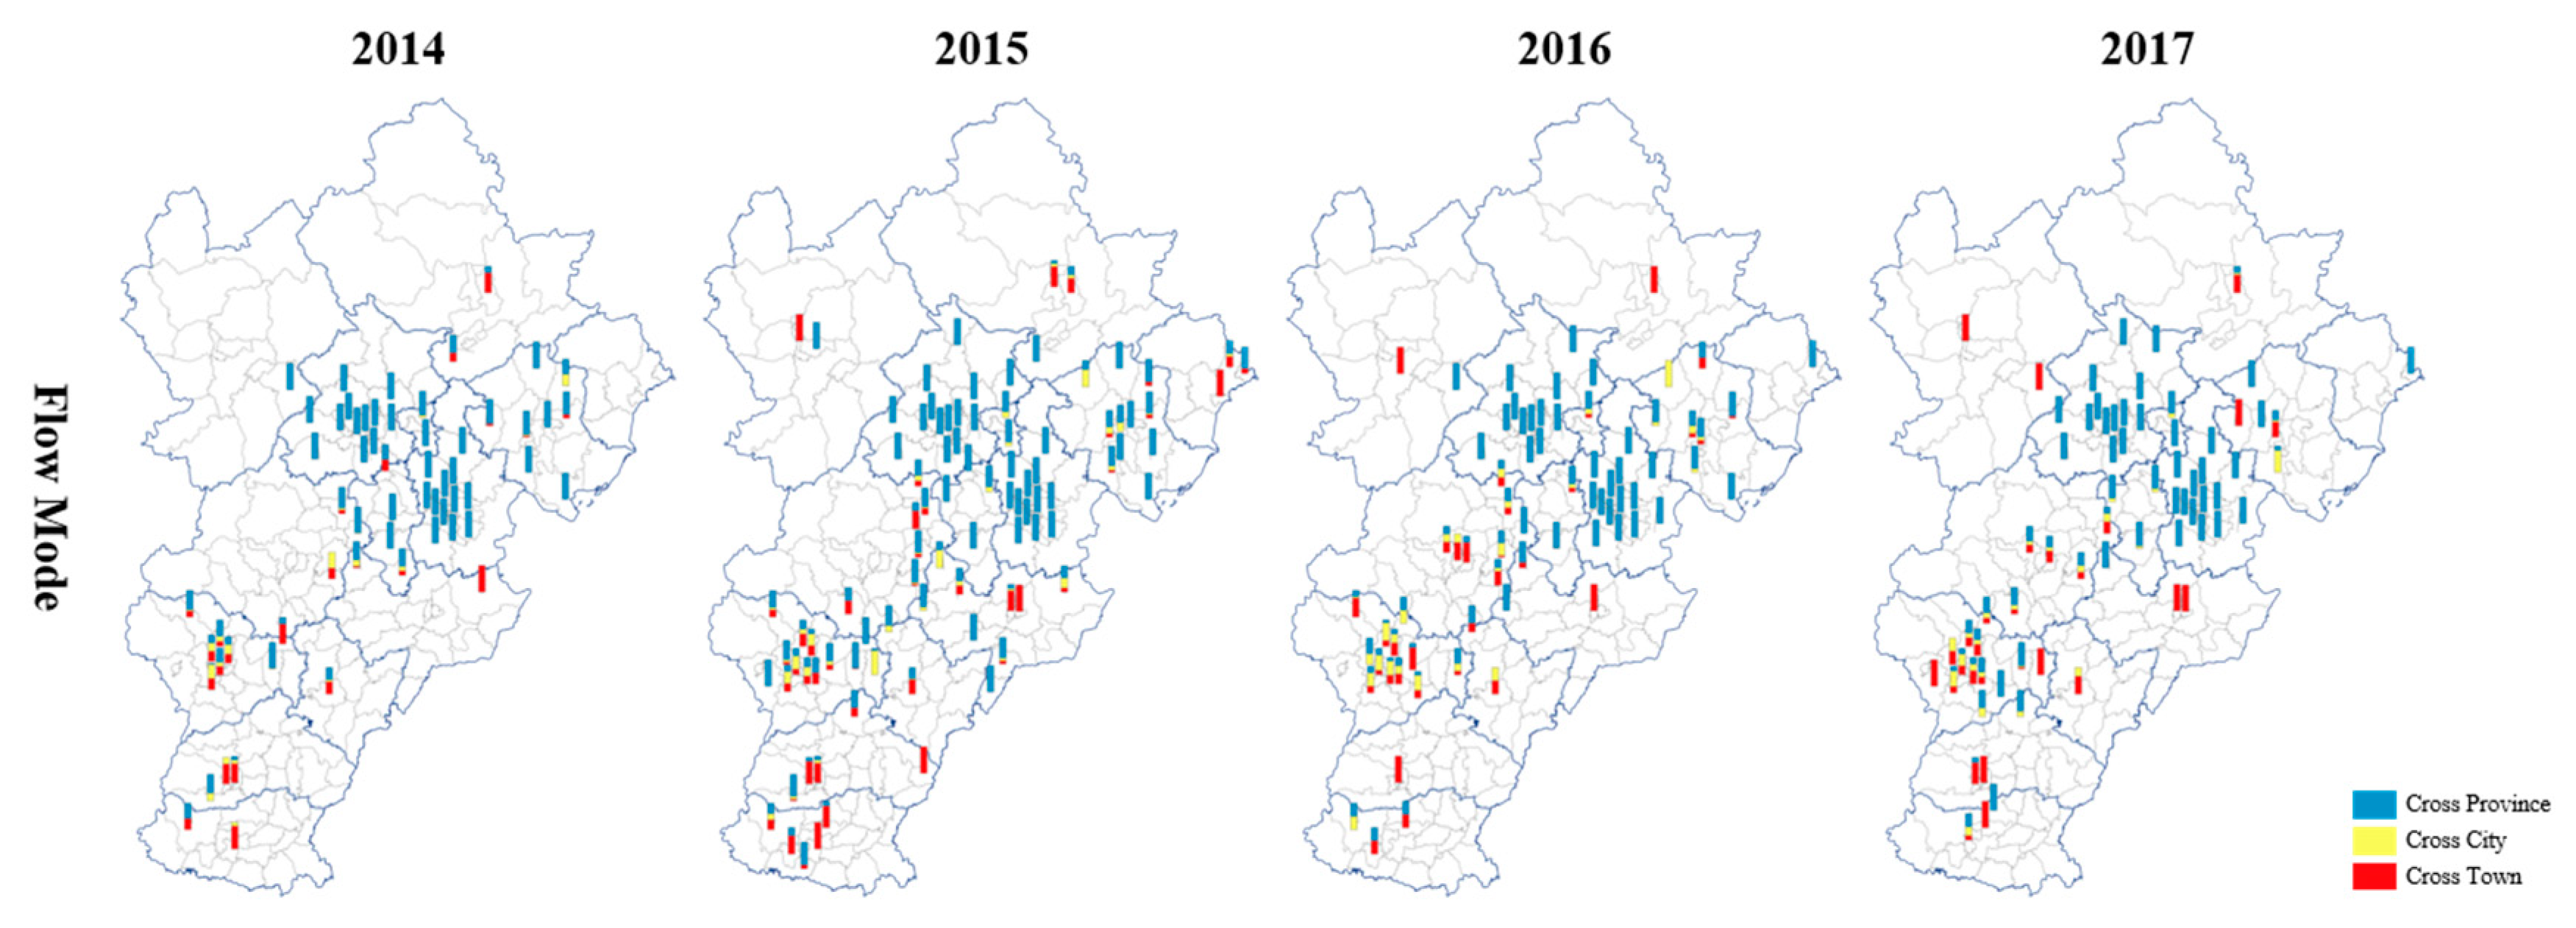
3.1.2. Flow Mode & Aim

The proportion of inter-provincial population flow in the Beijing-Tianjin-Hebei urban agglomeration had been decreasing year by year, but the regional internal flow had been increasing (Figure 4). The inter-provincial population flow was mainly concentrated in and around Beijing and Tianjin, while inter-city flow and inter-county flow were the main forms in other cities. The inter-city flow ratio was still low in the area, reflecting that the links between cities at the regional level are still weak. The inter-county flow ratio increased, and the accelerated flow within the city can strengthen the economic and social ties among counties and districts. Nearly 90% of the floating population’s purpose was to seek career development, but this proportion is decreasing annually, representing that the flow aim is gradually diversified.

3.1.3. Occupation

The floating population was mainly engaged in the secondary and tertiary industries, and the proportion of practitioners in the tertiary industry was slightly higher than that of the secondary industry (Figure 5). The changing trend of the proportion of employees in the secondary industry was U-shaped, while the changing trend of the proportion of employees in the tertiary industry was the opposite. From the perspective of spatial distribution, the floating population in the central city and surrounding areas of each city in the region was more engaged in tertiary-industry-related work, and that in space units of the metropolitan fringe area and units outside central cities were more engaged in the secondary industry.

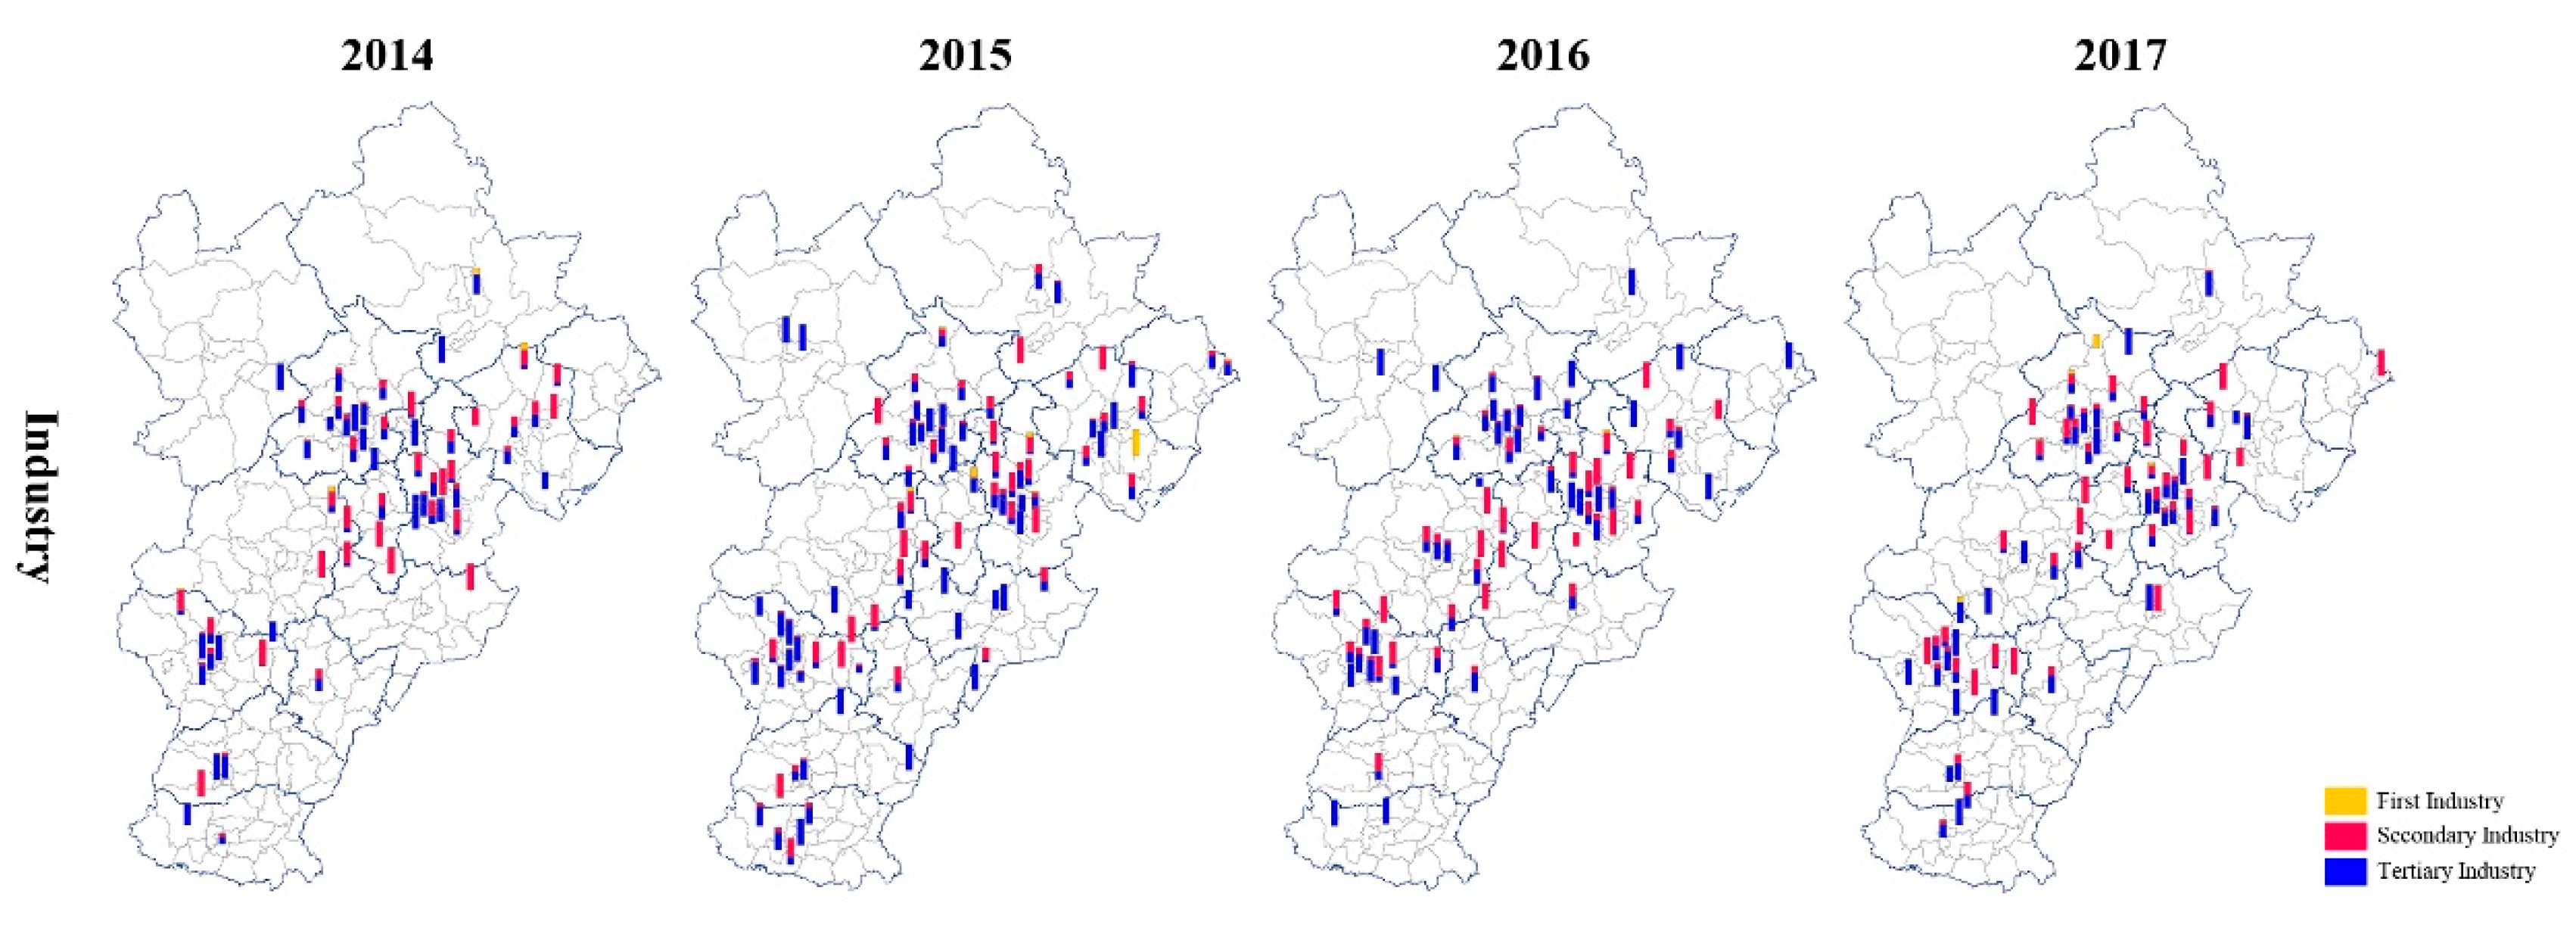
3.2. Industry Space Supply

For the industry space of the Beijing-Tianjin-Hebei urban agglomeration (Figure 6), this paper took the land supply data that completed the contract signing and land delivery before 2013 as the original spatial base, and took the area and quantity of annual new industrial space supply as the index.

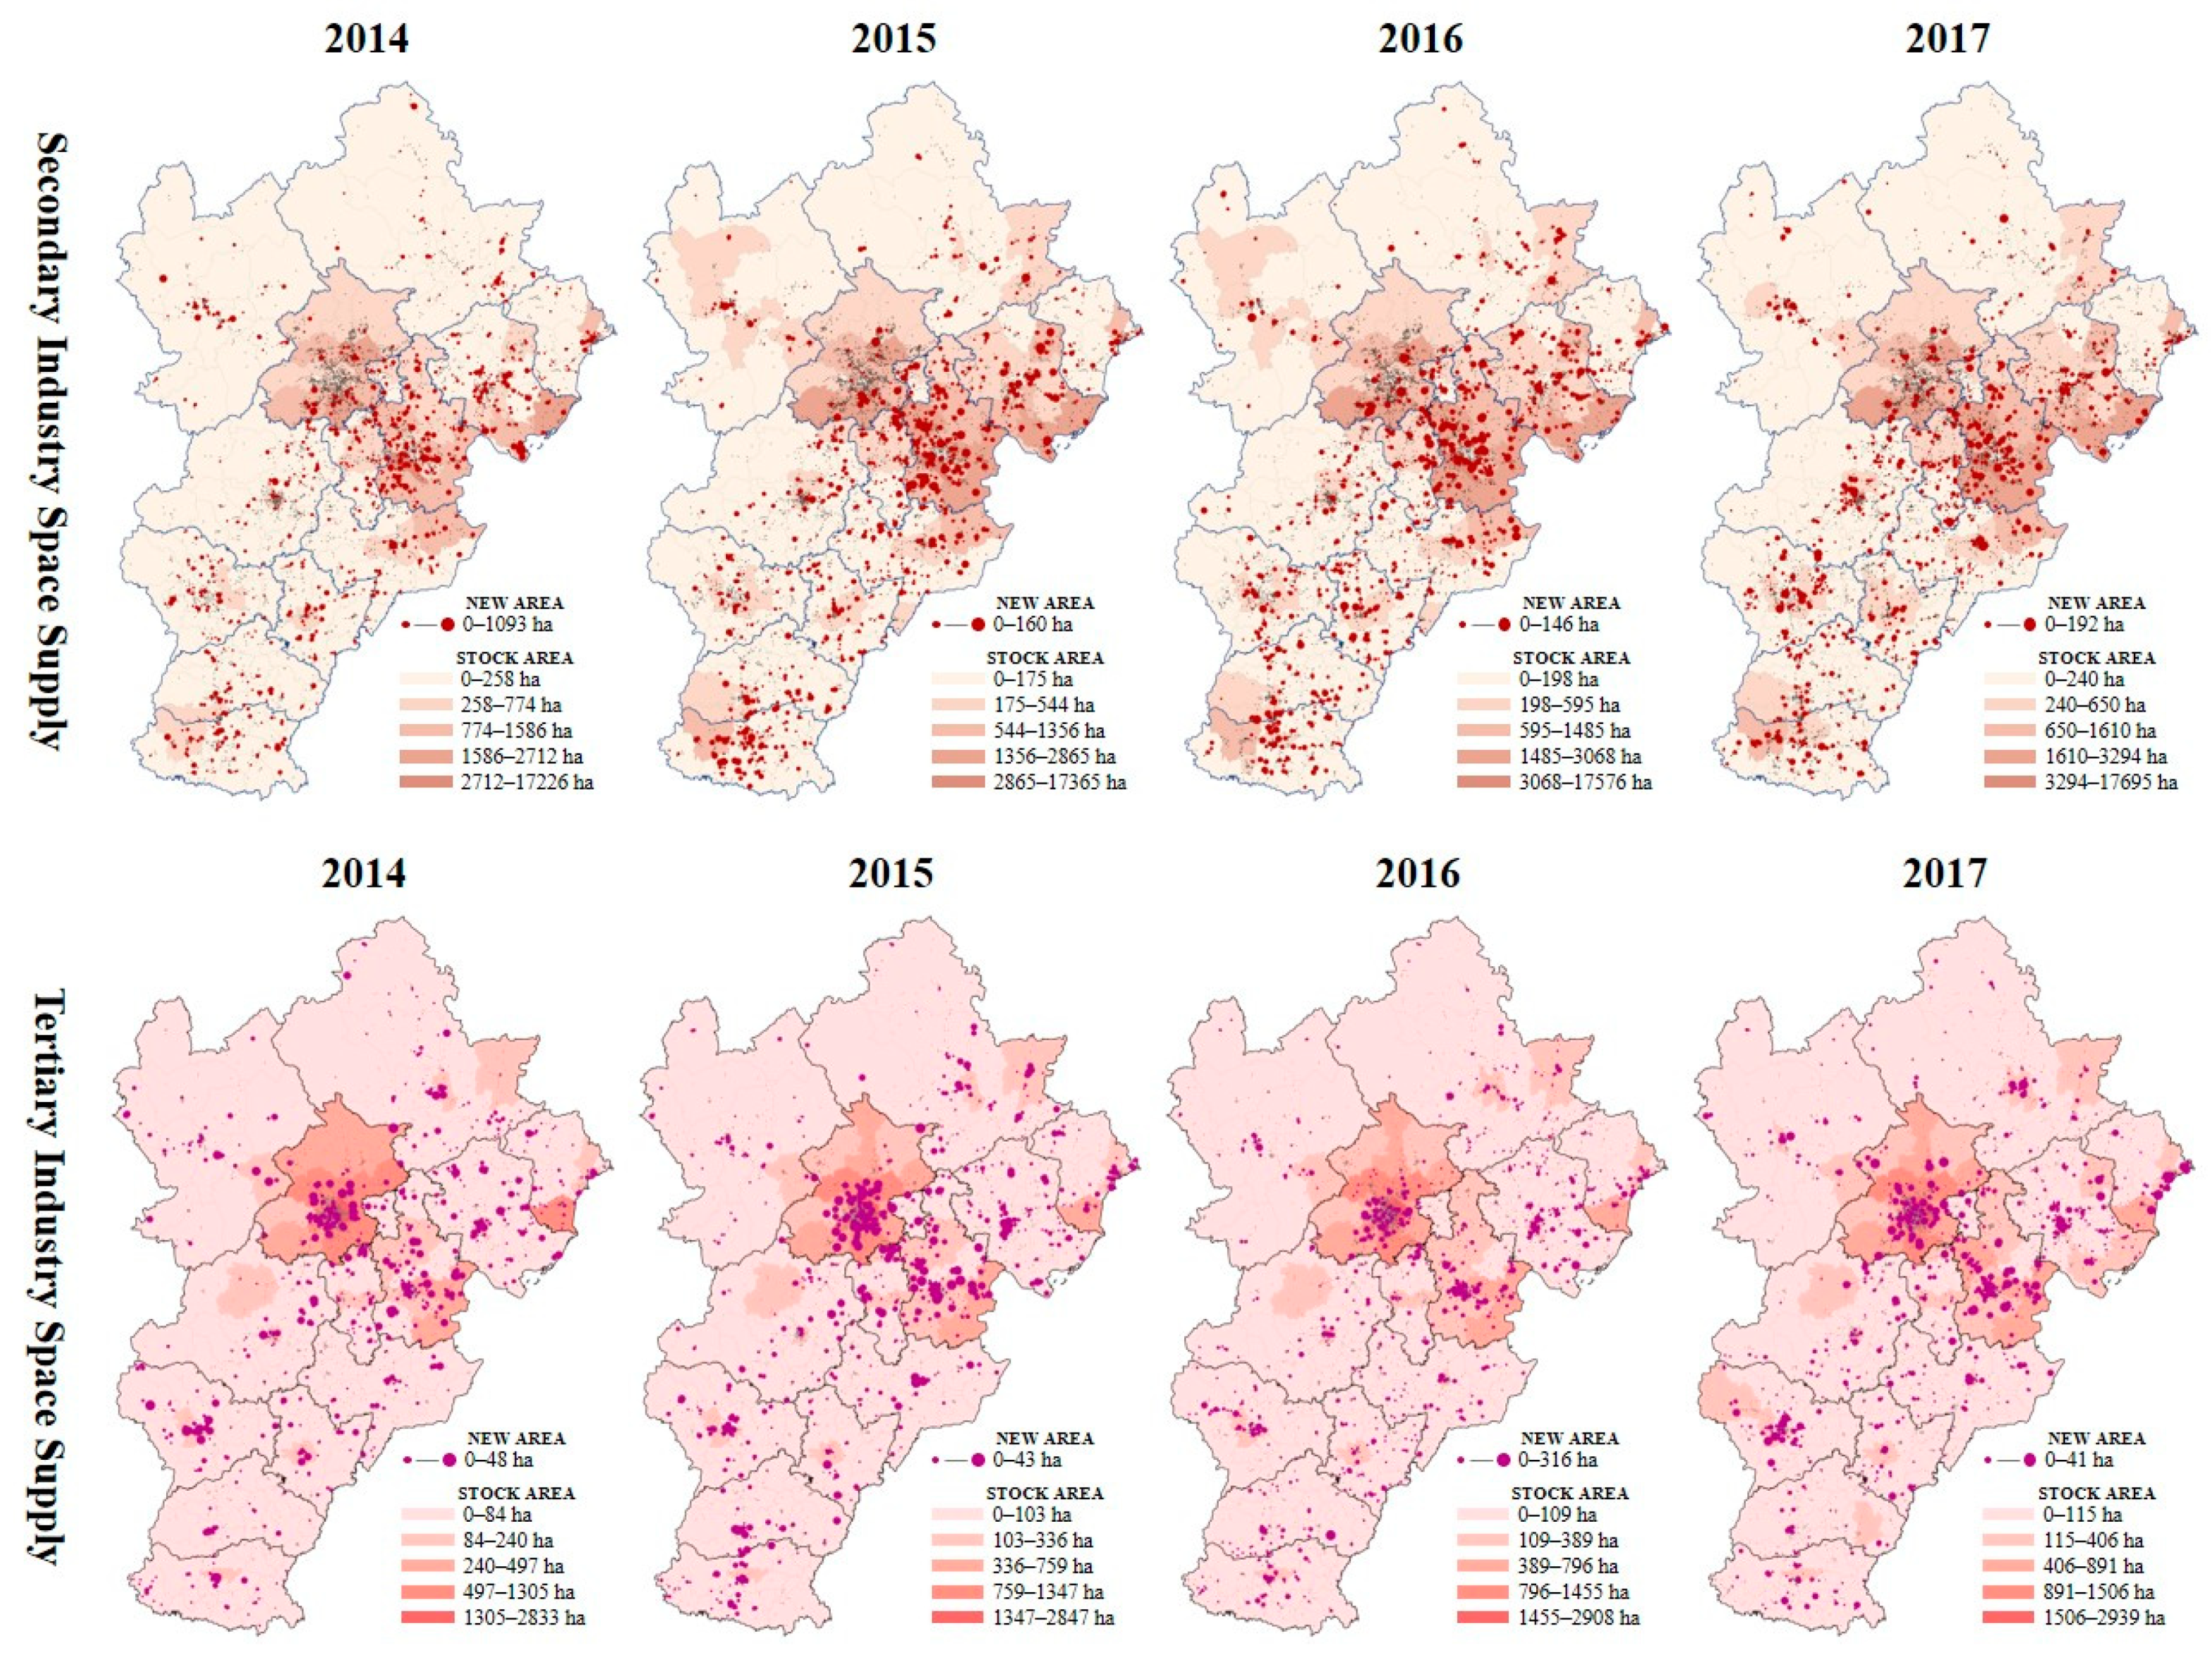
3.2.1. Secondary Industry Space Supply

Till 2013, the stock secondary industry space in the study area was 11,104 places, 61,967 hectares. In 2014, the secondary industry added 1516 spaces with 7333 hectares. In 2015, the number and area were 1689 spaces, 5945 hectares respectively. In 2016, it was 1707 places and 5861 hectares, and in 2017, 1566 places and 4964 hectares. From 2014 to 2017, the area of secondary-industry space supply declined, but the amount of supply did not change much, and the space supply was more refined.
The existing secondary-industry space in the region is mainly concentrated in Beijing and its surrounding area, and Tianjin and the coastal areas around Tianjin. New space supply is mainly distributed in the southeast of the Beijing-Tianjin-Hebei urban agglomeration and the south of the Taihang Mountains. The average area of space supply of large cities and their central districts is larger. The density of space supply of the periphery of the metropolitan area is lower, and the average area of them is smaller at the same time, including townships as well. The secondary-industry space supply in the study area formed a high-value cluster in the circum-Tianjin area, and a low-value cluster in Shijiazhuang and Baoding.

3.2.2. Tertiary Industry Space Supply

For tertiary industry, until 2013, the stock tertiary industry space was 11,531 places, 19,057 hectares. In 2014, the tertiary industry added 1261 spaces with 1791 hectares. In 2015, the number and area were 1304 spaces, 2529 hectares respectively. In 2016, it was 1337 places and 2760 hectares, and in 2017, 1300 places and 2760 hectares. From 2014 to 2017, both the area and the quantity of tertiary industry space supply showed a growth trend on the whole.
The existing tertiary industry space in the region is mainly concentrated in Beijing and Tianjin. The new space supply is more evenly distributed than the secondary industry space supply, but it is still mainly supplied in the central areas of Beijing, Tianjin, and Shijiazhuang, while the supply in other areas is less. During 2014 to 2017, hot spots of regional tertiary industry space supply gradually expanded from the Beijing and Tianjin areas to the areas and their surroundings, while the cold spots were mainly located in the southern part of the Beijing-Tianjin-Hebei urban agglomeration.

3.3. Fixed Effect Model

For the change of RDP (R2 = 0.68) (Table 2), we examined the impact of population pattern and space supply last year on it. We found that both RDP and ARRP had a significant impact on the RDP of new population flow, and RDP had a positive effect while ARRP had a negative effect. Population with low education level is more inclined to flow to rural areas, and high education has a negative effect on the proportion of rural destinations. The increase of CPP would lead to the increase of RDP, and the active inter-provincial flow may help rural areas developing. From the perspective of Occupation, due to the characteristics of the rural industry and the demand of employees, both FIP and TIP have a negative impact on RDP. Additionally, except for government-related occupations, the proportion of other occupations or unemployment has a positive effect. For space supply, both NA_SILS and NA_TILS had a positive effect, and the influence of NA_TILS was greater and more significant. RDP was positively sensitive to ALLFAR_SIL, while new flow in rural areas demands for a low FAR supply of tertiary space. At the same time, OA_TILS had a significant negative impact. The more the stock tertiary industry space in the unit, the lower the proportion of population floating to rural areas.
For the change of NFN (R2 = 0.76) (Table 2), the NFN last year had a significant positive effect, while ARRP had a negative effect. Though all education level indices had a pulling effect on NFN, the influence of higher education level was greater. For occupation, FIP and TIP had the opposite effect, which may be due to the different regional competition patterns caused by different industry practitioners. Enterprise employees and other occupations had a significant positive impact, while GSEP had a negative impact. Because government and state-owned enterprises have a low employment rate, when GSEP increases, it usually means that the population flow in the unit is small and the occupational vitality is low, resulting in a decrease in NFN. For space supply, the increase of NA_SILS will slightly lead to the reduction of NFN, and ALLFAR_SIL and AULFAR_SIL will have a positive impact, which is consistent with research expectations and meets residents’ demand for the quality of the living environment. However, it is inconsistent with research expectations that the increase NA_TILS is also negative. ALLFAR_TIL and AULFAR_TIL would have a negative and positive influence, respectively. However, OA_TILS had a significant positive impact, indicating that the population flow has a higher demand for the spatial form and pattern of the tertiary industry space.

4. Discussion

Unlike previous studies, this study did not focus on a single element, such as population pattern [18,20,21], urbanization, or “push-pull” driving force models [14,25,27,28,29,30,31], nor the short-term laws or meso-micro laws of population flow [3,7]. Instead, it focused more on the spatial laws of population flow in urban agglomerations, and how industrial space affects population flow, and analyzed how population flow patterns will affect the development and pattern of cities employing long-term data.
The characteristics of China’s national conditions lead to urban rural duality, and cities and townships are separated to a certain extent from the perspective of space, policy, and society. Therefore, before we started our research, we already made some predictions of population flow in the Beijing-Tianjin-Hebei urban agglomeration. We believe that the main body of China’s population flow comprises residents of small towns and villages whose registered residences are agricultural households. Additionally, due to personal development, the registered residence system, social integration difficulty, and other reasons, the destinations of flow are mainly the outer urban spaces of core cities with high industrial development in the urban agglomeration. This prediction was confirmed in research (see Section 3.1.1). The population flow in the Beijing-Tianjin-Hebei urban agglomeration takes Beijing, Tianjin, and their surrounding areas as the main destinations. The districts with the largest floating population during the study period were Changping District (Beijing), Chaoyang District (Beijing), Wen’an County (Langfang), Jinnan District (Tianjin), and Baodi District (Tianjin).
As above, the population flow in the Beijing-Tianjin-Hebei urban agglomeration is mainly agricultural residence registration. The study of population flow in this region is basically equivalent to the study of rural population flow. For overall distribution pattern, the destination of population flow is still dominated by rural areas. The proportion of newly increased floating population destined for rural areas showed a “U”-shaped change, which was accompanied by a decrease in the amount of new population flow. From destination perspective, the urbanization rate of floating population in the Beijing-Tianjin-Hebei urban agglomeration was only 39%, showing a significant gap with 65.8%, the regional urbanization rate published by the National Bureau of Statistics in 2019. It shows that the government can complete population urbanization through land urbanization, but it is difficult to complete the urbanization of floating population through land urbanization. The population flow from rural to urban areas in the region is active, but its urbanization process is passive. The urbanization is completed by taking the rural population outside the city as a “rural-urban” population flow during the expansion of the city. Different from other studies [8,40], this study found that China’s floating population did not flow directly from rural areas to urban areas and completes urbanization, but more formed “rural-rural” flows. However, this phenomenon and flow pattern is different from counter-urbanization in many other studies. Researchers identified counter-urbanization as a process of population deconcentration or a process of urban outmigration [30,41]. We agree with other scholars’ viewpoint that the most important cause of urbanization and counter-urbanization is population flow [29]. We conceptualize counter-urbanization as the phenomenon of urban population proportion decline caused by “urban-rural” population flow, as many scholars studied the process [30,42,43,44,45,46,47]. However, the Chinese government’s urban-rural policy has been trying to avoid rural area gentrification, which will cause rural residents to lose development space and development rights, so it is difficult for there to be a “urban-rural” population flow in China. The current “rural-rural” population flow is actually still a phenomenon caused by both the gravitational effect of metropolitan areas and the barriers of living costs and employment in metropolitan area. This is actually a manifestation of the urbanization willingness of the rural population flow. The reason for this flow pattern is that, on the one hand, it is easier for the floating population to work and live in a familiar environment, and on the other hand, urban job positions require relatively high education levels and technical capabilities, resulting in less “rural-urban” population flow. Meanwhile, highly educated population flow is more concentrated in urban-core space due to the inability to provide the corresponding salary and positions in rural areas. The improvement of the education level will make the flow destination transfer from rural areas to urban areas, and the population flow is able to obtain urban registered residence through employment and tax payment, which will promote the urbanization of the migrant population.
We also verified that the primary driving force of population flow is career development. This occupation-oriented population flow is a long-term behavior and is coordinated with the periodicity of land and industry. The amount of land supply is equal to the authorization of land development rights, and the relevant industry land can directly reflect the situation of industry development. The industry space will change and affect population flow before the flow starts, and the floating population and local residents will work together to produce more diversified development and changes in the urban space. Both new population flow and new industry space supply in the Beijing-Tianjin-Hebei urban agglomeration showed a periodic law to some extent. The change in population flow is highly consistent with the change in secondary industry space supply, and the change in tertiary industry space supply is slightly ahead of the change in population flow. Therefore, urbanization provides more industry space and jobs by incorporating rural space into cities, forming a passive “rural-urban” population flow, and then these new urban residents will have a new impact on the space based on their living and working needs.
From the perspective of the degree of flow destination development, population is more inclined to flow to more well-developed areas, rather than areas that are developing vigorously in progress. The FEM model showed that the new industry space supply in the Beijing-Tianjin-Hebei urban agglomeration will reduce the amount of new population flow in the following year, but the area of the stock tertiary industry will drive the increase in the amount of new population flow. The large area of stock tertiary industry means that the districts and counties can provide more stable jobs, and the space quality, life services, and education facilities of them may be better than those with more new industry space supply. Individuals began to flow due to occupation opportunities, but their willingness to stay was more positively correlated with the level of regional development, which is consistent with other studies [1,48]. The study found that the inter-county flow in the region increased significantly. Since the purpose of flow is mainly for work and business, it shows that changes in the industrial network in the region, especially in neighboring districts and counties, will have a greater impact on population flow. At the same time, the proportion of intra-province flow also improved, indicating that the industry space network of the Beijing-Tianjin-Hebei urban agglomeration has been more active than before.
However, the increase in new industry space supply will drive the increase in rural destination proportion, while the area of the existing tertiary industry space has a negative effect. First, this is because space supply in urban areas is relatively saturated, and most districts and counties with more new industry space supply are space units with a low urbanization rate and are in a stage of rapid development. Another reason is that, compared with urban space, the cost of living in rural area is lower, and population flow is more familiar with rural areas. Therefore, regional population flows more to urban villages or suburban villages that are close to industry space, leading to an increase in rural destination proportion. Rural space proportion is also lower in those well-developed districts and counties with more tertiary industry space, which will have a negative impact on the proportion of rural destinations.
One of the most important characteristics of population flow is that the floating population is added to or subtracted from the industry space of the node cities of the entire population flow network. Under the trend of global population shrinkage and the decline of the growing demographic dividend, this study studied the relationship between population flow and industry space supply in the Beijing-Tianjin-Hebei urban agglomeration to guide the evaluation of regional space supply in practice and the prediction of future regional industry space demand, to avoid lack of space resources or waste caused by misallocation of resources which will cause industry development to fall into a bottleneck. Additionally, the study helps revise the urban-rural relationship and guide population flow via adjusting the rationing of industry space so as to stimulate the floating population dividend to drive regional development. This is also an important field of future urban and rural development research.

5. Conclusions

The regional population flow in Beijing-Tianjin-Hebei urban agglomeration is mainly composed of rural population, and the main destinations of flow are rural areas. Towns with a high level of development will attract more floating population, such as the areas around Beijing and Tianjin. Population flow is sensitive to industrial space change. The change in population flow is highly consistent with the change in secondary industry space supply, and the change in tertiary industry space supply is slightly ahead of the change in population flow. Additionally, the urbanization rate of floating population in the region is only 39%, much lower than the overall regional rate of 65.8%. With the change of China’s household registration policy, it is more feasible to guide the urbanization of floating population through space supply in the future.

Author Contributions

Conceptualization, Y.C.; methodology, Y.C. and Z.S.; software, Y.C.; validation, Y.C., Z.S. and L.C.; formal analysis, Y.C. and Z.S.; investigation, Y.C.; resources, Y.C.; data curation, Y.C. and L.C.; writing—original draft preparation, Y.C.; writing—review and editing, Y.C.; visualization, Y.C. All authors have read and agreed to the published version of the manuscript.

Funding

This research was funded by “Beijing Key Laboratory of Spatial Development for Capital Region, grant number CLAB202011” and “Graduate Education Innovation Project of Tianjin Education Commission of China, grant number 2019YJSB174”.

Institutional Review Board Statement

Not applicable.

Informed Consent Statement

Not applicable.

Data Availability Statement

Not applicable.

Conflicts of Interest

The authors declare no conflict of interest. The funders had no role in the design of the study; in the collection, analyses, or interpretation of data; in the writing of the manuscript, or in the decision to publish the results.

References

  1. Zhang, W.; Chong, Z.; Li, X.; Nie, G. Spatial patterns and determinant factors of population flow networks in China: Analysis on Tencent Location Big Data. Cities 2020, 99, 102640. [Google Scholar] [CrossRef]
  2. Halás, M.; Klapka, P.; Tonev, P. The use of migration data to define functional regions: The case of the Czech Republic. Appl. Geogr. 2016, 76, 98–105. [Google Scholar] [CrossRef]
  3. Jia, J.S.; Lu, X.; Yuan, Y.; Xu, G.; Jia, J.; Christakis, N.A. Population flow drives spatio-temporal distribution of COVID-19 in China. Nature 2020, 582, 389–394. [Google Scholar] [CrossRef]
  4. Wang, X.; Ding, S.; Cao, W.; Fan, D.; Tang, B. Research on Network Patterns and Influencing Factors of Population Flow and Migration in the Yangtze River Delta Urban Agglomeration, China. Sustainability 2020, 12, 6803. [Google Scholar] [CrossRef]
  5. Zhang, N.; Huang, H.; Duarte, M.; Zhang, J.J. Dynamic population flow based risk analysis of infectious disease propagation in a metropolis. Environ. Int. 2016, 94, 369–379. [Google Scholar] [CrossRef] [PubMed]
  6. Acolin, A. Housing trajectories of immigrants and their children in France: Between integration and stratification. Urban Stud. 2018, 56, 2021–2039. [Google Scholar] [CrossRef]
  7. Zeng, P.; Sun, Z.; Chen, Y.; Qiao, Z.; Cai, L. COVID-19: A Comparative Study of Population Aggregation Patterns in the Central Urban Area of Tianjin, China. Int. J. Environ. Res. Public Health 2021, 18, 2135. [Google Scholar] [CrossRef]
  8. Zhu, C.; Zhang, X.; Wang, K.; Yuan, S.; Yang, L.; Skitmore, M. Urban–rural construction land transition and its coupling relationship with population flow in China’s urban agglomeration region. Cities 2020, 101, 102701. [Google Scholar] [CrossRef]
  9. Ravenstein, E.G. The laws of migration. J. Royal Stat. Soc. 1889, 52, 241–305. [Google Scholar] [CrossRef]
  10. Park, R.E.; Burgess, E.W.; McKenzie, R.D. The City; The University of Chicago Press: Chicago, IL, USA, 1925. [Google Scholar]
  11. Wirth, L. Urbanism as a Way of Life. Am. J. Sociol. 1938, 44, 1–24. [Google Scholar] [CrossRef]
  12. Administration, U.; Hoyt, H. The Structure and Growth of Residential Neighborhoods in American Cities. Development 1941, 19, 453–454. [Google Scholar]
  13. Alonso, W. A theory of the urban land market. Pap. Reg. Sci. 2005, 6, 149–157. [Google Scholar] [CrossRef]
  14. Lee, E.S. A Theory of Migration. Demography 1966, 3, 47–57. [Google Scholar] [CrossRef]
  15. Brockheroff, M.P. An Urbanizing World. Popul. Bull. 2000, 55, 3–44. [Google Scholar]
  16. Herold, M.; Couclelis, H.; Clarke, K. The role of spatial metrics in the analysis and modeling of urban land use change. Comput. Environ. Urban Syst. 2005, 29, 369–399. [Google Scholar] [CrossRef]
  17. Zipf, G.K. Human Behavior and the Principle of Least Effort; Addison-Wesley: Cambridge, MA, USA, 1949. [Google Scholar]
  18. Batty, M. Building a science of cities. Cities 2012, 29, S9–S16. [Google Scholar] [CrossRef] [Green Version]
  19. Gonzalez, M.C.; Hidalgo, C.; Barabasi, A.L. Understanding individual human mobility patterns. Nature 2008, 453, 779–782. [Google Scholar] [CrossRef]
  20. Brockmann, D.; Hufnagel, L.; Geisel, T. The scaling laws of human travel. Nature 2006, 439, 462–465. [Google Scholar] [CrossRef] [PubMed]
  21. Simini, F.; Maritan, A.; Néda, Z. Human Mobility in a Continuum Approach. PLoS ONE 2013, 8, e60069. [Google Scholar] [CrossRef]
  22. Yan, X.-Y.; Wang, W.-X.; Gao, Z.-Y.; Lai, Y.-C. Universal model of individual and population mobility on diverse spatial scales. Nat. Commun. 2017, 8, 1639. [Google Scholar] [CrossRef] [PubMed] [Green Version]
  23. Rokem, J.; Vaughan, L. Geographies of ethnic segregation in Stockholm: The role of mobility and co-presence in shaping the ‘diverse’ city. Urban Stud. 2018, 56, 2426–2446. [Google Scholar] [CrossRef]
  24. Křížková, I.; Ouředníček, M. Immigrant internal migration in a new destination country: Do immigrants suburbanise in Czechia and why? Popul. Space Place 2020, 26, e2326. [Google Scholar] [CrossRef]
  25. Taima, M.; Asami, Y. Determinants and policies of native metropolitan young workers’ migration toward non-metropolitan areas in Japan. Cities 2020, 102, 102733. [Google Scholar] [CrossRef]
  26. Lityński, P.; Hołuj, A. Macroeconomic Perspective on Urban Sprawl: A Multidimensional Approach in Poland. Land 2021, 10, 116. [Google Scholar] [CrossRef]
  27. Benessaiah, K. Reconnecting to nature amidst crisis: Harnessing capacities and mobilities for livelihood and land transformations in the Greek back-to-the-land trend. J. Rural. Stud. 2021, 84, 76–89. [Google Scholar] [CrossRef]
  28. Barrado, V.J.; Suckel, J.L.; Olhabé, B.T.; Cona, F.C. Promoted Urbanization of the Countryside: The Case of Santiago’s Periphery, Chile (1980–2017). Land 2020, 9, 370. [Google Scholar] [CrossRef]
  29. Crankshaw, O.; Borel-Saladin, J. Causes of urbanisation and counter-urbanisation in Zambia: Natural population increase or migration? Urban Stud. 2019, 56, 2005–2020. [Google Scholar] [CrossRef]
  30. Karsten, L. Counterurbanisation: Why settled families move out of the city again. Neth. J. Hous. Environ. Res. 2020, 35, 429–442. [Google Scholar] [CrossRef]
  31. Bosworth, G.; Bat Finke, H. Commercial Counterurbanisation: A driving force in rural economic development. Environ. Plan. A Econ. Space 2019, 52, 654–674. [Google Scholar] [CrossRef]
  32. Smith, D.P.; Phillips, M.; Culora, A.; Kinton, C. The mobilities and immobilities of rural gentrification: Staying put or moving on? Popul. Space Place 2021, e2496. [Google Scholar]
  33. Wang, Y.; Wang, F.; Zhang, Y.; Liu, Y. Delineating urbanization “source-sink” regions in China: Evidence from mobile app data. Cities 2019, 86, 167–177. [Google Scholar] [CrossRef]
  34. He, C.; Chen, T.; Mao, X.; Zhou, Y. Economic transition, urbanization and population redistribution in China. Habitat Int. 2016, 51, 39–47. [Google Scholar] [CrossRef]
  35. Chen, Z.; Zhang, A.; Shan, X. Urbanization and administrative restructuring: A case study on the wuhan urban agglomeration. Habitat Int. 2016, 55, 46–57. [Google Scholar]
  36. Song, W.; Liu, M. Assessment of decoupling between rural settlement area and rural population in China. Land Use Policy 2014, 39, 331–341. [Google Scholar] [CrossRef]
  37. Wang, C.; Liu, Y.; Kong, X.; Li, J. Spatiotemporal decoupling between population and construction land in urban and rural hubei province. Sustainability 2017, 9, 1258. [Google Scholar] [CrossRef] [Green Version]
  38. Paniagua, A. Urban-rural migration, tourism entrepreneurs and rural restructuring in Spain. Tour. Geogr. 2002, 4, 349–371. [Google Scholar] [CrossRef]
  39. Mengyu, D.Z.Z.K.Y.; Deng, Z.; Zhang, K.; Yang, M. Problems and Countermeasures of Regional Coordinated Development with Current Characteristics of Migration in China. J. Changsha Univ. 2020, 34, 90–94. [Google Scholar]
  40. Kates, R.W.; Parris, T.M. Long-term trends and a sustainability transition. Proc. Natl. Acad. Sci. USA 2003, 100, 8062–8067. [Google Scholar] [CrossRef] [Green Version]
  41. Mitchell, C.J. Making sense of counterurbanization. J. Rural Stud. 2004, 20, 15–34. [Google Scholar] [CrossRef]
  42. Aner, L.G. Dwelling habitus and urban out-migration in Denmark. Eur. Urban Reg. Stud. 2014, 23, 662–676. [Google Scholar] [CrossRef]
  43. Jauhiainen, J.S. Will the retiring baby boomers return to rural periphery? J. Rural Stud. 2009, 25, 25–34. [Google Scholar] [CrossRef]
  44. Siddle, R. People in the Countryside: Studies of Social Change in Rural Britainby Tony Champion; Charles Watkins. Geogr. J. 1992, 158, 337–338. [Google Scholar] [CrossRef]
  45. Mitchell, C.J.A.; Bryant, C. International Encyclopedia of Human Geography||Counterurbanization; Elsevier: Toronto, ON, Canada, 2009; pp. 319–324. [Google Scholar]
  46. Bijker, R.A.; Haartsen, T.; Strijker, D. Migration to less-popular rural areas in the Netherlands: Exploring the motivations. J. Rural. Stud. 2012, 28, 490–498. [Google Scholar] [CrossRef]
  47. Dahms, F.; McComb, J. ‘Counterurbanization’, interaction and functional change in a rural amenity area—A Canadian example-ScienceDirect. J. Rural Stud. 1999, 15, 129–146. [Google Scholar] [CrossRef]
  48. Song, Y.; Zhang, C. City size and housing purchase intention: Evidence from rural–urban migrants in China. Urban Stud. 2019, 57, 1866–1886. [Google Scholar] [CrossRef]
Figure 1. Map of Beijing-Tianjin-Hebei Urban Agglomeration.
Sustainability 13 09949 g001
Figure 2. NFN and RDP from 2014 to 2017.
Sustainability 13 09949 g002
Figure 3. Population flow and industry space supply change from 2014 to 2017.
Sustainability 13 09949 g003
Figure 4. Flow mode in the Beijing-Tianjin-Hebei urban agglomeration during 2014 to 2017.
Sustainability 13 09949 g004
Figure 5. Industry of population flow during 2014 to 2017.
Sustainability 13 09949 g005
Figure 6. Industry space supply in the Beijing-Tianjin-Hebei urban agglomeration from 2014 to 2017.
Sustainability 13 09949 g006
Table 1. Indices of population flow and industry space supply. (* for at 0.1 level of significance).
IndicatorsWhether Used in FEMAbbreviation
CompositionNew Flow NumberNFN
Rural Destination ProportionRDP
Agricultural Residence Registration ProportionARRP
Average Age
Education LevelUnder Highschool ProportionUHP
Graduates Proportion
Post-graduates ProportionPP
Flow Mode and AimCross Province ProportionCPP *
Cross City Proportion
Cross Town Proportion
Job and Business Proportion
Occupationthe Primary Industry ProportionFIP
the Secondary Industry Proportion
the Tertiary Industry ProportionTIP
Government and State-owned Enterprise ProportionGSEP
Individual Businesses ProportionIBP
Enterprise ProportionEP
Other Occupation ProportionOOP
No Occupation ProportionNOP
Space SupplyNew Number of the Secondary Industry Land Supply
New Area of the Secondary Industry Land SupplyNA_SILS
Average Lower Limit of New Secondary Industry Land FARALLFAR_SIL
Average Upper Limit of New Secondary Industry Land FARAULFAR_SIL
New Number of The Tertiary Industry Land Supply
New Area of The Tertiary Industry Land SupplyNA_TILS
Average Lower Limit of New The Tertiary Industry Land FARALLFAR_TIL
Average Upper Limit of New The Tertiary Industry Land FARAULFAR_TIL
Overall Number of The Secondary Industry Land Supply
Overall Area of The Secondary Industry Land Supply
Overall Number of The Tertiary Industry Land Supply
Overall Area of The Tertiary Industry Land SupplyOA_TILS
Table 2. FEM results of RDP and NFN. (* for at 0.1 level of significance, ** for at 0.05 level of significance, *** for at 0.01 level of significance.)
Rural Destination Proportion (R2 = 0.68)New Flow Number (R2 = 0.76)
CoefficientsSig. CoefficientsSig.
(Constant)0.0030.870(Constant)0.0020.976
CompositionNFN0.0190.369NFN ***0.5360.000
RDP ***0.5500.000RDP0.1660.569
ARRP **−0.2820.031ARRP−0.7640.123
Education LevelUHP0.1750.266UHP0.2550.670
PP−0.3540.759PP2.6340.549
Flow ModeCPP *0.1830.055CPP0.2330.520
OccupationFIP−0.4220.304FIP0.7400.635
TIP−0.1070.401TIP−0.1630.736
GSEP−0.1010.552GSEP−0.2440.706
IBP0.2710.129IBP0.8060.234
EP *0.2420.090EP **1.2950.018
OOP0.3730.148OOP *1.6810.087
NOP0.0720.752NOP1.2390.157
Space SupplyNA_SILS0.0020.872NA_SILS−0.0400.479
ALLFAR_SIL *0.1520.064ALLFAR_SIL0.2950.342
AULFAR_SIL0.0020.962AULFAR_SIL0.2550.134
NA_TILS **0.0470.042NA_TILS−0.0670.440
ALLFAR_TIL−0.0260.652ALLFAR_TIL ***−0.6800.003
AULFAR_TIL−0.0320.217AULFAR_TIL **0.2000.047
OA_TILS *−0.0350.075OA_TILS *0.1240.094
Publisher’s Note: MDPI stays neutral with regard to jurisdictional claims in published maps and institutional affiliations.

