
Exploring the Causes of Design Changes in Building Construction Projects: An Interpretive Structural Modeling Approach


1
Department of Project and Construction Management, Mehralborz Institute of Higher Education, Tehran 1413684491, Iran
2
UniSA STEM, Scarce Resources and Circular Economy (ScaRCE), University of South Australia, Adelaide 5001, Australia
*
Author to whom correspondence should be addressed.
Sustainability 2021, 13(17), 9578; https://doi.org/10.3390/su13179578
Submission received: 19 July 2021
/
Revised: 17 August 2021
/
Accepted: 19 August 2021
/
Published: 25 August 2021
(This article belongs to the Special Issue Rethinking Sustainable Construction: Renewing Old Perspectives and Emergent New Frames of Thinking)
Abstract
:The purpose of this study is to investigate the mutual interactions between the causes of design changes using Interpretive Structural Modeling (ISM) and to classify the causes using the “Matrice d’Impacts Croisés Multiplication Appliquée à un Classement” MICMAC technique. This study further identifies and proposes strategies to mitigate design change occurrence and map them onto the identified connections between the causes. To achieve these goals, critical causes of design changes were identified through a comprehensive literature review; 23 key causes were then refined according to the opinions of relevant experts involved in the Iranian building construction sector. Stakeholders associated with each cause and the management areas from which causes arise were also considered. The factors “Unfamiliarity with new construction methods”, “Design errors”, “Value engineering”, “Scope uncertainty”, “Change orders”, and “Constructability ignored in the design phase”, which are highly influenced by other factors, emerged at the highest level of the ISM diagram, and “Clients’ attitudes and experience” as the main root cause of design changes at the bottom of the diagram. The MICMAC technique results showed that consultant-related causes significantly influence other causes, and policy and client-related causes have a feedback effect on the whole system. The findings of this study provide a better insight into how various causes of design changes are connected to one another and can ultimately assist project managers of different parties, even in other countries, to choose influential strategies to mitigate design changes in building construction projects.
1. Introduction
By supplying diverse facilities, infrastructure, and employment for a wide range of people, the building construction industry is believed to significantly contribute to the economic structure of countries and to considerably influence the fulfillment of the national socio-economic improvement goals [1]. For this reason, it is essential to devise a scheme for constantly improving the productivity and efficiency of these construction projects. However, the main problem is that this industry is a dynamic environment involving various stakeholders and consisting of numerous uncertainties [2]. This issue, coupled with project complexity, makes the management of these projects difficult, and as a result, despite considerable progress in the area of project management, building construction projects are still plagued by time variations and cost over-run [3]. A number of studies have been conducted on the causes of time and cost over-run, all of which have identified design changes as one of the major factors having a detrimental effect on projects’ time and cost, irrespective of their type and size [2]. Yap and Skitmore [4], for example, claimed that the contribution of design changes to time and cost over-runs of Malaysian building projects is between 5% and 20%. It is also the case even for developed countries such as the US [5] and the UK [6] because a similar trend has been reported. Other problems, which are anticipated but are not limited to, include claims and disputes, injuries, design-induced rework, and inconveniences to owners and end-users [7,8], which can result in project failure.
Overall, according to Khanh [9], the literature on design changes can be divided into five main categories, namely concept and classification, causes of design changes, impacts of design changes, evaluation of design changes, and solutions for preventing design changes. Although some studies have been conducted to discover the causes of design changes, they mainly fall short of considering the interactions between causes, and few of them have paid adequate attention to this issue. In other words, each cause has been investigated and ranked independently, as if it has no connection with others. However, taking the multiple impacts of causes on one another into account can bring main root causes to light, which can assist project participants to direct available resources to critical causes in order to either eliminate them or mitigate their severe impacts. As stated by Yap et al. [10] and Shoar et al. [11], single-cause recognition and merely prioritizing factors do not provide a comprehensive ascertainment of causation and may even be misleading and result in undesired outcomes. Apart from this, neither different stakeholders associated with causes nor common project management knowledge areas from which causes arise have received sufficient attention in previous studies. These would make the suggestion of amendments to the project management processes difficult.
Given the aforementioned shortcomings, the purpose of this study is to model the interdependencies amongst the causes of design changes and to identify the most significant causes. These could form a basis for better devising intervention strategies. Considering stakeholders associated with causes and the areas from which they arise, stakeholders who play a critical role and the most challenging areas are also identified. Overall, the main contributions of this study to the body of knowledge can be outlined as follows:
- Theoretical contribution, arising from developing a systematic hierarchy model to explore the underlying influences among causes;
- Empirical contribution, arising from the determination of the driving and dependence power of each cause in connection with others;
- Identifying the most important management areas on which stakeholders and decision-makers should concentrate;
- Identifying and proposing remedies based on the position of causes in the developed hierarchical model and their dependence/driving power.
In this study, the developed hierarchical model is achieved according to the Iranian experts’ mindsets working in the building construction industry. However, external validation of research findings showed that the proposed strategies and identified major causes could also assist project managers of different parties in other countries to prevent design changes or mitigate their adverse effects on the project performance. The rest of this study is organized as follows. The following section identifies various causes of design changes and investigates the methods which have been applied to analyze the causes in previous studies. It is then followed by the research methods section in which the research process is discussed. The applications and terminology of Interpretive Structural Modeling (ISM), which is the main component of the proposed research process, are also discussed in this section. In the fourth section, the model outputs are analyzed, and the achieved results and proposed intervention strategies are discussed. In the fifth section, the theoretical and empirical contributions of the study are discussed. Finally, in the last section, the conclusions are drawn, and the limitations of this study as well as the suggestions for future research are presented.
2. Literature Review
Construction projects are susceptible to a high level of change, and the rationale behind this ranges from intrinsic ones such as project complexity to extrinsic ones such as environmental changes [12]. Changes normally occur to modify or correct the design or scope of work [8]. As repeatedly claimed by past studies, three primary criteria of successful projects are the completion within time, budget, and quality [13,14] and design changes have been alleged to inevitably impact these triple key success principles [15,16]. Gamil and Abdul Rahman [17], for example, assessed the critical factors causing failure to the Yemeni construction industry. Their study identified frequent change of design as one of the top 10 factors ranked among 62 factors causing failures to the industry. Annamalaisami and Kuppuswamy [18] investigated the relationships between cost over-run factors to improve current construction cost and controlling practices. Their study revealed that the cost variance during construction is 17.43% for non-infrastructural Indian construction projects because of various factors, and the most significant factors were design and specification change and price escalation. Aslam et al. [19] examined the impact of design changes on project cost and concluded that design change is one of the main factors leading to cost over-run, which can even account for 40% of the project cost.
The Iranian construction industry contributed to 4% of the Gross Domestic Product (GDP) in 2015 [20]. Formal governmental authorities say that the construction sector’s share of total country’s budget was increased from 17.5% in 2003 to more than 24% in 2006 and 28.8% in 2008 [21], which is indicative of the pivotal role of this sector in Iran’s economy. However, previous studies unveiled that Iranian construction projects, notably building projects, suffer from cost and time over-run. For instance, according to the statistical center of Iran, between the years 2002 and 2012, the direct costs of delays in the building construction projects were estimated at USD 21 billion. In the same vein, a recent study conducted by Heravi and Mohammadian [22] reported that nearly 30% of Iranian building projects experienced a minimum of 25% cost over-run and delays. There are studies indicating that design changes are one of the major causes of these over-runs in this country. As reported by Parchami-Jalal and Shoar [23], modifications in design documents are one of the most crucial factors affecting projects’ time and cost in Iran. Likewise, Samarghandi et al. [21] studied the reasons for delay and cost over-run in this country. Their study revealed that more than two thirds of respondents were in agreement that too many design changes were one of the key reasons. Despite the significance of this issue in both developed and developing countries, few studies on the problem of design changes and their causes have been conducted [24], and they scarcely targeted the Iranian context. However, to ameliorate projects’ performance, it is imperative to address this issue. The primary step to pre-empt the disruptive impacts of design changes is to identify their causes. To this aim, the literature review of this study is two-fold. Initially, it identifies the various causes of design changes reported in previous studies. Then, it discusses the methods, which have been applied to discover their shortcomings, and justifies the method applied in this research.
Gharaibeh et al. [2] investigated factors leading to design changes according to the opinions of 252 professionals from the Jordanian construction industry and found owners’ requirements, design errors and omissions, and value engineering among the top major influential factors. Bassa et al. [25] investigated the causes and effects of design changes in Ethiopia using a questionnaire survey distributed to project managers, clients, and engineers. The results indicated that lack of design review during the design process, errors and omission in design, plan changes by the client, incomplete contract documents, differing site conditions, lack of experience for design evaluation during the design period, and the impediment in the prompt decision-making process were the main causes of design changes. Yap et al. [24] investigated 39 reasons leading to design changes. They reported eight factors including competency of the project team, quality and workmanship, site constraints and safety consideration, legislation and regulations, active rework, project communication, end-user requirements, and risk management as the underlying factors of design changes in building projects. In another study, Yap and Skitmore [4] also investigated the causes of design changes in Malaysian building projects and revealed that lack of co-ordination among various professional consultants, change of requirements/specification, addition/omission of scope, erroneous/discrepancies in design documents, and unforeseen ground conditions were the five most significant causes. Although the unfavorable impact of design changes on time and cost is revealed by Parchami-Jalal and Shoar [23] and Samarghandi et al. [21], respectively, in the Iranian context, no studies were found to scrutinize the causes of design changes in this developing country.
In terms of the methods applied to identify the main causes, it was established that most studies identified the main causes using the Relative Importance Index (RII), which is unable to consider the interactions between causes. As stated by Gharaibeh et al. [2], in order to plan preventive measures and assign responsibilities, developing causal models, which describe the factors that result in design changes, is necessary. Few studies have investigated the interactions between causes. Yap et al. [24], for example, after identifying the most contributing factors to design changes, designed a cause-and-effect diagram to represent causes’ interactions. In another study, Yap et al. [10] also applied causal loop diagrams to provide a better understanding of how causes of design changes are related to each other. There are also studies that investigated causes’ interactions and examined the impact of interacted design change causes on the project performance quantitatively. Saad et al. [26], for example, proposed a system dynamics model to capture the factors that may result in engineering- and medical-related design changes in healthcare projects and to investigate the impact of those design changes on the project performance. Afsharghotli and Yitmen [27] employed an Artificial Neural Network (ANN) model to evaluate the quantified measurement of interacted design change causes on time and cost performance of petrochemical projects. However, as the purpose of this study is only to identify the most crucial underlying causes of design changes based on their interactions, the mentioned studies, which analyzed design changes’ impacts on the project performance, are excluded in this study.
The main limitation of the aforementioned studies from the perspective of the methodology is that as they analyzed influential causes qualitatively, the driving and dependent factors were not determined, and the importance and influence of stakeholders associated with the causes have not been assessed by considering the interactions between causes. Additionally, as the driving and dependence power of causes were not considered, the main management areas which should be focused on were not determined. It is also worthwhile to mention that as some causes of design changes are, in essence, qualitative, studies evaluating the causes’ interactions and their impacts on the project objectives quantitatively failed to consider all influential causes. In this study, in order to identify the interrelationships between causes of design changes and fill the existing gap, ISM along with the “Matrice d’Impacts Croisés Multiplication Appliquée à un Classement” (MICMAC) are utilized. With the aid of a MICMAC diagram, the causes were categorized into four groups based on the degree to which each factor either affects or is to be affected by other causes.
3. Research Methods
As illustrated in Figure 1, the research process of this study is organized in three stages as follows:
- In the first stage, in order to complete the initial list of causes identified through a comprehensive literature review and to customize them for the Iranian context, a panel of twenty professionals was surveyed. The Relative Importance Index (RII) was employed for this purpose.
- Having determined the most contributing causes, in the second step, the interrelationships between causes were assessed using the nominal group technique, in which group interviews were conducted in a way that ensured the interviewees addressed issues independently, free from any interference by other participants [28]. To do so, another panel of experts consisting of five experts was applied. The ISM approach was employed to visualize the interrelationships between the causes. The causes and management areas associated with causes were also categorized based on their driving and dependence power and illustrated using MICMAC diagrams.
- Finally, in the last stage, the results were discussed and through another brainstorming session with experts and conducting the literature review, some recommendations to alleviate the critical causes were also presented.
The first two stages of the research are delineated in this section, and the last stage, in the Results and Recommendations section.
It is believed that topics evaluating the impact of human actions and behavior on construction processes should pay careful attention to the research design process to enhance the reliability and validity of the study [29].
With regard to the reliability, it should be mentioned that several measures have been suggested to assess research reliability, which could be found in the previous literature [30,31]. In this study, all of the data, which gathered through each stage of research, were mechanically recorded and transcribed to provide a chance for others to assess the consistency and repeatability of the results [31]. Additionally, multiple data sources, including previous literature and three groups of industry-related experts, and multiple research methods, including literature review, nominal group technique, and the questionnaire survey, were employed to ensure that the study’s findings would be reliable. Yin [30] noted that meaningful parallelism of findings across multiple data sources could increase research reliability. Previous studies also emphasized that triangulation, simultaneously using multiple data sources or research methods, can go a long way toward enhancing the reliability and validity of results [29,32]. To this aim, in this research, previous studies were first rechecked to ensure that all critical factors were identified. Second, industry-related experts were surveyed to verify the accuracy of factor identification. Third, the opinions of another panel of experts were assessed using the nominal group technique to construct the causal relationships among the factors. Finally, the results and a transcription of the meeting were sent to them to examine the reliability of the results. Amendments were made in the model based on the comments received. The mentioned process, which has also been employed in previous studies [33,34], is believed to satisfy the reliability of the findings.
With regard to the validity, it should be noted that since the developed model is the basis for making decisions and committing resources, its validity has vital importance for model builders and users [35]. To this purpose, prior to beginning each stage, the validity of the previous stage was assessed. Certain types of validity, including conceptual validity, experimental validity, operational validity, and external validity were deployed to evaluate the conceptual model, the ISM results, the proposed strategies, and the generalizability of the overall findings, respectively [36]. In Table 1, each type of validity is described, and the designed questions to evaluate them are shown. These questions have concordance with the questions designed in the previous studies [37,38,39]. For each of the questions, the experts had to rate their level of agreement based on a 5-point Likert scale (from 1 as strongly disagree to 5 as strongly agree). The final value of the experts’ agreement was obtained by averaging the degrees of agreement of the experts with each question. The fourth column of Table 1 shows the mean value of the experts’ agreement with each question. The final value of the experts’ agreement is finally presented in the fifth column.
With regard to the appropriateness and sufficiency of the experts employed to assess the reliability and validity of the research, it should also be noted that in this study, three panels of experts were deployed. The first panel, including twenty professionals, was responsible for identifying and verifying the critical causes of design changes. The second panel, including five professionals, was in charge of constructing the model and evaluating the validity of each stage, and the third panel, including eight professionals, was responsible for evaluating the external validity of the overall research findings. It is worth mentioning that although the number of experts in the first panel was limited to twenty, as the data gathered during the first stage were triangulated using literature review, questionnaires, and interviews with the second panel, the results and the number of experts are believed to be reliable and adequate, respectively. Referring to previous studies which employed the same approach, the number of experts in the second panel is also believed to be adequate [40,41]. In order to identify the right experts for the third panel of experts, purposive sampling was employed. The selection criteria were defined, namely, (1) having related publication(s) in established journals in the field of design changes, design errors, or design deficiencies; (2) having more than 15 years of experience with building construction projects; (3) holding a senior position in a professional organization. The experts were identified basically from the author lists of related publications, regional and country affiliates of International Project Management Association (IPMA), and Co-operative Network for Building Researchers (CNBR) Yahoo group. Invitations were sent to the experts via email, and they were requested to fill and return the questionnaire designed based on the four questions regarding the external validity of research findings, which are depicted in Table 1. Five of the responses received were inappropriate, leaving only eight valid responses for the analysis. The respondents were from the United States, United Kingdom, Australia, Poland, Jordan, Ethiopia, China, and Malaysia, and all of them met at least two out of the three proposed criteria. This meets the need of having experts from both developed and developing countries. While a small sample is employed, the proper geographical balance of experts, who were positive of research results, is believed to satisfy the credibility and generalizability of the findings.
3.1. Data Collection
Through an intensive literature review, a primary list of causes of design changes, consisting of 38 causes, was prepared by the authors, which is presented in Table A1. In order to narrow down the causes to the most critical ones and identify causes, which might be overlooked, the first panel of experts, consisting of twenty experts working in the Iranian building construction industry, was employed. All of them had at least 20 years of experience participating in building construction projects and have been holding very senor position in their representative organizations (five project managers, four construction managers, four senior designers, two senior engineers of technical office, two contract managers, two project control managers, and one site administrator). Out of these twenty experts, six experts were working for consultants, and eight and six experts were serving contractor and client firms, respectively. They all had a doctoral degree from a reputable university. It is also worth mentioning that heterogeneous experts, which were chosen from the community of consultants, contractors, and clients, reduce the adverse effects of biases and improve the generalization ability. Experts’ opinions with regard to causes’ significance were surveyed using a questionnaire consisting of three sections as follows.
In the first section, after providing a paragraph outlining the objectives of this study, the respondents were asked to clarify their general information. Respondents’ years of experience, qualifications, and position in their company were gathered in this part. This section was designed to ensure that all experts are appropriate for this study.
In the second part, the initial list of causes was provided for experts in a table, and they were asked to determine the level of importance of the causes using an ordinal scale of 1 to 5, which 1 indicated the lowest significance and 5 indicated the highest significance. Their opinions, then, were aggregated using the Relative Importance Index (RII) and based on Equation (1). This method has been repeatedly utilized in similar previous studies [4,23,25] to rank and identify main factors.
where Wi denotes the rating given to each cause by the respondents (ranging from 1 to 5), A is the highest weight (i.e., 5 in this case), and N is the total number of respondents.
In the third section, the respondents were asked to state other important causes which might have been neglected in the study. However, no further causes were identified using this part. Finally, causes, which had an RII of more than 60, were selected for the next step to investigate their interrelationships using the ISM approach. These causes are provided in Table 2. The main causes were also categorized based on the stakeholders associated with them, and the management areas from which they arise. In terms of their stakeholders, five categories, namely contractors, clients, consultants, government, and all parties, and in terms of their relevant management areas, nine categories, namely policy, scope, time, cost, quality, communication, procurement, integration, and external were assumed for the causes.
3.2. Data Analysis
Having determined the most critical causes of design changes, in this stage, their interrelationships were investigated using the ISM. Interpretive structural modeling is defined as a process that transforms unclear and poorly articulated mental models of systems into visible, well-defined models [43]. It provides a better understanding of how various variables of a complex system are interrelated and facilitates analyzing the direct and indirect effect of each variable on the others [40]. This approach has been repeatedly applied to investigate construction management issues. Prakash and Phadtare [41], for example, developed a hierarchical structural framework of verifiable drivers in project marketing through the application of the ISM. Iyer and Sagheer [34] used the ISM to investigate the interrelationships of risks in Public–Private Partnership (PPP) projects. Tavakolan and Etemadinia [44] incorporated fuzzy logic and proposed the fuzzy weighted interpretive structural modeling to determine and trace the interactions among project risks. Yu et al. [33] also used the ISM approach to identify factors that significantly impact the utilization of big data and to investigate how these factors influence each other.
According to Janes [28], three steps of the ISM approach are as follows.
Step 1: Relationship Identification
In this step, a Structural Self-Interaction Matrix (SSIM), which represents which causes directly affect other causes, is constructed. For this purpose, experts are asked to determine which causes influence a specific cause, and which causes receive influence from it. As experts’ opinions might differ, the nominal group technique is normally used, in which experts’ viewpoints are gathered independently and sent to other experts. This process continues until a consensus on causes’ interactions is achieved by experts. In this approach, respondents’ competency overrides their quantity, and there is no criterion to clarify how many respondents should be chosen. However, most previous studies have used three to five experts to develop the SSIM [40]. For two causal factors such as i and j, each element of the SSIM located above the diagonal is assigned a letter based on the following rules:
- V indicates factor i affects factor j;
- A indicates factor j affects factor i;
- X indicates factors i and j have a mutual impact on each other;
- O indicates there is no relation between i and j.
In this paper, the second panel of experts, including five accessible experts who were willing to participate in this study, were deployed. Two of them were faculty members having more than 20 years of experience teaching and researching in the field of construction management. The other three experts had more than 25 years of experience working for different construction companies as senior project managers and also had a doctoral degree in the field of construction management. Providing the matrix of causes and the rules of filling the SSIM, they were asked to determine which causes are related to each other. Based on the nominal group technique, the completed matrices were collected and sent to other experts to be investigated. Finally, after four rounds, a consensus on the causes’ interactions was achieved.
Step 2: Model Calculation
In this step, the initial and final reachability matrices are generated, and the causes are partitioned into different levels. In the initial reachability matrix, based on Equation (2) and the SSIM, each element is assigned either 0 or 1, i.e.,
Having determined the initial reachability matrix, using the principle of transitivity the final reachability matrix is prepared. The transitivity states that if an element ‘x’ is connected to an element ‘y’ and ‘y’ is connected to an element ‘z’ then ‘x’ is also related to ‘z’. Thereafter, the reachability and antecedent sets can be obtained from the final reachability matrix. While the antecedent set for a cause like C1 is composed of the cause itself and all other causes exerting influence on C1, the reachability set for C1 consists of the cause itself and all other causes receiving influence from C1. Finally, comparing the reachability and antecedent sets, the intersection set, consisting of causes that are similar in both aforementioned sets, is defined for each cause. All the critical causes can be located on different levels by performing the process as follows. If the intersection set is the same as the reachability set, causes are located at the top level. The top-level causes meeting the above condition are eliminated from the element set, and this process is repeated iteratively till all the levels are determined [40].
In this study, according to experts’ opinions and the SSIM, the initial reachability matrix was prepared, which is depicted in Table 3. Following the rules of transitivity, the final reachability matrix was prepared, which is shown in Table 4. This matrix indicates how a specific cause can directly or indirectly exert influence on other causes.
Step 3: Diagram Drawing
In this step, based on the final reachability matrix and the location of each cause in different levels, an ISM diagram, which represents the interrelationships of the causes, is drawn. The levels are indicative of causes’ significance, and the causes located at the lowest level of the diagram are the root causes of the considered problem. Therefore, more efforts should be put into managing them.
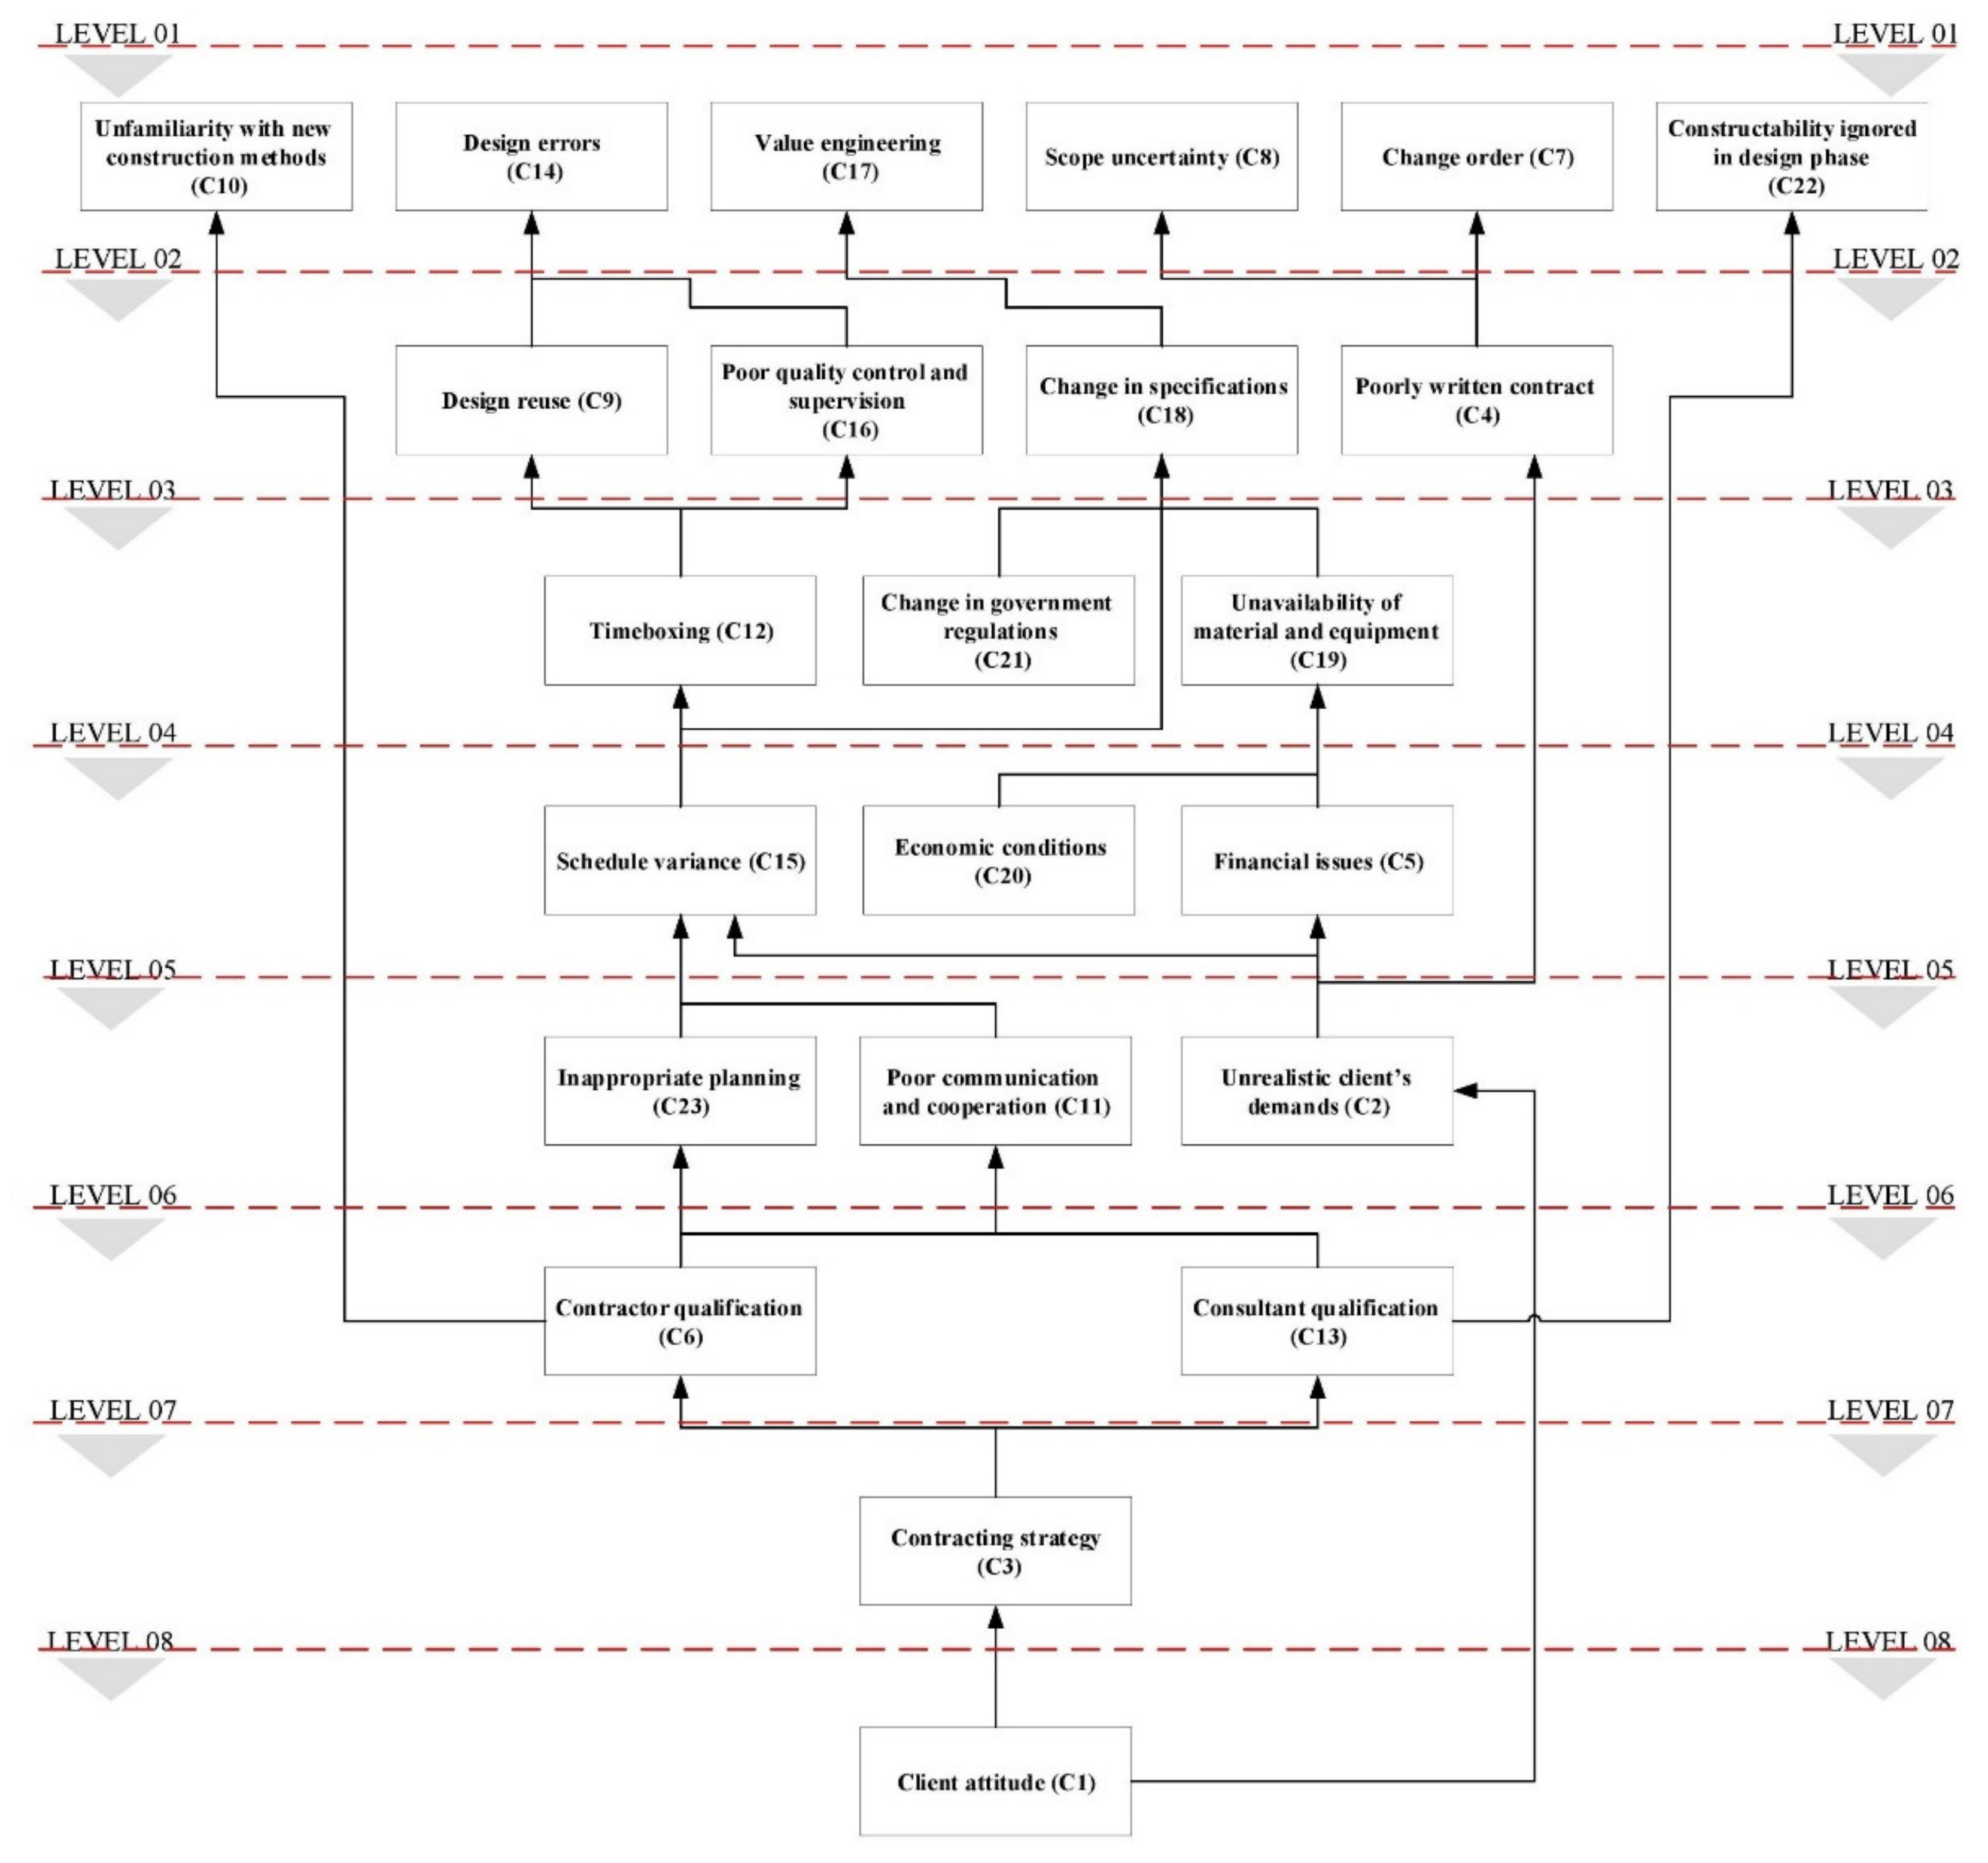
In this study, the final reachability matrix, the reachability set, and the antecedent set were determined for each cause, and after eight iterations, the causes were classified into eight levels. The hierarchical model of causes, which consists of eight levels, is illustrated in Figure 2.
Having determined the driving and dependence power of each cause, based on the final reachability matrix, the MICMAC technique can be used to classify them. The MICMAC analysis works on the principle of multiplication properties of matrices [45], and it aims to investigate the dependence and driving power of factors [46]. According to Malone [47], factors can be categorized into four clusters as follows.
Independent factors: this cluster is comprised of factors that have a high driving power and a low dependence power. These factors exert a profound influence on other factors and consequently have the capacity to drive the whole system.
Linkage factors: this cluster is comprised of factors that have high driving and dependence powers. These factors are unstable, and not only can any modification of them affect other factors but also it can result in a feedback effect on themselves [47].
Autonomous factors: This cluster is comprised of factors that have low driving and dependence powers. As they are not connected to other factors, they are not of great importance in the system.
Dependent factors: this cluster is comprised of factors that have a low driving power and a high dependence power. As these factors receive an influence from others, they are mainly reliant on other factors and do not impact them.
4. Results and Recommendations
4.1. Results of ISM and MICMAC Analyses
As shown in Figure 2, six causes including C10 (Unfamiliarity with new construction methods), C14 (Design errors), C17 (Value engineering), C8 (Scope uncertainty), C7 (Change orders), and C22 (Constructability ignored in design phase) located at the highest levels of the ISM diagram, which indicates that the occurrence of these causes can directly lead to design changes. The ISM results revealed that two out of the six mentioned causes, including C17 (Value engineering) and C14 (Design errors), have the highest dependence power, which indicates that they are mainly caused by other factors. This is consistent with the results of previous studies which investigated the causes of design changes. Yap and Skitmore [4], for example, ranked scope uncertainty and design errors as the third and fourth most significant causes of design changes. Yap et al. [24] identified value engineering as the main reason for design changes in Malaysian building projects. Gharaibeh et al. [2] found design errors and value engineering to be vital causes of design changes that profoundly affect project performance as well. Bassa et al. [25] identified client change orders as one of the main causes of design changes for the Ethiopian construction projects.
As can be seen, C1 (Clients’ attitude and experience) is also placed at the lowest level of the diagram, which indicates that all causes of design changes own their origins to this factor. The ISM results also showed that three causes, including C1 (Clients’ attitude and experience), C3 (Contracting/bidding strategy), and C2 (Unrealistic client’s demands), have the highest driving power, unveiling that they proactively trigger the occurrence of other causes. This is in line with Lopez et al.’s [48] study which asserted that many of the errors that occur are a result of unrealistic client and end-user expectations. They also noted that stereotypes such as “the best bid is the lowest bid” have been common in the construction industry and adversely influenced the quality of design documents [48]. Likewise, Khanh [9] revealed that unclear requirements during the design phase have a profound influence on the occurrence of the design changes in residential construction projects.
Although most previous studies failed to show how a specific cause could be triggered by others, in this study, using the ISM diagram, the interrelationships between causes could be discerned and discussed. To exemplify, the interactions of design errors with other causes are investigated in this part. Poor quality control and supervision is one of the main reasons which can give rise to design errors. As stated by Assaf et al. [42], some design firms are reluctant to establish a quality management system and to perform regular audits, and they regard it as a non-added value activity. Design reuse is also another cause of design errors. Although a wide array of reasons can cause these two factors, the adoption of timeboxing, which is the allocation of a fixed time to a design task irrespective of its complexity, among others, is the main one. As stated by Love et al. [49], the implementation of such a practice increases the propensity to commit mistakes and not to undertake design checks, reviews, and verifications. Increasing unrealistic clients’ demands whose origins lie in clients’ attitudes and experience can impose a tight schedule or low design fees to design firms and motivate them to adopt this method [48]. Poor communication and co-operation among involved parties and inappropriate planning, which stem from recruiting unqualified consultants and contractors by clients, are also other factors that can increase schedule pressure and prompt design firms to apply this method.
As shown in Figure 3, the causes were also categorized into four groups using the MICMAC technique. Based on the MICMAC results, C1 (Clients’ attitude and experience), C2 (Unrealistic client’s demands), C3 (Contracting/bidding strategy), C6 (Contractor’s qualification), and C13 (consultant’s qualification) were placed in the independent cluster, which indicates that they exert a high influence on other causes. Causes including C12 (Timeboxing), C9 (Design reuse), C16 (Poor quality control and supervision), C14 (Design errors), C18 (Change in specifications), C17 (Value engineering), and C15 (Schedule variance) all of which are located in the top three levels of the ISM diagram, were placed in the dependent cluster, which indicates that they receive influence from other causes. All other causes were classified as autonomous ones.
As illustrated in Figure 4 and Figure 5, the causes were also investigated based on the stakeholders associated with them as well as the management areas from which they arise. It was revealed that client-related causes belong to the linkage cluster, which indicates that their changes not only can affect other causes but also can result in a feedback effect on themselves. As is clear, three out of six causes at the top of the ISM diagram as well as the main one at the bottom of it are associated with the clients. This is in agreement with many previous studies [50,51,52] which found client-related causes as the main reason for design changes. Consultant-related causes were also categorized as independent causes, which indicate that they considerably influence other causes. The MICMAC method also disclosed that time- and quality-related causes are dependent on other causes, and Policy-related causes, which are labeled linkage causes, can have a feedback effect on the whole system. Therefore, more efforts should be put into eliminating or mitigating the adverse effects of these causes. Other categories were categorized as autonomous causes, which indicate that they do not exert a noticeable impact on other factors.
4.2. Proposing Recommendations to Overcome Design Changes
It is self-evident that the elimination of the links between causes or the causes themselves can sharply decrease the propagating effects of the interrelations. Therefore, through discussing the obtained results from the ISM and MICMAC methods with the second panel of experts and conducting a literature review, some mitigation/preventive actions were identified, which are outlined in this section for each type of causes and shown in Figure 6. This figure also presents how the identified strategies can break the links among the causes. The suggested strategies are believed to be conducive to managing the design and construction phases of buildings with different types, sizes, and functions. Overall, the results of the ISM and MICMAC indicate that as C2 (Unrealistic client’s demands) and C3 (Contracting/bidding strategy) belong to the bottom levels in the hierarchy structure and have the highest driving power, it is expected that addressing these causes prevents design changes to a large extent. In other words, the highest priority should be given to strategies targeting these causes.
4.2.1. Strategies to Address Independent Causes
As illustrated in Figure 6, the origins of design change causes lie in five root causes placing at the bottom of the diagram and labeled independent causes. In order to break the links exiting from the contracting/bidding strategy, clients are advised to select design firms and contractors based on their track records, experience in handling similar projects, the understanding of the firm from the needs and requirements of the client, and the firm’s capability to meet the project time and cost constraints (strategy 1) [2]. Clients are inclined to give more primacy to prequalification criteria that there is evidence for. However, as argued by Nazari et al. [53], to prequalify contractors and design firms, equal importance should also be given to intangible criteria, such as innovation, and using the same list of criteria and weights for different project types should be avoided. Indeed, a projects’ performance is dependent on parties’ experience and qualifications. Therefore, to pre-empt various causes stemming from contractors’ and consultants’ incompetency, project participants should take full advantage of reusable project knowledge and learn from errors to devise better plans and reduce mistakes (strategy 2) [24]. As discussed by Lopez et al. [48], learning from errors is believed to be a collective capacity that can result in individual, organizational, and inter-organizational error prevention practices overtime. It is worth mentioning that interaction is the key element of the learning process, which can facilitate the sharing of experiences. Therefore, establishing more connections with both individuals within the organization and team members of other organizations to exchange information, knowledge, and new ideas and to reuse the knowledge achieved for future projects, can significantly improve the quality of plans, and prevent subsequent consequences. Although it might take a while for these strategies to be effective, they could potentially prevent the occurrence of other causes in the long term. In order to break the link between clients’ attitudes and unrealistic clients’ demands, clients should accustom themselves to the processes involved in building projects [54] and align themselves with end-user requirements (strategy 3). Additionally, during the briefing stage, consultants should do their best to capture the design needs of the client and provide adequate guidance and support for clients about what can be obtained (strategy 4). Digital Engineering (DE), which is regarded as the outcome of the integration of various technologies, including Building Information Modeling (BIM), Virtual Reality (VR), Augmented Reality (AR), etc., could be an appropriate option for information exchange and collaborative decision making during the project life cycle [55]. Visualization applications and a powerful interactive design environment could also assist designers to reach a common language with clients and have a better understanding of growing client requirements at the outset of the project [56].
4.2.2. Strategies to Address Dependent Causes
As shown in Figure 6, seven factors labeled dependent causes are located at top levels, which indicate that they can be influenced by other factors. Although it is widely accepted that addressing driving factors can control dependent ones [57], some strategies to tackle these factors are also proposed. In order to prevent schedule variances, all parties are recommended to establish a strong and continuous relationship with one another so as to address problems at the earliest time (strategy 5). As noted by Yap et al. [10], effective project communication is able to noticeably decrease schedule variance through team cohesion, collaborative culture, sharing of project experiences, and a common understanding of problems. In some cases, not all project teams involved in a project are always present on a job site. Therefore, immersive technologies, which facilitate the participation of all parties and share information about the design issues in actual time, could be a suitable option for increasing communication and providing more realistic insights, notably for clients [58]. Additionally, as discussed by Pour Rahimian et al. [59], these technologies could be potentially integrated with nD BIM and Machine Learning (ML) to automate construction progress monitoring and to diagnose any discrepancy at the earliest time. These could assist contractors to better plan projects and decrease schedule variance. Clients and consultants should also involve contractors earlier in the design phase (strategy 6). This can facilitate making construction-related design decisions and prevent claims and rework as well. As asserted by Hosseini et al. [55], both DE and BIM could potentially streamline the process of early participation and contribution of all stakeholders by enhancing information exchange. In order to break the links leading to design errors, consultants should establish an effective quality control system (strategy 7). Previous errors in design documents should be documented, and the lessons learned should be regularly incorporated into the quality control system. The combination of advanced interactive visualization with the power of BIM is also believed to be a good option for the early identification of design errors and their impact on building performance [56]. However, it is worth mentioning that there is a limit to the extent to which errors can be eliminated using these strategies [54]. To prevent design firms from resorting to the timeboxing method, strategy 3 is again recommended. It should be noted that this practice occurs when low design fees, often based on competitive fee tendering, are imposed on designers by clients. Therefore, the mentioned strategy by removing the root cause and making clients’ demands more realistic can pre-empt this practice. To prevent and control the consequences of employing the timeboxing method, project managers of design firms are recommended to recruit experienced staff for crucial design tasks (strategy 8). As experienced staff are more familiar with organizational processes and practices and have the experience of working in similar conditions, allocating them to critical design tasks can decrease the probability of committing errors and reusing previous design documents.
4.2.3. Strategies to Address Autonomous Causes
Although the rest of the causes labeling autonomous causes cannot have a significant impact on other causes, they still need attention. In order to break the links leading to change orders and scope uncertainty, clients are advised to spend more time clarifying requirements and objectives in the contract and establishing a change management system to assess the impact of each change in terms of time, cost, and quality before issuing them (strategy 9). Integration of changes, reviewing and evaluating all change requests, updating project documents, and project management plans are all important factors that result from a change, and these changes will be accompanied by risks in different areas of the project. As discussed by Moshtaghian et al. [60], the information received from the executive operation could be integrated with BIM to provide a dynamic database to identify these risks and evaluate change’s impacts on project objectives. Establishing such a mechanism would provide valuable information for clients and assist them to make more reasonable decisions. In order to eliminate causes that are related to financial issues and economic conditions, clients are advised to give more priority to undertaking market assessments and conducting feasibility studies prior to the design phase (strategy 10) [2]. With more and more projects completing within budget and schedule, the significance of conducting a feasibility study and considering its findings in financing and designing the project will be manifested and recognized by the clients, notably ones in the developing countries. Overall, as discussed earlier, the provided strategies could be beneficial for buildings with various features. However, since strategies 2, 5, and 9 are predominantly dealing with information management, they are more suitable for commercial buildings and buildings with high technologies which involve a wide range of stakeholders.
5. Discussions
The analysis of design change causes and their interactions with each other, based on the proposed method, will provide practitioners with a better insight into how a particular cause could be triggered by the occurrence of other causes and how a particular cause could eventually lead to a design change. The findings of this study will also assist project managers of different parties to direct limited resources to causes exerting the highest influence on the whole system. Although many research studies are available on the causes of design change, there is a dearth of research focusing on understanding the interactions among the causes and proposing remedial strategies based on these interactions. Comparing the results of the study with the findings of previous research revealed that while the model is representative of the Iranian experts’ mindsets, it can also work well within other contexts and truly show how the causes are interconnected. Additionally, external validation of results showed that Iranian expert opinions are in agreement with those of other experts in other countries as all chosen international professionals validated the obtained results. Overall, the theoretical, empirical, and methodological contributions of this study can be outlined as follows.
As mentioned by Makadok et al. [61], any theory has six adjustable levers, namely how, who, where, why, what, and when, which correspond to the classic “five W’s and an H” of journalism. Therefore, the contributions of a theory could be assessed based on its mentioned levers. First, to describe what, this study identified 23 main causes of design changes in the building construction sector of Iran. To the authors’ best knowledge, this is the first study that investigates design change causes in the Iranian context. Second, to answer how, this study shifts attention from a feeble model, which assumes causes to be independent, to a well-structured model that considers the interactions between the causes. Finally, to explain why, this study introduces a causal mechanism and provides logical consistency for the ISM-based model by categorizing the identified causes into dependent, independent, autonomous, and linkage groups. Compared to previous research, such as Yap et al.’s study [10], which investigated the causal mechanism between the factors, this study facilitates the identification of causes that are of great importance in the model by clarifying the driving and dependence power of each cause. Additionally, this study, by considering the management areas from which the causes arise and categorizing causes in this regard, implies which project management areas are more challenging considering design change, and how different groups impact one another.
A significant empirical contribution of this study is that not only is it capable of providing more comprehensive insights into how the causes of design changes are related to each other through providing explicit mental models, but it further analyzed them empirically to identify the priority of the causes based on their driving and dependence power. Although the interactions of the causes have been investigated in previous research, such as Yap et al.’s study [10], according to the empirical knowledge of experts, they mainly failed to identify major causes and rank them considering the causes’ interactions.
From the methodological point of view, this study makes a significant contribution by proposing remedial strategies based on the available links among the causes. As decision-makers can easily investigate how a specific strategy can eliminate a cause and prevent the occurrence of other subsequent causes on a specific path, they can prioritize their strategies and give more primacy to the ones that target causes with higher driving power. This is unlike previous studies [2,4,25] which proposed strategies only based on the grasped importance of the causes and irrespective of the interactions between them.
6. Conclusions
It has been argued that design changes are one of the contributory factors to projects’ time and cost over-run, and their adverse effects involve all project participants. Although numerous studies have been carried out to delve into the causes of design changes, few of them investigated the interactions between the causes. To fill the existing gap, in this study, the latent interrelations between the causes were investigated using the ISM approach. Based on the MICMAC technique, they were also classified with respect to their dependence and driving powers. Stakeholders associated with them and management areas from which the causes arise were also considered. To this aim, firstly, based on the literature review, 38 causes of design change were identified. Then, using a panel of 20 relevant professionals involved in the Iranian building construction sector, they were confined to 23 major ones based on their significance. Using the nominal group technique, the interactions of the causes were investigated thereafter and represented by the ISM approach. The results showed that C10 (Unfamiliarity with new construction methods), C14 (Design errors), C17 (Value engineering), C8 (Scope uncertainty), C7 (Change orders), and C22 (Constructability ignored in design phase) located at the highest level of the ISM diagram, can instantly lead to design changes. C1 (Clients’ attitude and experience) was also identified as the main root cause of design changes. The MICMAC technique results revealed that C1 (Clients’ attitude and experience), C2 (Unrealistic client’s demands), C3 (Contracting/bidding strategy), C6 (Contractor’s qualification), and C13 (consultant’s qualification), which have strong driving power and significantly influence other causes, should be given more emphasis. It was also disclosed that policy and client-related causes can have a feedback effect on the whole system. Furthermore, the MICMAC technique results showed that the time and quality-related causes are dependent on other causes, and the consultant-related causes significantly influence other causes. In the end, ten strategies to address the identified causes and their interrelationships were proposed. Assuming a similarity between the causal natures of design changes, the proposed strategies, and identified major causes are believed to be of benefit to project managers of different parties in other countries as well.
Using the ISM provided a better understanding of how critical causes are interrelated. In other words, its results facilitate the identification of paths through which a specific cause could happen. This can assist project managers of all parties in devising a scheme for mitigating the detrimental effects of design changes. Overall, the main research contribution of this study can be outlined as providing a basis for project managers and decision-makers to further investigate design changes and to plan strategies to prevent them, considering the interrelations between the causes. That is to say, the identification of paths through which a particular cause could occur can help managers prevent other causes to be triggered. Using the developed model, the identified strategies could also be prioritized on the basis of the causes that they target. More importance, therefore, could be given to the strategies that address causes with higher driving power.
Despite the significant contributions of this study, it has a number of limitations as follows. First, this study identified the main causes of design changes irrespective of project types. The causes of design changes, however, could be different with respect to project types and sizes. Therefore, future studies should identify the main causes considering this issue and examine the interactions of causes using the proposed method. Second, this study did not take cognizance of the level of strength that each factor exerts on others. Future research should, therefore, take the intensity of the influences into account. Third, while the external validation of research results showed that the findings of this study could be also of benefit to the practitioners of other countries, it should be mentioned that this study drew on the experience of practitioners working in the Iranian construction industry. Therefore, the priority of the causes could be different in other contexts, and as a result, the causes, which the model included, could be different. Therefore, future studies should be conducted in other countries to extend the boundary of the developed model. Fourth, this study investigated the causes’ interactions and did not map them onto the effects of design changes. In future work, the interactions of the causes and effects, and feedback loops should be considered, and factors’ importance should be calculated considering the aforementioned interactions. As a result, decision-makers can identify major paths which can result in a particular effect and devise more efficient measures to handle them. Finally, another limitation is indeed the reliance on data collected from the first panel of experts (i.e., 20 experts) using questionnaire surveys. Although the method is ubiquitous and well suited to this study, they do attract the criticism that results might be variable when tests are replicated with a larger group. Nevertheless, it should be emphasized that all the respondents had more than 20 years’ relevant experience. This provides a benchmark against which further research into this area can be usefully compared and contrasted.
Author Contributions
Conceptualization, S.S. and N.C.; methodology, S.S.; software, S.S.; validation, S.S. and N.C.; formal analysis, S.S.; investigation, S.S.; resources, S.S.; data curation, S.S.; writing—original draft preparation, S.S.; writing—review and editing, S.S. and N.C.; visualization, S.S.; supervision, N.C.; project administration, N.C. All authors have read and agreed to the published version of the manuscript.
Funding
This research received no external funding.
Institutional Review Board Statement
Not applicable.
Informed Consent Statement
Informed consent was obtained from all subjects involved in the study.
Data Availability Statement
Not applicable.
Acknowledgments
The authors are grateful to the participants who contributed to the research.
Conflicts of Interest
The authors declare no conflict of interest.
Abbreviations
The following abbreviations are used in this manuscript:
| MICMAC | Matrice d’Impacts Croisés Multiplication Appliquée à un Classement |
| ISM | Interpretive Structural Modeling |
| GDP | Gross Domestic Product |
| ANN | Artificial Neural Network |
| IPMA | International Project Management Association |
| CNBR | Co-operative Network for Building Researchers |
| RII | Relative Importance Index |
| PPP | Public–Private Partnership |
| SSIM | Structural Self-Interaction Matrix |
| DrP | Driving Power |
| DeP | Dependence Power |
| DE | Digital Engineering |
| BIM | Building Information Modeling |
| AR | Augmented Reality |
| VR | Virtual Reality |
Appendix A

Table A1.
The primary list of causes of design changes.
| ID | Causes | Source |
|---|---|---|
| C01 | Clients’ attitude and experience | [42] |
| C02 | Unrealistic client’s demands | [27] |
| C03 | Contracting strategy | [19] |
| C04 | Poorly written contract | [25] |
| C05 | Financial issues | [24] |
| C06 | Contractor qualification | [27] |
| C07 | Change order | [25] |
| C08 | Scope uncertainty | [19] |
| C09 | Design reuse | [42] |
| C10 | Unfamiliarity with new construction methods | [19] |
| C11 | Poor communication and co-operation | [24] |
| C12 | Timeboxing | [42] |
| C13 | Consultant qualification | [42] |
| C14 | Design errors | [2] |
| C15 | Schedule variance | [10] |
| C16 | Poor quality control and supervision | [42] |
| C17 | Value engineering | [4] |
| C18 | Change in specifications | [10] |
| C19 | Unavailability of materials and equipment | [2] |
| C20 | Economic conditions | [27] |
| C21 | Change in government regulations | [24] |
| C22 | Constructability ignored in design process | [4] |
| C23 | Inappropriate planning | [19] |
| C24 | Slow decision-making | [62] |
| C25 | Change of use of building | [4] |
| C26 | Insufficient soil investigation prior to design | [4] |
| C27 | The expensiveness of current design | [27] |
| C28 | Non-compliance with authority requirements | [63] |
| C29 | Compliance to new quality requirements | [64] |
| C30 | Unforeseen ground conditions | [4] |
| C31 | Site safety considerations | [65] |
| C32 | Undetected underground utilities | [4] |
| C33 | Clashes with adjacent structures | [4] |
| C34 | Problem with adjacent properties | [4] |
| C35 | Local authority planning permission requirements | [64] |
| C36 | Outdated design | [66] |
| C37 | Incomplete drawings | [2] |
| C38 | Skill shortage in certain trades | [67] |
References
- Myers, D. Construction Economics: A New Approach, 4th ed.; Routledge: London, UK, 2016; pp. 221–249. [Google Scholar]
- Gharaibeh, L.G.; Matarneh, S.T.; Arafeh, M.; Sweis, G. Factors leading to design changes in Jordanian construction projects. Int. J. Product. Perform. Manag. 2020, 70, 893–915. [Google Scholar] [CrossRef]
- Parvan, K.; Rahmandad, H.; Haghani, A. Estimating the impact factor of undiscovered design errors on construction quality. In Proceedings of the 30th International Conference of the System Dynamics Society, St. Gallen, Switzerland, 22–26 July 2012; pp. 1–16. [Google Scholar]
- Yap, J.B.H.; Skitmore, M. Investigating design changes in Malaysian building projects. Archit. Eng. Des. Manag. 2018, 14, 218–238. [Google Scholar] [CrossRef]
- Hanna, A.S.; Camlic, R.; Peterson, P.A.; Lee, M.-J. Cumulative effect of project changes for electrical and mechanical construction. J. Constr. Eng. Manag. 2004, 130, 762–771. [Google Scholar] [CrossRef]
- Olawale, Y.A.; Sun, M. Cost and time control of construction projects: Inhibiting factors and mitigating measures in practice. Constr. Manag. Econ. 2010, 28, 509–526. [Google Scholar] [CrossRef]
- Sunday, D.O.; Afolarin, A.O. Causes, effects and remedies of errors in Nigerian construction documents. Organ. Technol. Manag. Constr. An. Int. J. 2013, 5, 676–686. [Google Scholar] [CrossRef]
- Alnuaimi, A.S.; Taha, R.A.; al Mohsin, M.; Al-Harthi, A.S. Causes, effects, benefits, and remedies of change orders on public construction projects in Oman. J. Constr. Eng. Manag. 2010, 136, 615–622. [Google Scholar] [CrossRef]
- Khanh, H.D. Factors causing design changes in Vietnamese residential construction projects: An evaluation and comparison. J. Sci. Technol. Civil. Eng. 2020, 14, 151–166. [Google Scholar] [CrossRef]
- Yap, J.B.H.; Skitmore, M.; Gray, J.; Shavarebi, K. Systemic view to understanding design change causation and exploitation of communications and knowledge. Proj. Manag. J. 2019, 50, 288–305. [Google Scholar] [CrossRef] [Green Version]
- Shoar, S.; Nasirzadeh, F.; Zarandi, H.R. Quantitative assessment of risks on construction projects using fault tree analysis with hybrid uncertainties. Constr. Innov. 2019, 19, 48–70. [Google Scholar] [CrossRef]
- Yana, A.A.G.A.; Rusdhi, H.A.; Wibowo, M.A. Analysis of factors affecting design changes in construction project with Partial Least Square (PLS). Procedia Eng. 2015, 125, 40–45. [Google Scholar] [CrossRef] [Green Version]
- Assaf, S.A.; Al-Hejji, S. Causes of delay in large construction projects. Int. J. Proj. Manag. 2006, 24, 349–357. [Google Scholar] [CrossRef]
- Ameh, O.J.; Soyingbe, A.A.; Odusami, K.T. Significant factors causing cost overruns in telecommunication projects in Nigeria. J. Constr. Dev. Ctries. 2010, 15, 49–67. [Google Scholar]
- Le-Hoai, L.; Lee, Y.D.; Lee, J.Y. Delay and cost overruns in Vietnam large construction projects: A comparison with other selected countries. KSCE J. Civil. Eng. 2008, 12, 367–377. [Google Scholar] [CrossRef]
- Owalabi, J.D.; Amusan, L.M.; Oloke, C.O. Causes and effects of delay on project construction delivery time. Int. J. Educ. Res. 2014, 2, 197–208. [Google Scholar]
- Gamil, Y.; Abdul Rahman, I. Assessment of critical factors contributing to construction failure in Yemen. Int. J. Constr. Manag. 2020, 20, 429–436. [Google Scholar] [CrossRef]
- Annamalaisami, C.D.; Kuppuswamy, A. Reckoning construction cost overruns in building projects through methodological consequences. Int. J. Constr. Manag. 2019. [Google Scholar] [CrossRef]
- Aslam, M.; Baffoe-Twum, E.; Saleem, F. Design changes in construction projects—causes and impact on the cost. Civil. Eng. J. 2019, 5, 1647–1655. [Google Scholar] [CrossRef] [Green Version]
- Parchami Jalal, M.; Shoar, S. A hybrid framework to model factors affecting construction labour productivity: Case study of Iran. J. Financ. Manag. Prop. Constr. 2019, 24, 630–654. [Google Scholar] [CrossRef]
- Samarghandi, H.; Tabatabaei, S.M.M.; Taabayan, P.; Hashemi, A.M.; Willoughby, K. Studying the reasons for delay and cost overrun in construction projects: The case of Iran. J. Constr. Dev. Ctries. 2016, 21, 51–84. [Google Scholar] [CrossRef]
- Heravi, G.; Mohammadian, M. Investigating cost overruns and delay in urban construction projects in Iran. Int. J. Constr. Manag. 2021, 21, 958–968. [Google Scholar] [CrossRef]
- Parchami Jalal, M.; Shoar, S. A hybrid SD-DEMATEL approach to develop a delay model for construction projects. Eng. Constr. Archit. Manag. 2017, 24, 629–651. [Google Scholar] [CrossRef]
- Yap, J.B.H.; Abdul-Rahman, H.; Wang, C.; Skitmore, M. Exploring the underlying factors inducing design changes during building production. Prod. Plan. Control. 2018, 29, 586–601. [Google Scholar] [CrossRef] [Green Version]
- Bassa, M. Causes and effects of design change in building construction projects in three selected southern Ethiopia zones. Int. J. Eng. Res. Technol. 2020, 8, 757–761. [Google Scholar] [CrossRef]
- Saad, D.A.; Gharib, F.; El-Said, M. Simulation of design changes impact in healthcare construction projects using system dynamics. Can. J. Civil. Eng. 2021, 48, 554–569. [Google Scholar] [CrossRef]
- Afsharghotli, A.; Yitmen, I. ANN model for assessment of design changes in gas–oil and petrochemical projects. Arab. J. Sci. Eng. 2020, 45, 4273–4284. [Google Scholar] [CrossRef]
- Janes, F.R. Interpretive structural modelling: A methodology for structuring complex issues. Trans. Inst. Meas. Control 1988, 10, 145–154. [Google Scholar] [CrossRef]
- Abowitz, D.A.; Toole, T.M. Mixed method research: Fundamental issues of design, validity, and reliability in construction research. J. Constr. Eng. Manag. 2010, 136, 108–116. [Google Scholar] [CrossRef]
- Yin, R.K. Case Study Research: Design and Methods; Sage: Thousand Oaks, CA, USA, 1994. [Google Scholar]
- Riege, A.M. Validity and reliability tests in case study research: A literature review with “hands-on” applications for each research phase. Qual. Market. Res. An. Int. J. 2003, 6, 75–86. [Google Scholar] [CrossRef] [Green Version]
- Lucko, G.; Rojas, E.M. Research validation: Challenges and opportunities in the construction domain. J. Constr. Eng. Manag. 2010, 136, 127–135. [Google Scholar] [CrossRef]
- Yu, T.; Liang, X.; Wang, Y. Factors affecting the utilization of big data in construction projects. J. Constr. Eng. Manag. 2020, 146, 04020032. [Google Scholar] [CrossRef]
- Iyer, K.C.; Sagheer, M. Hierarchical structuring of PPP risks using interpretative structural modeling. J. Constr. Eng. Manag. 2010, 136, 151–159. [Google Scholar] [CrossRef] [Green Version]
- Pidd, M. Why modelling and model use matter. J. Oper. Res. Soc. 2010, 61, 14–24. [Google Scholar] [CrossRef]
- Landry, M.; Oral, M. In search of a valid view of model validation for operations research. Eur. J. Oper. Res. 1993, 66, 161–167. [Google Scholar] [CrossRef]
- El-Diraby, T.E.; O’Connor, J.T. Lessons learned in designing research methodology in field-based construction research. J. Prof. Issues Eng. Educ. Pract. 2004, 130, 109–114. [Google Scholar] [CrossRef]
- Lopez, C.; Salmeron, J.L. Dynamic risks modelling in ERP maintenance projects with FCM. Inf. Sci. 2014, 256, 25–45. [Google Scholar] [CrossRef]
- Khanzadi, M.; Nasirzadeh, F.; Dashti, M.S. Fuzzy cognitive map approach to analyze causes of change orders in construction projects. J. Constr. Eng. Manag. 2018, 144, 04017111. [Google Scholar] [CrossRef]
- Shrivas, A.; Singla, H.K. Analysis of interaction among the factors affecting delay in construction projects using interpretive structural modelling approach. Int. J. Constr. Manag. 2020. [Google Scholar] [CrossRef]
- Prakash, A.; Phadtare, M. Exploration of logic in project marketing using interpretive structural modeling. J. Constr. Eng. Manag. 2019, 145, 04019066. [Google Scholar] [CrossRef]
- Assaf, S.; Hassanain, M.A.; Abdallah, A. Review and assessment of the causes of deficiencies in design documents for large construction projects. Int. J. Build. Pathol. Adapt. 2018, 36, 300–317. [Google Scholar] [CrossRef]
- Sushil. Interpreting the interpretive structural model. Glob. J. Flex. Syst. Manag. 2012, 13, 87–106. [Google Scholar] [CrossRef]
- Tavakolan, M.; Etemadinia, H. Fuzzy weighted interpretive structural modeling: Improved method for identification of risk interactions in construction projects. J. Constr. Eng. Manag. 2017, 143, 04017084. [Google Scholar] [CrossRef]
- Kannan, G.; Pokharel, S.; Kumar, P.S. A hybrid approach using ISM and fuzzy TOPSIS for the selection of reverse logistics provider. Resour. Conserv. Recycl. 2009, 54, 28–36. [Google Scholar] [CrossRef]
- Mandal, A.; Deshmukh, S.G. Vendor selection using interpretive structural modelling (ISM). Int. J. Oper. Prod. Manag. 1994, 14, 52–59. [Google Scholar] [CrossRef]
- Malone, D.W. An introduction to the application of interpretive structural modeling. Proc. IEEE 1975, 63, 397–404. [Google Scholar] [CrossRef]
- Lopez, R.; Love, P.E.D.; Edwards, D.J.; Davis, P.R. Design error classification, causation, and prevention in construction engineering. J. Perform. Constr. Facil. 2010, 24, 399–408. [Google Scholar] [CrossRef]
- Love, P.E.D.; Edwards, D.J.; Irani, Z. Forensic project management: An exploratory examination of the causal behavior of design-induced rework. IEEE Trans. Eng. Manag. 2008, 55, 234–247. [Google Scholar] [CrossRef]
- Abdul-rahman, H.; Wang, C.; Yap, J.B.H. Impacts of design changes on construction project performance: Insights from literature review. J. Quant. Surv. Constr. Bus. 2017, 7, 31–54. [Google Scholar]
- Suleiman, I.J.; Luvara, V.G.M. Factors influencing change of design of building projects during construction Stage in Dar-es-Salaam Tanzania. Int. J. Constr. Eng. Manag. 2016, 5, 93–101. [Google Scholar]
- Love, P.E.D.; Irani, Z.; Edwards, D.J. A rework reduction model for construction projects. IEEE Trans. Eng. Manag. 2004, 51, 426–440. [Google Scholar] [CrossRef] [Green Version]
- Nazari, A.; Vandadian, S.; Abdirad, H. Fuzzy AHP model for prequalification of engineering consultants in the Iranian public procurement system. J. Manag. Eng. 2017, 33, 04016042. [Google Scholar] [CrossRef]
- Love, P.E.D.; Edwards, D.J. Forensic project management: The underlying causes of rework in construction projects. Civil. Eng. Environ. Syst. 2004, 21, 207–228. [Google Scholar] [CrossRef]
- Hosseini, M.R.; Jupp, J.; Papadonikolaki, E.; Mumford, T.; Joske, W.; Nikmehr, B. Position paper: Digital engineering and building information modelling in Australia. Smart Sustain. Built Environ. 2020. [Google Scholar] [CrossRef]
- Pour Rahimian, F.; Chavdarova, V.; Oliver, S.; Chamo, F. OpenBIM-Tango integrated virtual showroom for offsite manufactured production of self-build housing. Autom. Constr. 2019, 102, 1–16. [Google Scholar] [CrossRef]
- Shen, L.; Song, X.; Wu, Y.; Liao, S.; Zhang, X. Interpretive Structural Modeling based factor analysis on the implementation of Emission Trading System in the Chinese building sector. J. Clean. Prod. 2016, 127, 214–227. [Google Scholar] [CrossRef]
- Elghaish, F.; Matarneh, S.; Talebi, S.; Kagioglou, M.; Hosseini, M.R.; Abrishami, S. Toward digitalization in the construction industry with immersive and drones technologies: A critical literature review. Smart Sustain. Built Environ. 2020. [Google Scholar] [CrossRef]
- Pour Rahimian, F.; Seyedzadeh, S.; Oliver, S.; Rodriguez, S.; Dawood, N. On-demand monitoring of construction projects through a game-like hybrid application of BIM and machine learning. Autom. Constr. 2020, 110, 103012. [Google Scholar] [CrossRef]
- Moshtaghian, F.; Golabchi, M.; Noorzai, E. A framework to dynamic identification of project risks. Smart Sustain. Built Environ. 2020, 9, 375–393. [Google Scholar] [CrossRef]
- Makadok, R.; Burton, R.; Barney, J. A practical guide for making theory contributions in strategic management. Strateg. Manag. J. 2018, 39, 1530–1545. [Google Scholar] [CrossRef]
- Muller, R.; Smith, E.; Lillah, R. The impact of employee engagement on organizational performance: A balanced score-card approach. Int. J. Econ. Financ. Stud. 2018, 10, 22–39. [Google Scholar]
- Nel, D. Allocation of risk in public private partnerships in information and communications technology. Int. J. eBusiness eGovernment Stud. 2020, 12, 1–16. [Google Scholar] [CrossRef] [Green Version]
- Shoar, S.; Payan, S. A qualitative system dynamics approach to modeling the causes and effects of design deficiencies in construction projects. J. Facil. Manag. 2021. [Google Scholar] [CrossRef]
- Erol, M. Occupational health and work safety systems in compliance with industry 4.0: Research directions. Int. J. eBusiness eGovernment Stud. 2019, 11, 121–133. [Google Scholar] [CrossRef]
- Sardari, M.; Bavar, S. Introducing the innovative course of architecture modeling and rendering (RSVP). J. Res. Sci. Eng. Technol. 2017, 5, 1–5. [Google Scholar] [CrossRef]
- Orando, M.; Isabirye, A.K. Construction workers’ skill development: A strategy for improving capacity and productivity in South Africa. Int. J. Econ. Financ. Stud. 2018, 10, 66–80. [Google Scholar]
Figure 1.
The flowchart diagram of the research process.
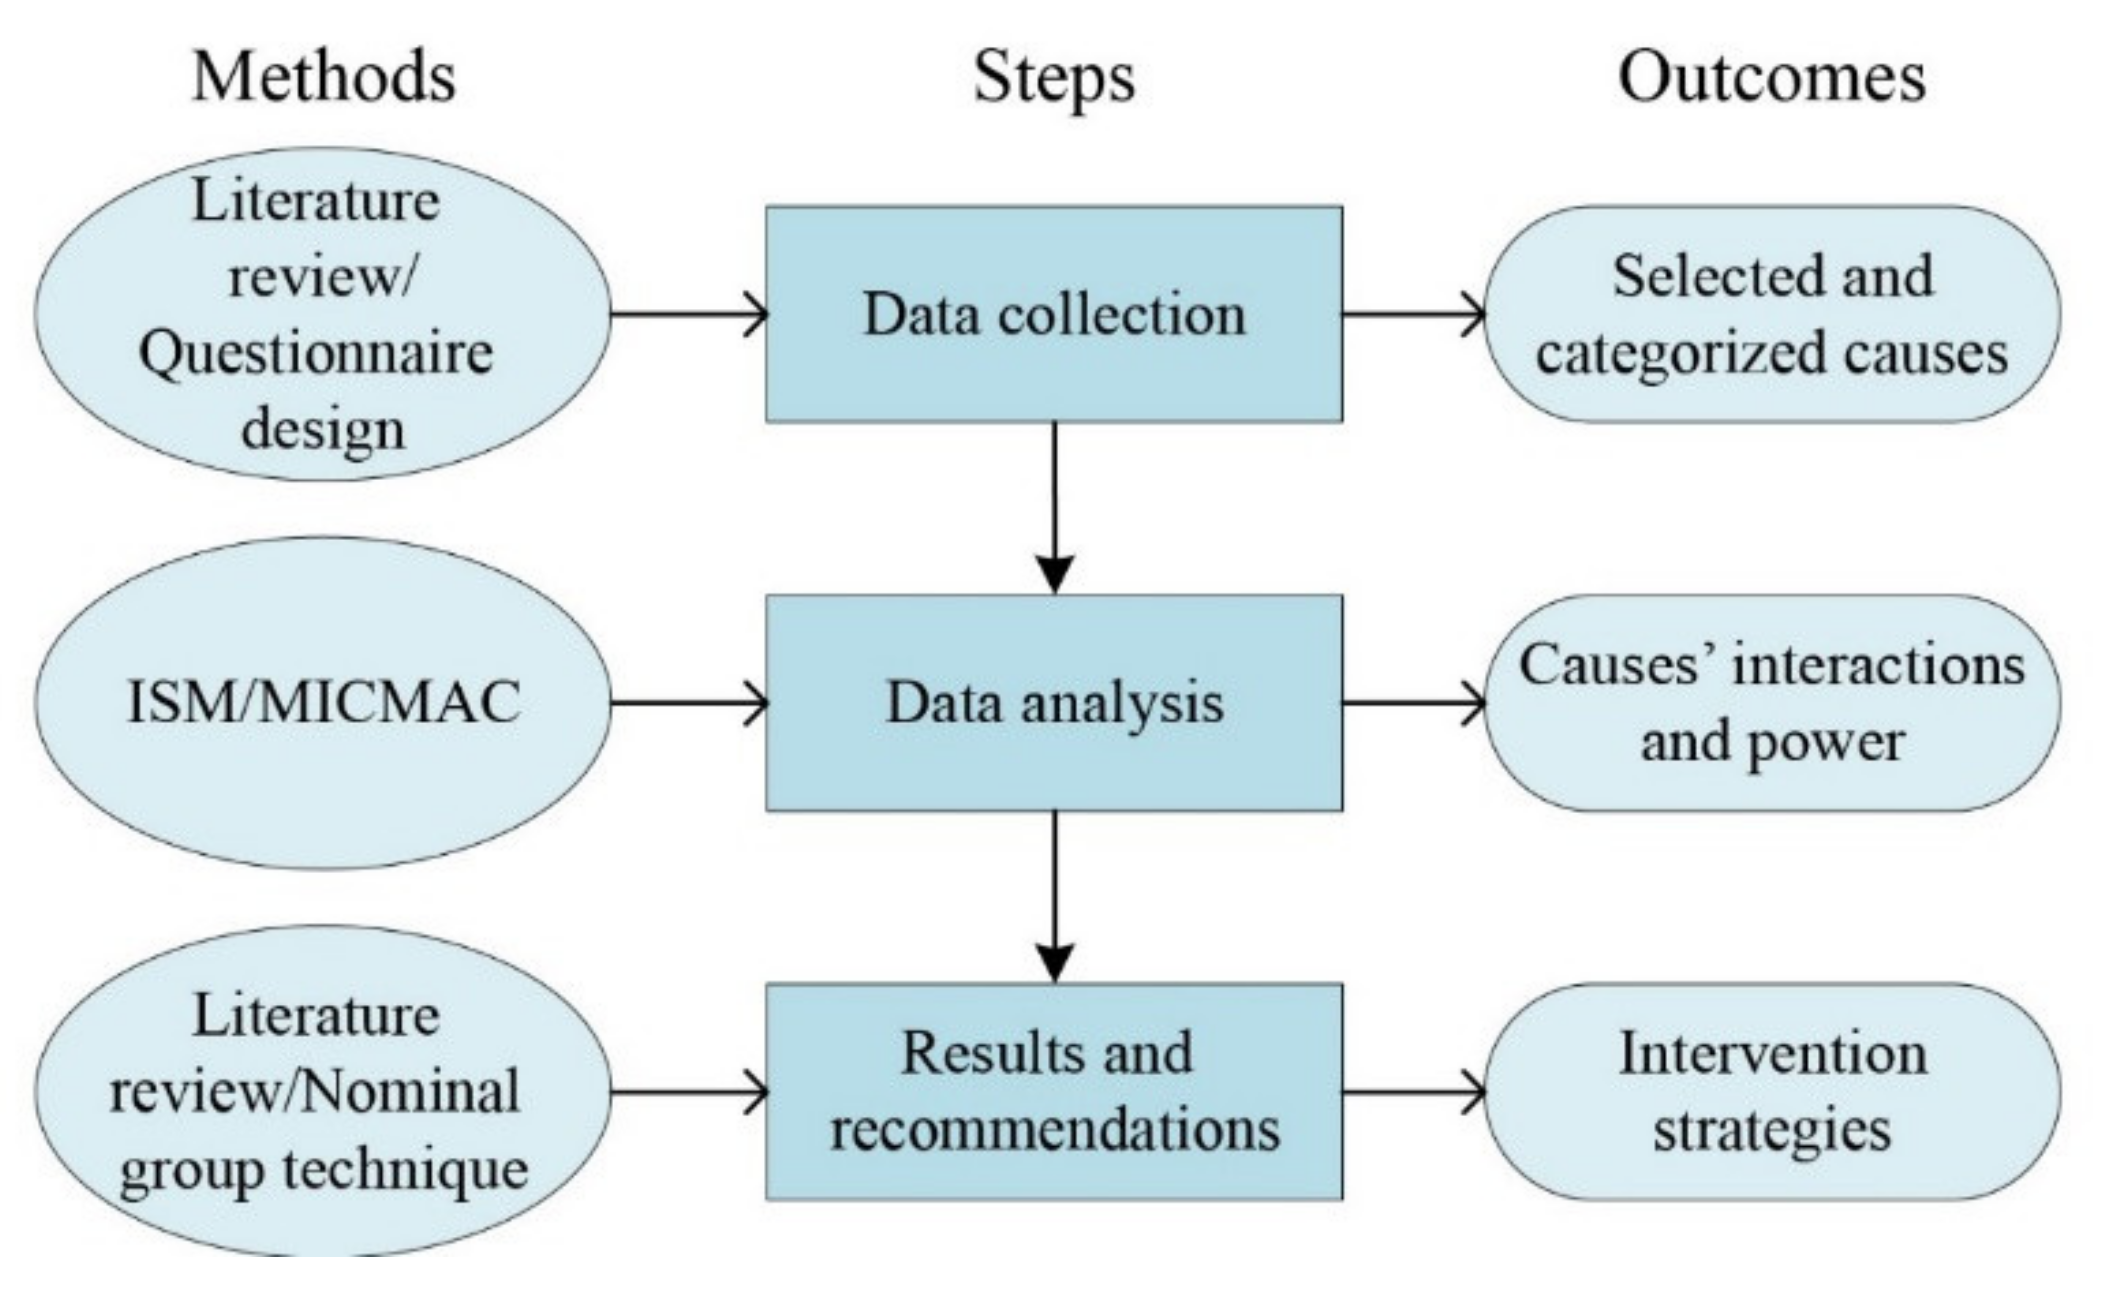
Figure 2.
ISM diagram.
Figure 3.
Overall classification of causes.
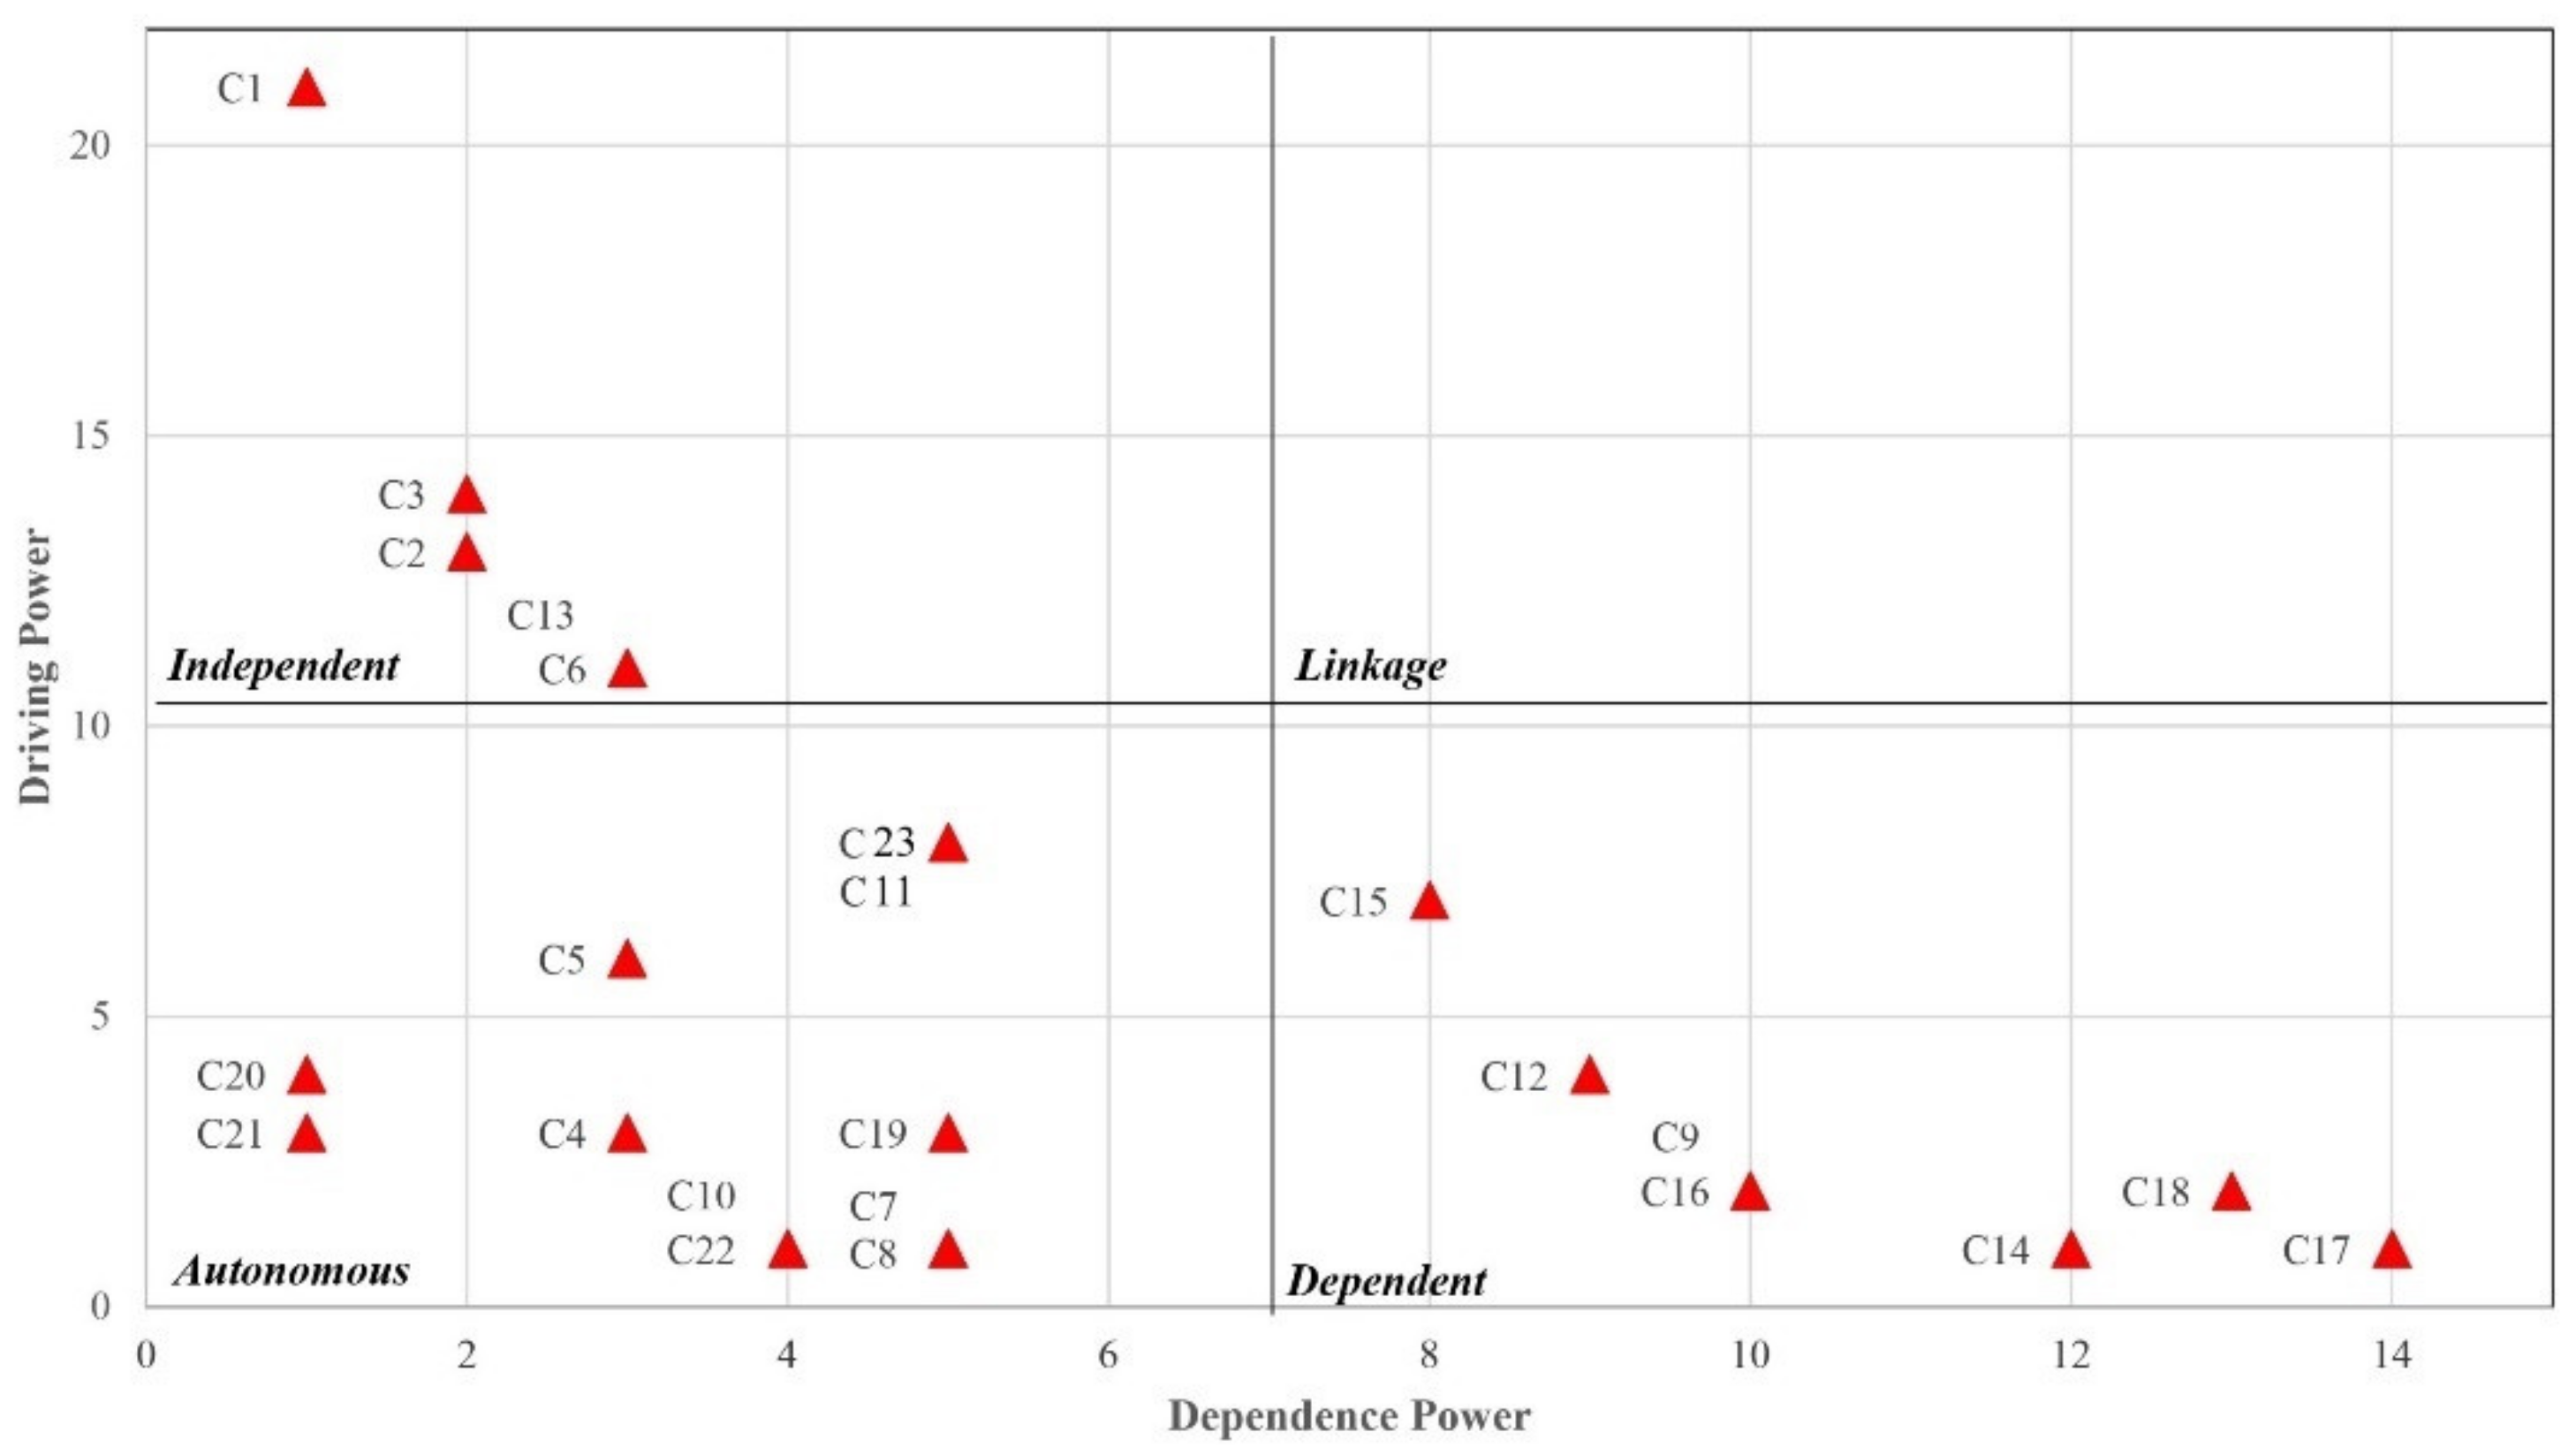
Figure 4.
Classification of causes in terms of management areas associated with them.
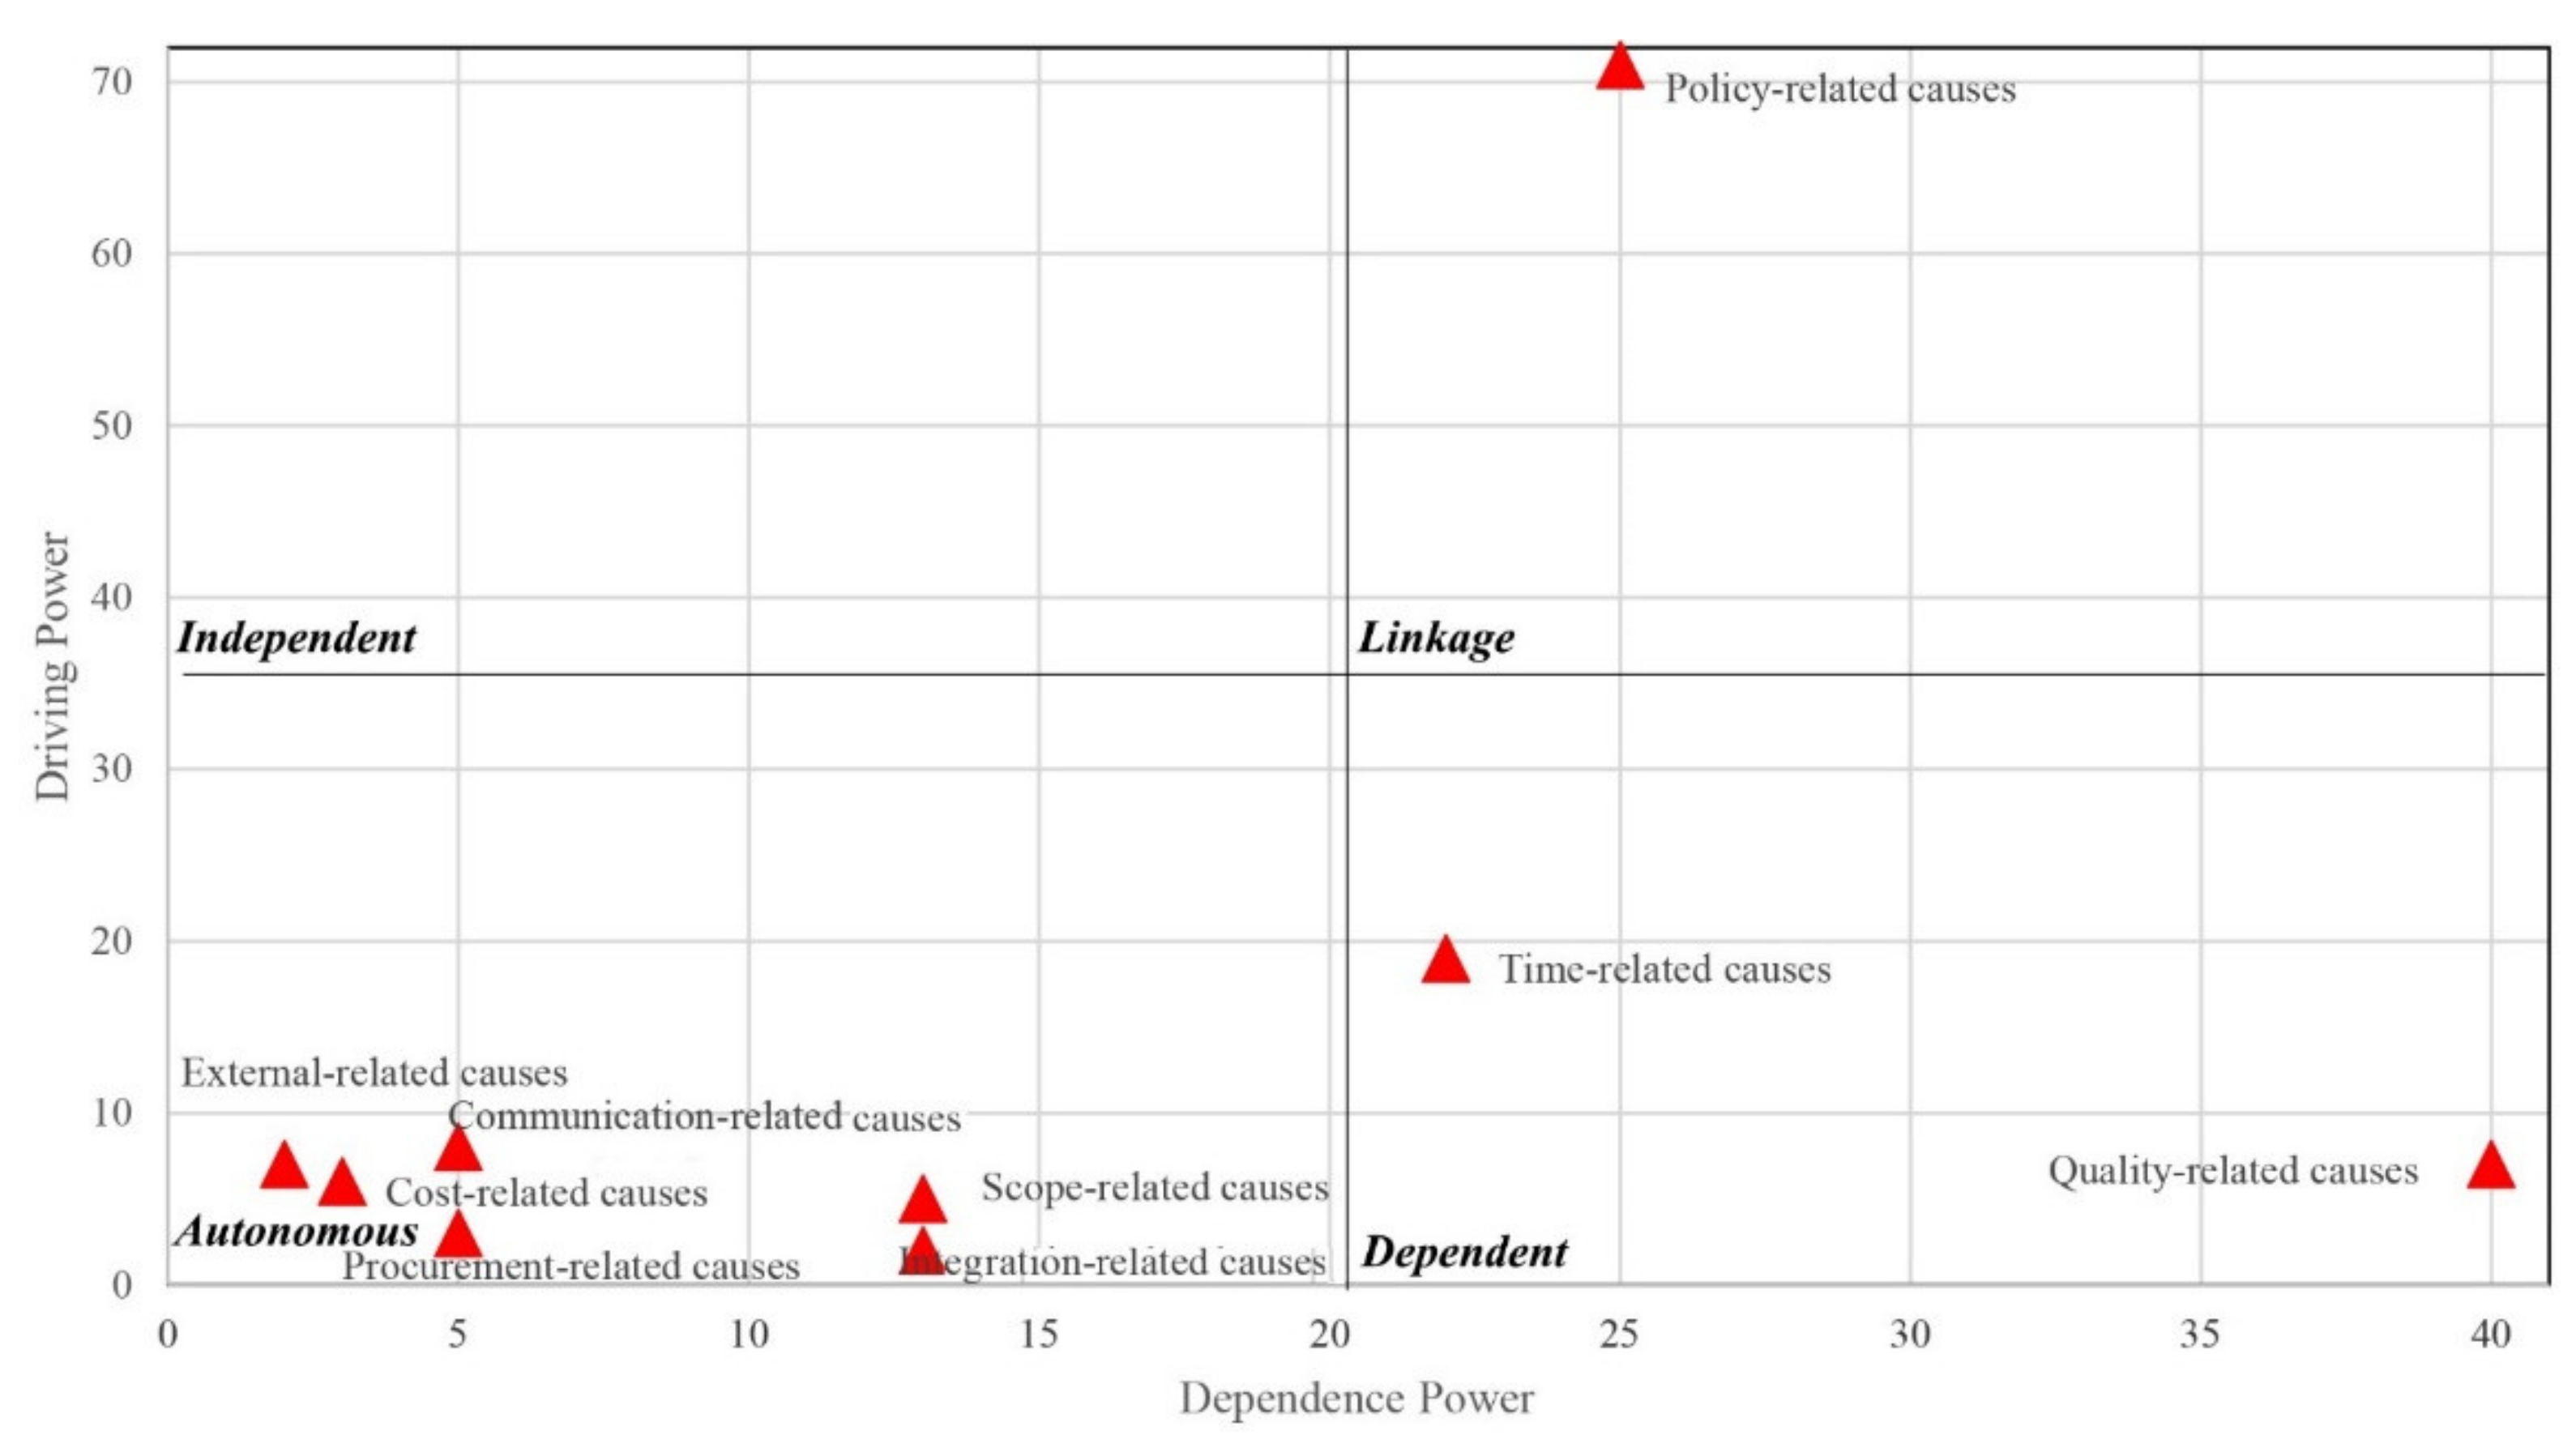
Figure 5.
Classification of causes in terms of stakeholders associated with them.
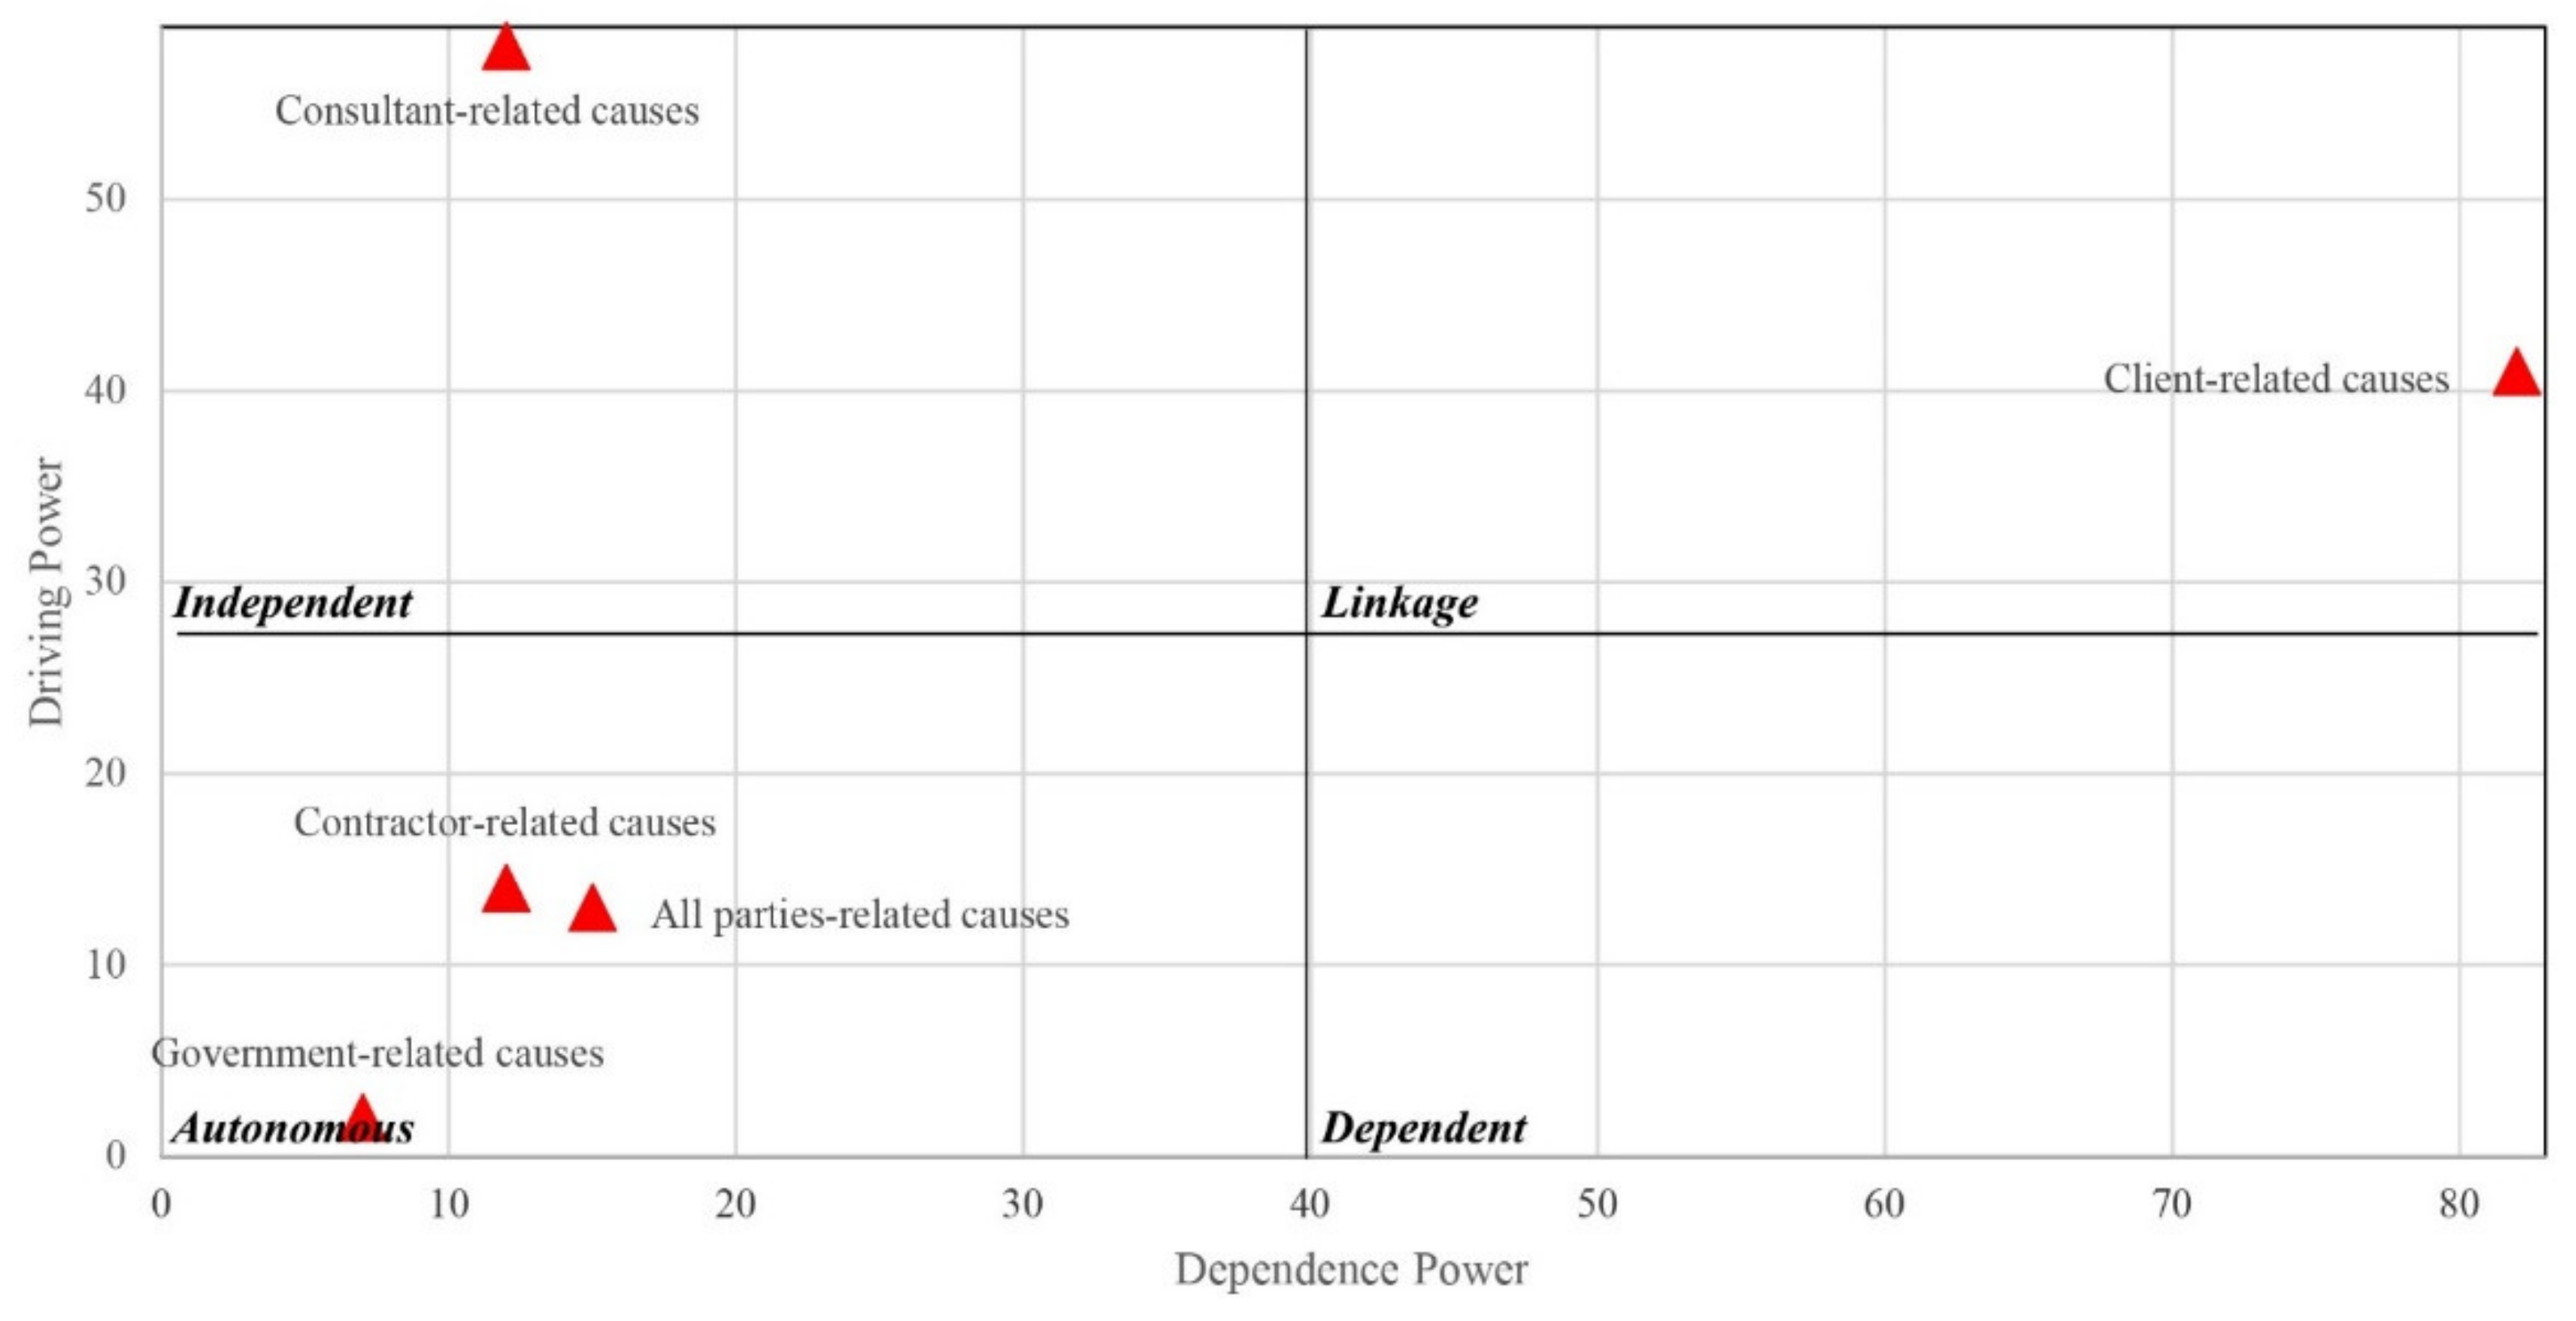
Figure 6.
Influencing causes and corresponding strategies.

Table 1.
Conceptual, experimental, and operational validation of the model.
| Validation | Description | Designed Questions | Mean Value of Experts’ Agreement | Final Value of Experts’ Agreement |
|---|---|---|---|---|
| Conceptual validity | It is concerned with the degree of relevance and accuracy of the scope, and level of detail underlying the conceptual model. | Is the conceptual model an accurate representation of the system under investigation? | 4.6 | 4.7 |
| Does the conceptual model contain all necessary details? | 4.8 | |||
| Experimental validity | It is concerned with the degree of efficiency and accuracy of obtained results. | Are the results of the research sufficiently accurate and efficient? | 4.4 | 4.45 |
| Are the results achieved from the analysis of the model in agreement with what has been witnessed during the project? | 4.6 | |||
| Are the immediate causes of design changes identified by the analysis, the most prevalent causes witnessed during the project? | 4.6 | |||
| Does managing the identified root causes of design changes result in mitigating the occurrence of design changes? | 4.2 | |||
| Operational validity | It is concerned with the quality and applicability of the proposed intervention strategies. | How do you evaluate the usefulness and applicability of the proposed strategies for managing and decreasing the occurrence of design changes in construction projects? | 4.4 | 4.4 |
| External validity | It is concerned with the generalizability of research findings to different settings. | Does the causal model contain critical factors that could lead to design changes in building construction projects within different settings? | 4.5 | 4.437 |
| Are the causal relationships found within this study generalizable to building construction projects in different settings? | 4.25 | |||
| Based on your experience, could the consideration of the proposed strategies be of benefit to tackling design changes in your own setting? | 4.375 | |||
| Are the findings of this study congruent with, connected to, or confirmatory of previous knowledge in this field? | 4.625 |
Table 2.
Causes of design changes.
| ID | Causes | Responsible Stakeholders | Management Area | Source |
|---|---|---|---|---|
| C01 | Clients’ attitude and experience | Client | Policy | [42] |
| C02 | Unrealistic client’s demands | Client | Policy | [27] |
| C03 | Contracting strategy | Client | Policy | [19] |
| C04 | Poorly written contract | Client | Scope | [25] |
| C05 | Financial issues | Client | Cost | [24] |
| C06 | Contractor qualification | Client | Policy | [27] |
| C07 | Change order | Client | Scope | [25] |
| C08 | Scope uncertainty | Client | Scope | [19] |
| C09 | Design reuse | Consultant | Quality | [42] |
| C10 | Unfamiliarity with new construction methods | Contractor | Quality | [19] |
| C11 | Poor communication and co-operation | All parties | Communication | [24] |
| C12 | Timeboxing | Consultant | Time | [42] |
| C13 | Consultant qualification | Client | Policy | [42] |
| C14 | Design errors | Consultant | Quality | [2] |
| C15 | Schedule variance | All parties | Time | [10] |
| C16 | Poor quality control and supervision | Consultant | Quality | [42] |
| C17 | Value engineering | Client | Policy | [4] |
| C18 | Change in specifications | Consultant | Integration | [10] |
| C19 | Unavailability of materials and equipment | Contractor | Procurement | [2] |
| C20 | Economic conditions | Government | External | [27] |
| C21 | Change in government regulations | Government | External | [24] |
| C22 | Constructability ignored in design process | Consultant | Quality | [4] |
| C23 | Inappropriate planning | Contractor | Time | [19] |
Table 3.
Initial reachability matrix.
| C1 | C2 | C3 | C4 | C5 | C6 | C7 | C8 | C9 | C10 | C11 | C12 | C13 | C14 | C15 | C16 | C17 | C18 | C19 | C20 | C21 | C22 | C23 | |
|---|---|---|---|---|---|---|---|---|---|---|---|---|---|---|---|---|---|---|---|---|---|---|---|
| C1 | 1 | 1 | 1 | 1 | 0 | 0 | 0 | 0 | 0 | 0 | 1 | 0 | 0 | 0 | 0 | 0 | 0 | 0 | 0 | 0 | 0 | 0 | 0 |
| C2 | 0 | 1 | 0 | 1 | 1 | 0 | 0 | 0 | 0 | 0 | 0 | 0 | 0 | 0 | 1 | 0 | 0 | 0 | 0 | 0 | 0 | 0 | 0 |
| C3 | 0 | 0 | 1 | 0 | 0 | 1 | 0 | 0 | 0 | 0 | 0 | 0 | 1 | 0 | 0 | 0 | 0 | 0 | 0 | 0 | 0 | 0 | 0 |
| C4 | 0 | 0 | 0 | 1 | 0 | 0 | 1 | 1 | 0 | 0 | 0 | 0 | 0 | 0 | 0 | 0 | 0 | 0 | 0 | 0 | 0 | 0 | 0 |
| C5 | 0 | 0 | 0 | 0 | 1 | 0 | 1 | 1 | 0 | 0 | 0 | 0 | 0 | 0 | 0 | 0 | 1 | 0 | 1 | 0 | 0 | 0 | 0 |
| C6 | 0 | 0 | 0 | 0 | 0 | 1 | 0 | 0 | 0 | 1 | 1 | 0 | 0 | 0 | 0 | 0 | 0 | 0 | 0 | 0 | 0 | 0 | 1 |
| C7 | 0 | 0 | 0 | 0 | 0 | 0 | 1 | 0 | 0 | 0 | 0 | 0 | 0 | 0 | 0 | 0 | 0 | 0 | 0 | 0 | 0 | 0 | 0 |
| C8 | 0 | 0 | 0 | 0 | 0 | 0 | 0 | 1 | 0 | 0 | 0 | 0 | 0 | 0 | 0 | 0 | 0 | 0 | 0 | 0 | 0 | 0 | 0 |
| C9 | 0 | 0 | 0 | 0 | 0 | 0 | 0 | 0 | 1 | 0 | 0 | 0 | 0 | 1 | 0 | 0 | 0 | 0 | 0 | 0 | 0 | 0 | 0 |
| C10 | 0 | 0 | 0 | 0 | 0 | 0 | 0 | 0 | 0 | 1 | 0 | 0 | 0 | 0 | 0 | 0 | 0 | 0 | 0 | 0 | 0 | 0 | 0 |
| C11 | 0 | 0 | 0 | 0 | 0 | 0 | 0 | 0 | 0 | 0 | 1 | 0 | 0 | 0 | 1 | 0 | 0 | 0 | 0 | 0 | 0 | 0 | 0 |
| C12 | 0 | 0 | 0 | 0 | 0 | 0 | 0 | 0 | 1 | 0 | 0 | 1 | 0 | 0 | 0 | 1 | 0 | 0 | 0 | 0 | 0 | 0 | 0 |
| C13 | 0 | 0 | 0 | 0 | 0 | 0 | 0 | 0 | 0 | 0 | 1 | 0 | 1 | 1 | 0 | 0 | 0 | 0 | 0 | 0 | 0 | 1 | 1 |
| C14 | 0 | 0 | 0 | 0 | 0 | 0 | 0 | 0 | 0 | 0 | 0 | 0 | 0 | 1 | 0 | 0 | 0 | 0 | 0 | 0 | 0 | 0 | 0 |
| C15 | 0 | 0 | 0 | 0 | 0 | 0 | 0 | 0 | 0 | 0 | 0 | 1 | 0 | 0 | 1 | 0 | 0 | 1 | 0 | 0 | 0 | 0 | 0 |
| C16 | 0 | 0 | 0 | 0 | 0 | 0 | 0 | 0 | 0 | 0 | 0 | 0 | 0 | 1 | 0 | 1 | 0 | 0 | 0 | 0 | 0 | 0 | 0 |
| C17 | 0 | 0 | 0 | 0 | 0 | 0 | 0 | 0 | 0 | 0 | 0 | 0 | 0 | 0 | 0 | 0 | 1 | 0 | 0 | 0 | 0 | 0 | 0 |
| C18 | 0 | 0 | 0 | 0 | 0 | 0 | 0 | 0 | 0 | 0 | 0 | 0 | 0 | 0 | 0 | 0 | 1 | 1 | 0 | 0 | 0 | 0 | 0 |
| C19 | 0 | 0 | 0 | 0 | 0 | 0 | 0 | 0 | 0 | 0 | 0 | 0 | 0 | 0 | 0 | 0 | 0 | 1 | 1 | 0 | 0 | 0 | 0 |
| C20 | 0 | 0 | 0 | 0 | 0 | 0 | 0 | 0 | 0 | 0 | 0 | 0 | 0 | 0 | 0 | 0 | 0 | 0 | 1 | 1 | 0 | 0 | 0 |
| C21 | 0 | 0 | 0 | 0 | 0 | 0 | 0 | 0 | 0 | 0 | 0 | 0 | 0 | 0 | 0 | 0 | 0 | 1 | 0 | 0 | 1 | 0 | 0 |
| C22 | 0 | 0 | 0 | 0 | 0 | 0 | 0 | 0 | 0 | 0 | 0 | 0 | 0 | 0 | 0 | 0 | 0 | 0 | 0 | 0 | 0 | 1 | 0 |
| C23 | 0 | 0 | 0 | 0 | 0 | 0 | 0 | 0 | 0 | 0 | 0 | 0 | 0 | 0 | 1 | 0 | 0 | 0 | 0 | 0 | 0 | 0 | 1 |
Table 4.
Final reachability matrix.
| C1 | C2 | C3 | C4 | C5 | C6 | C7 | C8 | C9 | C10 | C11 | C12 | C13 | C14 | C15 | C16 | C17 | C18 | C19 | C20 | C21 | C22 | C23 | DrP | |
|---|---|---|---|---|---|---|---|---|---|---|---|---|---|---|---|---|---|---|---|---|---|---|---|---|
| C1 | 1 | 1 | 1 | 1 | 1 * | 1 * | 1 * | 1 * | 1 * | 1 * | 1 | 1 * | 1 * | 1 * | 1 * | 1 * | 1 * | 1 * | 1 * | 0 | 0 | 1 * | 1 * | 21 |
| C2 | 0 | 1 | 0 | 1 | 1 | 0 | 1 * | 1 * | 1 * | 0 | 0 | 1 * | 0 | 1 * | 1 * | 1 * | 1 * | 1 * | 1 * | 0 | 0 | 0 | 0 | 13 |
| C3 | 0 | 0 | 1 | 0 | 0 | 1 | 0 | 0 | 1 * | 1 * | 1 * | 1 * | 1 | 1 * | 1 * | 1 * | 1 * | 1 * | 0 | 0 | 0 | 1 * | 1 * | 14 |
| C4 | 0 | 0 | 0 | 1 | 0 | 0 | 1 | 1 | 0 | 0 | 0 | 0 | 0 | 0 | 0 | 0 | 0 | 0 | 0 | 0 | 0 | 0 | 0 | 3 |
| C5 | 0 | 0 | 0 | 0 | 1 | 0 | 1 | 1 | 0 | 0 | 0 | 0 | 0 | 0 | 0 | 0 | 1 | 1 * | 1 | 0 | 0 | 0 | 0 | 6 |
| C6 | 0 | 0 | 0 | 0 | 0 | 1 | 0 | 0 | 1 * | 1 | 1 | 1 * | 0 | 1 * | 1 * | 1 | 1 * | 1 * | 0 | 0 | 0 | 0 | 1 | 11 |
| C7 | 0 | 0 | 0 | 0 | 0 | 0 | 1 | 0 | 0 | 0 | 0 | 0 | 0 | 0 | 0 | 0 | 0 | 0 | 0 | 0 | 0 | 0 | 0 | 1 |
| C8 | 0 | 0 | 0 | 0 | 0 | 0 | 0 | 1 | 0 | 0 | 0 | 0 | 0 | 0 | 0 | 0 | 0 | 0 | 0 | 0 | 0 | 0 | 0 | 1 |
| C9 | 0 | 0 | 0 | 0 | 0 | 0 | 0 | 0 | 1 | 0 | 0 | 0 | 0 | 1 | 0 | 0 | 0 | 0 | 0 | 0 | 0 | 0 | 0 | 2 |
| C10 | 0 | 0 | 0 | 0 | 0 | 0 | 0 | 0 | 0 | 1 | 0 | 0 | 0 | 0 | 0 | 0 | 0 | 0 | 0 | 0 | 0 | 0 | 0 | 1 |
| C11 | 0 | 0 | 0 | 0 | 0 | 0 | 0 | 0 | 1 * | 0 | 1 | 1 * | 0 | 1 * | 1 | 1 * | 1 * | 1 * | 0 | 0 | 0 | 0 | 0 | 8 |
| C12 | 0 | 0 | 0 | 0 | 0 | 0 | 0 | 0 | 1 | 0 | 0 | 1 | 0 | 1 * | 0 | 1 | 0 | 0 | 0 | 0 | 0 | 0 | 0 | 4 |
| C13 | 0 | 0 | 0 | 0 | 0 | 0 | 0 | 0 | 1 * | 0 | 1 | 1 * | 1 | 1 | 1 * | 1 * | 1 * | 1 * | 0 | 0 | 0 | 1 | 1 | 11 |
| C14 | 0 | 0 | 0 | 0 | 0 | 0 | 0 | 0 | 0 | 0 | 0 | 0 | 0 | 1 | 0 | 0 | 0 | 0 | 0 | 0 | 0 | 0 | 0 | 1 |
| C15 | 0 | 0 | 0 | 0 | 0 | 0 | 0 | 0 | 1 * | 0 | 0 | 1 | 0 | 1 * | 1 | 1 * | 1 * | 1 | 0 | 0 | 0 | 0 | 0 | 7 |
| C16 | 0 | 0 | 0 | 0 | 0 | 0 | 0 | 0 | 0 | 0 | 0 | 0 | 0 | 1 | 0 | 1 | 0 | 0 | 0 | 0 | 0 | 0 | 0 | 2 |
| C17 | 0 | 0 | 0 | 0 | 0 | 0 | 0 | 0 | 0 | 0 | 0 | 0 | 0 | 0 | 0 | 0 | 1 | 0 | 0 | 0 | 0 | 0 | 0 | 1 |
| C18 | 0 | 0 | 0 | 0 | 0 | 0 | 0 | 0 | 0 | 0 | 0 | 0 | 0 | 0 | 0 | 0 | 1 | 1 | 0 | 0 | 0 | 0 | 0 | 2 |
| C19 | 0 | 0 | 0 | 0 | 0 | 0 | 0 | 0 | 0 | 0 | 0 | 0 | 0 | 0 | 0 | 0 | 1 * | 1 | 1 | 0 | 0 | 0 | 0 | 3 |
| C20 | 0 | 0 | 0 | 0 | 0 | 0 | 0 | 0 | 0 | 0 | 0 | 0 | 0 | 0 | 0 | 0 | 1 * | 1 * | 1 | 1 | 0 | 0 | 0 | 4 |
| C21 | 0 | 0 | 0 | 0 | 0 | 0 | 0 | 0 | 0 | 0 | 0 | 0 | 0 | 0 | 0 | 0 | 1 * | 1 | 0 | 0 | 1 | 0 | 0 | 3 |
| C22 | 0 | 0 | 0 | 0 | 0 | 0 | 0 | 0 | 0 | 0 | 0 | 0 | 0 | 0 | 0 | 0 | 0 | 0 | 0 | 0 | 0 | 1 | 0 | 1 |
| C23 | 0 | 0 | 0 | 0 | 0 | 0 | 0 | 0 | 1 * | 0 | 0 | 1 * | 0 | 1 * | 1 | 1 * | 1 * | 1 * | 0 | 0 | 0 | 0 | 1 | 8 |
| DeP | 1 | 2 | 2 | 3 | 3 | 3 | 5 | 5 | 10 | 4 | 5 | 9 | 3 | 12 | 8 | 10 | 14 | 13 | 5 | 1 | 1 | 4 | 5 | _ |
Notes: * Transitivity; DrP—Driving Power; DeP—Dependence Power.
Publisher’s Note: MDPI stays neutral with regard to jurisdictional claims in published maps and institutional affiliations. |
© 2021 by the authors. Licensee MDPI, Basel, Switzerland. This article is an open access article distributed under the terms and conditions of the Creative Commons Attribution (CC BY) license (https://creativecommons.org/licenses/by/4.0/).
Share and Cite
MDPI and ACS Style
Shoar, S.; Chileshe, N. Exploring the Causes of Design Changes in Building Construction Projects: An Interpretive Structural Modeling Approach. Sustainability 2021, 13, 9578. https://doi.org/10.3390/su13179578
AMA Style
Shoar S, Chileshe N. Exploring the Causes of Design Changes in Building Construction Projects: An Interpretive Structural Modeling Approach. Sustainability. 2021; 13(17):9578. https://doi.org/10.3390/su13179578
Chicago/Turabian StyleShoar, Shahab, and Nicholas Chileshe. 2021. "Exploring the Causes of Design Changes in Building Construction Projects: An Interpretive Structural Modeling Approach" Sustainability 13, no. 17: 9578. https://doi.org/10.3390/su13179578
Note that from the first issue of 2016, this journal uses article numbers instead of page numbers. See further details here.