Article

Current Status and Recent Stand Structure Dynamics in Mixed Silver Fir—European Beech Forests in Croatian Dinarides: Are There Differences between Managed and Unmanaged Forests?

Department of Forest Inventory and Management, Faculty of Forestry and Wood Technology, University of Zagreb, 10000 Zagreb, Croatia
*
Author to whom correspondence should be addressed.
Sustainability 2021, 13(16), 9179; https://doi.org/10.3390/su13169179
Submission received: 14 June 2021 / Revised: 23 July 2021 / Accepted: 11 August 2021 / Published: 16 August 2021
(This article belongs to the Special Issue Close to Nature Forestry – Hope for the European Green Deal)

Abstract

:
The environmental, social and economic potential of Dinaric uneven-aged forests along with the complex stand dynamics influenced by different long-term management approaches and environmental factors require comprehensive forest monitoring. This study aimed to explore differences in the current status and recent past dynamics of stand structures between unmanaged and managed mixed fir-beech forests in the Croatian part of the Dinaric Alps using large-scale data from an established monitoring system. From the 74 permanent sample plots distributed within the forest type measured in 2008 and re-measured in 2019, we stratified four strata (types of management regimes): (1) forests out of regular management and tree harvest for at least 30 years, (2) managed state forests on carbonate bedrock, (3) managed state forests on non-carbonate bedrock and (4) managed private forests. In each sample plot, 34 structural attributes were computed to assess indicators of their current status and recent past dynamics of stands in the studied forests. An increasing Q shape diameter distribution with a high number of large and very large trees characterize unmanaged forests and managed forests on non-carbonate bedrock. In managed state forests and private forests, variable (rotated sigmoid) and constant (negative exponential) results were obtained, respectively. Principal component analysis (PCA) distinguished managed and unmanaged forests with decreasing harvest volume and recruitment, increasing basal area, number of very large trees, average diameter at breast height (DBH), crown defoliation of firs and basal area of died beech trees. The current structure, recent and expected stand dynamics in the unmanaged forests (accumulation of standing volume, increase of large diameter trees and large snags, large share of beech, large mean DBH) can be recognized as old-growth attributes. The differences between the studied forest types, potential of both unmanaged and state managed fir-beech forests and approaches to sustain multifunctional forest management in the Dinaric region were discussed.

1. Introduction

Silver fir (hereafter fir) forests are predominantly distributed in Central Europe from where they spread down to the southeast [1]. Of the total roughly 2 million hectares of forests, mixed uneven-aged silver fir (Abies alba Mill.)—European beech (Fagus sylvatica L.) (hereafter fir-beech) forests are the most important forest type in Dinarides [2]. Given the overall fir distribution and its frequency in the mixture (the share in the forest ecosystem) [1] along with the Pyrenean area [3,4] and Apennines [5], the Dinaric area represents a distinct southeastern edge of distribution. Within the southeastern border areal in the Croatian Dinaric region, besides sites favorable for fir, there are also localities at the micro borders (edges) of its appearance.
Historically, the use of forests in Europe until the beginning of the 19th century was unplanned and extensive. Moreover, it was characterized by individual logging, often aiming at high quality trees with a large diameter, similar to unregulated uneven-aged management. In the mid-19th century, uneven-aged forest management occurred in the Dinaric region [6]. Reasons for the introduction of uneven-aged management in primeval old-growth forests are still unknown since, at that time, the clear-cut prevailed in the rest of Europe [2]. It can be assumed that the driver for the establishment of uneven-aged management was the specific structure of fir-beech forests due to their high variability in soil depth and rockiness, resulting in a seemingly uneven-aged stand structure.
Over the last 100+ years, management in Dinaric fir-beech forest has gone through several changes, from single tree and small group selection to “freestyle forest management“ [2]. Even and uneven-aged management has its advantages and disadvantages. However, the general trend of European forestry and worldwide forestry is to emphasize the advantages of forest management that is close to nature [7,8,9,10]. Thus, in the middle of the 20th century, uneven-aged management in the Dinaric region prevailed, clear-cutting was forbidden, grazing harvest was limited and reduced [2]. At present, more than a third (33.4%) of Dinaric forests is managed by an uneven-aged approach. Furthermore, in Croatia, the use of uneven-aged management in all fir forests (about 30%) is obligatory by forest policy regulations.
Due to different circumstances, uneven-aged management was not consistently performed or did not yield satisfactory results [2,11]. Some of the causes were fir dieback affected by air pollution and SO2 emissions [12], absence of natural regeneration [11], herbivorous influence on young fir trees, constant increase of beech abundance, the impact of different ownerships and consequent management approaches and various degrees of nature protection (absence of management). Consequently, fir-beech forests with dissimilar structures occurred. This was mostly due to different interpretations of uneven-aged management and environmental impacts. Recent research of Dinaric forests in southeastern Europe has revealed the existence of pronounced dynamics in stand structure and composition, both in uneven-aged and old-growth forests, with the particular stand dynamics influenced by the habitat conditions [13]. Numerous studies have acknowledged that changes in fir stand dynamics and structure are reflected by the increased proportion of large mature trees, difficulties with regeneration and fir decline. This was recorded in Croatia [11], Bosnia and Herzegovina [14], Slovenia [15,16] and other Central European countries. Therefore, in the Dinaric region, similarly to Central Europe, uneven-aged fir-beech forests are characterized by the large and accumulated growing stock of approximately 350 m3 ha−1 [2], this being favorable for fir as a shade-tolerant species [17].
Changes in fir forest ecosystems and stand dynamics can be related to the concept of forest decline, which was introduced in the early 80s of the last century in Central Europe [18]. Polluted air, especially SO2 emissions [12,16,19,20] in interaction with climate change (rise in temperature and drought) and biotic factors [3,20,21,22,23,24,25] are considered to be the major causes of fir decline (reduction of vitality, increase of susceptibility and mortality rate) and growth decrease.
Due to recent changes and growing needs for the maintenance of forest resources, interest in and acknowledgement of importance of long-term monitoring in Europe has increased. However, until now, there has been no systematic monitoring and comprehensive research within the entire region of fir forest in Croatia. Previous studies were mostly oriented to individual and isolated research in the context of adverse environment [12,26] and management [11] influences. Hence, the first national forest inventory (hereafter NFI) in Croatia, conducted from 2006 to 2009 [27], was the main basis for the establishment and conduction of the entire monitoring system for fir forests in the Croatian Dinaric region. This comprehensive approach consists of a repeated inventory on 74 permanent sample plots, detailed monitoring of climatic and environmental factors and tree growth on the base plots carried out in 2019. Thus, through long-term monitoring, the influence of climatic and environmental factors and management regimes can be obtained for the study of stability enhancement of stand structures, maintenance and how to increase their adaptive ability to environmental changes.
The importance of primary (old-growth) forests for biodiversity maintenance and climate change mitigation has been enhanced with many recent studies [28,29,30,31]. Networks of such forest reserves under varying protection regimes provide the main requirements for the fulfillment of habitat and nature protection (i.e., Natura 2000 sites) within the concept of sustainable and multifunctional forest ecosystem management. The obtained stand structure dynamics in long-term studies of old-growth forests [32] could be useful for the emulation of natural processes in sustainable forest management [33]. In the Croatian Dinaric region, there are no fir and beech forests that have been out of forest management activities for a long past period (more than 80 years), except for one or two small isolated primary forest patches. Furthermore, the larger part of the forest region, including nature parks, has been under the implementation of Natura 2000 requirements [34,35] and forest management restrictions only for the last decade. However, the area of about 30,000 ha of forest within two national parks has been out of any management activities during the last three decades. Hence, we believe that these forests could be appropriate for studying initial natural processes and stand structures that are closer to the old-growth forest structure, and that they would differ from managed forests. Besides unmanaged forests within the national parks, three types of managed forests in the region can be distinguished by site characteristics, management systems and ownership category.
The aim of this study was to compare current stand structure characteristics, past dynamics and stand stability of unmanaged forests within national parks (UM-NPF) and managed forests (state forests on carbonate bedrock (M-S1F), state forests on non-carbonate bedrock (M-S2F) and private forests (M-PF)). We hypothesized that (1) stand structure characterized by high basal area, a large share of beech, a large number of large live trees and snags and large mean DBH in unmanaged forests would be recognized as old-growth attributes; (2) current stand structure characteristics and recent past dynamics of stand structures would differ between unmanaged and managed forests and also between different types of managed forest.

2. Materials and Methods
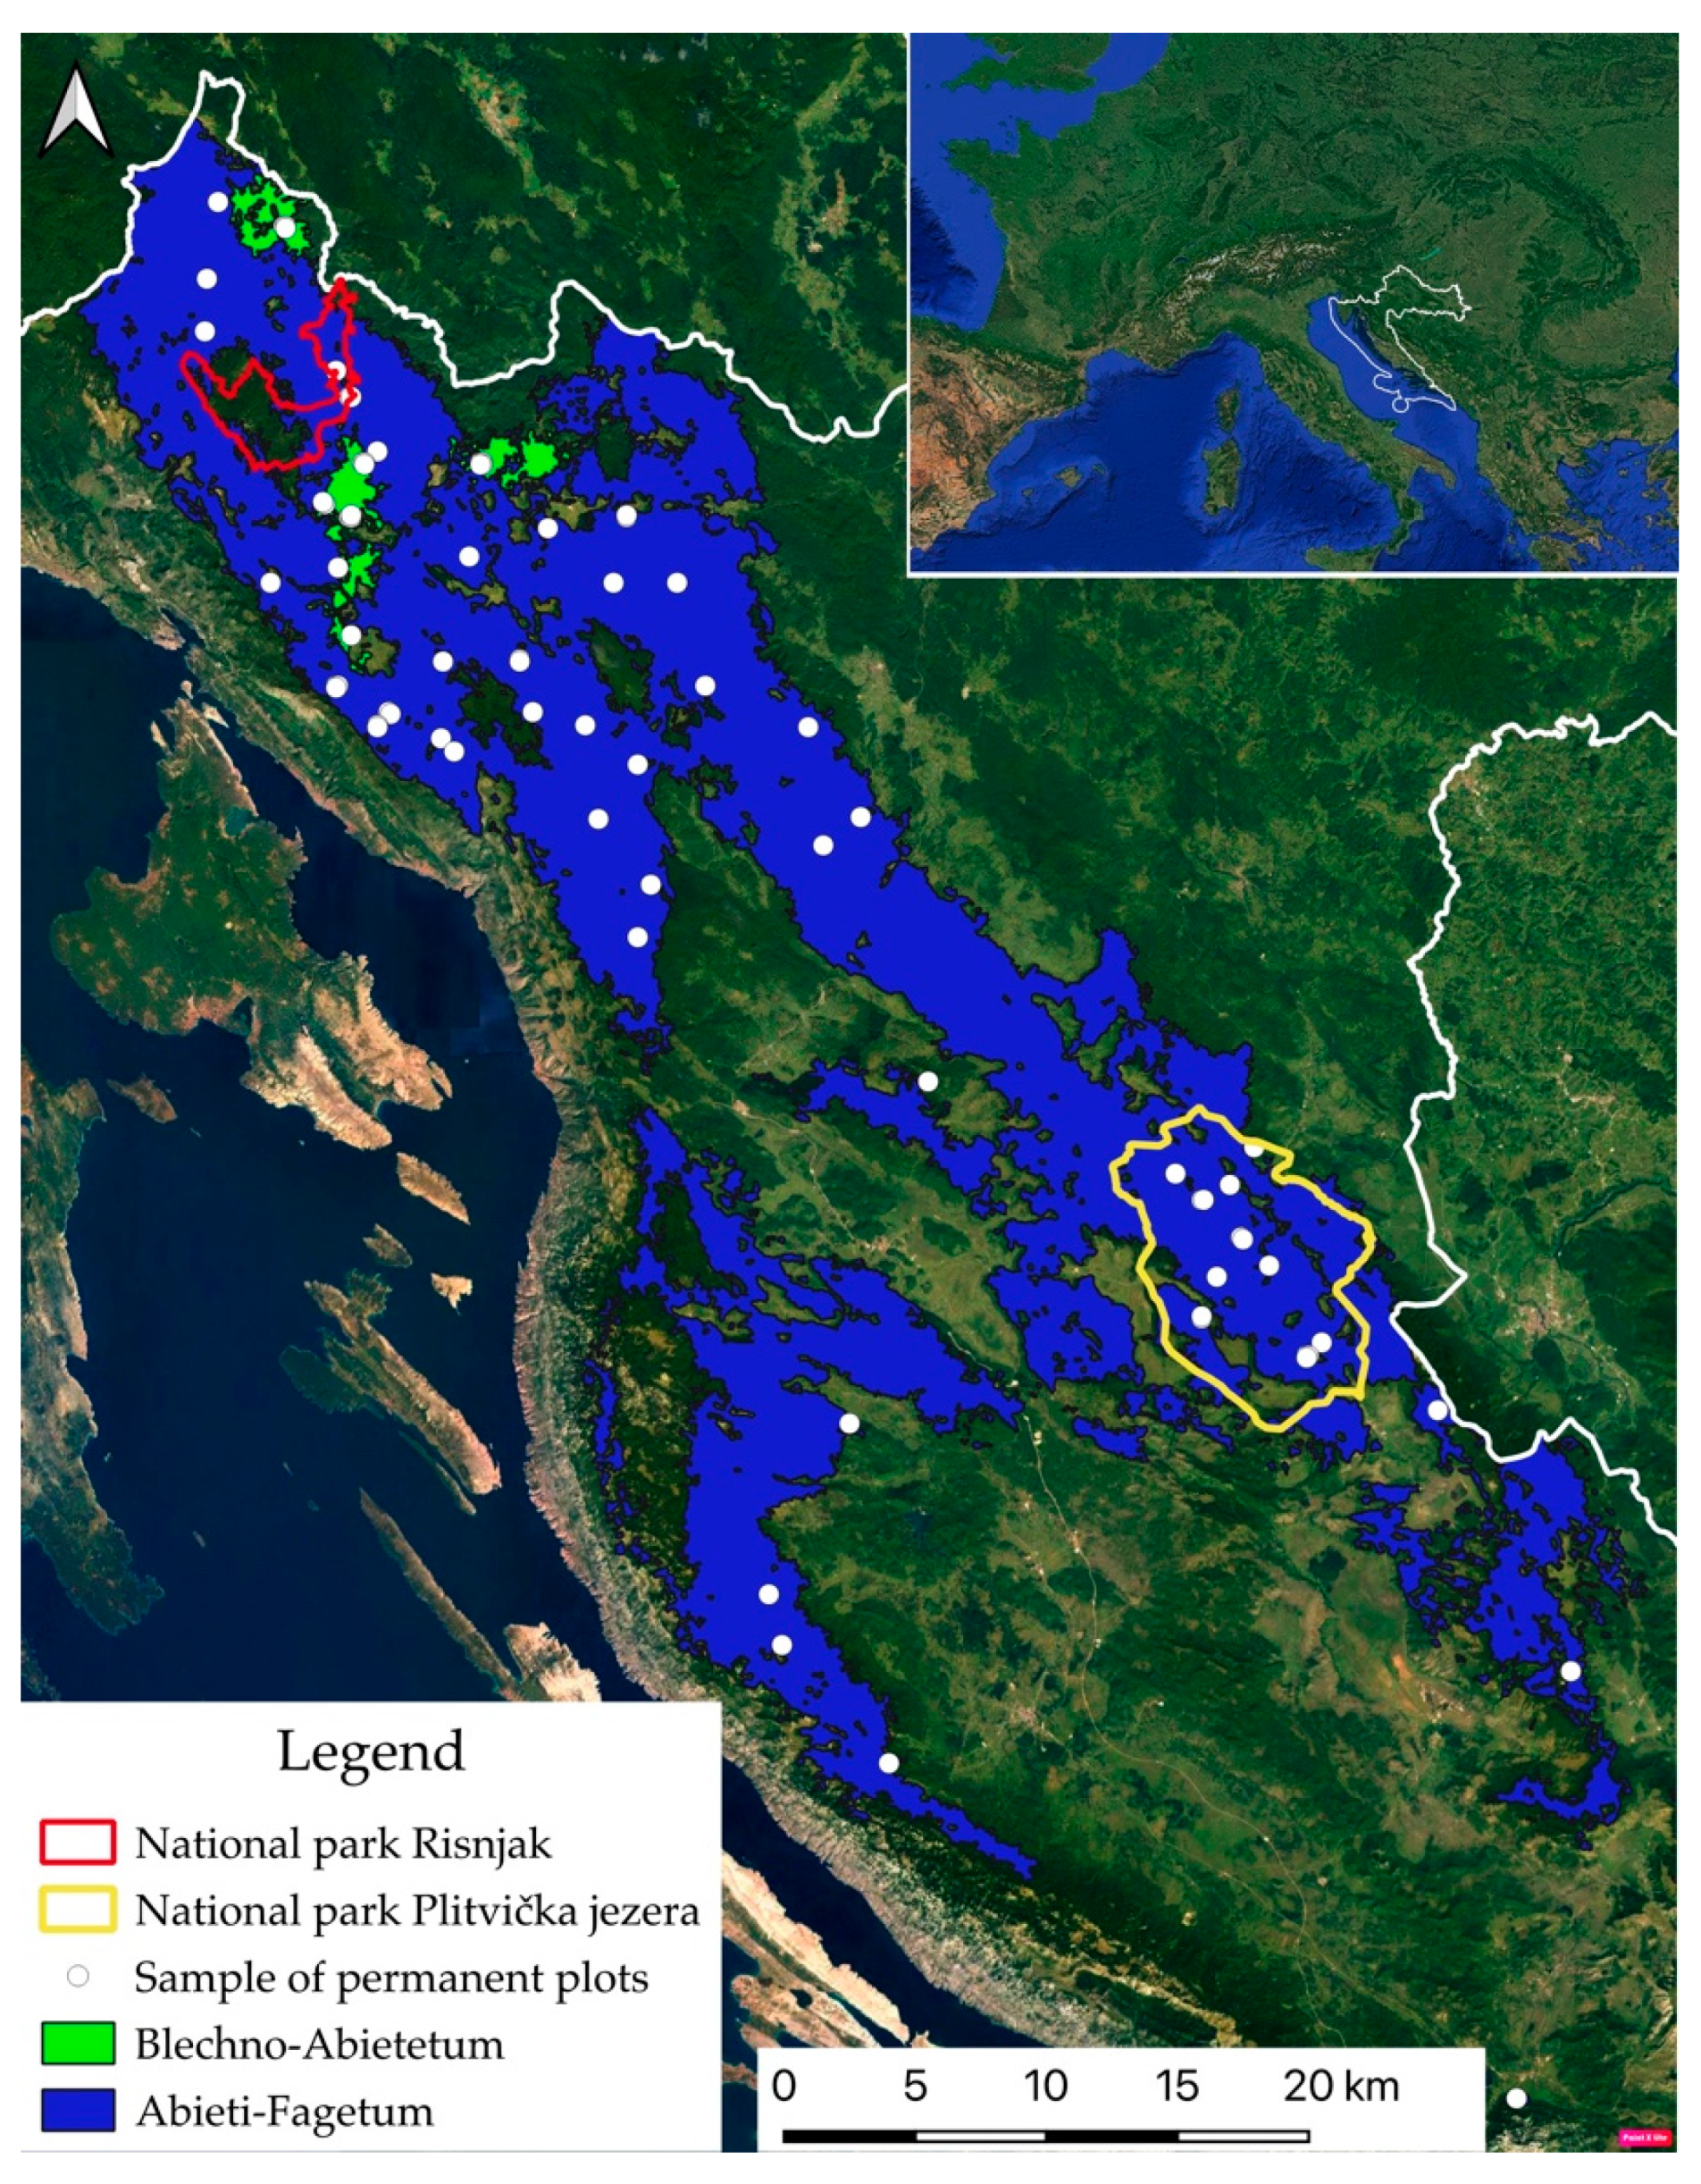
2.1. Study Area

The study was carried out in the entire range of fir-beech forests within the Croatian part of Dinaric Alps (Figure 1). These forests encompass 304,000 ha of forest area [27] including the dominant forest community classified as Abieti-Fagetum and Blechno-Abietetum with a share of 96.4% and 3.6% respectively where beech, fir and Norway spruce (Picea abies (L.) Karst) are dominant species. Altitudinal vegetation belt ranges between 600 and 1,100 m above sea level. Limestone–dolomite substrates with basic soils (cambisols and leptosols) prevail, while silicate bedrock with dystric cambisols and podzols are less represented (Table 1). Region climate is characterized by relatively low average annual temperature (6–10 °C), high humidity (>80%) and high annual precipitation (1500–2500 mm). The amount of precipitation gradually decreases from the north west to the south east part of the region, while the average annual temperature increases [12]. In the region, small-scale private forests account for 4.6% of the total forest area, while 95.4% are state forests including managed forests and different forest categories of nature protection under restricted management (nature parks) or without any forest management activities (strict reserves, national parks). The two national parks (Plitvce Lakes and Risnjak) encompass 9% of state forests that have been out of management for the last three decades. Due to variety of site and stand characteristics and past management approaches, the area is characterized by single-group selection management system (60%), and different even-aged and irregular (transitional) forest stand structures (40%) [27]. Selection management in fir-beech stands is characterized by single stem (heavy sites, high rate of rockiness and large slopes) and small group felling (diameter of canopy gaps between one and two canopy heights) in more favorable site conditions and silicate bedrock and with 10-years cycles of an average cutting intensity of 21% or 76.5 m3 of cut volume per ha [27].

2.2. Sampling Design

Sample plots from the NFI, established and inventoried in 2006 and 2007 (725 plots or 11.6% of overall NFI plots within the entire Dinaric forests), were used for the sampling design (Table 1). Within each of the previously defined strata (type of management regime), sample plots were randomly selected from the set of NFI plots. A minimum of 15 plots by defined forest strata and share of fir growing volume at least 30% were main requirements of the plot selection. Still, due to the insufficient number of sample plots where fir is represented at all, only 5 plots were selected in private forests (Table 1).
On 74 selected sample plots, re-measurement (second inventory) was carried out in 2019 using approaches similar to the first inventory. The four concentric plots were used to assess tree-specific variables. We recorded all standing trees (living and dead) that exceeded a pre-established diameter at a breast height (DBH) threshold in each circle: 5 cm for the 3.5 m radius circle, 10 cm for the 7 m radius circle, 30 cm for 13 m radius circle and 50 cm for the 20 m radius circle. The following tree-specific variables were measured and assessed: tree species, tree position (azimuth, horizontal distance and inclination), DBH, tree height (only in the first inventory), height up to the crown base and two crown diameters of firs (only in the second inventory), tree canopy layer, stem quality, bole damage, crown damage, crown defoliation and the “stump age” of a cut tree. Furthermore, to estimate the consistent growing volumes between the two inventories (mortality, increment, recruitment and cut), the following sampling categories were assessed for each tree in the second inventory: survivor tree, on-growth tree, ingrowth tree, died tree, cut tree and wrong tree sampling (included, excluded) in the first inventory. The circle plot radius of 13 m was used to assess lying dead wood according to the number of stems, diameter classes, degree of decomposition and tree species (conifers, broadleaved). The two small concentric circle plots (radii of 1 and 2 m) within the 13 m radius circle plot were used to assess seedling and sapling density. The large circular plot radius of 25 m was used for the assessment of management-specific, site-specific and stand-specific variables. More detailed information on the field sampling can be found in [27].

2.3. Data Analysis

Calculation of quantitative stand structure characteristics on the sample plot level (tree, basal area and growing volume distribution by tree species and diameter classes) were based on per hectare values for the stem number, represented by each sampled tree. Each sampled tree was defined with its tree species, DBH, tree sampling category (survival, on-growth, ingrowth, died, cut) and corresponding circle plot and on summing per hectare values of all sampled trees according to the equation:
N S = cp = 1 d ts = 1 i DBH = 1 n ( 1 DBH _ ts A cp × 10 , 000 )
where NS is the number of trees per hectare on concentric circle sample plot level; 1DBH_ts is the individual sampled tree of belonging DBH, tree species, sampling category, and circle plot; Acp is the area in m2 of corresponding circle plot; DBH is the diameter at breast height of sampled trees within tree species and circle plot; n is the number of sampled trees; ts is tree species; cp is circle plot (4 plots radii of 3.5, 7, 13 and 20 m).
The volume of each sampled tree (vDBH) was calculated using measured (modeled) tree height and appropriate national volume models specific to tree species according to the equation:
v DBH   = ( α   ×   DBH β   ×   h st γ   )   ×   c
where α, β and γ are model parameters, c is model correction factor; DBH is the diameter at breast height of sampled tree measured in first/second inventory and hst is the height of the sampled tree (for the second inventory, modeled tree height was based on a data set of measured DBH and heights from the first inventory: h st = b 0   ×   e b 1 DBH + 1.3 , where b0 and b1 are model parameters).
The obtained data from the 2019 inventory year were compiled and averaged from sample plot level and represented in table and figure forms to visualize and compare current structural characteristics of unmanaged and managed forests. Statistical differences between the studied forests in terms of current characteristics (variables) and stand structure dynamics were assessed with Mann-Whitney U tests. Diameter distributions for total and fir tree numbers were obtained as average values of 5 cm DBH class midpoints and presented with logarithmic scale (base 10). The shapes of the DBH distributions were analyzed and described following the methodology presented in Leak [36]. Stand structure was evaluated with the estimation of closeness of the diameter distributions for total tree number to the inverse J-shaped distribution. The LikeJ index was estimated according to [37]. Stand density index (SDI) was calculated by the summation method for the uneven-aged stands [38] using the equation:
SDI = nt ( DBH i 25 ) 1.6
where DBHi is the middle of the ith diameter class and nti is the number of trees per hectare in the ith diameter class.
Annual mortality rate (m) was calculated by the equation
m = 100   ×   [ 1     ( N t N 0 ) 1 t ]
where N0 is the number of living trees at the beginning of the inventory interval; Nt is the number of living trees at the end of the inventory interval (the number of tree increased with the number of living trees felled during the interval) and t is the inventory interval.
Components of stand dynamics between the two inventories at the sample plot level (growing volume, standing dead volume, mortality, increment, recruitment, cut and net changes) were estimated using procedures according to [39].
In total, 34 site-specific and stand-specific attributes were computed in each sample plot (2019 inventory). The attributes for management regime types were statistically compared using nonparametric Mann-Whitney U tests. The analysis was performed in Statistica 13.5 software.
In order to identify possible key gradients of structural variation between unmanaged forests in national parks and managed forests, a principal component analysis (PCA) for site, stand and management specific attributes was carried out. PCA was performed using the function PRCOMP in R software [40].

3. Results

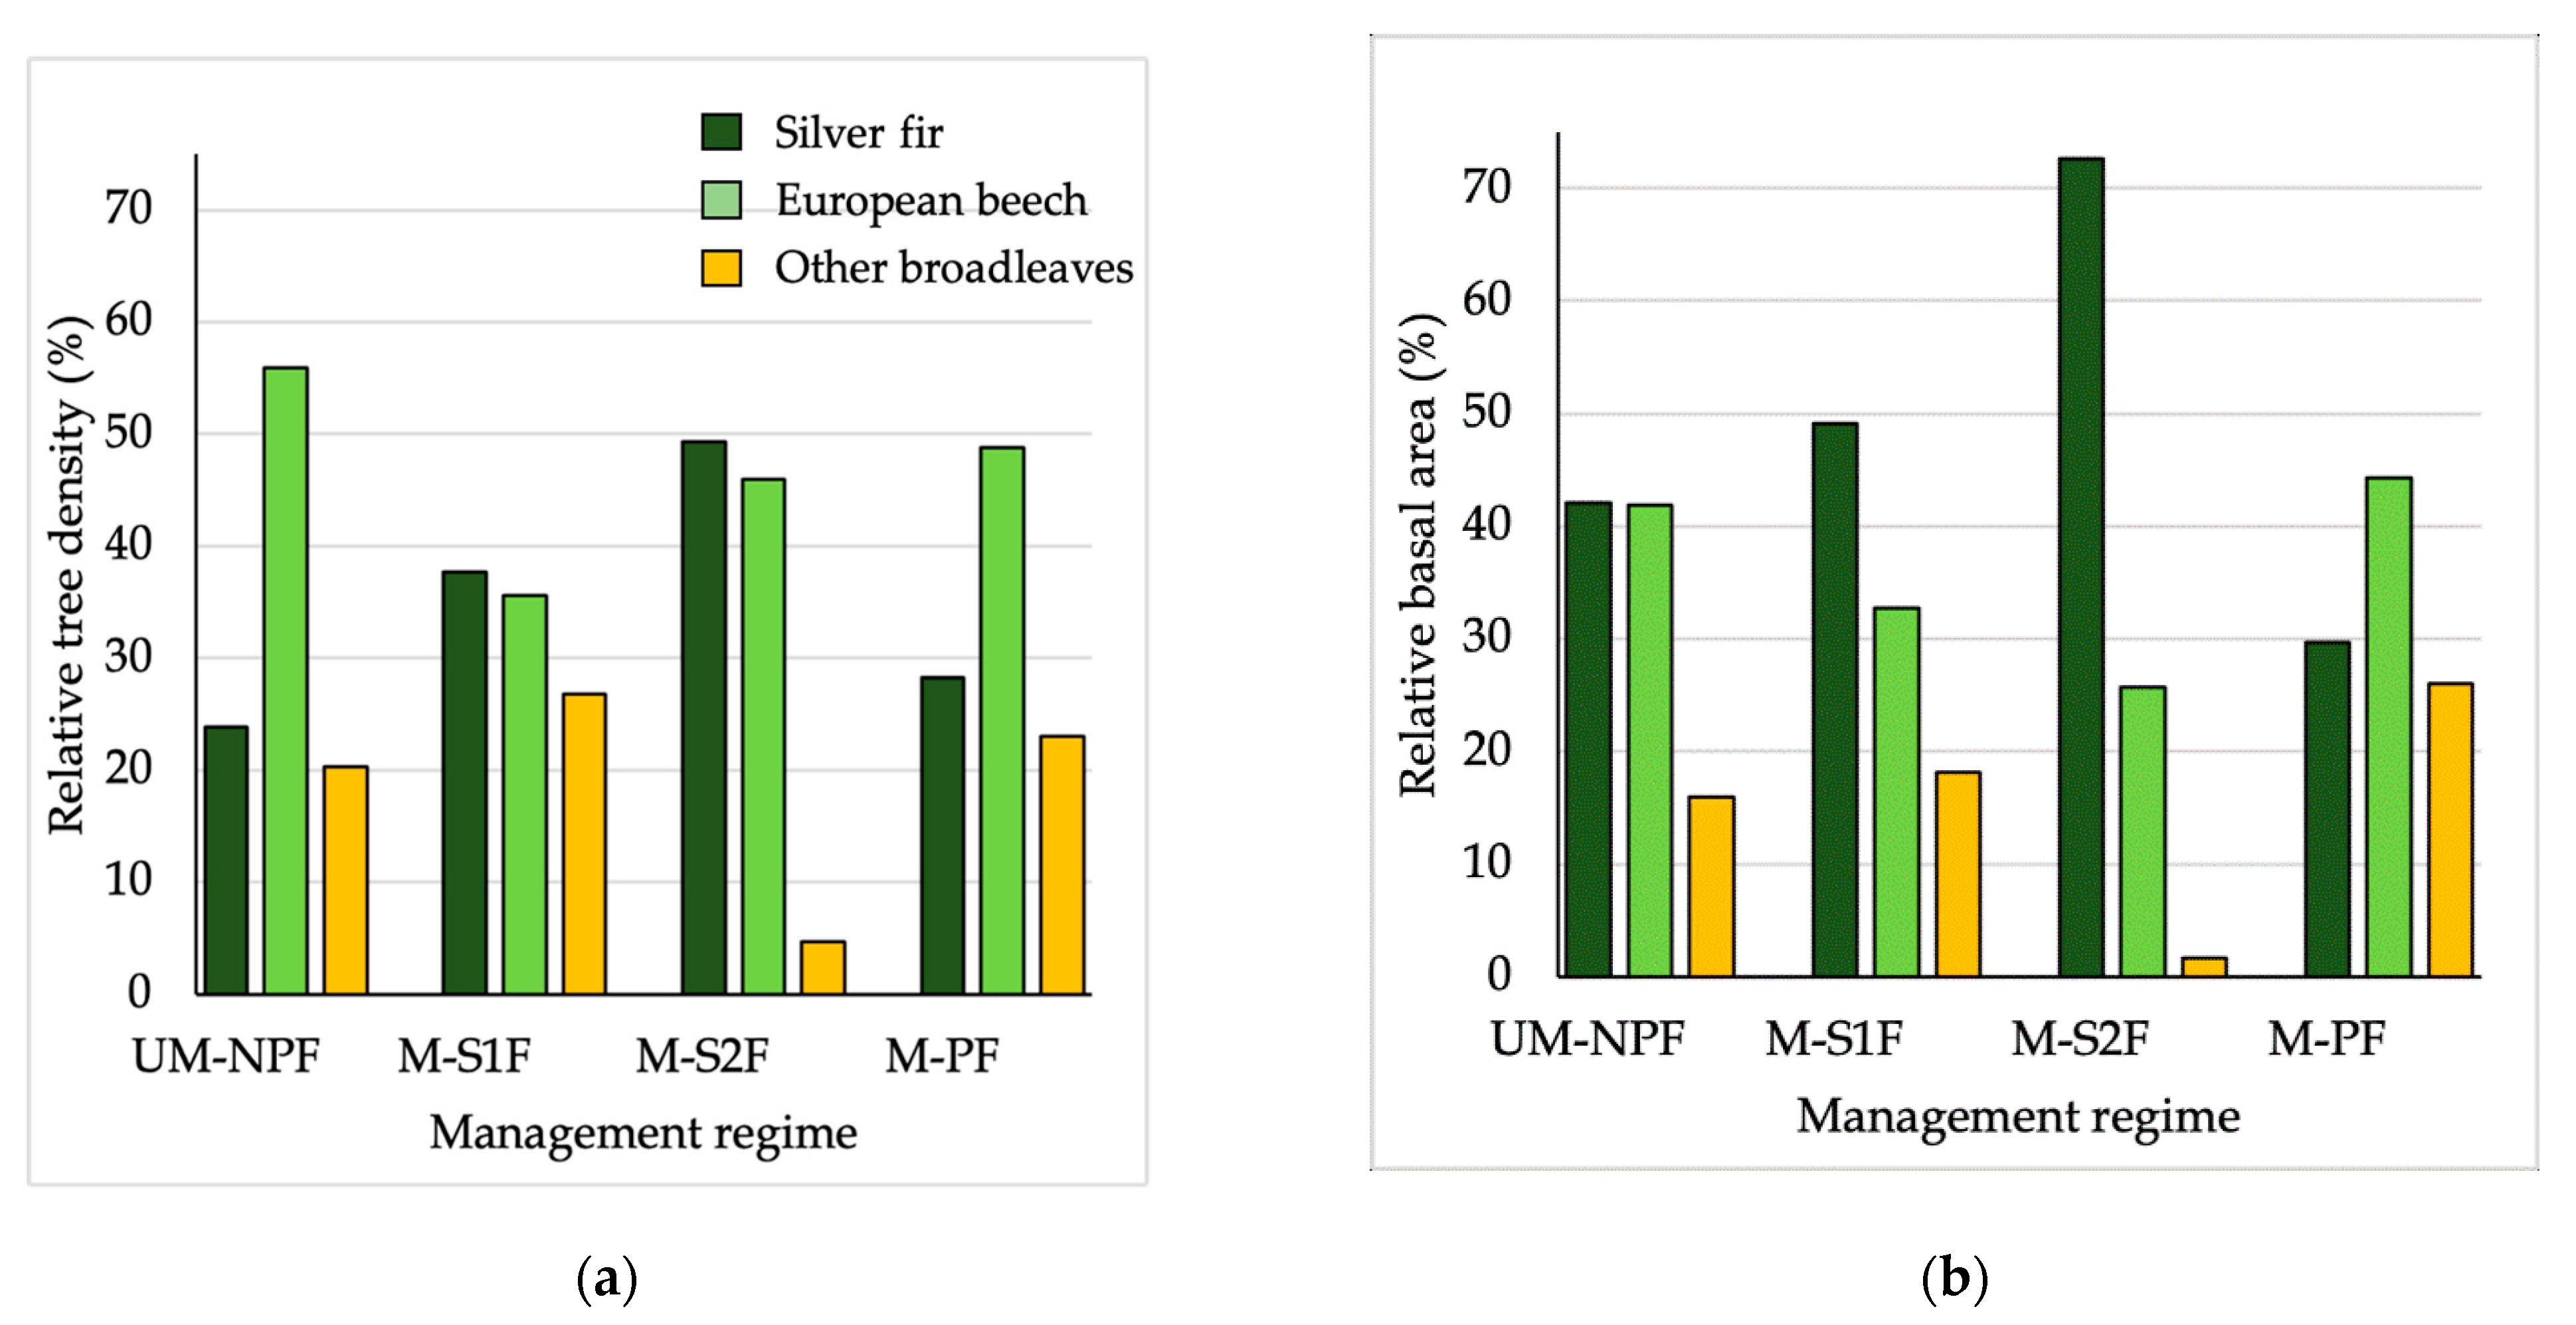
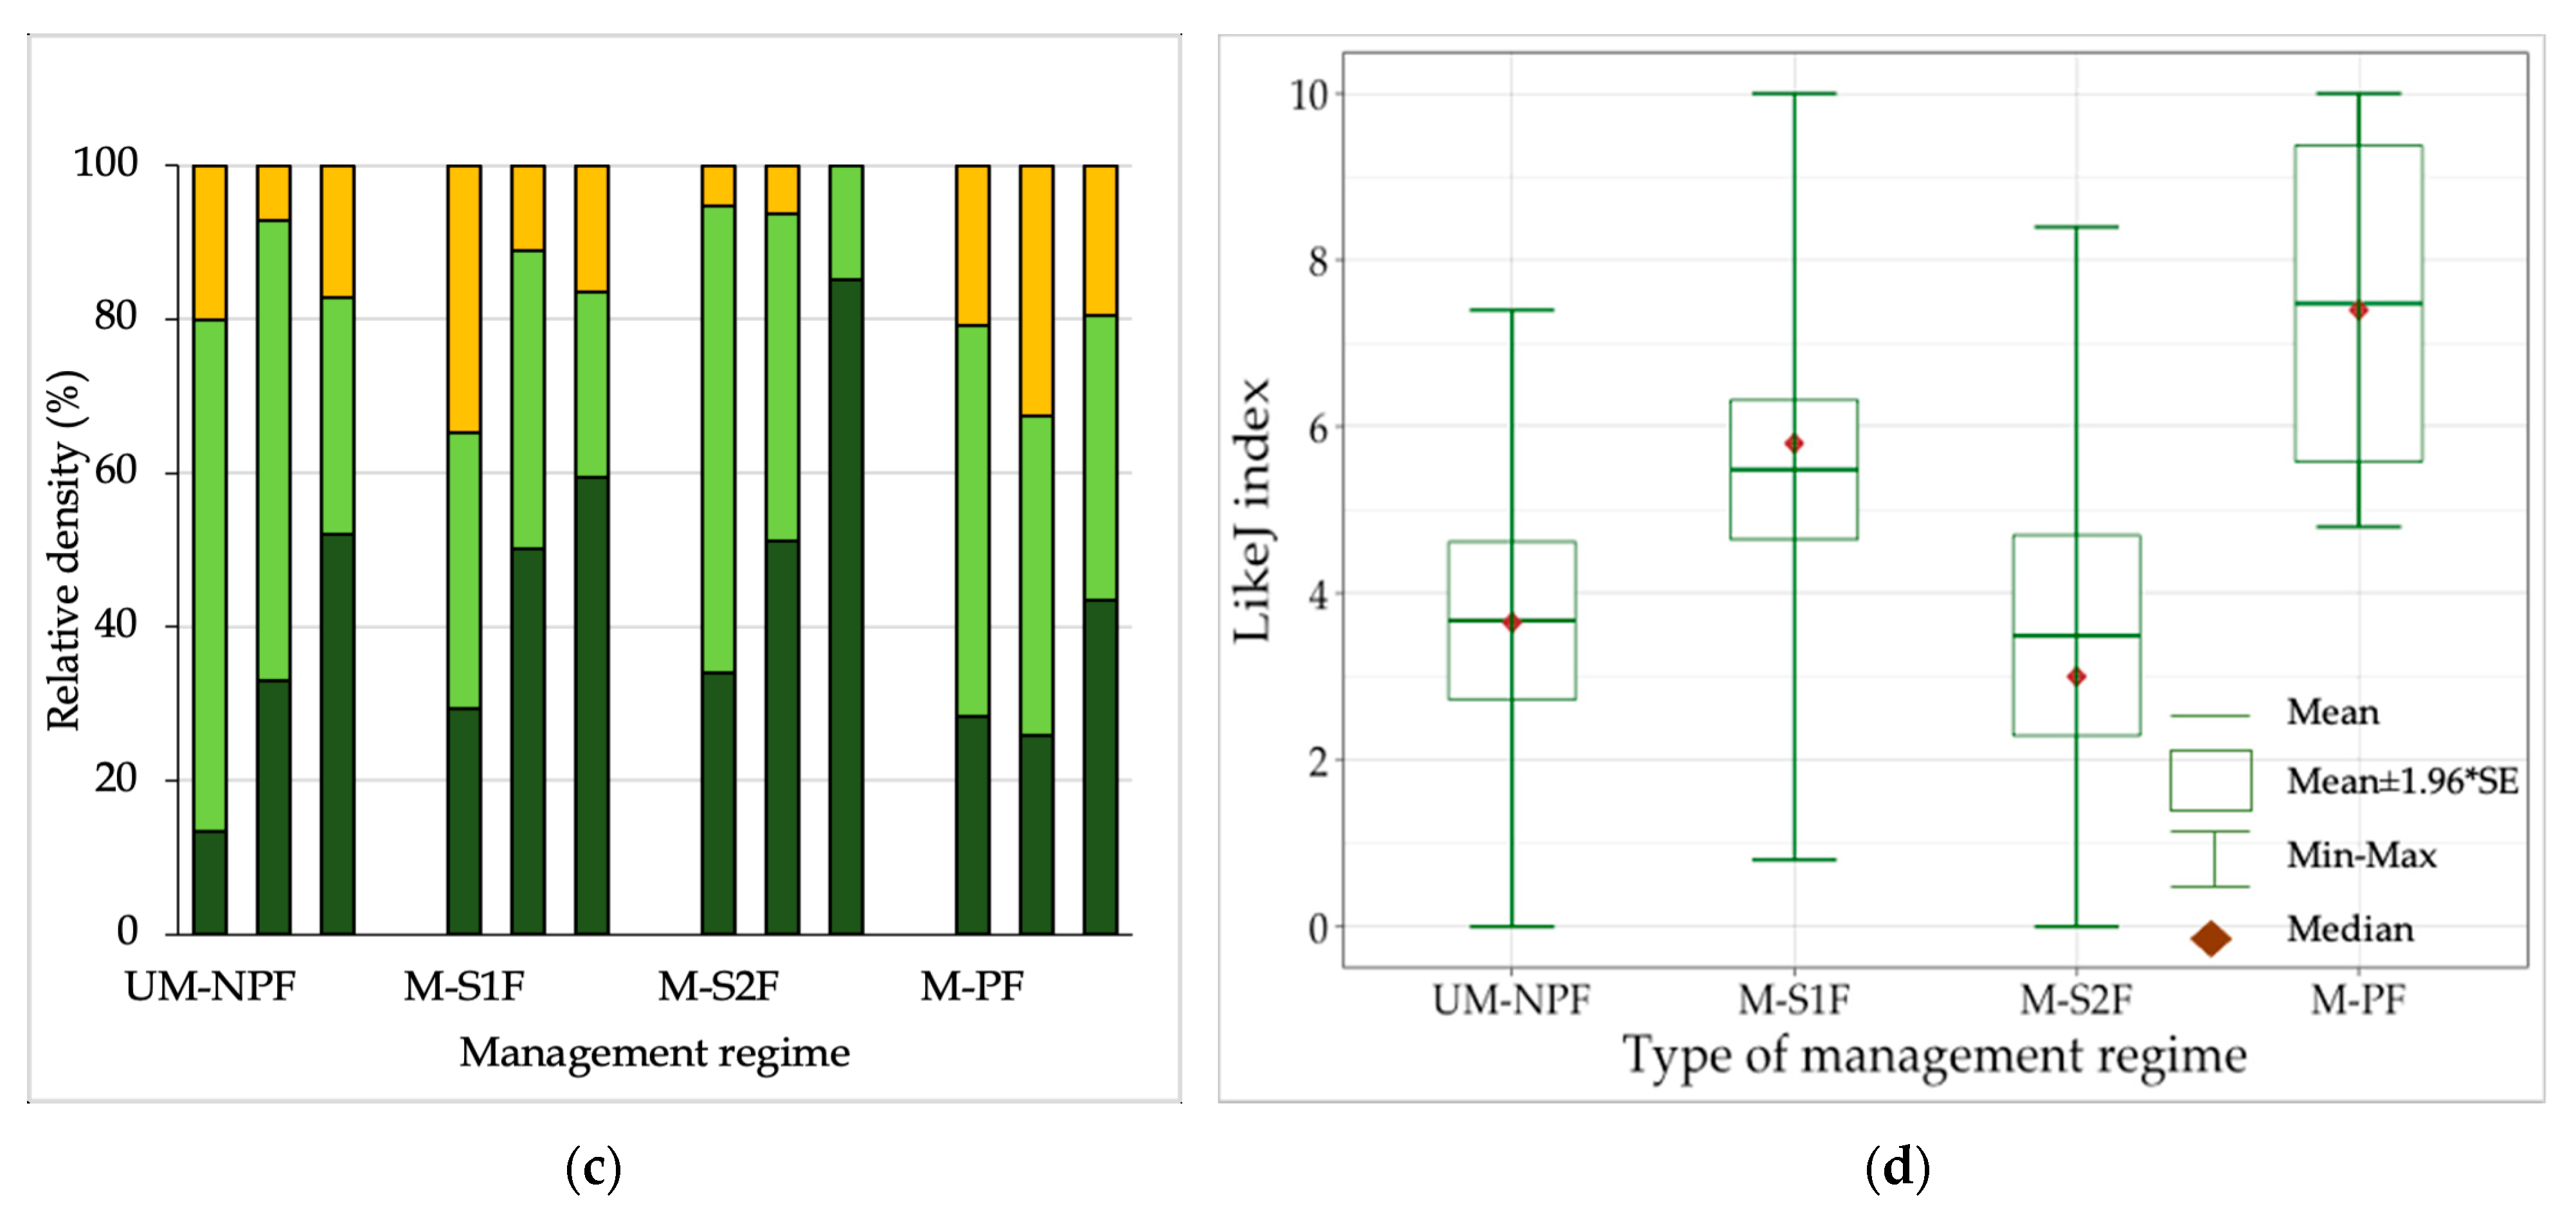
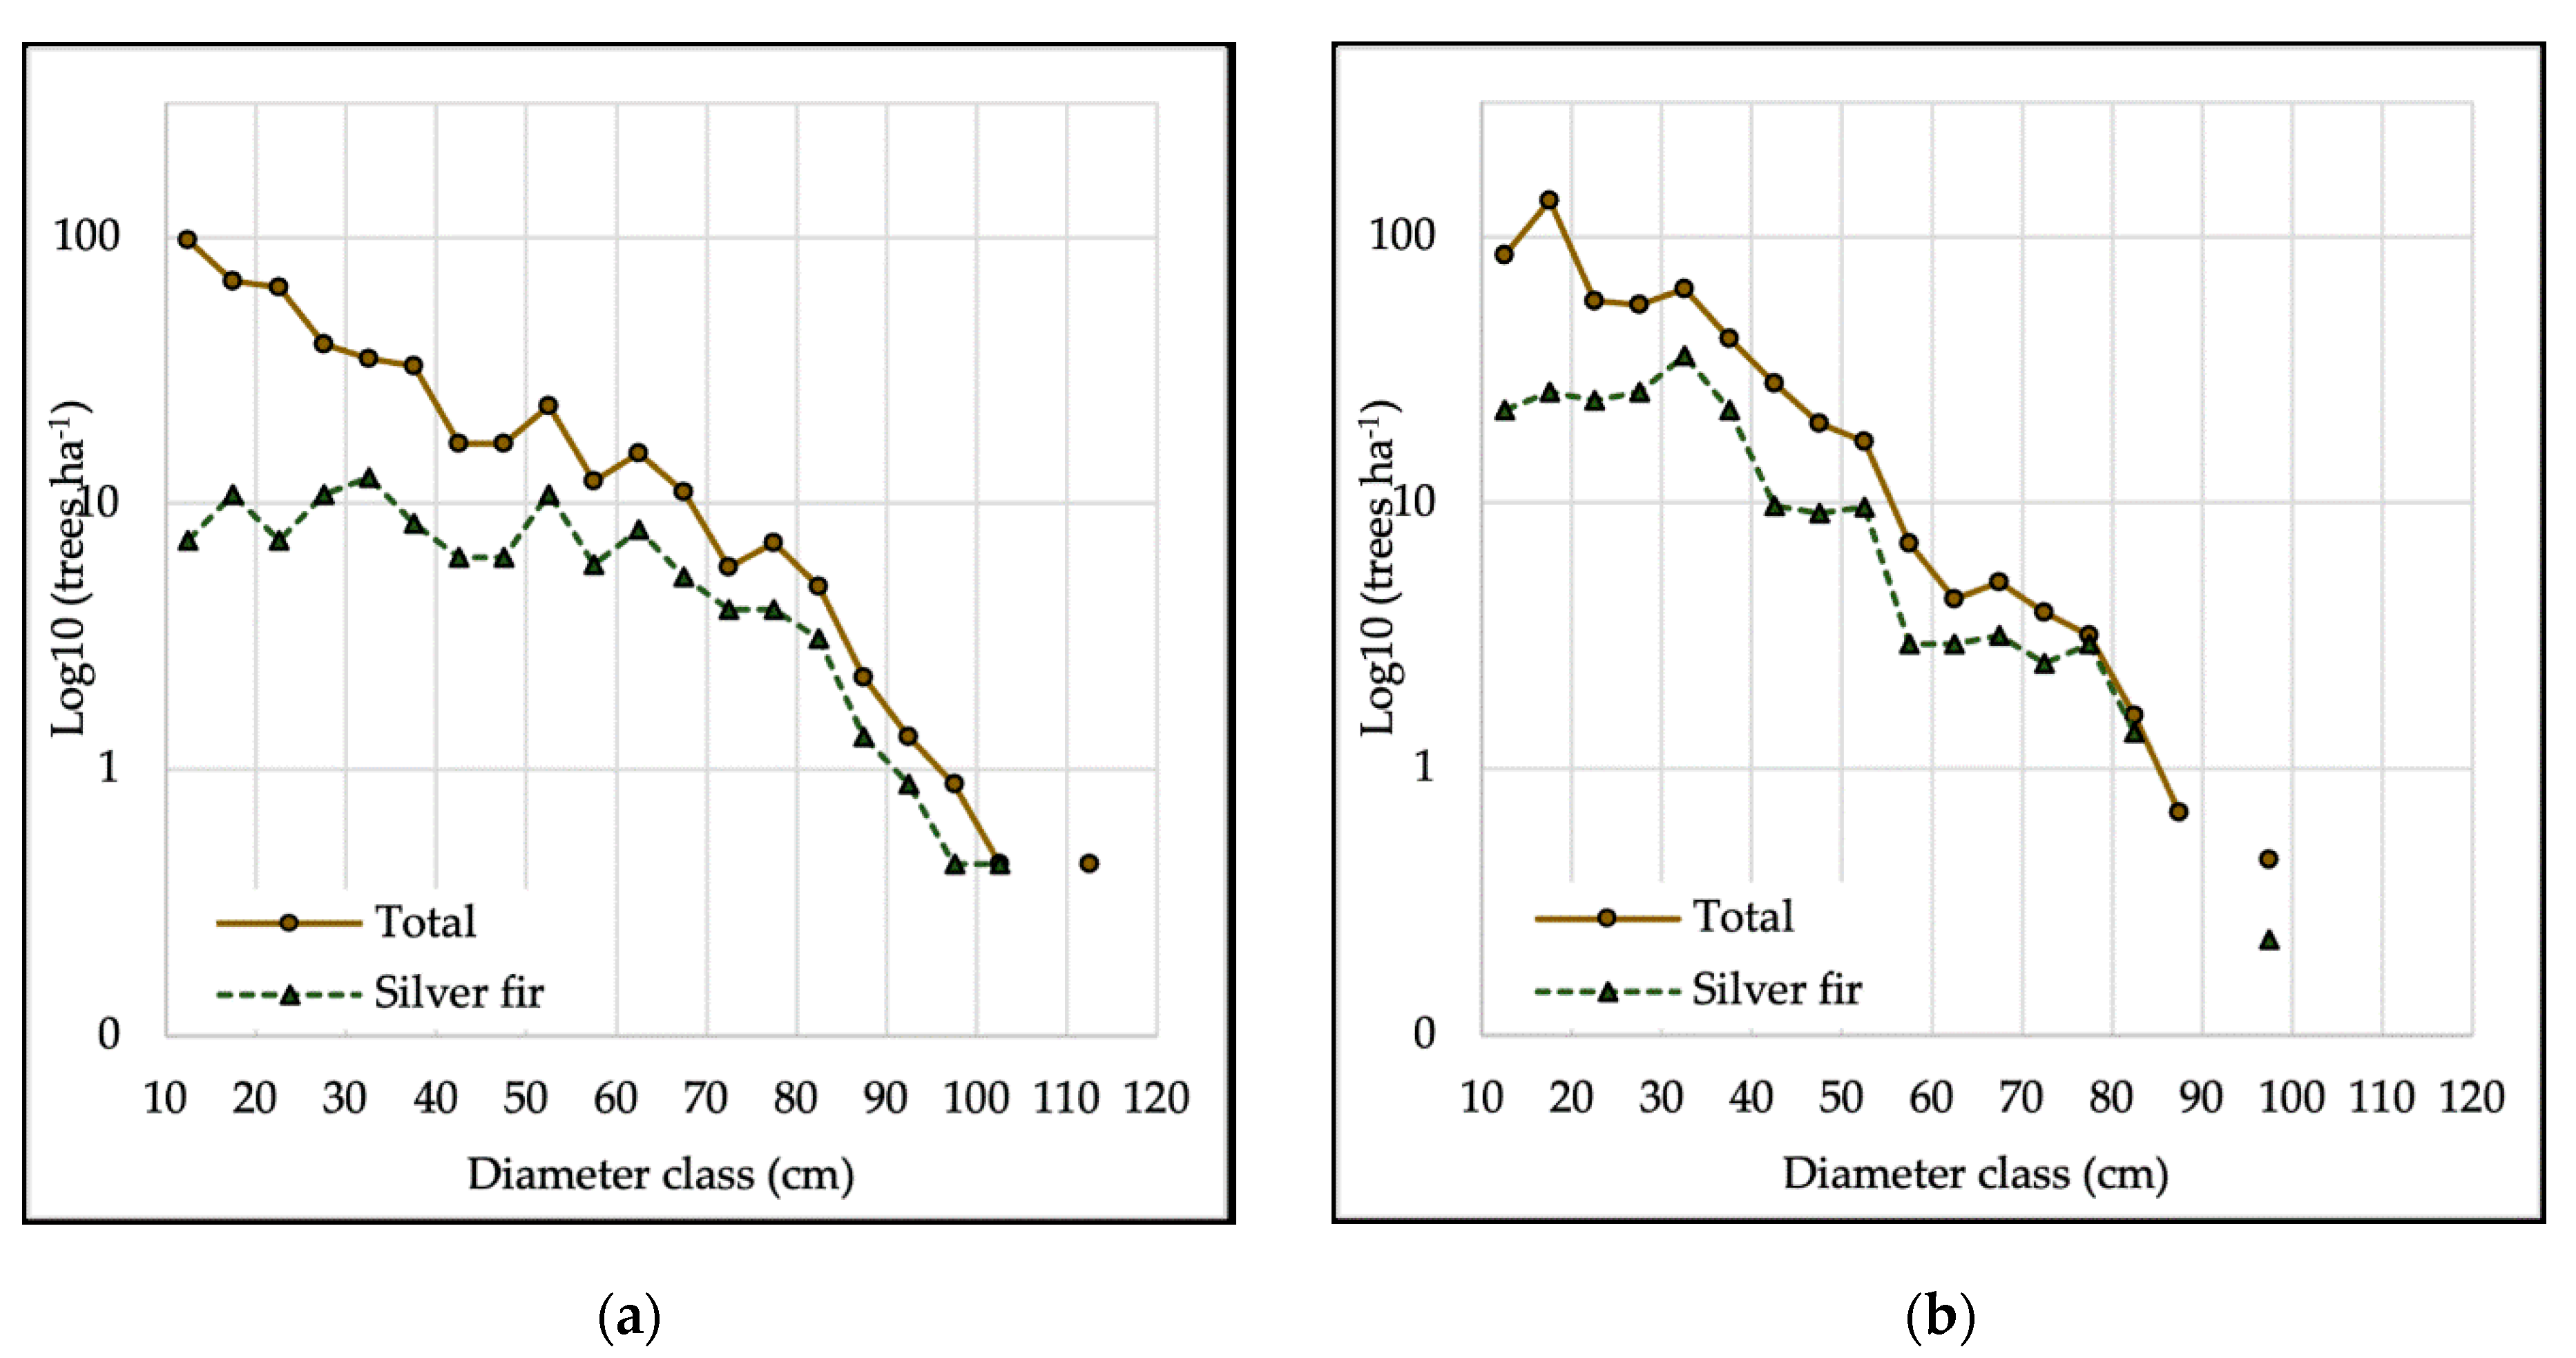
3.1. Characteristics of Current Stand Structures

Unmanaged forests (UM-NPF) showed significantly higher overall growing volume (666 m3 ha−1), overall stand basal area (48.9 m2 ha−1), density of large (84.8 trees ha−1) and very large trees (23.0 ha−1), overall mean DBH (40.6 cm) and lower LikeJ index (3.7) compared to managed M-S1F forests (Table 2, Figure 2d). No significant differences between UM-NPF and state M-S2F forests in growing volume, overall tree density, density of large and very large trees, overall mean DBH and LikeJ index were observed. Managed private forests (M-PF) exhibited significantly higher tree density (884 trees ha−1), stand density index (892), small diameter trees (688.6 trees ha−1) and LikeJ index (7.5) and the lowest overall mean DBH (Table 2, Figure 2d). Dead wood and density of stand regeneration differed between all types of management regimes, but not significantly. The best stand regeneration regarding overall seedling (h ≤ 130 cm, ha−1) density was observed in M-S2F and M-S1F forests, with more than 30,000 and 13,000 seedlings, respectively, while considerably lower seedling density (two times or more) was obtained in unmanaged forests and managed private forests (Table 2).
Unmanaged and managed private forests showed similarity in the relative tree density and basal area of beech, which was higher than in managed state forests where the relative basal area of fir reached 50 and 75 per cent, respectively (Figure 2a,b). A large share, in relative tree density, of beech and other species was obtained within the first size class (10 ≤ DBH < 30 cm) in all forest types with the achieved share of fir of about 30% in managed forests and only 13% in unmanaged forests. The share of fir relative density showed a systematic increase along with successive tree size classes. A similar pattern was obtained for both unmanaged forests and three types of managed forests (Figure 2c).
Considering diameter distribution for all tree species, unmanaged and M-S2 forests showed similar increasing Q shape (IQ) with a moderate initial reduction in the number of trees per DBH classes, followed by the increased decline of tree number in DBH classes > 60 cm. A more or less constant (negative exponential) and variable (rotated sigmoid) reduction rate of overall tree number per diameter classes was observed in M-S1F and M-PF forests (Figure 3).
Unmanaged and managed forests showed slight differences by PCA (Figure 4). Along a direction from managed to unmanaged forests, there was a decreasing of overall fir and beech and other broadleaves (OB) harvest volume, decreasing of recruited trees per ha annually and increasing of total basal area, average DBH, crown defoliation of firs and basal area of died beech trees between two inventories and the number of very large trees. The line of the two types of management gradient was relatively orthogonal to overall dead wood, standing dead wood, volume and number of large and very large snags, basal area of died firs between two inventories, number and volume of very large live trees.

3.2. Dynamics of Stand Structure

With the larger and similar initial growing volume (GV) of approximately 610 m3 ha−1 obtained in UM-NPF and M-S2F forests, during the period between two inventories, the growing volume increased in the unmanaged forests while decreased in the managed forests. In UM-NP forests, the increase of overall growing volume was higher compared to fir growing volume, while in M-S2 forests higher decrease was for overall GV than fir GV (Figure 5a). The initial growing volume in M-S1F and M-PF forests was also similar but much lower than in the other two forest types, which slightly decreased and increased in M-S1F and M-PF forests, respectively (Figure 5a).
The gross volume increment (GVI) in M-S1F forests was significantly lower than in UM-NPF and M-S2F forests in which GVI amounted to approximately 10 m3 per ha annually. This resulted in similar net volume increment (around 5 m3 ha−1 annually) and significantly smaller natural loose in M-S1F forests. M-PF forests were characterized by the highest net volume increment and lowest natural loose (Table 3, Figure 5). The highest relative natural loose of fir (>70%) was in both managed state forests, while in M-PF forests beech represented overall natural loose. Furthermore, DBH structure of natural loose showed that in both managed state forests the highest rate of natural loose was in medium diameter trees (DBH 30–50 cm), while in M-PF and UM-NPF forests was in very large diameter trees (DBH ≥ 70 cm) (Figure 5d).
The managed state forests, M-S2F and M-S1F, were characterized by cut volume larger than net volume increment, amounting to 178 and 113 per cent of net volume increment, respectively. In M-PF and UM-NPF, the cut volume amounted to 48 and 18 per cent (trees harvested on plots close to walkways due to safety of visitors) of net volume increment, respectively (Table 3, Figure 5c). The share of fir in total cut volume was the highest in all forest management regime types, while DBH structure of cut trees differed among studied forests (Figure 5d). The net changes corresponded to differences between net volume increment and cut volume.
An increase of an average stand density in UM-NPF and M-PF between two inventories was indicated with increased SDI of 4.42 and 5.51%, respectively. As expected, both types of managed state forests showed a decrease in SDI, which was almost three times larger in M-S2F (Table 3). In all forest management types, the past dynamics of stand structure represented by LikeJ index change showed negative trends. The smallest change was in M-PF, where DBH structure was the closest to inverse J-shaped distribution, while the largest change was observed in M-S2F and UM-NPF with the lowest LikeJ index.
The best stand regeneration, indicated by recruitment, was in M-PF, while M-S1F showed poorest stand regeneration, especially for fir with on average only 0.2 firs recruited per hectare yearly. Similar stand regeneration was observed in UM-NPF and M-S2F with 3.3 and 3.9 recruited trees per hectare, respectively (Table 3). Moreover, in all forest management types, annual changes in the number of small diameter trees were negative with approximately 6.5 (UM-NPF and M-S2F) and 10.5 (M-S1F and M-PF) trees decreased annually (Figure 5b).
Mortality represented by per cent of died trees per ha annually showed that the highest rate for overall, fir and beech trees was in M-S2F and significantly different than in other three forest management types, while in M-PF the mortality rate (except beech) was lowest. Unmanaged forests and M-S1F showed a similar rate for fir and overall mortality of approximately 1.9 per cent (Table 3).

4. Discussion

4.1. Characteristics of Current Stand Structures

Large accumulated growing volume of above 660 m3 per ha and its low variation observed in UM-NPF indicates some attributes of fir-beech old-growth forests where growing volumes exceed 600 or 700 m3 [41]. Due to M-S1F representativeness (> 90%) and being the most common management approach among all three managed forest types, its relevance for comparison with the unmanaged forests is of great importance. Thus, considering an overall growing volume that is significantly lower in M-S1F than in UM-NPF (Table 1), the difference between managed and unmanaged forests in the Croatian Dinaric region can be highlighted. However, the obtained growing volume in managed forests was still higher compared to the theoretical one of 350–400 m3 per hectare [11]. Regarding overall growing volume, the other two less representative managed forest types—M-S2F (3.5%) and M-PF (5.0%), representing different forest types and/or management approaches with similar growing volumes, showed no significant differences to the other two forest management regime types. However, similarity in overall growing volume is usually related to substantial differences in stand structures, as was confirmed in this study.
Considering stand structure in more detail, UM-NPF and M-S2F with higher similarity (except basal area and SDI) can be distinguished on one side, and M-S1F and M-PF with small differences on the other side (Table 2). A high accumulated basal area and stand density, a large share of beech, a large number of large trees and large mean DBH obtained in the unmanaged forests (Figure 4) indicates attributes of old-growth structures, which is consistent with several studies [29,42]. Similar attributes, with the exception of significantly lower overall basal area and stand density, were observed in managed state forests on silicate bedrock (M-S2F). The lower stand density, as a result of the smaller share of beech and other broadleaves, may be related to differences in site characteristics and past management. Diameter structure in both overall and species-specific terms, where no significant difference between the two forest management regimes was observed, is characterized by the lower number of trees in small and medium diameter classes and a higher number of large and very large trees compared to the other two types of managed forests, and also to some balanced structures. Such diameter structure with an increasing Q (IQ) shape (Figure 3) corresponds to results obtained in Slovenia [29]. This can be explained by weak stand regeneration, low intensity of management and fir decline as main causes during a long past period [14,16]. The number of large (>50 cm DBH) and very large (>70 cm DBH) trees observed in UM-NPF and M-S2F is much higher than it was suggested for emulating the old-growth structure [43]. In these forests, the large mean DBH and fir mean DBH are the result of the long span of DBH classes. A very low average LikeJ index obtained in both forests was lower than in unmanaged Pyrenean forests [44], which could be explained by the low unevenness of stand structures. However, considering the landscape-level approach and relatively small plot size (1256 m2), a spatial stand structure of larger forest patches when compared with single-tree selection can be indirectly designated with the low LikeJ indexes.
The current structural characteristics of two other managed forest types (Table 2, Figure 2, Figure 3) indicate that private forests have been more intensively managed than the most represented state forests (M-S1F). Despite large basal area and stand density, high density of small DBH trees, steep negative exponential shape, short span of DBH classes, low mean DBH and relatively high index of unevenness indicate continuous and sufficient stand regeneration and intensive management approaches that maintained selection structure during a long past period. Contrary to this, the observed growing volume, still higher than the theoretical and structural characteristics of M-S1F, corresponds to studies from other regions of central southern Europe [13,43] that suggest less intensive management approaches. This can be explained by low cut intensities (up to 14%) during the last decades and by recent forestry retention in managed forests due to Natura 2000 requirements.
Besides characteristics of DBH structure, the amount of dead wood, as old-growth structural attribute [45] supporting ecologic and habitat forest functions [46,47], is directly influenced by management intensity [42]. The high amount of standing dead wood in UM-NPF, twice as much as in M-S1F, suggests less intensive or the absence of management approaches supporting natural processes in forest stands. On the other side, despite the highest stand density, the observed low number of snags in M-PF can be explained by more intensive management. The observed density of seven large snags per ha (DBH > 50 cm) in UM-NPF and five large snags per ha in both state forests represents an appropriate structure of standing dead wood and was much higher than what was observed in similar forests withdrawn from management in other regions [42]. The amount of downed dead wood was the highest in unmanaged forests, but still similar or lower if compared with data obtained for other managed forests. The significantly lowest average crown defoliation for fir and beech obtained in M-S2F (Table 2) may be related to the amount and structure of recent cutting (salvage cut caused by windstorm). Furthermore, the highest density of both fir and overall seedlings as indicators of recent stand regeneration obtained in M-S2F may be explained by the lowest stand density index related to specific diameter structure and recent dynamics of management (cutting) and accumulation of SDW. The density of saplings in M-S2F and UM-NPF showed better stand regeneration in periods before the last decade than in managed private and especially in state M-S1F forests. Generally, there is an indication of a very low share of fir seedlings and saplings in all types of forest management regimes, with a share amounting from tenth up to fourth of overall regeneration density. Similar results of stand regeneration were obtained by [48].

4.2. Past Dynamics of Stand Structure

Analysis of past forest changes and management combined with projection of future forest development may be base of evaluation of the current and adjustments of future management [49]. Although the period of approximately 12 years is generally quite short to determine past stand dynamics, this study represents the first phase for a consistent monitoring system that may be used to determine certain trends of stand dynamics in the short-term. As was expected, unmanaged forests showed the trend of growing volume increase with an annual rate of 0.76% (0.50% of basal area). This is in line with trends obtained in earlier studies of mixed fir-beech forests [50,51]. With the assumed trend of such annual increase during the next (five) decades, a growing volume of 800 m3 and even higher would be achieved, which was reported in primeval and old-growth forests [52,53,54,55]. Accumulation of the growing volume would be supported in the next decades if the obtained recent dynamics are characterized by the balance between dead trees and net volume increment, decrease in the number of small and medium diameter trees with an increased number of large and very large diameter trees, the increase of SDI and the decrease of LikeJ index (Table 3, Figure 5b, Figure 5c). Studies of natural disturbance histories in old-growth forest remnants [56,57] provide an important base for understanding processes and long past forest dynamics that may be applied in future projections. Thus, may assume that natural disturbances of different severities (gap sizes) will drive future forest stand dynamics and lead to the achievement of balance between developmental phases, regeneration and mortality, increment and dead wood, and stable growing volume in the long term and on the landscape level. Recruitment of only 3.3 trees per hectare annually was similar as according to Čavlović et al. [11], and much lower than in other studies in the Dinaric region [58] indicating poor stand regeneration and decrease in small diameter trees. However, the sapling density of 6500 individuals per ha (Table 2) indicates recently advanced stand regeneration. Moreover, the expected increase of snags and gap dynamics would intensify stand regeneration and lead to balancing of DBH structure.
The studied managed forests may differ from the obtained short-term past stand dynamics. The increase of growing volume in private forests may be attributed to the high share of net volume increment at the expense of dead trees (mainly very large and small beeches) and to cutting only half of the net volume increment (Figure 5). Although intensive management approaches have been applied during the long past period, indicated by the current stand structure characteristics, it can be assumed that this underuse of standing volume was a characteristic of a recent period. However, due to the absence of consistent data on long-term forests use, this assumption cannot be confirmed. Furthermore, the small number of sample plots representing this type of forest management regime should be taken into account. Moreover, numerous studies have revealed that private forest owners are increasingly heterogeneous in terms of their objectives, motivations, values and management styles [59,60,61]. Consequently, this may lead to low cutting intensities and underuse of wood in small-scale private forests. Thus, future trends of stand dynamics in this type of forest management regime would depend on changes and dynamics of forest owners’ attitudes and management objectives.
The most representative state managed forests on carbonate bedrock were characterized by relatively low gross volume increment of 7.60 m3 per ha (1.62% annually) with a high number of large and very large diameter trees. An average annual cut of approximately 5.5 m3 per ha (73% of gross increment) corresponds to 10-year harvest intensity of 12%. These data obtained in the last decade represent stand dynamics and management intensity during the long past period. Furthermore, the second half of the last century was characterized by management practices of low cutting intensities (up to two-thirds of accumulated volume increment) as a consequence of using an actual rate of current volume increment instead of a theoretical one in prescribing the cut amount [11] which may lead to an accumulation of growing volume and dead wood in the Croatian Dinaric selection forests. The prescribed average cut intensity of 14% for the period 1996–2005 in the selection forests, according to General Forest Management Plan of 1996, indicated such management practices. This was also confirmed by the first NFI [27] with an obtained average cut of 4.9 m3 per ha annually (for the period 2000–2010). Such stand dynamics of slight standing volume decrease, a decrease of stand density, and LikeJ index would be expected in future decades if this less intensive management approach was to continue. However, more efficient multifunctional forest management could be achieved by the segregation of these forests with the two main management objectives. A smaller part characterized by high-stocked stands/part of stands is an appropriate base for establishing networks for fulfilling the requirements of habitat and nature protection, i.e., Natura 2000 requirements [62]. No harvest or low harvest approaches will maintain processes of achieving old-growth forest structure [45,63]. Similarly, as mentioned above for unmanaged forests, it would take several decades (up to 5) to achieve old-growth structural characteristics in such high-stocked stands. In order to provide economic benefits, higher intensive harvests should be applied in other part of the forests by gradually establishing an efficient selection stand structure with a growing stock close to or slightly above an equilibrium structure [64]. The approach for estimating the sustained harvests [65] based on the Hundeshagen formula, that is for continuously applying the theoretical rate of current annual volume increment (a theoretical harvest intensity) on actual standing volume, would lead to the achievement of the theoretical (desired) growing volume with balanced structure in the long term.
The high amounts of cutting and natural loose obtained in state managed forests on non-carbonate bedrock (M-S2F) (Figure 5) can be explained by exposures to a windstorm on two sample plots locations, which dawned all standing live and dead trees. Thus, due to the relatively small number of sample plots, the mentioned natural disturbance and consequent salvage logging increased the average amount of natural loose and cutting, and led to an overall standing volume decrease. Moreover, regarding cutting intensity and trend of growing volume, the obtained stand dynamic does not represent long-term past dynamic in these forests. Although, in the second half of the last century, similar management approaches were applied in entire selection forests in the Croatian Dinaric region. Despite their small share, these forests have a high potential for providing ecological and economic functions due to favorable conditions, high productivity and rarity of forest sites. Emulation of natural processes may also be recommended for these forests with abandoned management and natural disturbance-based forest management [66] in stands of appropriate structure (large standing volume, large share of large living trees and snags) and active management in other stands aimed to achieve a balanced group stem selection stand structures in the long term.

5. Conclusions

In this study we provided the first comprehensive landscape-level results of stand structure and recent stand dynamics within fir-beech stands in the Croatian Dinaric region that support the research hypotheses stated above. We concluded that the current stand structure characteristics differ between forests withdrawn from management and most representative state managed forests. It would be easier to distinguish these forests if there were longer periods of forest use abandonment in the recently unmanaged forests and if more intensive harvests were applied in the managed forests. As expected, some quantitative and qualitative differences caused by different site conditions, management objectives and approaches and natural disturbances were revealed in the studied types of managed forests.
The recent stand structure dynamics obtained with this fir-beech forests monitoring system can be understood as a result of long-term forest dynamics over past periods and as a “potential state” for future forest dynamics that can be driven by spontaneous (natural) processes and/or different management approaches. The gradual accumulation of standing volume, an increase of large diameter live trees and large snags as main characteristics of long-term past dynamics have supported unmanaged forests recently, unlike managed forests where these processes were slowed down or stopped, indicating a recent difference in structures of stand dynamics between unmanaged and managed forests. The achievement of high accumulated basal area and stand density, a large share of beech, a large number of large live trees and snags and large mean DBH that can be recognized as old-growth attributes in forests withdrawn from forest management only during the last three decades indicates the large potential of fir-beech forests to sustain multifunctional forest management.
The present results alongside continuous fir-beech forest monitoring may be used to support silviculture for the conversion of higher-stocked stands into stands with a balanced structure, designation and maintenance to achieve an old-growth structure in the Dinaric region. Moreover, further research on long-term projections of stand structures and stand dynamics based on various management objectives simulations, selection management systems and environmental factors (climate change, emissions and natural disturbances) should also be considered in order to support planning and management in fir-beech forests under demanding and changeable ecological and socioeconomic circumstances.

Author Contributions

Conceptualization, J.Č.; methodology, J.Č.; field data collection, K.T., K.B., M.A.; data analysis, M.A., M.B.; writing—original draft preparation, J.Č.; writing—review and editing, M.A. All authors have read and agreed to the published version of the manuscript.

Funding

This research was funded by the Croatian Science Foundation (project number IP-2018-01-8820).

Institutional Review Board Statement

Not applicable.

Informed Consent Statement

Not applicable.

Data Availability Statement

The data that support the findings of this study are available on request from the corresponding author, M.A.

Conflicts of Interest

The authors declare no conflict of interest.

References

  1. Mauri, A.; de Rigo, D.; Caudullo, G. Abies alba in Europe: Distribution, habitat, usage and threats. In European Atlas of Forest Tree Species; San-Miguel-Ayanz, J., de Rigo, D., Caudullo, G., Houston Durrant, T., Mauri, A., Eds.; Publications Office of the European Union: Luxembourg, 2016; pp. 48–49. ISBN 978-92-79-52833-0. [Google Scholar]
  2. Boncina, A. History, current status and future prospects of uneven-aged forest management in the Dinaric region: An overview. Forestry 2011, 84, 467–478. [Google Scholar] [CrossRef]
  3. Macias, M.; Andreu, L.; Bosch, O.; Camarero, J.J.; Gutiérrez, E. Increasing Aridity is Enhancing Silver Fir (Abies Alba Mill.) Water Stress in its South-Western Distribution Limit. Clim. Change 2006, 79, 289–313. [Google Scholar] [CrossRef]
  4. Linares, J.; Camarero, J.J. Growth patterns and sensitivity to climate predict silver fir decline in the Spanish Pyrenees. Eur. J. For. Res. 2012, 131, 1001–1012. [Google Scholar] [CrossRef]
  5. Gazol, A.; Camarero, J.J.; Gutiérrez, E.; Popa, I.; Andreu-Hayles, L.; Motta, R.; Nola, P.; Ribas, M.; Sangüesa-Barreda, G.; Urbinati, C.; et al. Distinct effects of climate warming on populations of silver fir (Abies alba) across Europe. J. Biogeogr. 2015, 42, 1150–1162. [Google Scholar] [CrossRef] [Green Version]
  6. O’Hara, K.L.; Bončina, A.; Diaci, J.; Anić, I.; Boydak, M.; Curovic, M.; Govedar, Z.; Grigoriadis, N.; Ivojevic, S.; Keren, S.; et al. Culture and Silviculture: Origins and Evolution of Silviculture in Southeast Europe. Int. For. Rev. 2018, 20, 130–143. [Google Scholar] [CrossRef]
  7. Davies, O.; Kerr, G. Comparing the Costs and Revenues of Transformation to Continuous Cover Forestry for Sitka Spruce in Great Britain. Forests 2015, 6, 2424–2449. [Google Scholar] [CrossRef] [Green Version]
  8. Knoke, T. The Economics of Continuous Cover Forestry. In Continuous Cover Forestry; Pukkala, T., Gadow, K., Eds.; Springer: Berlin, Germany, 2012; pp. 166–193. [Google Scholar]
  9. McMahon, J.P. International expectations for sustainable forestry: A review from US forest industry. New For. 1999, 17, 329–338. [Google Scholar] [CrossRef]
  10. O’Hara, K.L. The silviculture of transformation—A commentary. For. Ecol. Manag. 2001, 151, 81–86. [Google Scholar] [CrossRef]
  11. Čavlović, J.; Božić, M.; Boncina, A. Stand structure of an uneven-aged fir–beech forest with an irregular diameter structure: Modeling the development of the Belevine forest, Croatia. Eur. J. For. Res. 2006, 125, 325–333. [Google Scholar] [CrossRef]
  12. Čavlović, J.; Bončina, A.; Božić, M.; Goršić, E.; Simončić, T.; Teslak, K. Depression and growth recovery of silver fir in uneven-aged Dinaric forests in Croatia from 1901 to 2001. Forestry 2015, 88, 586–598. [Google Scholar] [CrossRef] [Green Version]
  13. Boncina, A.; Cavlovic, J.; Curovic, M.; Govedar, Z.; Klopcic, M.; Medarevic, M. A comparative analysis of recent changes in Dinaric uneven-aged forests of the NW Balkans. Forestry 2014, 87, 71–84. [Google Scholar] [CrossRef]
  14. Keren, S.; Motta, R.; Govedar, Z.; Lucic, R.; Medarevic, M.; Diaci, J. Comparative structural dynamics of the Janj mixed old-growth mountain forest in Bosnia and Herzegovina: Are conifers in a long-term decline? Forests 2014, 5, 1243–1266. [Google Scholar] [CrossRef] [Green Version]
  15. Boncina, A.; Diaci, J.; Cencic, L. Comparison of the two main types of selection forests in Slovenia: Distribution, site conditions, stand structure, regeneration and management. Forestry 2002, 75, 365–373. [Google Scholar] [CrossRef] [Green Version]
  16. Ficko, A.; Poljanec, A.; Boncina, A. Do changes in spatial distribution, structure and abundance of silver fir (Abies alba Mill.) indicate its decline? For. Ecol. Manag. 2011, 261, 844–854. [Google Scholar] [CrossRef]
  17. Klopcic, M.; Jerina, K.; Boncina, A. Long-term changes of structure and tree species composition in Dinaric uneven-aged forests: Are red deer an important factor? Eur. J. For. Res. 2010, 129, 277–288. [Google Scholar] [CrossRef]
  18. Kandler, O.; Innes, J.L. Air pollution and forest decline in Central Europe. Environ. Pollut. 1995, 90, 171–180. [Google Scholar] [CrossRef]
  19. Krause, G.H.M.; Arndt, U.; Brandt, C.J.; Bucher, J.; Kenk, G.; Matzner, E. Forest Decline in Europe: Development and Possible Causes. In Acidic Precipitation, Proceedings of the International Symposium on Acidic Precipitation, Muskoka, ON, Canada, 15–20 September 1987; Martin, H.C., Ed.; Springer: Dordrecht, The Netherlands, 1987; ISBN 978-94-009-3385-9. [Google Scholar]
  20. Elling, W.; Dittmar, C.; Pfaffelmoser, K.; Rotzer, T. Dendroecological assessment of the complex causes of decline and recovery of the growth of silver fir (Abies alba Mill.) in Southern Germany. For. Ecol. Manag. 2009, 257, 1175–1187. [Google Scholar] [CrossRef]
  21. Battipaglia, G.; Saurer, M.; Cherubini, P.; Siegwolf, R.T.W.; Cotrufo, M.F. Tree rings indicate different drought resistance of native (Abies alba Mill.) and a nonnative (Picea abies (L.) Karst.) species co-occurring at a dry site in Southern Italy. For. Ecol. Manag. 2009, 257, 820–828. [Google Scholar] [CrossRef]
  22. Nourtier, M.; Chanzy, A.; Cailleret, M.; Yingge, X.; Huc, R.; Davi, H. Transpiration of silver Fir (Abies alba Mill.) during and after drought in relation to soil properties in a Mediterranean mountain area. Ann. For. Sci. 2014, 71, 683–695. [Google Scholar] [CrossRef]
  23. Gazol, A.; Camarero, J.J. Functional diversity enhances silver fir growth resilience to an extreme drought. J. Ecol. 2016, 104, 1063–1075. [Google Scholar] [CrossRef]
  24. Feurdean, A.; Willis, K.J. Long-term variability of Abies alba in NW Romania: Implications for its conservation management. Divers. Distrib. 2008, 14, 1004–1017. [Google Scholar]
  25. Oliva, J.; Colinas, C. Epidemiology of Heterobasidion abietinum and Viscum album on fir (Abies alba) stands of the Pyrenees. For. Pathol. 2010, 40, 19–32. [Google Scholar] [CrossRef]
  26. Mikac, S.; Klopf, M.; Anić, I.; Hasenauer, H. Using the tree growth model MOSES to assess the dynamics of Dinaric old-growth mixed beech–fir forest ecosystems. Plant Biosyst. 2013, 147, 664–671. [Google Scholar] [CrossRef]
  27. Čavlović, J.; Božić, M.; Teslak, K.; Vedriš, M. Chapter 15—Croatia. In National Forest Inventories—Assessment of Wood Availability and Use; Vidal, C., Alberdi, I., Hernandez, L., Redmond, J., Eds.; Springer: Cham, Switzerland, 2016; pp. 281–305. ISBN 978-3-319-44015-6. [Google Scholar]
  28. Frey, S.J.K.; Hadley, A.S.; Johnson, S.L.; Schulze, M.; Jones, J.A.; Betts, M.G. Spatial models reveal the microclimatic buffering capacity of old-growth forests. Sci. Adv. 2016, 2, 1–9. [Google Scholar] [CrossRef] [PubMed] [Green Version]
  29. Adamic, M.; Diaci, J.; Rozman, A.; Hladnik, D. Long-term use of uneven-aged silviculture in mixed mountain Dinaric forests: A comparison of old-growth and managed stands. Forestry 2017, 90, 279–291. [Google Scholar] [CrossRef] [Green Version]
  30. Watson, J.E.M.; Evans, T.; Venter, O.; Williams, B.; Tulloch, A.; Stewart, C.; Thompson, I.; Ray, J.C.; Murray, K.; Salazar, A.; et al. The exceptional value of intact forest ecosystems. Nat. Ecol. Evol. 2018, 2, 599–610. [Google Scholar] [CrossRef] [PubMed]
  31. Kenina, L.; Jaunslaviete, I.; Liepa, L.; Zute, D.; Jansons, A. Carbon Pools in Old-Growth Scots Pine Stands in Hemiboreal Latvia. Forests 2019, 10, 911. [Google Scholar] [CrossRef] [Green Version]
  32. Jaloviar, P.; Saniga, M.; Kucbel, S.; Pittner, J.; Vencurik, J.; Dovciak, M. Seven decades of change in a European old-growth forest following a stand-replacing wind disturbance. A long-term case study. For. Ecol. Manag. 2017, 399, 197–205. [Google Scholar] [CrossRef]
  33. Kuuluvainen, T.; Aakala, T. 2011: Natural Forest Dynamics in Boreal Fennoscandia: A Review and Classification. Silva Fenn. 2011, 45, 823–841. [Google Scholar] [CrossRef] [Green Version]
  34. Blicharska, M.; Orlikowska, E.H.; Roberge, J.M.; Grodzinska-Jurczak, M. Contribution of social science to large scale biodiversity conservation: A ereview of research about the Natura 2000 network. Biol. Conserv. 2016, 199, 110–122. [Google Scholar] [CrossRef]
  35. Möckel, S. The European ecological network “Natura 2000” and its derogation procedure to ensure compatibility with competing public interests. Nat. Conserv. 2017, 23, 87–116. [Google Scholar] [CrossRef]
  36. Leak, W.A. Long-term structural change in uneven-aged northern hardwoods. For. Sci. 1996, 42, 160–165. [Google Scholar]
  37. Hanewinkel, M.; Kuhn, T.; Bugmann, H.; Lanz, A.; Brang, P. Vulnerability of uneven-aged forests to storm damage. Forestry 2014, 87, 525–534. [Google Scholar] [CrossRef] [Green Version]
  38. Woodall, C.W.; Perry, C.H.; Miles, P.D. The relative density of forests in the United States. Forest. Ecol. Manag. 2006, 226, 368–372. [Google Scholar] [CrossRef]
  39. Kaufmann, E. Estimation of Standing Timber, Growth and Cut. In Swiss National Forest Inventory: Methods and Models of the Second Assessment; Brassel, P., Lischke, H., Eds.; WSL Swiss Federal Research Institute: Birmensdorf, Switzerland, 2001; pp. 162–196. ISBN 3-905620-99-5. [Google Scholar]
  40. R Core Team. R: A Language and Environment for Statistical Computing; R Foundation for Statistical Computing: Austria, Vienna, 2020; Available online: https://www.r-project.org/ (accessed on 25 March 2021).
  41. Parobekova, Z.; Pittner, J.; Kucbel, S.; Saniga, M.; Filipek, M.; Sedmakova, D.; Vancurik, J.; Jaloviar, P. Structural Diversity in a Mixed Spruce-Fir-Beech Old-Growth Forest Remnant of the Western Carpathians. Forests 2018, 9, 379. [Google Scholar] [CrossRef] [Green Version]
  42. Motta, R.; Garbarino, M.; Berretti, R.; Meloni, F.; Nosenzo, A.; Vacchiano, G. Development of old-growth characteristics in uneven-aged forests of the Italian Alps. Eur. J. For. Res. 2015, 134, 19–31. [Google Scholar] [CrossRef] [Green Version]
  43. McGee, G.G.; Leopold, D.J.; Nyland, R.D. Structural characteristics of old-growth, maturing, and partially cut northern hardwood forests. Ecol. Appl. 1999, 9, 1316–1329. [Google Scholar]
  44. Horvat, V.; García De Vicuña, J.; Biurrun, I.; García-Mijangos, I. Managed and unmanaged silver fir-beech forests show similar structural features in the western Pyrenees. iForest 2018, 11, 698–704. [Google Scholar] [CrossRef] [Green Version]
  45. Bauhus, J.; Puettmann, K.; Messier, C. Silviculture for old-growth attributes. Forest. Ecol. Manag. 2009, 258, 525–537. [Google Scholar] [CrossRef] [Green Version]
  46. Hodge, S.J.; Peterken, G.F. Deadwood in British forests: Priorities and strategy. Forestry 1998, 71, 99–112. [Google Scholar] [CrossRef] [Green Version]
  47. Paillet, Y.; Archaux, F.; Boulanger, V.; Debaive, N.; Fuhr, M.; Gilg, O.; Gosselin, F.; Guielbert, E. Snags and large trees drive higher tree microhabitat densities in strict forest reserves. For. Ecol. Manag. 2017, 389, 176–186. [Google Scholar] [CrossRef]
  48. Klopčić, M.; Simončić, T.; Bončina, A. Comparison of regeneration and recruitment of shade-tolerant and light-demanding tree species in mixed uneven-aged forests: Experiences from the Dinaric region. Forestry 2015, 88, 552–563. [Google Scholar] [CrossRef] [Green Version]
  49. Machar, I.; Vozenilek, V.; Simon, J.; Pechanec, V.; Brus, J.; Fulneček, P.; Vitek, T. Joining of the historical research and future prediction as a support tool for the assessment of management strategy for European beech-dominated forests in protected areas. Nat. Conserv. 2017, 22, 51–78. [Google Scholar] [CrossRef] [Green Version]
  50. Keren, S.; Medarević, M.; Obradović, S.; Zlokapa, B. Five Decades of Structural and Compositional Changes in Managed and Unmanaged Montane Stands: A case Study from South-East Europe. Forests 2018, 9, 479. [Google Scholar] [CrossRef] [Green Version]
  51. Sitzia, T.; Piazzi, C.; Barazzutti, T.; Campagnaro, T. Abandonment of timber harvesting favours European beech over silver fir: Evidence from Val Tovanella Nature Reserve in the southern Dolomites (Northern Italy). J. Prot. Mt. Areas Res. Manag. 2018, 10, 17–27. [Google Scholar] [CrossRef]
  52. Boncina, A. Comparison of structure and biodiversity in the Rajhenav virgin forest remnant and managed forest in the Dinaric region of Slovenia. Global Ecol. Biogeogr. 2000, 9, 201–211. [Google Scholar] [CrossRef]
  53. Holeksa, J.; Saniga, M.; Szwagrzyk, J.; Czerniak, M.; Staszynska, K.; Kapusta, P. A giant tree stand in the West Carpathians-An exception or a relic of formerly widespread mountain European forests? For. Ecol. Manag. 2009, 257, 1577–1585. [Google Scholar] [CrossRef]
  54. Petritan, I.C.; Commarmot, B.; Hobi, M.L.; Petritan, M.A.; Bigler, C.; Abrudan, I.V. Structural patterns of beech and silver fir suggest stability and resilience of the virgin forest Sinca in the Southern Carpathians, Romania. For. Ecol. Manag. 2015, 356, 184–195. [Google Scholar] [CrossRef]
  55. Kucbel, S.; Saniga, M.; Jaloviar, P.; Vencurik, J. Stand structure and temporal variability in old-growth beech-dominated forests of the northwestern Carpathians: A 40-years perspective. For. Ecol. Manag. 2012, 264, 125–133. [Google Scholar] [CrossRef]
  56. Fraver, S.; White, A.S.; Seymour, R.S. Natural disturbance in an old-growth landscape of Northern Maine, USA. J. Ecol. 2009, 97, 289–298. [Google Scholar] [CrossRef]
  57. Lingua, E.; Garbarino, M.; Borgogno Mondino, E.; Motta, R. Natural disturbance dynamics in an old-growth forest: From tree to landscape. Procedia Environ. Sci. 2011, 7, 365–370. [Google Scholar] [CrossRef]
  58. Klopcic, M.; Boncina, A. Recruitment of tree species in mixed selection and irregular shelterwood forest stands. Ann. For. Sci. 2012, 69, 915–925. [Google Scholar]
  59. Ní Dhubháin, A.; Cobanova, R.; Karppinen, H.; Mizaraite, D.; Ritter, E.; Slee, B.; Wall, S. The values and objectives of private forest owners and their influence on forestry behaviour: The implications for entrepreneurship. Small-Scale For. 2007, 6, 347–357. [Google Scholar] [CrossRef]
  60. Ingemarsson, F.; Lindhagen, A.; Eriksson, L. A typology of small-scale forest owners in Sweden. Scand. J. For. Res. 2006, 21, 249–259. [Google Scholar] [CrossRef]
  61. Haugen, K.; Karlsson, S.; Westin, K. New forest owners: Change and continuity in the characteristics of Swedish non-industrial private forest owners (NIPF Owners) 1990–2010. Small-Scale For. 2016, 15, 533–550. [Google Scholar] [CrossRef] [Green Version]
  62. Parviainen, J.; Frank, G. Protected forests in Europe approaches—Harmonising the definitions for international comparison and forest policy making. J. Environ. Manag. 2003, 67, 27–36. [Google Scholar] [CrossRef]
  63. Pirovano, A.R.; Zecca, G. Black Woodpecker Dryocopus martius habitat selection in the Italian Alps: Implications for conservation in Natura 2000 network. Bird Conserv. Int. 2014, 24, 299–315. [Google Scholar] [CrossRef] [Green Version]
  64. Hanewinkel, M.; Frutig, F.; Lemm, R. Economic performance of uneven-aged forests analysed with annuities. Forestry 2014, 87, 49–60. [Google Scholar] [CrossRef] [Green Version]
  65. Bettinger, P.; Boston, K.; Siry, J.P.; Grebner, D.L. Forest Management and Planning; Academic Press: London, UK, 2009; p. 331. ISBN 9780128094761. [Google Scholar]
  66. Kuuluvainen, T.; Angelstam, P.; Frelich, L.; Jõgiste, K.; Koivula, M.; Kubota, Y.; Lafleur, B.; Macdonald, E. Natural Disturbance-Based Forest Management: Moving Beyond Retention and Continuous-Cover Forestry. Front. For. Glob. Chang. 2021, 4, 629020. [Google Scholar] [CrossRef]
Figure 1. Study area and sample plot distribution.
Sustainability 13 09179 g001
Figure 2. Relative tree density (a), relative basal area (b) of four management regime types and (c) relative tree density of four management regime types according to DBH classes (first column—small diameter trees (DBH >10 and >30 cm); second column—medium diameter trees; third column—large diameter trees (>50 cm). Boxplot of LikeJ index (d) of four management regime types. Colors in figures (b,c) denote tree species as in legend for figure (a).
Sustainability 13 09179 g002aSustainability 13 09179 g002b
Figure 3. Diameter distributions as mean values of the researched management regime types: (a) UM—NPF; (b) M—S1F; (c) M—S2F; (d) M—PF.
Sustainability 13 09179 g003aSustainability 13 09179 g003b
Figure 4. Principal component analysis (74 plots) of site-stand-management variables obtained on the study area. Selected variable descriptors represented with arrows: NSNAG>50—number of standing dead trees larger than 50 cm DBH; VSNAG>50—the volume of standing dead trees larger than 50 cm DBH; SDW—the volume of overall standing dead trees; DW—Tot volume of overall dead wood (standing + lying); NL_BA_f—the basal area of died firs between two inventories; N_>70_T—number of very large trees; CRdef_f—crown defoliation of fir; DBH av—average breast diameter; BA_T—total basal area; NL_BA_b—the basal area of died beech trees between two inventories; CRdef_b—crown defoliation of beech; CUT_V_t/f/b—cut volume of overall/fir/beech+oth. b. between 2 inventories; RECR_t—number of recruited trees ha−1 year−1; BA_>70_T—the basal area of very large trees). Triangles denote unmanaged forests within the national parks; circles denote state and privately managed forests. Red and blue ellipses represent 95% confidence ellipses around group mean points.
Sustainability 13 09179 g004
Figure 5. Stand dynamics elements of researched management types: (a) change of growing volume (for each type of management regime first column represent first inventory and the second column represent 2019 inventory year); (b) annual changes in the number of trees per ha by DBH classes; (c) elements of gross increment between the two inventories (brown fill histograms denote natural loose, light green fill denotes net increment, dark green fill denotes net change and blue fill denotes cut); (d) species-specific and DBH structure of SDW (died trees) and cut (for each type of management regime first column represents species-specific and second column represents DBH structure: dark green fill denotes Silver fir/VLDT, light green fill denotes European beech/LDT, orange fill denotes Norway spruce/MDT and yellow fill denotes broadleaves/SDT).
Sustainability 13 09179 g005
Table 1. Overview of general characteristics for studied forests in Croatian Dinarides.
Type of Forest Management Regime
UnmanagedManaged-State 1Managed-State 2Managed-Private
AcronymUM-NPFM-S1FM-S2FM-PF
Dominant bedrockLimestone and dolomiteLimestone and dolomiteSilicateLimestone and dolomite
Dominant soil typeCambisols and limestons, luvisols, calcomelanosolCambisols and limestons, luvisols, calcomelanosolDystric cambisols and podzolsCambisols and limestons, luvisols, calcomelanosol
Dominant forest communityAbieti-FagetumAbieti-FagetumBlechno-AbietetumAbieti-Fagetum
Altitude a.s.l. (m): Mean (±SD)817 (124)973 (141)766 (159)895 (182)
Slope (%, °): Mean (±SD)15 (8)21 (8)18 (9)8 (4)
Share in total forest area *8.5583.733.174.55
% of fir/beech/other in basal aerea42/43/1547/34/1972/27/129/45/26
Number of sample plots1835165
Year of first measurement20072006–200720072006–2007
Number of sampled trees: F&S/B&OB165/170359/302170/9332/73
DBH F&S (cm): Mean (±SD) 52.8 (20.3)42.5 (19.5)52.0 (20.8)29.9 (18.5)
DBH B&OB (cm): Mean (±SD)36.1 (19.8)30.8 (17.1)36.0 (16.4)26.6 (13.0)
HT F&S (m): Mean (±SD)28.8 (8.5)21.9 (9.0)30.5 (9.5)18.1 (8.3)
HT B&OB (m): Mean (±SD)21.9 (7.4)19.0 (8.0)24.5 (8.1)18.9 (4.7)
Year of second measurement2019201920192019
Number of sampled trees: F&S/B&OB168/187295/301135/7633/75
DBH F&S (cm): Mean (±SD)56.4 (20.8)44.6 (18.7)56.9 (21.9)32.6 (18.4)
DBH B&OB (cm): Mean (±SD)37.7 (20.1)32.8 (17.2)34.6 (17.8)28.9 (13.1)
HT F&S (m): Mean (±SD)30.2 (8.3)22.6 (8.8)32.2 (9.2)19.1 (8.2)
HT B&OB (m): Mean (±SD)22.5 (7.0)19.6 (7.7)24.1 (8.0)19.7 (4.5)
Abbreviations: F&S—sampled S. fir and N. spruce; B&OB—sampled E. beech and other broadleaves; DBH—diameter at breast height of sampled trees; HT—tree height of sampled trees; SD—standard deviation; * The total forest area of two forest communities in Croatian Dinarides amounts 304,000 ha. Single-group selection accounts for 180,000 ha and even-aged and irregular management is represented by 120,000 ha [27].
Table 2. Overview of current stand structure characteristics for studied forests in Croatian Dinarides (2019 inventory year).
VariablesUM-NPFM-S1FM-S2FM-PF
Mean (CV)
Growing volume (m3 ha−1)
Total666A (0.27)459A (0.37)561 (0.51)507 (0.42)
Silver fir303 (0.59)228A (0.64)427AB (0.62)158B (1.18)
European beech268AB (0.50)168A (0.97)127B (0.87)266 (0.49)
Tree density (DBH ≥10 cm, ha−1)
Total478A (0.73)534BC (0.55)300BD (0.67)884ACD (0.33)
Silver fir114 (0.75)201 (1.01)148 (0.89)250 (1.23)
European beech267 (0.90)190A (1.10138B (0.90)431AB (0.29)
Stand basal area (DBH ≥ 10 cm, m2 ha−1)
Total48.9AB (0.25)40.3A (0.30)36.9B (0.44)47.2 (0.34)
Silver fir20.6 (0.57)19.8A (0.63)26.8A (0.53)14.0 (1.07)
European beech20.5AB (0.53)13.2A (0.87)9.5BC (0.79)20.9C (0.49)
Stand density index (SDI)777A (0.29)699 (0.32)573AB (0.44)892B (0.33)
Diameter structure
Small trees total (DBH 10–30 cm, ha−1)270.7A (1.08)335.9BC (0.87)153.8BD (1.01)688.6ACD (0.35)
Silver fir36.1 (1.54)98.4 (1.50)52.3 (1.93)194.9 (1.22)
European beech180.4A (1.26)120.6B (1.51)93.4C (1.19)350.8ABC (0.21)
Medium trees total (DBH 30–50 cm, ha−1)101.3A (0.51)153.0B (0.61)82.6BC (0.96)167.3AC (0.32)
Silver fir33.4 (0.97)76.8 (1.05)42.3 (1.14)43.3 (1.37)
European beech60.6 (0.94)59.3 (1.06)35.1 (1.30)69.6 (1.36)
Large trees total (DBH ≥ 50 cm, ha−1)84.8AB (0.51)43.2A (0.68)63.2 (0.73)28.0B (1.27)
Silver fir44.2AB (0.59)25.8AC (0.84)53.8C (0.86)12.2B (1.27)
European beech26.1AB (0.83)10.4A (1.56)9.4B (1.28)10.4 (1.38)
Very large trees total (DBH ≥ 70 cm, ha−1)23.0AB (0.62)9.8AC (1.35)22.3CD (1.03)1.6BD (2.24)
Silver fir14.1 (0.96)7.0A (1.54)22.3AB (1.03)1.6B (2.24)
European beech4.0 (1.41)1.1 (4.84)0.0 (0.00)0.0 (0.00)
Mean DBH total (cm)40.6AB (0.26)35.4ACD (0.27)40.6CE (0.37)25.9BDE (0.05)
Silver fir mean DBH (cm)47.5A (0.40)41.5B (0.41)50.9BC (0.40)26.2AC (0.75)
European beech mean DBH (cm)37.9A (0.34)32.3 (0.56)27.2 (0.61)23.8 A (0.15)
LikeJ index3.7AB (0.56)5.5AC (0.46)3.5CD (0.70)7.5BD (0.29)
Dead wood (m3 ha−1)
Standing dead wood: Total/Silver fir47.3/29.2A
(1.0/1.2)
31.8/25.2
(1.3/1.6)
63.4/46.6
2.3/2.5)
13.8/0.0A
(1.7/0.0)
Laying dead wood: Total/Conifers31.9/23.2
(1.3/1.6)
24.6/20.1
(1.5/1.7)
19.7/15.4
(1.7/1.6)
7.0/2.2
(0.8/1.2)
Crown defoliation (%)
Silver fir34.0A (0.30)31.2B (0.47)21.9AB (0.35)32.7 (0.42)
European beech25.6A (0.43)28.3B (0.58)16.1ABC (0.36)31.8C (0.37)
Stand regeneration
Seedling density total (h ≤ 130 cm, ha−1)8400 (1.25)13,596 (1.42)33,423 (1.22)7003 (1.32)
Seedling dens. Silver fir (h ≤ 130 cm, ha−1)2520 (1.40)3365 (1.37)7063 (1.80)796 (1.73)
Sapling density: Total (h > 130 cm and
DBH < 10 cm, ha−1)
6499 (1.21)2819 (1.43)6714 (1.26)3183 (0.83)
Sapling density: Silver fir (h > 130 cm
and DBH < 10 cm, ha−1)
928 (2.20)364 (2.45)1044 (2.47)1114 (0.96)
Note: In each row, same letters within columns (variables) denote statistically significant differences between variables. Likewise, for variables with different letters, difference is not statistically significant; CV = coefficient of variation.
Table 3. Past stand dynamics during period between two inventories (2006/2007–2019) for the studied forests in the Croatian Dinaric region.
VariablesType of Forest Management Regime
UM-NPFM-S1FM-S2FM-PF
Average time interval beetwen two inventories (number of vegetation periods—nVP)11.912.011.612.3
Growing volume in first inventory (m3 ha−1)
Total610.6468.3609.3461.3
Silver fir282.3249.4445.4141.9
European beech246.8155.8141.5219.5
Gross volume increment (m3 ha−1 year −1)
Total9.90 (0.31)7.60 (0.50)10.53 (0.43)9.02 (0.72)
Silver fir4.92 (0.64)4.23 (0.93)7.81 (0.59)3.49 (1.56)
European beech3.50 (0.60)2.20 (0.95)2.55 (0.75)3.54 (0.49)
Natural loose (m3 ha−1 year −1)
Total3.98 (1.00)2.65 (1.33)5.46 (2.34)1.12 (1.74)
Silver fir2.45 (1.22)2.10 (1.59)4.02 (2.50)-
European beech1.26 (2.50)0.23 (2.89)0.79 (2.90)1.12 (1.74)
Net volume increment (m3 ha−1 year −1)
Total5.93 (0.92)4.95 (1.13)5.07 (2.93)7.90 (0.92)
Silver fir2.47 (1.87)2.13 (2.50)3.80 (3.14)3.49 (1.56)
European beech2.24 (1.24)1.97 (1.04)1.76 (1.87)2.42 (1.32)
Cut (m3 ha−1 year −1)
Total1.08 (1.83)5.53 (1.82)9.01 (1.05)3.80 (2.20)
Silver fir0.71 (2.50)3.89 (2.00)5.30 (1.33)2.08 (2.17)
European beech0.37 (3.07)1.36 (2.46)2.80 (1.01)1.63 (2.24)
Net changes (m3 ha−1 year −1)
Total4.85 (1.21)−0.58 (18.40)−3.94 (5.71)4.10 (2.99)
Siler fir1.76 (2.86)−1.76 (4.66)−1.50 (11.96)1.41 (6.15)
European beech1.87 (1.56)0.61 (6.02)−1.04 (3.93)0.79 (5.98)
Δ SDI (% nVP−1)4.42−5.44−15.015.51
Δ LikeJ index (% nVP−1)−18.54−11.92−19.71−1.59
Recruitment: Total/Silver fir/European beech
trees ha−1 year−13.3/0.6/1.82.5/0.2/1.73.9/1.1/2.85.3/2.1/2.1
m3 ha−1 year−10.16/0.03/0.090.15/0.00/0.110.22/0.04/0.180.24/0.08/0.11
Mortality (% trees year −1)
Total1.90 (1.16)1.92 (1.11)2.48 (1.18)0.97 (0.71)
Silver fir1.94 (1.98)1.81 (1.50)2.06 (1.53)0.53 (1.50)
European beech2.34 (2.68)0.80 (2.04)7.81 (3.16)4.35 (1.66)
Note: CV = coefficient of variation.
Publisher’s Note: MDPI stays neutral with regard to jurisdictional claims in published maps and institutional affiliations.

