
Construction Schedule Risk Assessment and Management Strategy for Foreign General Contractors Working in the Ethiopian Construction Industry


Department of Civil and Construction Engineering, National Taiwan University of Science and Technology, Taipei 106335, Taiwan
*
Author to whom correspondence should be addressed.
Sustainability 2021, 13(14), 7830; https://doi.org/10.3390/su13147830
Submission received: 17 May 2021
/
Revised: 4 July 2021
/
Accepted: 7 July 2021
/
Published: 13 July 2021
Abstract
:Construction project schedule delay is a worldwide concern and especially severe in the Ethiopian construction industry. This study developed a Construction Schedule Risk Assessment Model (CSRAM) and a management strategy for foreign general contractors (FGCs). 94 construction projects with schedule delay were collected and a questionnaire survey of 75 domain experts was conducted to systematically select 22 risk factors. In CSRAM, the artificial neural network (ANN) inference model was developed to predict the project schedule delay. Integrating it with the Garson algorithm (GA), the relative weights of risk factors with rankings were calculated and identified. For comparison, the Relative Importance Index (RII) method was also applied to rank the risk factors. Management strategies were developed to improve the three highest-ranked factors identified using the GA (change order, corruption/bribery, and delay in payment), and the RII (poor resource management, corruption/bribery, and delay in material delivery). Moreover, the improvement results were used as inputs for the trained ANN to conduct a sensitivity analysis. The findings of this study indicate that improvements in the factors that considerably affect the construction schedule can significantly reduce construction schedule delays. This study acts as an important reference for FGCs who plan to enter or work in the Ethiopian construction industry.
1. Introduction
Project schedule delay is a common concern in the construction industry, and many researchers have stated the severity of this problem. As Sambasivan and Soon, and Sweis et al. [1,2] stated, project schedule overrun is a global phenomenon that involves extensive delays in construction projects. Complaints and disturbances regarding the construction schedule delays frequently occur in almost all projects [3]. Aziz and Abdel-Hakam [4] also stated that a project schedule delay is a persistent event in construction projects that often converts profitable projects into losing ventures. The construction industry in Ethiopia is booming and is the largest source of employment in the country, with millions of Ethiopians engaged in full- and part-time jobs in the construction industry. However, it is not exempt from the problem of schedule delay.
The contribution of the construction industry to the gross domestic product of Ethiopia has increased considerably, from 9% in 2015/2016 to 18% in 2017/2018. Currently, numerous projects are under construction, and the government has allocated billions of dollars to the sector. Unfortunately, schedule delay beyond the contractual time is a critical problem that the industry and many construction projects are facing. Koshe and Jha [5] stated that only 8% of construction projects in Ethiopia are completed on time, whereas the remaining 92% are delayed by up to 352% of the contractual time. Tadewos and Patel [6] reported that none of the Addis Ababa highway projects were completed on time. Kebede and Zhang [7] also stated that one of the most common inefficiencies in the industry is the construction schedule delay. Zinabu [8] expressed concerns and recommended to take immediate actions for the reduction of construction schedule delays.
To improve the problem of schedule delay, the most important task is to identify the factors causing the delay. Most of the research identified the risk factors based on literature reviews and questionnaire surveys of domain experts [1,2,4,5,8,9,10,11,12,13,14,15,16,17,18,19,20,21,22,23,24]. Due to the subjective judgements of the experts, the identified factors varied from among the different research outcomes. These inconsistent findings have caused project managers some difficulties in determining the right factors to consider for schedule delay reduction. As a result, improvements are often limited and fewer than what was expected, or even insignificant. Thus, a systematic and objective method for identifying the factors has become a key issue for the improvement of schedule delays.
Following this issue, the priority of identified factors for improvement is another task for reducing the delay more efficiently and significantly. The state-of-the-art methods used to rank the factors include the RII, Importance Index, and linear regression [1,4,5,8,9,10,11,12,13,14,15,16,17,18,20,21,22,23,24,25]. In most of the proposed methods, the basic assumption is that all of the factors are linear and independent. However, considering the complexity and uncertainty of the problems, the factors in fact involve interactive relationships that cause the schedule delay. Consequently, the assumption that the factors are linear and independent may not fully stand to represent the ranking results of the analysis. Hence, identifying and including the interactive relationships of the factors in the analysis for priority ranking will be the main concern to efficiently and significantly improve the schedule delay.
Currently, the RII is the most popular method used for identifying and ranking the factors that cause schedule delay [1,4,8,10,14,15,17,20,23]. The RII uses the subjective judgment of experts, which varies among experts who participated in a questionnaire survey to rank the risk factors. There is no validation to verify whether the risk factors identified and ranked by RII are the right sequential factors causing the delay. Moreover, the inconsistent ranking of different research results confuse construction managers as to which factors should be emphasized for schedule delay improvement.
As previously mentioned, schedule delay is a serious problem in Ethiopian construction projects. The researchers Koshe and Jha [5], Zinabu [8], and Gebrehiwet and Luo [23] investigated the causes of schedule delays using the importance index and the RII respectively for Ethiopian construction projects. The analysis results show that the findings on the key causes of schedule delays were inconsistent, which may be due to the disagreement of the participants’ subjective judgments. Additionally, it was difficult for construction managers to determine and focus on the most important risk factors necessary for schedule delay control.
Summarizing the issues discussed above, the main purpose of this research was to develop an integrated approach, the CSRAM, which would reduce to a minimum the subjective judgement made by experts in risk factor identification; concurrently, the interactive relationships of these factors in the analysis process were considered in order to enhance the consistency of factor ranking. The CSRAM includes three phases of analysis: risk factor selection and database development, factor ranking using AI, and comparison and sensitivity analysis for validation.
1.1. Risk Factor Selection and Database Development
Three steps—literature review, questionnaire survey of Ethiopian domain experts, and statistical analysis—were developed to select the risk factors systematically and objectively. Based on the literature review, the initial factors were identified. A questionnaire was used to survey the experts in order to determine the influencing factors specific to Ethiopia. According to the determined factors, the historical data of Ethiopian construction projects were collected to establish the database. Three statistical methods were then applied to analyze the correlation of the factors with the schedule delay based on the database. Using the statistical measure results, the final risk factors were selected.
1.2. Factor Ranking Using AI
The ANN, an AI technique with high problem-solving capability, was applied not only to solve the interactive, dependent, and non-linear relationships between the risk factors, but also to identify the mapping relationships of input and output variables [26,27]. However, the usefulness of ANN is limited by the difficulty in interpreting the “black box” of the computation process [27]. As Ibrahim [28] stated, the RW of an input variable is its contribution that predicts the dependent variable, and ANNs give only minimal information about the influence of input variables on the dependent variable. Thus, Garson [29] developed the GA to interpret the black box of ANN and identify the relative contributions of input variables with a trained ANN [28,30,31,32,33,34]. This study integrated ANN with GA to train the network based on the collected database in the first phase and calculate the RWs of risk factors respectively. According to the obtained RWs, the priority of factors causing schedule delay was then determined. Thus, instead of relying on the subjective judgements of experts, the consistency of factor ranking was enhanced.
1.3. Comparison and Sensitivity Analysis for Validation
In this study, the RII method was also used to rank the factors for comparison and validation. Based on the top three ranked factors identified by the CSRAM and RII, management strategies were developed to address the possible causes and methods of schedule delay reductions. A sensitivity analysis was subsequently conducted to validate the impact of the improved factors on the construction project delay. The top three ranked factors were then improved with the use of a 10% arithmetic increase sequence. Each of the improved results were updated and used as inputs for both methods to calculate the delay reductions in the collected cases. By comparing the average reductions of both methods, the validation of CSRAM was then achieved in terms of objectiveness and consistency.
The parties involved in construction projects are affected by schedule delays, and general contractors may face great losses without essential measures that could reduce these delays. The problems that FGCs face may be more severe than those of local companies with regard to project delays since they lack information about the Ethiopian construction industry. Zhi, H. and Ling, F., et al. [35,36] stated that contracting outside of one’s home country is typically regarded as a high-risk endeavor. With the application of the CSRAM, FGCs may improve on the identified risk factors according to the proposed management strategy and reduce the construction schedule delays significantly. Hence, the findings of this study may serve as an important reference for schedule control for the FGCs who plan to enter or are working in the industry.
2. Literature Review
2.1. GA
According to Xu et al. [26], computing the RWs of input variables is difficult due to a lack of understanding of the black box of ANNs. This section introduces GA to reveal the black box. GA uses the following equation to interpret the black box of ANN:
where RWik denotes the relative weight of input factors on the output , Wij denotes the connection weight between the ith input variable and the jth hidden neuron, and Wjk denotes the connection weight between the jth hidden neuron and the kth output variables [26].
GA partitions the hidden-output connection weights of each hidden neuron into components associated with each input neuron to determine the RWs of input variables [30]. A trained ANN containing three input neurons, four hidden neurons, and one output neuron is used as example for GA to calculate the RWs of the input variables. The connection weights of the hidden layers in the ANN architecture are presented in Table 1. The computation procedures of GA are as follows:
- For each hidden neuron i, multiply the absolute value of the hidden-output layer connection weight by the absolute value of the hidden-input layer connection weight for each input variable j, as presented in Table 2;
- For each hidden neuron, divide by the sum of all the input variables to obtain . For example, for hidden neuron 1, (see Table 3);
- For each input neuron, add all the products formed from the previous computations of . For example, (see Table 3);
- Divide by the sum of all the input variables. The RW of an input variable is obtained as a percentage by multiplying the resulting value after the aforementioned division by 100. For example, the relative importance of input neuron 1 or input factor 1 is (see Table 4).
2.2. Identify the Risk Factors That Cause Schedule Delay
This study reviewed 20 literatures and the factors considered to have caused schedule delays are summarized in Table 5. Due to the differences in the methods of identification and the national conditions, the factors vary from one literature to another; a total of 70 factors were identified and studied to improve the construction schedule delay. The diversity of factors have resulted in the confusion of construction managers regarding which efforts and concerns should be focused on and emphasized in order to improve schedule control. Thus, this study identified the factors shown at a frequency of three times or more in the literature reviews as the initial risk factors. A total of 26 factors, shown in Table 5, were identified at this stage. Two questionnaire surveys and three statistical analyses, illustrated in the following section, were conducted to select the final influencing factors specific to Ethiopia.
3. Research Methodology
3.1. Research Processes
The general procedures used to achieve the objectives of this study are displayed in Figure 1.
3.2. Data Collection and Establishment of the Initial Database
Two questionnaire surveys were used to collect data in this study. The data collection process involved two phases. In the first phase, a pilot questionnaire survey based on the 26 identified risk factors was conducted to determine whether the factors were relevant to this study area; to add risk factors not included in the survey. Fallahnejad [18] consulted 10 experts and Chan et al. [13] consulted 7 experts to determine the risk factors of construction schedule delays. Similarly, 10 Ethiopian domain experts from clients, contractors, and consultants were invited to participate in the pilot questionnaire survey of the study. They have a minimum of 11 years of experience on site with an average of 14.6 years in experience; their academic level and project locations were also considered. The experts suggested 18 additional risk factors and eliminated 3 identified risk factors. Therefore, on the basis of the experts’ feedback, a total of 41 risk factors specific to Ethiopia were determined.
In the second phase of data collection, a questionnaire survey was conducted to determine the impacts and the occurrence frequencies of the input risk factors as well as the output (i.e., project schedule delay). The adopted questionnaire consisted of three parts. The first part comprised questions on the background, including the years of experience and education level, of the participants (see Table 6).
The second part of the questionnaire survey comprised questions on the impact of the 41 determined risk factors. The experts indicated the impact of a particular risk factor by using a 5-point Likert scale with the following responses: very high, high, moderate, low, and very low. A total of 100 copies of the questionnaire survey were distributed online and offline, and 75 valid responses were obtained (response rate = 75%). The third part of the questionnaire survey comprised questions on the occurrences of the input risk factors as well as the output (project schedule delay). Researchers use subjective judgments to determine the occurrence of risk factors [5,11,13,18,19,24]. However, with subjective judgments, distinguishing risk factors that occur frequently (frequency-based factors) from risk factors that may occur only once in a project (binary-based factors) is difficult. For instance, “change orders” may occur several times in a single project and can thus be considered a frequency-based risk factor. However, “inappropriate type of project bidding and award” may occur only once during the bidding process and cannot occur in other stages. The risk factors of this type are called binary-based risk factors. Mohammed and Suliman [25] regarded all risk factors as binary-based and did not distinguish the risk factors that occur frequently in a project from those that occur only once. The risk factors determined in this study were categorized according to the frequency of their occurrence and labeled as frequency-based (26 factors) and binary-based (15 factors). Data on the occurrences of risk factors of 94 completed construction projects were collected from the field and relevant government offices. The schedule delay data of these 94 projects, including their planned and actual completion times, were also collected. The contractual time of the aforementioned construction projects ranged from 1 to 4 years, and the percentage of schedule delay ranged from 10% to 200%.
Data Preparation to Establish the Initial Database
To establish the database, the impacts and occurrence frequencies of input risk factors collected from the questionaire were used to calculate the input values of risk factors. The average risk factor impact assigned by the experts was calculated using Equation (2). Based on Equation (3), the product of the average impact and the occurrence of risk factors was obtained and used as input for the database. For example, if “change order” occurs five times in a project, its input value in the database is five times the average impact value. The input value of a binary-based risk factor was calculated as the average impact of the risk factor times 1, if the risk factor occurred in a project, and 0, if otherwise. The percentage of delay was the output value in the database and computed using Equation (4). For instance, if the project contractual time is 2 years and the time used to complete the project is 3 years, the output value (i.e., percentage of schedule delay) is computed as follows: (3/2–1) × 100% = 50%. For all 41 risk factors and 94 construction project cases, the same procedure was used to calculate the input and output values of the database. The developed database contains 41 input factors, 1 output, and 94 construction project cases. This database was established to be able to select the risk factors that have strong relationships with the project schedule delay.
The average risk factor impact is calculated as follows:
where is the average impact value, m represents the input factors, X represents the impact assigned to each factor by experts (ranging from 1 to 5), n is the total number of experts (75 in this study), and r is the number assigned to each of the experts (from 1 to 75).
The product of the average impact and the occurrence of risk factors is calculated using the following equation:
where I is the input value, o is the occurrence of risk factors, j is the number of projects (1 to 94), and m represents the input factors.
The percentage of delay is calculated as follows:
where AT is the actual time used to complete construction, PT is the planned time for construction, and y is the percentage of schedule delay.
3.3. Selection of Risk Factors with a Strong Influence on Schedule Delays in Ethiopian Construction Projects
Different risk factors have different influences on construction schedule delays. Doloi et al. [14] stated that the identification of critical factors that influence construction schedule delays is a crucial step in the accomplishment of a study. In this work, some of the 41 determined risk factors may have a strong influence on the percentage of the schedule delay (i.e., the output variable). Selecting these factors is essential for the success of this research. To select the risk factors that have a strong relationship with the output variable [37], three statistical methods—univariate selection, feature importance selection, and a correlation matrix with a heat map—were used [38]. Based on the statistical analysis results, shown in Table 7, the factor passing two out of the three statistical measures was selected as the final risk factor for this study. A total of 22 risk factors that have strong correlation relationship with the output of construction schedule delay were selected.
3.4. Establishment of the Final Database as well as ANN Training, Validation, and Testing
The final database contains 22 key contributing input factors, 1 output, and 94 historical cases were established. The information in this database was normalized [31,39] using Equation (5) to increase the prediction accuracy of ANN model training [31]. The data were then randomly split into training set and testing set. Subsequently, the ANN was used for training and testing the data sets. The training, validation, and testing processes were displayed in Figure 2. The figure illustrates a 10-fold cross-validation approach [26,39] that was used during the training and validation processes. Firstly, 90% of data (85 pieces) in the database were divided into 10 folds such that 90% of the data were used for training and the remaining 10% were used for validation. For each fold, the accuracy was measured using the coefficient of correlation, the root mean square error [37], the mean absolute percentage error, and the mean absolute error to assess the network quality for training and validation. Secondly, the remaining 10% of the data (9 pieces) were used for model testing. The parameters were also used to determine the testing performance.
where is the normalized value of a factor; is the actual value of a factor; and and are the maximum and minimum values of a factor, respectively.
3.5. Computing the RWs of Risk Factors Using GA
After training was completed, GA was used to determine the RWs of the risk factors by partitioning the connection weights of the trained ANN to rank the risk factors according to the following procedure:
- Determine of the selected risk factors by multiplying the absolute values of the hidden-output layer connection weights by hidden-input layer connection weights.
- Then the of the 22 selected risk factors were computed by dividing by the sum of all the input factors; for input factor 1, is calculated as follows:
- The of the risk factor is computed with the following formula, which is calculated from the previous computations of .
- Finally, the input neuron 1 (F1), which is expressed as a percentage, is computed as follows:
3.6. Determining the RII of Risk Factors
The RII is a popular technique that is applied by researchers to prioritize factors that cause construction schedule delays [1,4,10,14,15,17,20,23]. The following equation (Equation (9)) is used to determine the RII of the selected risk factors, and the factors with a higher RII have a greater influence on the project schedule.
In Equation (9), W is the weight assigned to each factor by the respondents (ranging from 1 to 5), A is the highest weight (5 in this study), and N is the total number of respondents (75 in this study).
3.7. Development of Management Strategies
Management strategies were developed in this study to improve the risk factors related to the owner, A/E, and contractor. Construction managers may implement the management strategies to reduce schedule delays in construction projects. The developed management strategies were used to improve the top three ranked risk factors identified by the GA and RII. A performance sensitivity analysis was then conducted using the improved risk factors.
3.8. Sensitivity Analysis
A sensitivity analysis was performed to detect the effect of risk factors on the output by assessing their sensitivity to the output. Mrzygłód et al. [40] stated that sensitivity analyses can be applied to identify the effects of the input factors of an ANN model on its output factor. The effects of the risk factors on the output was assessed in this study by improving the factors by 10%, 20%, 30%, and 40%. The sensitivity analysis was conducted using the output obtained from the trained ANN connection weight.
4. Model Implementation
The proposed CSRAM was implemented on the data collected from the fields and government offices. A total of 41 risk factors were determined on the basis of a literature review and a pilot questionnaire survey; after performing three statistical method analyses, 22 risk factors were selected to establish the final database using the 94 historical cases (see Table 8). The number of neurons is a crucial parameter in ANN model training. Overfitting might occur with an increase in the number of hidden neurons. This phenomenon reduces the RMSE in the training stage, but not in the validation stage [31]. Therefore, the optimum number of hidden neurons must be determined through trial and error [26]. In this study, the RMSEs of training and validation had minimum values when the number of hidden neurons was 11. Therefore, an ANN architecture with 22 input neurons that corresponded to 22 risk factors, 11 hidden neurons, and 1 output neuron was used (Figure 3). A 10-fold cross-validation approach was used during the training and validation processes, yielding average RMSE values of 0.1097 and 0.1108, respectively. After data training was completed, the GA was used to determine RWs by partitioning the connection weight of the ANN to rank the risk factors. The risk factors were also ranked according to the RII for comparison. Management strategies were developed to improve the top three ranked risk factors identified using the GA and RII. A sensitivity analysis was then performed using the improved risk factors. Finally, the CSRAM identified change orders, corruption/bribery, and delays in payment as the risk factors with the strongest influences on schedule delays.
4.1. Calculation of the RWs of the Selected Risk Factors by Using the GA
After ANN training was completed, the GA was employed to determine the RWs of the 22 selected risk factors. These factors were then ranked according to their RWs. The higher the RW of a risk factor, the higher the influence of the risk factor on schedule delay. The following procedure is performed to determine the RWs of the selected risk factors:
The RWs of 22 selected risk factors are shown in Table 12, which were obtained in the same manner.
The results of GA indicate that delays in material delivery have the weakest influence on schedule delay, whereas change orders have the strongest influence, followed by corruption/bribery and delays in payment (Table 12 and Figure 4). Change orders in a construction project can disturb the relationship between the owner and the contractor. Change orders may be reduced if clients and contractors appropriately manage these during the bidding process. Establishing a superior financial system can also minimize the causes of corruption. Contractors, especially those facing financial difficulties in implementing projects, may face problems due to delays in payment and may need to work with financial institutions to overcome these problems. Thus, a weak financial system and financial difficulties in the organization implementing the project can cause change orders, corruption, and delays in payment.
4.2. Calculation of the RII of the Selected Risk Factors
RII of the risk factor is calculated using Equation (9). The RII results indicate that construction method has the weakest influence on schedule delays. Moreover, poor resource management, corruption/bribery, and delays in material delivery were the top three factors influencing schedule delays (Table 12 and Figure 5). Many contractors with limited experience are currently engaged in the country, perhaps resulting in poor resource management due to a lack of contractor experience. Corruption has the second-strongest influence on schedule delays according to the GA and RII results. Gebrehiwet and Luo [23] also identified corruption as a major cause of construction project schedule delays in Ethiopia. The source of corruption in the construction sector is complex; this corruption not only reduces the construction quality but may also cause project failure. A lack of trust and accountability may be the cause of corruption, and strong law enforcement is a crucial mechanism in its reduction; all stakeholders must work to combat corruption in the Ethiopian construction industry.
4.3. Develop Management Strategies for Improving the Top Three Ranked Risk Factors
Management strategies addressing the possible causes and methods for reducing change orders, corruption/bribery, delays in payment, poor resource management, and delays in material delivery were developed (Table 13). For example, “owner interest to replace with other materials” may be the cause for a change order that is related to the owner, and the proposed improvement is “owners must decide the materials before bidding”. FGCs currently working in the industry can implement the developed management strategies to maintain project schedules. Based on the management strategies, the factors were improved and then compared in order to identify the risk factors with the highest influence on construction schedule delays through a sensitivity analysis. The analysis results validate whether the GA or RII is more accurate in indicating the risk factors that have strong influences on construction schedule delays in Ethiopian construction projects.
4.4. Sensitivity Analysis
The GA results indicate that change order, corruption, and delay in payment are the top three factors affecting construction schedule delays, and the RII results indicate that poor resource management, corruption, and delay in material delivery are the top three factors affecting schedule delays in Ethiopian construction projects (Table 12). Different risk factors had different rankings in the GA and RII results, as displayed in Figure 4 and Figure 5. In the GA results, change orders and delays in payment had the highest and third-highest RWs, respectively, for schedule delays; however, in the RII results, these factors ranked in 9th and 19th. Conversely, poor resource management and delays in material delivery were ranked first and third in the RII results but had nonsignificant RWs in the GA results. Only corruption is in the top three ranked risk factors in both the GA and RII results. Therefore, it is important to further compare the influences of the risk factors to identify which order of the risk factors is correct. To facilitate this comparison, a sensitivity analysis was performed after improving the risk factors in order to identify the risk factors that strongly influence construction schedule delays.
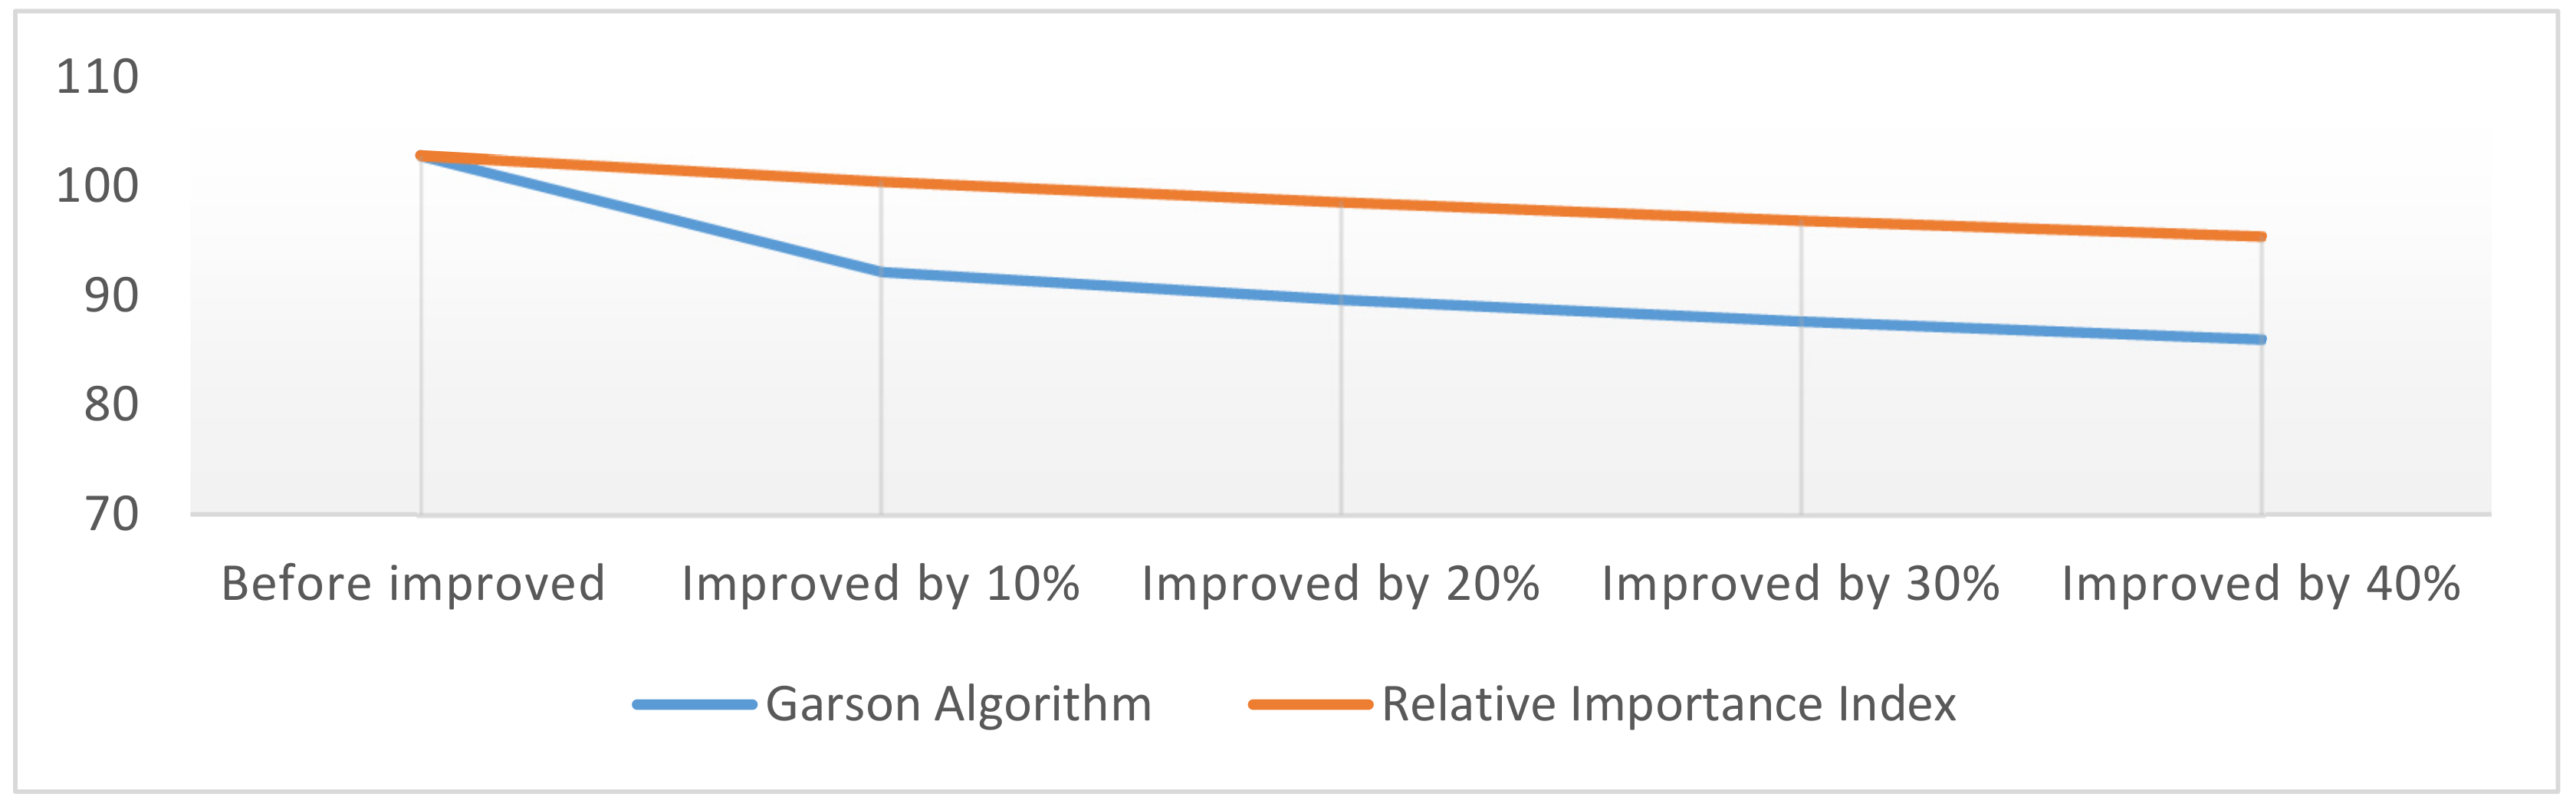
In Table 14, the average percentage schedule delay of the 94 cases, without improvements in the top three ranked risk factors, was 102.85%. A sensitivity analysis was performed using the improved risk factors in the database without changing the input values of the others, and the schedule delay was predicted with the output of the trained ANN. The risk factors were assumed to improve (i.e., decrease) by 10%, 20%, 30%, and 40%. These changes in input values can affect the output. Gevrey [30] stated that the input factors whose changes affect the output the most have the greatest influence on the output. First, a 10% improvement in the top three risk factors ranked by GA (F2, F10, and F1) were updated in the database, and the schedule delays of the 94 cases were predicted. This process was repeated for the 20%, 30%, and 40% improvements in the top three factors. For each improvement level, the average percentage of schedule delay was noted. For 10%, 20%, 30%, and 40% improvements of the top three risk factors ranked by GA, the average schedule delays of the 94 cases were 92.25%, 89.7%, 87.72%, and 86.08%, respectively. The aforementioned steps were also performed for the top three risk factors in the RII results (F23, F10, and F7). For 10%, 20%, 30%, and 40% improvements of these factors, the average schedule delays were 100.52%, 98.62%, 96.95%, and 95.50%, respectively.
Taking the 10% improvement as an example, the top three ranked risk factors in the GA and RII analyses resulted in the reduction of the average schedule delay from 102.85% to 92.25% and from 102.85% to 100.52%, respectively (Table 14). The schedule delay obtained from the 10% improvement of the top-ranked risk factors in the GA analysis was lower than that obtained from the 40% improvement in the top three ranked risk factors in the RII analysis. Figure 6 displays the decreasing trends of the average percentage of schedule delay (represented by sloped lines) after improvements in the risk factors. The sloped line representing the improvement in the top three ranked risk factors in the GA results is considerably lower than that of the RII results. Thus, the top three ranked risk factors identified by GA were more sensitive to the schedule delay than the factors identified by RII. This finding validates that the proposed method is more practical and can accurately identify the main risk factors that cause construction schedule delays in Ethiopia.
5. Conclusions
In this study, the integrated method, CSRAM, was developed to systematically and objectively identify and rank the risk factors for the improvement of construction schedule delay. By applying CSRAM, the subjective judgement of experts for risk factor identification was reduced to a minimum; likewise, the interactive relationships of the factors in the analysis process were considered and measured in order to enhance the consistency of factor ranking. CSRAM includes these three phases of analysis: risk factor selection and database development, factor ranking using AI, and comparison and sensitivity analysis for validation.
In the phase of risk factor selection and database development, three steps—literature review, two questionnaire surveys of Ethiopian domain experts, and three statistical analyses—were developed to select the risk factors for this study. The initial 26 factors were identified according to the literature reviews. A total of 41 influencing factors specific to Ethiopia were determined though the pilot questionnaire survey of experts, whereas information on 94 construction projects was collected to establish the database. In total, 75 expert questionnaire surveys were conducted to identify the impacts of the factors. Three statistical methods, including univariate selection, feature importance selection, and a correlation matrix with a heat map, were applied to analyze the correlation of the factors with the schedule delay. A total of 22 final risk factors were selected for the factor ranking analysis.
Secondly, ANN was integrated with GA, thus solving the interactive and non-linear relationships of the risk factors, was developed to train the network and calculate the RWs of the risk factors with ranking. The top three ranked factors identified were change order, corruption/bribery, and delay in payment.
Thirdly, the RII method was also used for the factor ranking comparison and was able to identify the factors of poor resource management, corruption/bribery, and delay in material delivery in sequence. According to the identified factors, the management strategies related to the possible causes and methods of schedule delay control were addressed. Moreover, a sensitivity analysis with a 10% arithmetic increase sequence of the top three ranked factors was conducted to validate the sensitivities of the impact of improved factors to the construction project delay. For 10%, 20%, 30%, and 40% improvements in the top three risk factors ranked by GA, the average schedule delays in 94 cases were 92.25%, 89.7%, 87.72%, and 86.08%, respectively. For RII, the average schedule delays were 100.52%, 98.62%, 96.95%, and 95.50%, respectively. The 92.25% schedule delay obtained from the 10% improvement in the GA analysis was lower than that obtained from the 40% improvement in the RII analysis, which was at 95.5%. The improvements in the top three ranked risk factors identified by GA proved to be more sensitive and significant to the schedule delay reductions, whereas the validation of CSRAM in terms of objectiveness and consistency was achieved.
Schedule delay is a serious and essential problem in the Ethiopian construction industry. However, through CSRAM, this study is able to provide an objective and consistent approach for identifying the key causes of schedule delays. Thus, construction managers can spend their effort focusing on the critical risk factors for substantially improving the schedule delay. Moreover, for FGCs suffering project delays due to the lack of information on the Ethiopian construction industry, this study not only provides management strategies as guidelines for the reduction of schedule delays, but also serves as an important reference in schedule control for the FGCs who plan to enter or are working in the Ethiopian construction industry. The database of 94 construction projects collected in this study is also a valuable resource for future studies related to the issue of construction delay.
Author Contributions
Conceptualization, M.-Y.C.; data curation, M.H.D.; formal analysis, M.-Y.C. and M.H.D.; investigation, M.H.D.; methodology, M.-Y.C. and M.H.D.; resources, M.-Y.C.; software, M.H.D.; supervision, M.-Y.C.; validation, M.-Y.C.; visualization, M.H.D.; writing—original draft, M.H.D.; writing—review & editing, M.-Y.C. Finally, all authors have read and agreed to the published version of the manuscript.
Funding
This research received no external funding.
Data Availability Statement
The data presented in this study are available upon reasonable request from the corresponding author. The data are not publicly available due to the data also collected from government offices for research use only.
Conflicts of Interest
The authors declare no conflict of interest.
Abbreviations
| AI | Artificial Intelligence |
| ANN | Artificial Neural Network |
| CSRAM | Construction Schedule Risk Assessment Model |
| FGC | Foreign General Contractors |
| A/E | Architectural and Engineering |
| GA | Garson Algorithm |
| RW | Relative Weight |
| RII | Relative Importance Index |
| RMSE | Root Mean Square Error |
References
- Sambasivan, M.; Soon, Y.W. Causes and effects of delays in Malaysian construction industry. Int. J. Project Manag. 2007, 25, 517–526. [Google Scholar] [CrossRef]
- Sweis, G.; Sweis, R.; Abu Hammad, A.; Shboul, A. Delays in construction projects: The case of Jordan. Int. J. Project Manag. 2008, 26, 665–674. [Google Scholar] [CrossRef]
- Orangi, A.; Palaneeswaran, E.; Wilson, J. Exploring Delays in Victoria-Based Australian Pipeline Projects. In Proceedings of the Twelfth East Asia-Pacific Conference on Structural Engineering and Construction Procedia Engineering, Hong Kong, China, 26–28 January 2011; Volume 14, pp. 874–881. [Google Scholar]
- Aziz, R.F.; Abdel-Hakam, A.A. Exploring delay causes of road construction projects in Egypt. Alex. Eng. J. 2016, 55, 1515–1539. [Google Scholar] [CrossRef] [Green Version]
- Koshe, W.; Jha, N.K. Investigating Causes of Construction Delay in Ethiopian Construction Industries. J. Civ. Constr. Environ. Eng. 2016, 1, 18–29. [Google Scholar]
- Tadewos, S.G.; Patel, D. Factors influencing Time and Cost Overruns in Road Construction Projects: Addis Ababa, Ethiopian Scenario. Int. J. Eng. Technol. 2018, 5, 177–180. [Google Scholar]
- Kebede, S.D.; Zhang, T. Enforcement of legal remedies against construction projects time overrun in Ethiopia: A critical appraisal. Heliyon 2020, 6, e05126. [Google Scholar] [CrossRef]
- Zinabu, T.Z. Construction Projects Delay and Their Antidotes: The Case of Ethiopian Construction Sector. Int. J. Econ. Bus. Res. 2016, 5, 113–122. [Google Scholar]
- Al-Momani, A.H. Construction delay: A quantitative analysis. Int. J. Project Manag. 2000, 18, 51–59. [Google Scholar] [CrossRef]
- Odeh, A.M.; Battaineh, H.T. Causes of Construction delay: Traditional contracts. Int. J. Project Manag. 2002, 20, 67–73. [Google Scholar] [CrossRef]
- Assaf, S.A.; Al-Hejji, S. Causes of delay in large construction projects. Int. J. Project Manag. 2006, 24, 349–357. [Google Scholar] [CrossRef]
- El-Razek, M.E.A.; Bassioni, H.A.; Mobarak, A.M. Causes of Delay in Building Construction Projects in Egypt. J. Constr. Eng. Manag. 2008, 134, 831–841. [Google Scholar] [CrossRef] [Green Version]
- Chan, D.W.M.; Chan, A.P.C.; Lam, P.T.I.; Yeung, J.Y.; Chan, J.H.L. Risk ranking and analysis in target cost contracts: Empirical evidence from the construction industry. Int. J. Project Manag. 2011, 29, 751–763. [Google Scholar] [CrossRef] [Green Version]
- Doloi, H.; Sawhney, A.; Iyer, K.C.; Rentala, S. Analysing factors affecting delays in Indian construction projects. Int. J. Project Manag. 2012, 30, 479–489. [Google Scholar] [CrossRef]
- Kazaz, A.; Ulubeyli, S.; Tuncbilekli, N.A. Causes of Delays in Construction Projects in Turkey. J. Civ. Eng. Manag. 2012, 18, 426–435. [Google Scholar] [CrossRef] [Green Version]
- Alinaitwe, H.; Apolot, R.; Tindiwensi, D. Investigation into the Causes of Delays and Cost Overruns in Uganda’s Public Sector Construction Projects. J. Constr. Dev. 2013, 18, 33–47. [Google Scholar]
- Aziz, R.F. Ranking of delay factors in construction projects after Egyptian revolution. Alex. Eng. J. 2013, 52, 387–406. [Google Scholar] [CrossRef] [Green Version]
- Fallahnejad, M.H. Delay causes in Iran gas pipeline projects. Int. J. Project Manag. 2013, 31, 136–146. [Google Scholar] [CrossRef]
- Kuo, Y.-C.; Lu, S.-T. Using fuzzy multiple criteria decision making approach to enhance risk assessment for metropolitan construction projects. Int. J. Project Manag. 2013, 31, 602–614. [Google Scholar] [CrossRef]
- Gardezi, S.S.S.; Manarvi, I.A.; Gardezi, S.J.S. Time Extension Factors in Construction Industry of Pakistan. In Proceedings of the Fourth International Symposium on Infrastructure Engineering in Developing Countries, Karachi, Pakistan, 11–13 December 2013; Volume 77, pp. 196–204. [Google Scholar]
- Marzouk, M.M.; El-Rasas, T.I. Analyzing delay causes in Egyptian construction projects. J. Adv. Res. 2014, 5, 49–55. [Google Scholar] [CrossRef] [Green Version]
- Al-Hazim, N.; Salem, Z.A.; Ahmad, H. Delay and Cost Overrun in Infrastructure Projects in Jordan. In Proceedings of the 7th International Conference on Engineering, Project, and Production Management, Bialystok, Poland, 21–23 September 2017; Volume 182, pp. 18–24. [Google Scholar]
- Gebrehiwet, T.; Luo, H. Analysis of Delay Impact on Construction Project Based on RII and Correlation Coefficient: Empirical Study. In Proceedings of the Creative Construction Conference 2017, CCC 2017, Primosten, Croatia, 19–22 June 2017; Volume 196, pp. 366–374. [Google Scholar]
- Ibrahim, M. Schedule Delay in Saudi Arabia Road Construction Projects: Size, Estimate, Determinants and Effects. Int. J. Archit. Eng. Constr. 2017, 6, 51–58. [Google Scholar]
- Mohammed, R.M.M.; Suliman, S.M.A. Delay in Pipeline Construction Projects in the Oil and Gas Industry: Part 2 (Prediction Models). Int. J. Constr. Eng. Manag. 2019, 8, 37–45. [Google Scholar]
- Xu, M.; Wong, T.C.; Chin, K.S. Modeling daily patient arrivals at Emergency Department and quantifying the relative importance of contributing variables using artificial neural network. Decis. Support Syst. 2013, 54, 1488–1498. [Google Scholar] [CrossRef]
- Zhang, Z.; Beck, M.W.; Winkler, D.A.; Huang, B.; Sibanda, W.; Goyal, H. Opening the black box of neural networks: Methods for interpreting neural network models in clinical applications. Ann. Transl. Med. 2018, 6, 216. [Google Scholar] [CrossRef]
- Ibrahim, O.M. A comparison of methods for assessing the relative importance of input variables in artificial neural networks. JASR 2013, 9, 5692–5700. [Google Scholar]
- Garson, G.D. Interpreting neural network connection weights. Artif. Intell. Expert 1991, 6, 47–51. [Google Scholar]
- Gevrey, M.; Dimopoulos, I.; Lek, S. Review and comparison of methods to study the contribution of variables in artificial neural network models. Ecol. Modell. 2003, 160, 249–264. [Google Scholar] [CrossRef]
- Chen, J.; Chen, W. Diagnostic analysis of a small-scale incinerator by the Garson index. Inf. Sci. 2008, 178, 4560–4570. [Google Scholar] [CrossRef]
- Baruah, D.; Baruah, D.C.; Hazarika, M.K. Artificial neural network based modeling of biomass gasification in fixed bed downdraft gasifiers. Biomass Bioenergy. 2017, 98, 264–271. [Google Scholar] [CrossRef]
- Korteby, Y.; Kristó, K.; Sovány, T.; Regdon, G. Use of machine learning tool to elucidate and characterize the growth mechanism of an in-situ fluid bed melt granulation. Powder Technol. 2018, 331, 286–295. [Google Scholar] [CrossRef] [Green Version]
- Zhang, Y.; Gao, X.; Smith, K.; Inial, G.; Liue, S.; Conil, L.B.; Pan, B. Integrating water quality and operation into prediction of water production in drinking water treatment plants by genetic algorithm enhanced artificial neural network. Water Res. 2019, 164, 114888. [Google Scholar] [CrossRef]
- Zhi, H. Risk management for overseas construction projects. Int. J. Project Manag. 1995, 13, 231–237. [Google Scholar] [CrossRef]
- Ling, F.Y.Y.; Low, S.P.; Wang, S.Q.; Lim, H.H. Key project management practices affecting Singaporean firms’ project performance in China. Int. J. Project Manag. 2009, 27, 59–71. [Google Scholar] [CrossRef]
- Cheng, M.-Y.; Wu, Y.-W.; Syu, R.-F. Seismic Assessment of Bridge Diagnostic in Taiwan Using the Evolutionary Support Vector Machine Inference Model (ESIM). Appl. Artif. Intell. 2014, 28, 449–469. [Google Scholar] [CrossRef]
- Dogan, G.; Alotaibi, N.; Sahin, E.; Ertas, S.S.; Cay, I.; Keskin, S.R.; Heijnen, M.J.; Ricanek, K. Using Artificial Intelligence to Predict Fall-risk During Adaptive Locomotion in Humans. In Proceedings of the International Conference on Artificial Intelligence & Modern Assistive Technology (ICAIMAT), Riyadh, Saudi Arabia, 24–26 November 2020; pp. 1–7. [Google Scholar]
- Cheng, M.-Y.; Cao, M.-T. Accurately predicting building energy performance using evolutionary multivariate adaptive regression splines. Appl. Soft Comput. 2014, 22, 178–188. [Google Scholar] [CrossRef]
- Mrzygłód, B.; Hawryluk, M.; Janik, M.; Wożeńska, I. Sensitivity analysis of the artificial neural networks in a system for durability prediction of forging tools to forgings made of C45 steel. Int. J. Adv. Manuf. Technol. 2020, 109, 1385–1395. [Google Scholar] [CrossRef]
Figure 1.
Research flowchart.
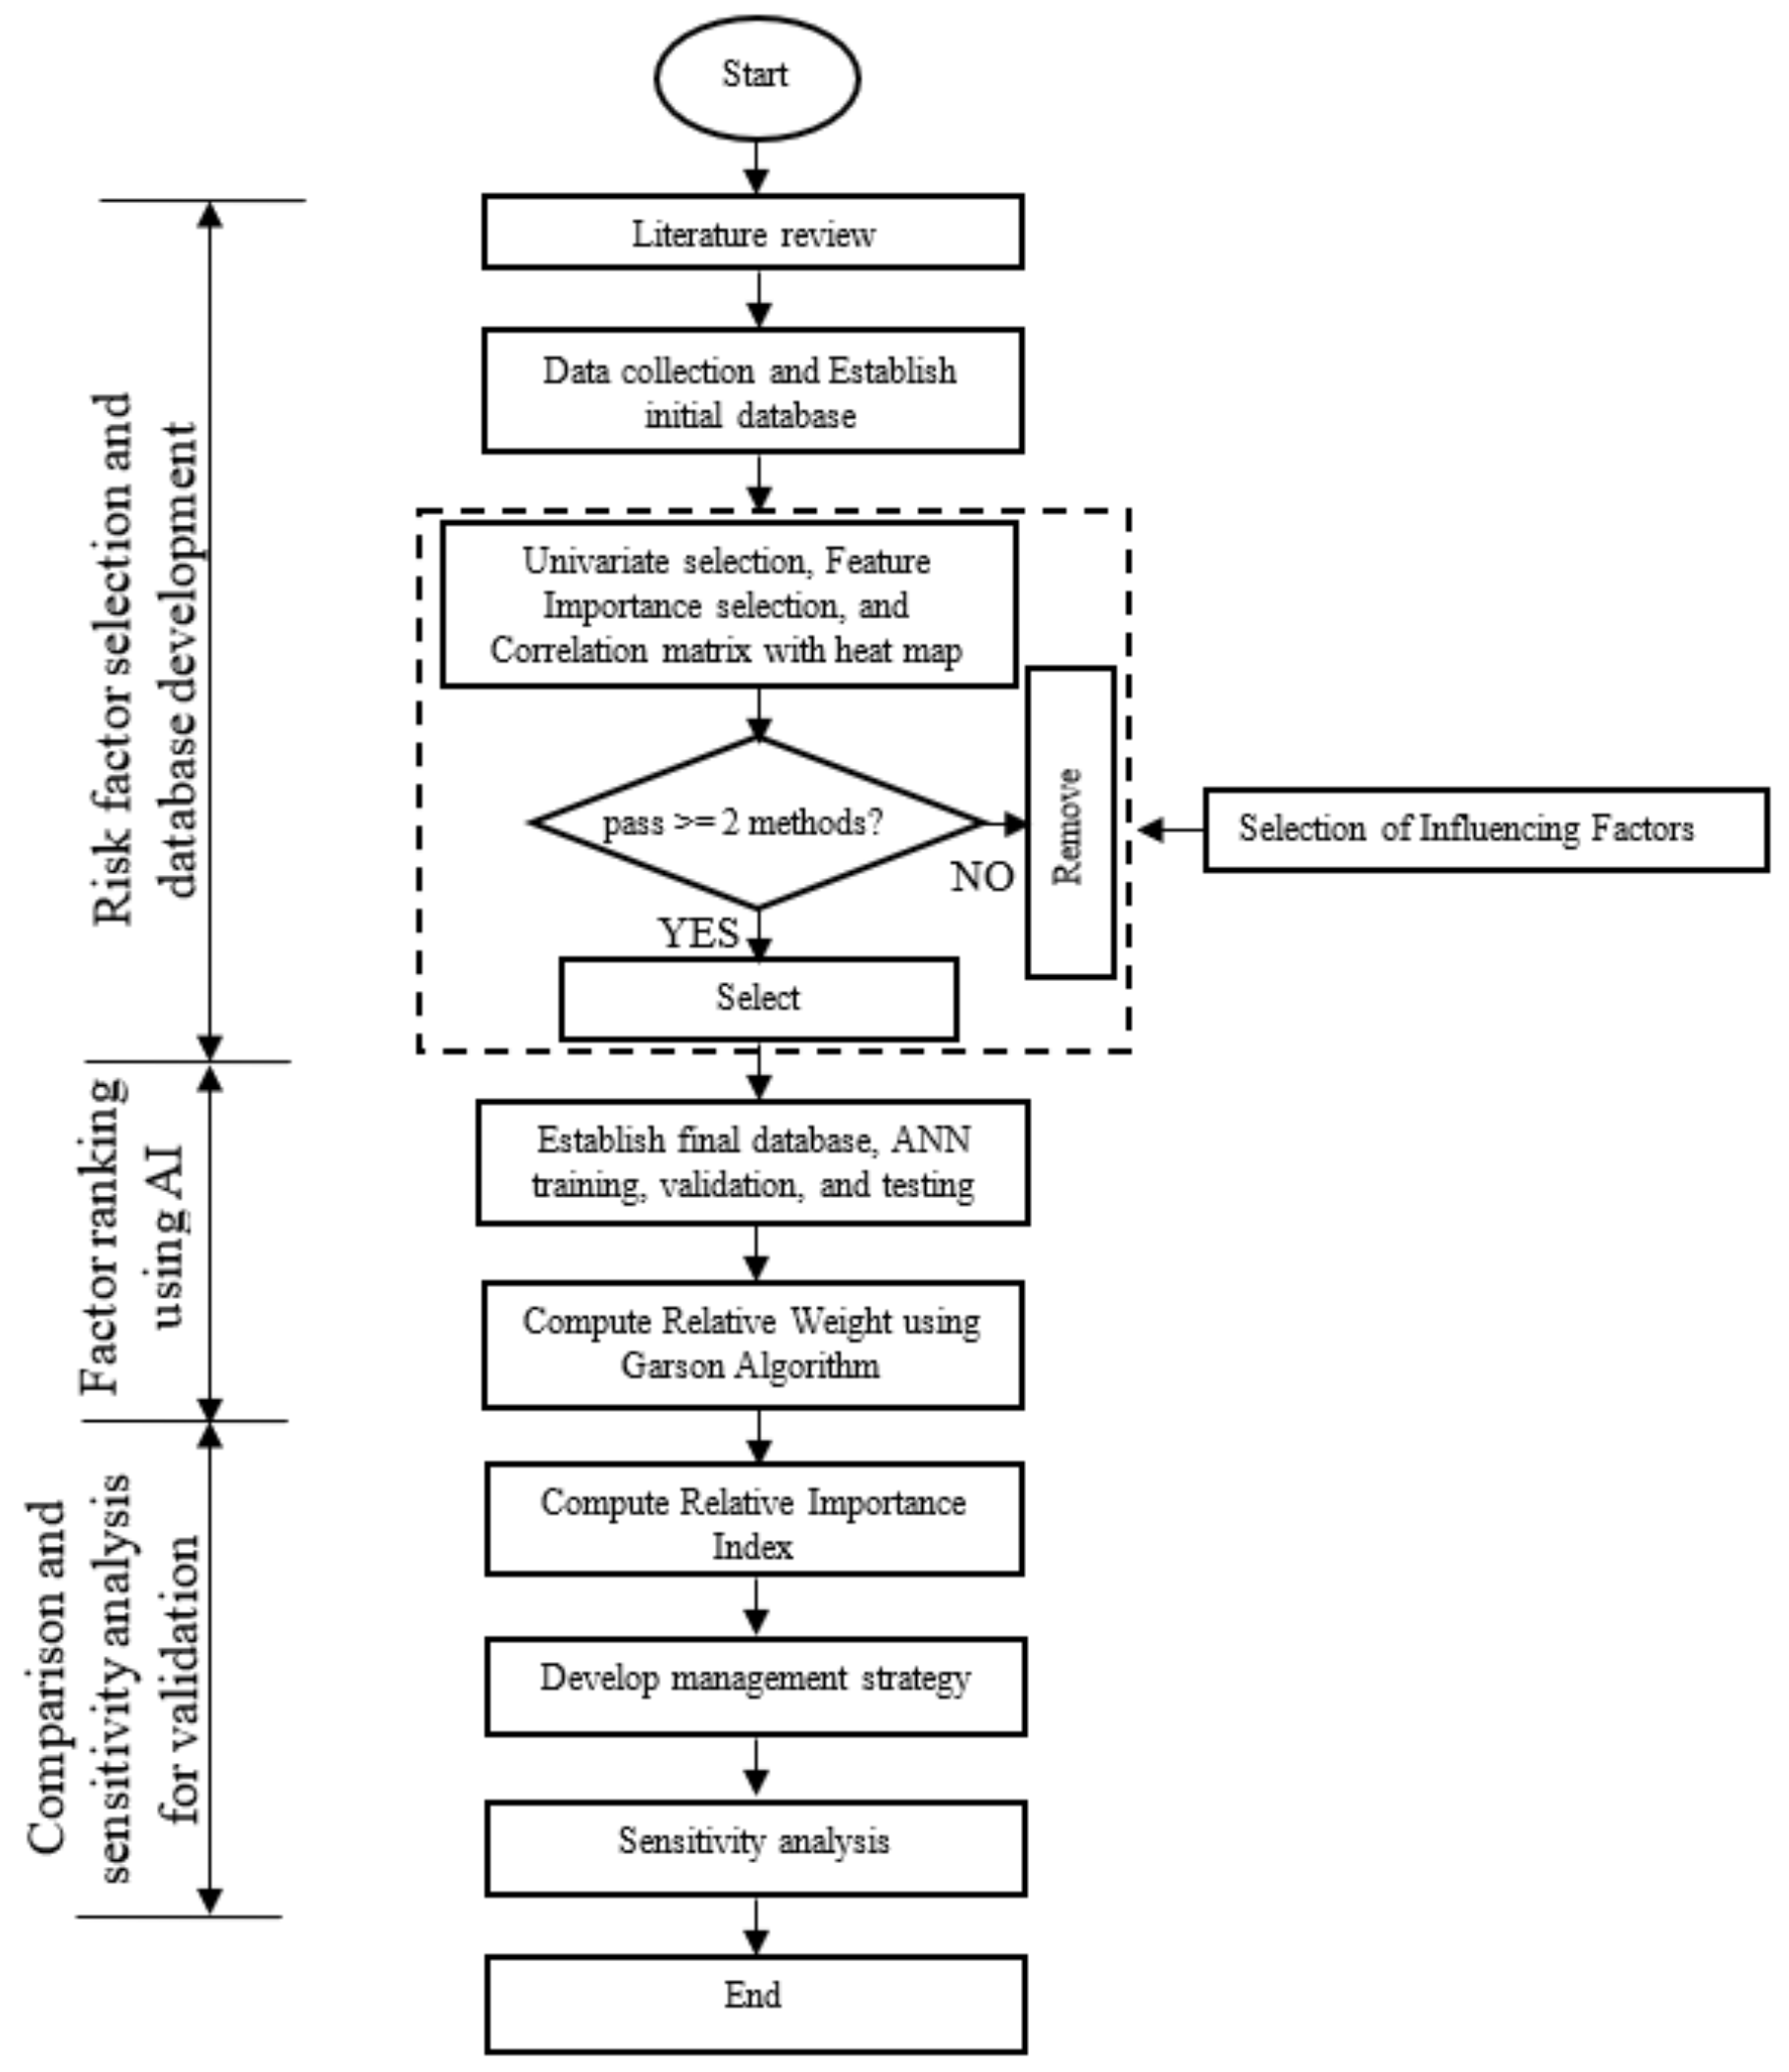
Figure 2.
Flowchart for ANN training, validation, and testing.

Figure 3.
ANN architecture used in this study.

Figure 4.
RWs of the selected factors obtained using the GA.
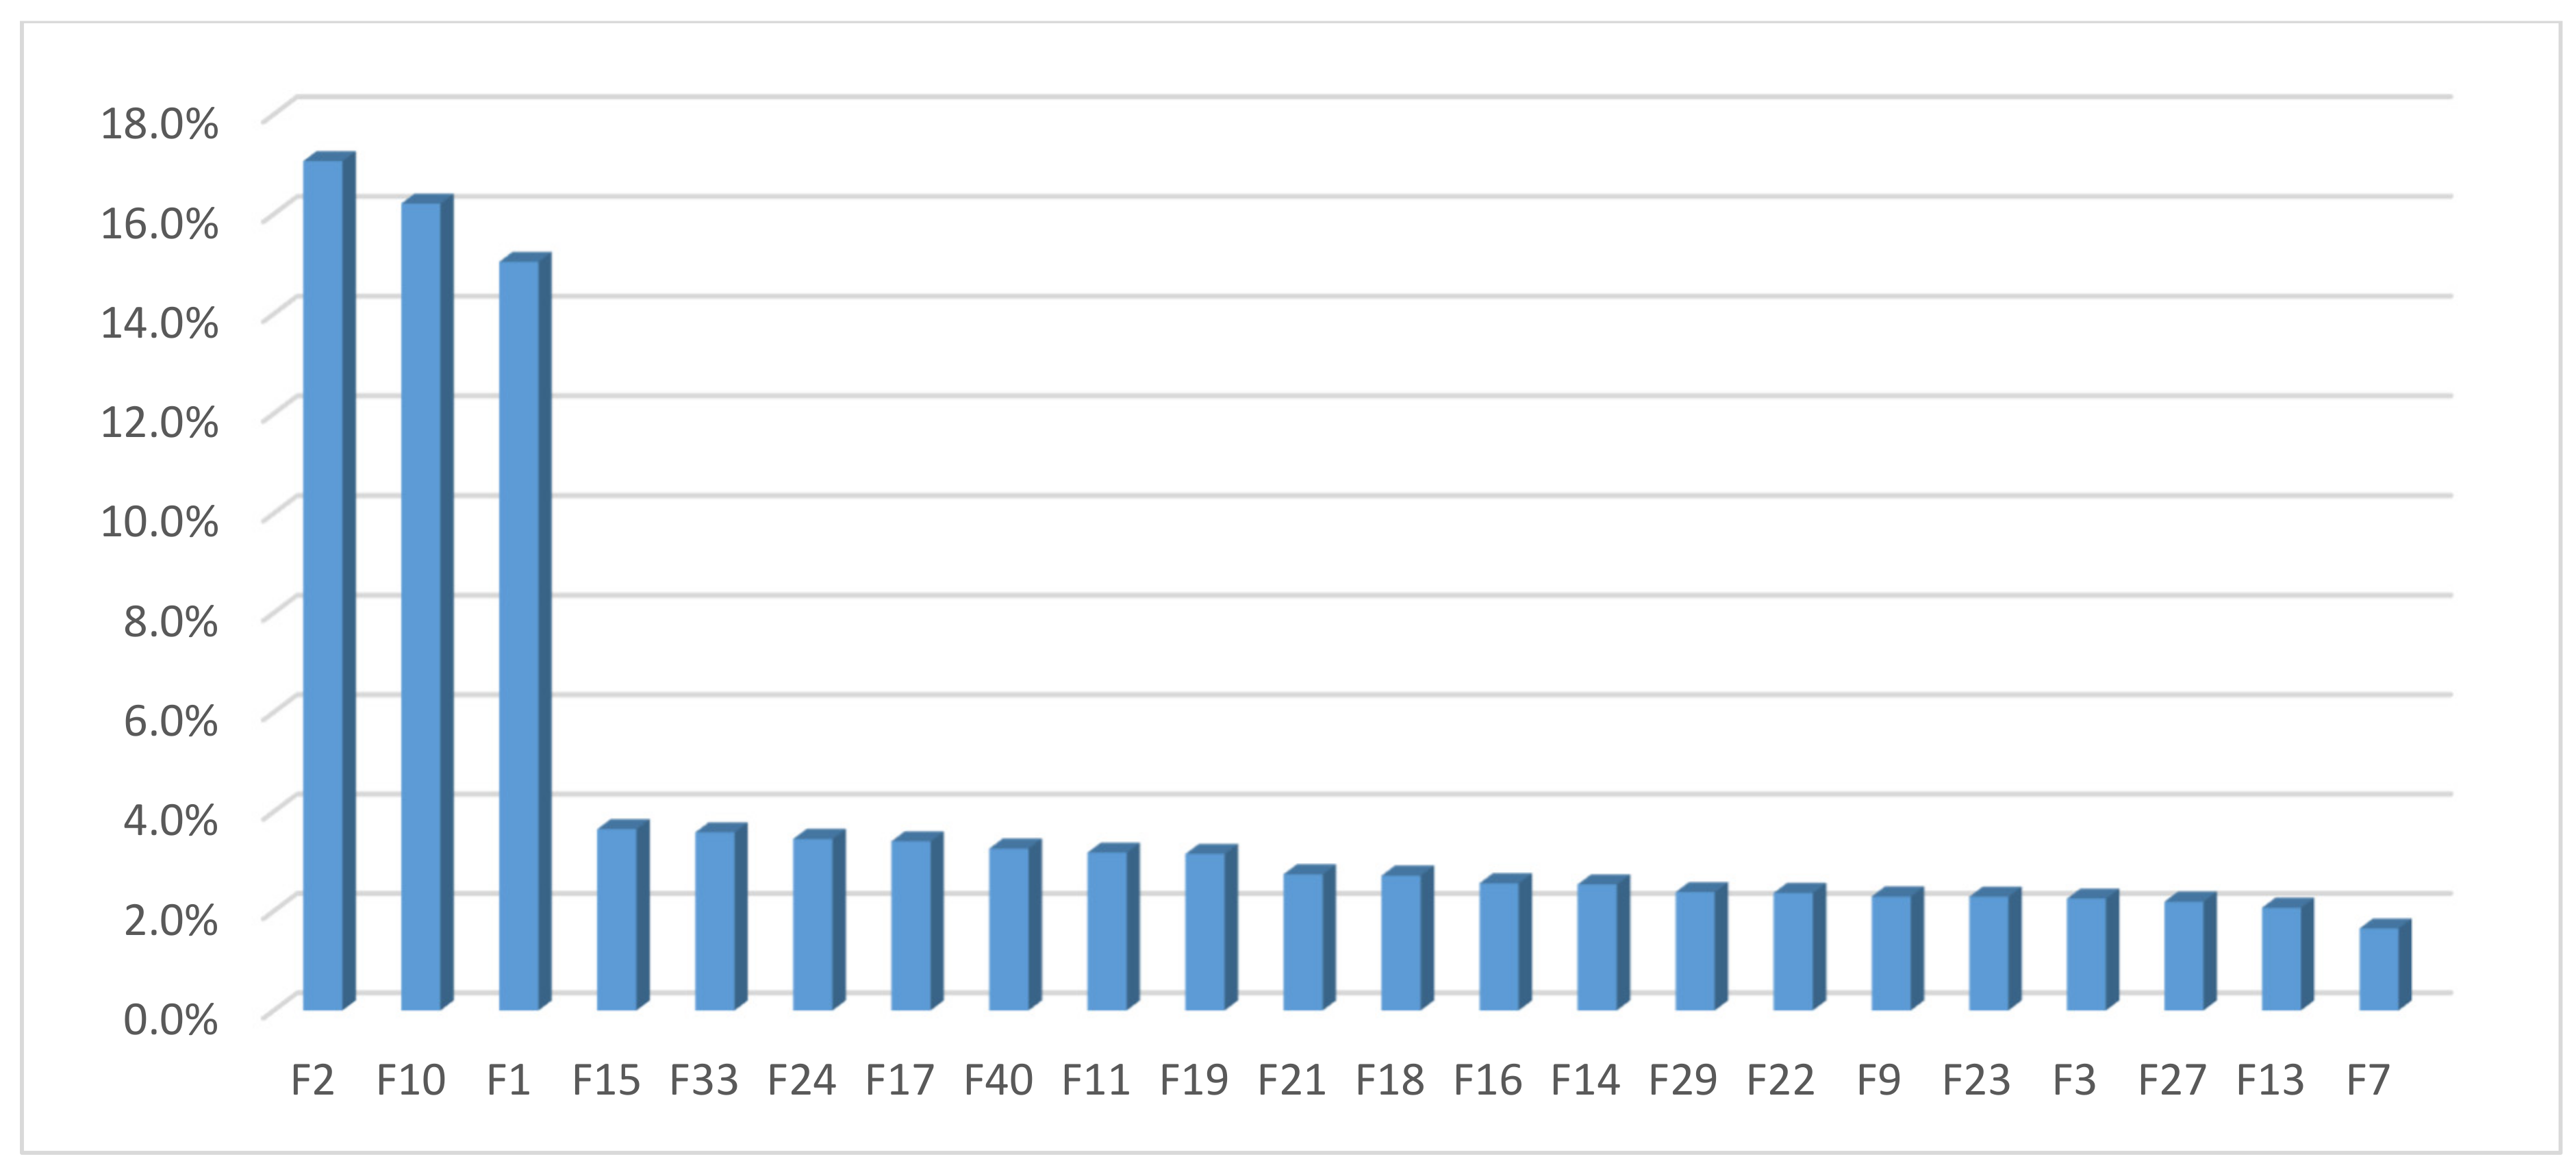
Figure 5.
Rankings of the selected risk factors according to their RIIs.
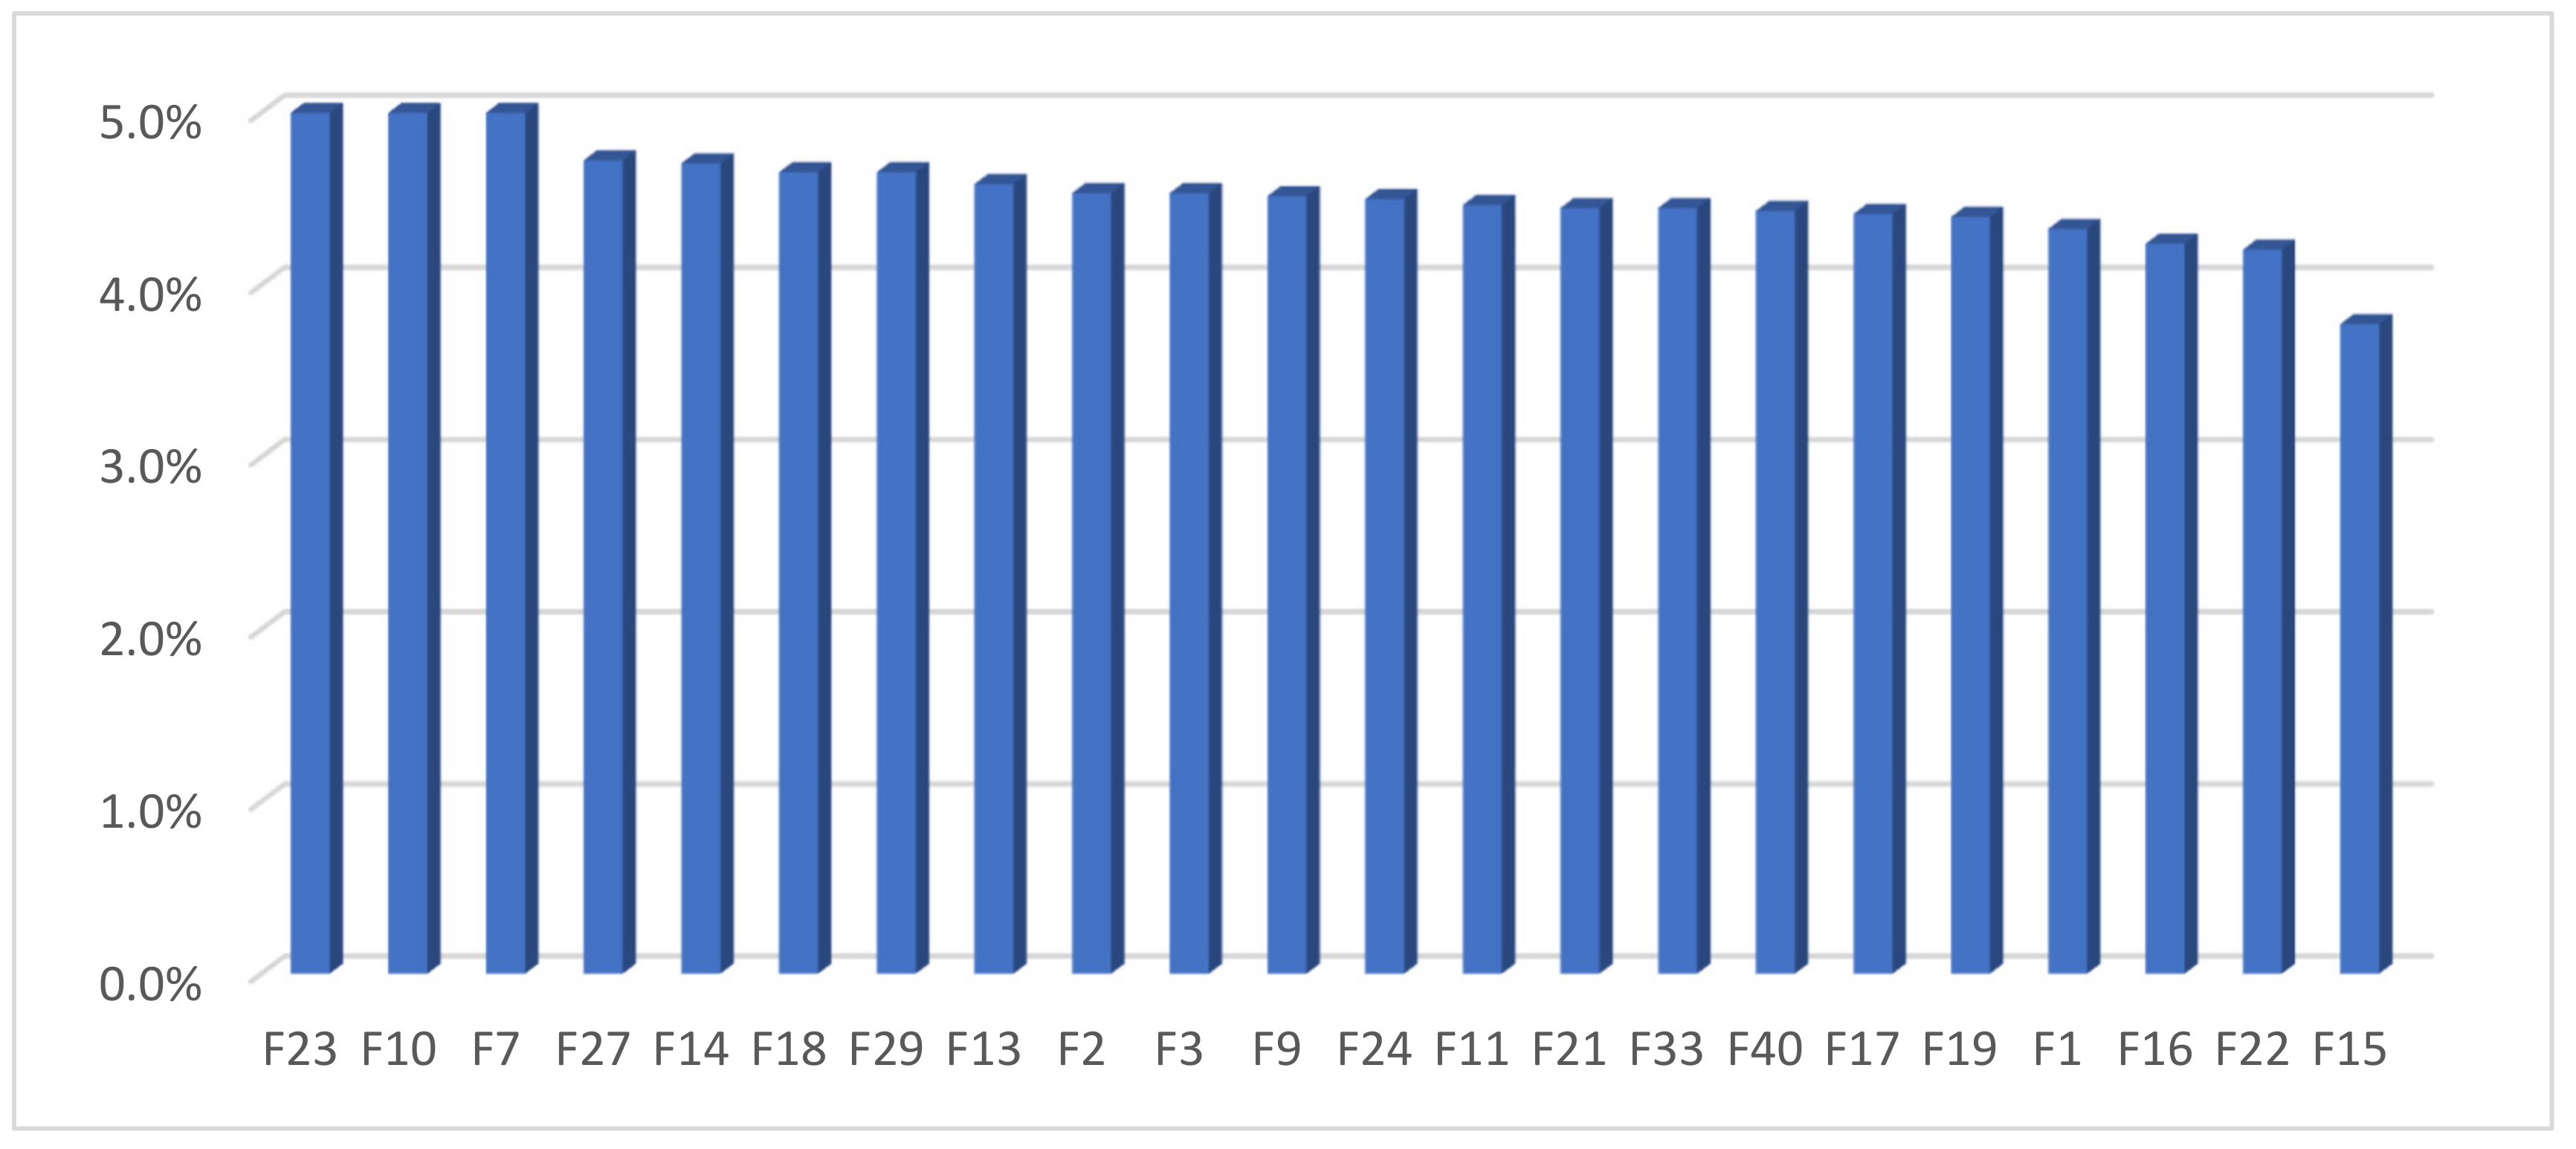
Figure 6.
Sloped lines of the GA and RII sensitivity analysis.

Table 1.
Connection weights of the hidden layers in the ANN architecture.
| Hidden Neurons | Weights | |||
|---|---|---|---|---|
| Input 1 | Input 2 | Input 3 | Output | |
| Hidden 1 | −1.67624 | 3.29022 | 1.32466 | 4.57857 |
| Hidden 2 | −0.51874 | −0.22921 | −0.25526 | −0.48815 |
| Hidden 3 | −4.01764 | 2.12486 | −0.08168 | −5.73901 |
| Hidden 4 | −1.75691 | −1.44702 | 0.58286 | −2.65221 |
Table 2.
Product of the absolute values of the hidden-output and hidden-input layer connection weights ().
Table 2.
Product of the absolute values of the hidden-output and hidden-input layer connection weights ().
| Input 1 | Input 2 | Input 3 | |
|---|---|---|---|
| Hidden 1 | 1.67624 × 4.57857 | 3.29022 × 4.57857 | 1.32466 × 4.57857 |
| Hidden 2 | 0.51874 × 0.48815 | 0.22921 × 0.48815 | 0.25526 × 0.48815 |
| Hidden 3 | 4.01764 × 5.73901 | 2.12486 × 5.73901 | 0.08168 × 5.73901 |
| Hidden 4 | 1.75691 × 2.65221 | 1.44702 × 2.65221 | 0.58286 × 2.65221 |
Table 3.
Division of the product connection weight () by the sum of all the input variables to obtain ().
Table 3.
Division of the product connection weight () by the sum of all the input variables to obtain ().
| Input 1 | Input 2 | Input 3 | |
|---|---|---|---|
| Hidden 1 | 0.266445 | 0.522994 | 0.210560 |
| Hidden 2 | 0.517081 | 0.228478 | 0.254441 |
| Hidden 3 | 0.645489 | 0.341388 | 0.013123 |
| Hidden 4 | 0.463958 | 0.382123 | 0.153919 |
| Sum | 1.892973 | 1.474983 | 0.632044 |
Table 4.
Relative weights of input variables.
| Input 1 | Input 2 | Input 3 | |
|---|---|---|---|
| Relative weight (%) | 47.3 | 36.9 | 15.8 |
Table 5.
Literature reviews of risk factors causing construction schedule delays.
| Sn. | Factors | Literatures | ||||||||||||||||||||
|---|---|---|---|---|---|---|---|---|---|---|---|---|---|---|---|---|---|---|---|---|---|---|
| [1] | [2] | [3] | [4] | [5] | [6] | [8] | [14] | [20] | [23] | [11] | [12] | [17] | [21] | [24] | [10] | [22] | [9] | [15] | [16] | Frq. | ||
| 1 | Improper planning and scheduling | ✓ | ✓ | ✓ | ✓ | ✓ | ✓ | ✓ | ✓ | ✓ | ✓ | ✓ | ✓ | ✓ | 14 | |||||||
| 2 | Variation/Change order | ✓ | ✓ | ✓ | ✓ | ✓ | ✓ | ✓ | ✓ | ✓ | ✓ | ✓ | ✓ | ✓ | 13 | |||||||
| 3 | Financial difficulties | ✓ | ✓ | ✓ | ✓ | ✓ | ✓ | ✓ | ✓ | ✓ | ✓ | ✓ | 11 | |||||||||
| 4 | Delays in payment | ✓ | ✓ | ✓ | ✓ | ✓ | ✓ | ✓ | ✓ | ✓ | ✓ | ✓ | 11 | |||||||||
| 5 | Problem/ Poor Site management | ✓ | ✓ | ✓ | ✓ | ✓ | ✓ | ✓ | ✓ | ✓ | ✓ | 10 | ||||||||||
| 6 | Increase of Material price | ✓ | ✓ | ✓ | ✓ | ✓ | ✓ | 6 | ||||||||||||||
| 7 | Defective design/incorrect/error | ✓ | ✓ | ✓ | ✓ | ✓ | ✓ | 6 | ||||||||||||||
| 8 | Equipment availability and failure | ✓ | ✓ | ✓ | ✓ | ✓ | ✓ | 6 | ||||||||||||||
| 9 | Problem in Sub-contractors works | ✓ | ✓ | ✓ | ✓ | ✓ | ✓ | 6 | ||||||||||||||
| 10 | Mistakes and rework | ✓ | ✓ | ✓ | ✓ | ✓ | ✓ | 6 | ||||||||||||||
| 11 | Inadequate contractor experience | ✓ | ✓ | ✓ | ✓ | ✓ | 5 | |||||||||||||||
| 12 | Shortage in material | ✓ | ✓ | ✓ | ✓ | ✓ | 5 | |||||||||||||||
| 13 | Unrealistic contract duration and requirements imposed | ✓ | ✓ | ✓ | ✓ | 4 | ||||||||||||||||
| 14 | Delay in material delivery | ✓ | ✓ | ✓ | ✓ | 4 | ||||||||||||||||
| 15 | Poor labor productivity | ✓ | ✓ | ✓ | ✓ | 4 | ||||||||||||||||
| 16 | Shortage of labor supply | ✓ | ✓ | ✓ | ✓ | 4 | ||||||||||||||||
| 17 | Inflation | ✓ | ✓ | ✓ | ✓ | 4 | ||||||||||||||||
| 18 | Inappropriate type of project bidding and award | ✓ | ✓ | ✓ | 3 | |||||||||||||||||
| 19 | Lack of skilled workers | ✓ | ✓ | ✓ | 3 | |||||||||||||||||
| 20 | lack of effective communication between parties | ✓ | ✓ | ✓ | 3 | |||||||||||||||||
| 21 | Waiting time for approval and inspection | ✓ | ✓ | ✓ | 3 | |||||||||||||||||
| 22 | Management problem | ✓ | ✓ | ✓ | 3 | |||||||||||||||||
| 23 | Slow decision making | ✓ | ✓ | ✓ | 3 | |||||||||||||||||
| 24 | Skill of technical staff problem/unqualified | ✓ | ✓ | ✓ | 3 | |||||||||||||||||
| 25 | Adverse Weather conditions | ✓ | ✓ | ✓ | 3 | |||||||||||||||||
| 26 | Difficulties in obtaining work permit/land acquisition | ✓ | ✓ | ✓ | 3 | |||||||||||||||||
| 27 | Bribe/corruption | ✓ | ✓ | 2 | ||||||||||||||||||
| 28 | Lack of clarity in scope | ✓ |  | ✓ | 2 | |||||||||||||||||
| 68 | Emergency works | ✓ | 1 | |||||||||||||||||||
| 69 | unavailability of utilities at site | ✓ | 1 | |||||||||||||||||||
| 70 | Global financial crisis | ✓ | 1 | |||||||||||||||||||
Note: Frq. = frequency; Sn. = serial number.
Table 6.
Background of the participants in the second stage of the questionnaire survey.
| Experience (in Years) | Frequency | Educational Level | Frequency |
|---|---|---|---|
| More than 20 | 8 | College graduate | 17 |
| 11 to 15 | 46 | BSc. | 22 |
| 6 to 10 | 15 | MSc. | 25 |
| Less than 5 | 6 | PhD. | 11 |
Table 7.
Statistical analysis for selecting risk factors.
| Symbol | Risk Factors | Category of Risk Factors | Univariate Selection | Feature Importance | Correlation Matrix | Status |
|---|---|---|---|---|---|---|
| F1 | Delays in payment | FB | ✓ | ✓ | ✓ | O |
| F2 | Variation/Change order | FB | ✓ | ✓ | ✓ | O |
| F3 | Shortage in material | FB | ✓ | ✓ | O | |
| F4 | Problem in sub-contractor work | FB | ✓ | X | ||
| F5 | Mistakes and rework | FB | ✓ | X | ||
| F6 | Waiting time for approval and inspection | FB | ✓ | X | ||
| F7 | Delay in material delivery | FB | ✓ | ✓ | O | |
| F8 | Conflict among parties | FB | ✓ | X | ||
| F9 | Lack of peace and security | FB | ✓ | ✓ | O | |
| F10 | Corruption and Bribery | FB | ✓ | ✓ | ✓ | O |
| F11 | Scarcity of foreign exchange and rate fluctuation | FB | ✓ | ✓ | O | |
| F12 | Disputes on land | FB | ✓ | X | ||
| F13 | Poor implementation of plan (poor performance) | FB | ✓ | ✓ | ✓ | O |
| F14 | Strike, revolution, riot, protest | FB | ✓ | ✓ | O | |
| F15 | Construction methods | FB | ✓ | ✓ | O | |
| F16 | Political insecurity and instability | FB | ✓ | ✓ | O | |
| F17 | Slow decision making | FB | ✓ | ✓ | O | |
| F18 | Defective design/incorrect/error | FB | ✓ | ✓ | ✓ | O |
| F19 | Increase of material price, price fluctuation | FB | ✓ | ✓ | O | |
| F20 | Lack of skilled workers | FB | ✓ | X | ||
| F21 | Poor labor productivity | FB | ✓ | ✓ | O | |
| F22 | Rebellion | FB | ✓ | ✓ | O | |
| F23 | Poor resource management | FB | ✓ | ✓ | O | |
| F24 | Unavailability of utility at site (electricity, water) | FB | ✓ | ✓ | O | |
| F25 | Skill of technical staff problem | FB | ✓ | X | ||
| F26 | Labor absenteeism | FB | ✓ | X | ||
| F27 | Improper planning and scheduling | BB | ✓ | ✓ | O | |
| F28 | Financial difficulties | BB | ✓ | X | ||
| F29 | Unrealistic contract duration and requirements imposed | BB | ✓ | ✓ | O | |
| F30 | Inadequate contractor experience | BB | X | |||
| F31 | Management problem | BB | X | |||
| F32 | Lack of effective communication between parties | BB | ✓ | X | ||
| F33 | Inappropriate type of project bidding and award | BB | ✓ | ✓ | O | |
| F34 | Inflation | BB | ✓ | X | ||
| F35 | Difficulties in obtaining work permits | BB | ✓ | X | ||
| F36 | Transportation problem to site location | BB | ✓ | X | ||
| F37 | Labor culture of work/ attitude | BB | ✓ | X | ||
| F38 | Lack of commitment of general contractor | BB | ✓ | X | ||
| F39 | Problem/ Poor Site management | BB | X | |||
| F40 | Inadequate modern equipment | BB | ✓ | ✓ | O | |
| F41 | Project site location (boundary problem) | BB | ✓ | X |
Note: O: Selected; X: Not selected; FB = Frequency-based; BB = Binary-based.
Table 8.
Established historical cases of the construction projects.
| Proj # | Input Factors | Output | |||||||||||||||||||||
|---|---|---|---|---|---|---|---|---|---|---|---|---|---|---|---|---|---|---|---|---|---|---|---|
| F1 | F2 | F3 | F7 | F9 | F10 | F11 | F13 | F14 | F15 | F16 | F17 | F18 | F19 | F21 | F22 | F23 | F24 | F27 | F29 | F33 | F40 | Delay% | |
| 1 | 0.50 | 0.40 | 0.00 | 0.33 | 0.33 | 1.00 | 0.90 | 0.50 | 0.00 | 0.50 | 0.50 | 0.50 | 0.50 | 0.50 | 0.00 | 0.00 | 0.00 | 0.50 | 1.00 | 1.00 | 0.00 | 1.00 | 0.63 |
| 2 | 0.50 | 0.30 | 0.40 | 0.33 | 0.33 | 0.40 | 0.20 | 0.50 | 0.30 | 0.20 | 0.20 | 0.30 | 0.10 | 0.50 | 0.40 | 0.20 | 0.00 | 0.40 | 1.00 | 1.00 | 0.00 | 1.00 | 0.88 |
| 3 | 1.00 | 0.10 | 1.00 | 0.00 | 0.00 | 0.30 | 1.00 | 1.00 | 0.00 | 0.00 | 0.50 | 1.00 | 0.50 | 1.00 | 1.00 | 0.00 | 0.00 | 1.00 | 1.00 | 1.00 | 0.00 | 1.00 | 0.35 |
| 4 | 0.40 | 0.20 | 0.30 | 0.00 | 0.00 | 0.40 | 0.10 | 0.40 | 0.00 | 0.00 | 0.00 | 0.10 | 0.20 | 0.30 | 0.30 | 0.00 | 0.00 | 0.00 | 1.00 | 1.00 | 0.00 | 0.00 | 0.67 |
| 5 | 0.10 | 0.00 | 0.30 | 0.44 | 0.44 | 0.30 | 0.10 | 0.10 | 0.90 | 0.10 | 0.50 | 0.10 | 0.20 | 0.20 | 0.00 | 0.90 | 0.00 | 0.20 | 0.00 | 0.00 | 0.00 | 0.00 | 0.50 |
| 6 | 0.30 | 1.00 | 1.00 | 0.22 | 0.22 | 0.40 | 0.20 | 0.30 | 0.00 | 0.10 | 0.20 | 0.50 | 0.60 | 1.00 | 1.00 | 0.00 | 0.22 | 0.80 | 1.00 | 0.00 | 0.00 | 1.00 | 0.50 |
| 7 | 0.00 | 0.30 | 0.00 | 1.00 | 1.00 | 0.00 | 0.00 | 0.00 | 1.00 | 0.90 | 0.90 | 0.30 | 0.00 | 0.00 | 0.30 | 0.20 | 0.00 | 0.00 | 0.00 | 0.00 | 1.00 | 1.00 | 0.34 |
| 8 | 0.50 | 0.40 | 0.00 | 0.33 | 0.33 | 0.00 | 0.50 | 0.50 | 0.00 | 0.50 | 0.50 | 0.50 | 0.50 | 0.50 | 0.00 | 0.00 | 0.11 | 0.50 | 1.00 | 1.00 | 0.00 | 1.00 | 0.50 |
| 9 | 0.50 | 0.50 | 0.50 | 0.00 | 0.00 | 0.10 | 0.00 | 0.50 | 0.00 | 0.50 | 0.50 | 0.50 | 1.00 | 1.00 | 0.50 | 1.00 | 0.00 | 0.00 | 1.00 | 0.00 | 0.00 | 0.00 | 0.44 |
| 10 | 0.30 | 0.30 | 0.30 | 0.00 | 0.00 | 0.40 | 0.10 | 0.30 | 0.10 | 0.20 | 0.00 | 0.30 | 0.10 | 0.10 | 0.20 | 0.20 | 0.00 | 0.20 | 1.00 | 0.00 | 0.00 | 1.00 | 0.75 |
| 11 | 0.10 | 0.20 | 0.20 | 0.22 | 0.22 | 0.20 | 0.20 | 0.10 | 0.10 | 0.00 | 0.10 | 0.10 | 0.10 | 0.20 | 0.20 | 0.10 | 0.00 | 0.20 | 1.00 | 1.00 | 1.00 | 0.00 | 0.34 |
| 12 | 0.50 | 0.60 | 0.00 | 0.00 | 0.00 | 0.50 | 0.00 | 0.50 | 0.00 | 0.00 | 0.00 | 0.00 | 0.20 | 1.00 | 0.20 | 0.00 | 0.22 | 0.30 | 1.00 | 1.00 | 1.00 | 0.00 | 0.50 |
| 13 | 0.50 | 0.60 | 0.00 | 0.00 | 0.00 | 0.50 | 0.00 | 0.50 | 0.00 | 0.00 | 0.00 | 0.00 | 0.20 | 0.90 | 0.20 | 0.00 | 0.44 | 0.30 | 1.00 | 1.00 | 1.00 | 0.00 | 0.32 |
| 14 | 0.60 | 0.40 | 0.00 | 0.00 | 0.00 | 0.20 | 0.00 | 0.60 | 0.00 | 0.00 | 0.00 | 0.00 | 0.20 | 1.00 | 0.40 | 0.00 | 0.33 | 0.80 | 1.00 | 1.00 | 0.00 | 0.00 | 0.50 |
| 15 | 1.00 | 0.90 | 1.00 | 0.44 | 0.44 | 0.40 | 0.60 | 1.00 | 0.60 | 0.00 | 0.60 | 0.30 | 0.10 | 0.10 | 0.20 | 0.20 | 0.11 | 0.20 | 1.00 | 0.00 | 0.00 | 1.00 | 0.34 |
| 16 | 0.00 | 1.00 | 0.50 | 0.56 | 0.56 | 0.20 | 0.00 | 0.00 | 0.00 | 0.20 | 0.20 | 0.20 | 0.50 | 0.50 | 0.00 | 0.50 | 0.33 | 0.50 | 1.00 | 0.00 | 1.00 | 0.00 | 0.75 |
| 17 | 0.50 | 0.50 | 0.50 | 0.56 | 0.56 | 0.80 | 1.00 | 0.50 | 0.50 | 0.50 | 1.00 | 0.50 | 1.00 | 0.50 | 0.50 | 0.50 | 0.11 | 0.50 | 1.00 | 0.00 | 1.00 | 0.00 | 0.75 |
| 18 | 0.50 | 1.00 | 1.00 | 0.33 | 0.33 | 0.90 | 0.50 | 0.50 | 0.30 | 0.30 | 0.50 | 0.30 | 0.90 | 1.00 | 0.50 | 0.20 | 0.56 | 0.20 | 1.00 | 1.00 | 1.00 | 1.00 | 0.75 |
| 19 | 1.00 | 0.00 | 1.00 | 0.56 | 0.56 | 0.80 | 0.10 | 1.00 | 0.50 | 0.50 | 0.50 | 0.50 | 0.80 | 0.10 | 1.00 | 0.50 | 0.22 | 0.00 | 1.00 | 0.00 | 1.00 | 0.00 | 0.75 |
| 20 | 0.50 | 0.50 | 0.50 | 0.00 | 0.00 | 0.70 | 0.00 | 0.50 | 0.00 | 0.50 | 0.50 | 0.50 | 1.00 | 1.00 | 0.50 | 1.00 | 0.56 | 0.00 | 1.00 | 0.00 | 0.00 | 0.00 | 0.50 |
 | |||||||||||||||||||||||
| 91 | 1.00 | 0.70 | 0.00 | 0.00 | 0.00 | 0.90 | 0.00 | 0.30 | 0.00 | 0.00 | 0.10 | 0.10 | 0.20 | 0.00 | 0.00 | 0.70 | 0.00 | 0.00 | 1.00 | 1.00 | 0.00 | 1.00 | 0.48 |
| 92 | 1.00 | 0.10 | 1.00 | 0.00 | 0.00 | 0.20 | 1.00 | 1.00 | 0.00 | 0.00 | 0.50 | 0.10 | 0.50 | 0.00 | 0.00 | 0.00 | 0.11 | 0.10 | 1.00 | 1.00 | 0.00 | 1.00 | 0.05 |
| 93 | 0.60 | 0.50 | 0.00 | 0.00 | 0.33 | 0.20 | 0.00 | 0.60 | 0.30 | 0.20 | 0.00 | 0.00 | 0.20 | 0.20 | 0.40 | 0.00 | 0.22 | 0.10 | 1.00 | 1.00 | 1.00 | 1.00 | 0.44 |
| 94 | 0.50 | 0.60 | 0.50 | 0.00 | 0.33 | 0.70 | 0.00 | 0.50 | 0.30 | 0.50 | 0.50 | 0.50 | 0.10 | 0.50 | 0.50 | 0.60 | 0.78 | 0.00 | 1.00 | 1.00 | 1.00 | 1.00 | 0.75 |
Table 9.
Absolute values of the connection weights obtained from trained ANN.
| Weights | |||||||||||||||||||||||
|---|---|---|---|---|---|---|---|---|---|---|---|---|---|---|---|---|---|---|---|---|---|---|---|
| F1 | F2 | F3 | F7 | F9 | F10 | F11 | F13 | F14 | F15 | F16 | F17 | F18 | F19 | F21 | F22 | F23 | F24 | F27 | F29 | F33 | F40 | Output | |
| Hidden 1 | 3.967 | 7.521 | 0.070 | 0.925 | 1.205 | 3.651 | 0.762 | 0.070 | 0.612 | 0.067 | 0.613 | 0.318 | 1.512 | 0.980 | 0.407 | 0.722 | 0.209 | 1.707 | 0.421 | 2.162 | 0.364 | 2.760 | 1.246 |
| Hidden 2 | 3.198 | 2.449 | 0.640 | 0.694 | 0.329 | 4.236 | 0.028 | 0.138 | 0.361 | 0.643 | 1.276 | 1.572 | 0.423 | 0.514 | 1.624 | 0.085 | 0.579 | 0.475 | 0.619 | 0.978 | 0.505 | 0.329 | 1.230 |
| Hidden 3 | 2.992 | 3.455 | 1.982 | 0.057 | 0.568 | 3.866 | 0.518 | 1.781 | 0.180 | 0.093 | 0.566 | 0.219 | 0.999 | 1.210 | 0.697 | 0.814 | 0.618 | 1.183 | 0.542 | 0.752 | 1.437 | 0.056 | 1.807 |
| Hidden 4 | 2.821 | 5.163 | 0.549 | 0.472 | 1.650 | 4.178 | 1.198 | 0.331 | 0.895 | 2.662 | 0.478 | 3.178 | 0.758 | 0.319 | 0.872 | 0.403 | 0.523 | 1.663 | 1.165 | 0.807 | 2.076 | 0.490 | 1.749 |
| Hidden 5 | 4.353 | 3.100 | 0.126 | 0.486 | 0.126 | 4.024 | 0.270 | 0.682 | 0.034 | 1.329 | 0.711 | 0.354 | 0.635 | 0.888 | 0.560 | 0.156 | 2.367 | 1.024 | 0.822 | 0.056 | 2.634 | 0.957 | 1.145 |
| Hidden 6 | 4.064 | 4.252 | 0.546 | 0.203 | 0.782 | 3.037 | 1.283 | 0.531 | 1.190 | 0.950 | 0.708 | 1.017 | 0.347 | 1.088 | 1.624 | 2.514 | 0.394 | 0.488 | 0.086 | 0.145 | 0.692 | 2.188 | 1.739 |
| Hidden 7 | 4.065 | 5.771 | 1.684 | 1.558 | 0.755 | 2.943 | 2.736 | 0.818 | 0.126 | 0.446 | 0.503 | 1.442 | 2.097 | 2.229 | 0.311 | 0.719 | 0.524 | 0.412 | 0.954 | 0.428 | 1.126 | 2.188 | 1.668 |
| Hidden 8 | 4.230 | 3.756 | 0.138 | 0.172 | 1.074 | 3.616 | 1.354 | 1.100 | 2.079 | 3.608 | 1.215 | 0.868 | 0.790 | 1.256 | 1.850 | 0.130 | 1.255 | 2.770 | 1.721 | 0.131 | 0.334 | 1.668 | 2.088 |
| Hidden 9 | 3.288 | 2.304 | 0.026 | 0.196 | 0.084 | 4.117 | 0.363 | 0.319 | 0.364 | 0.330 | 0.438 | 0.413 | 0.013 | 0.091 | 0.135 | 0.002 | 0.018 | 0.248 | 0.317 | 0.365 | 0.254 | 0.020 | 0.064 |
| Hidden 10 | 3.480 | 4.518 | 0.702 | 0.138 | 0.536 | 3.062 | 0.420 | 0.004 | 0.782 | 0.670 | 0.315 | 0.340 | 0.378 | 0.481 | 0.025 | 0.805 | 0.138 | 0.115 | 0.008 | 0.694 | 0.722 | 0.150 | 1.017 |
| Hidden 11 | 3.855 | 5.334 | 0.006 | 0.079 | 0.081 | 5.403 | 0.833 | 0.237 | 0.657 | 0.457 | 0.284 | 0.396 | 0.476 | 0.502 | 0.115 | 0.475 | 0.228 | 0.637 | 0.106 | 0.078 | 0.194 | 0.006 | 0.468 |
Table 10.
Product of the absolute values of hidden-output and absolute values of hidden-input layers connection weights (pij).
Table 10.
Product of the absolute values of hidden-output and absolute values of hidden-input layers connection weights (pij).
| F1 | F2 | F3 | F7 | F9 | F10 | F11 | F13 | F14 | F15 | F16 | F17 | F18 | F19 | F21 | F22 | F23 | F24 | F27 | F29 | F33 | F40 | |
|---|---|---|---|---|---|---|---|---|---|---|---|---|---|---|---|---|---|---|---|---|---|---|
| Hidden 1 | 4.941 | 9.369 | 0.088 | 1.153 | 1.501 | 4.548 | 0.949 | 0.087 | 0.763 | 0.083 | 0.764 | 0.396 | 1.884 | 1.221 | 0.507 | 0.899 | 0.260 | 2.127 | 0.525 | 2.694 | 0.453 | 3.438 |
| Hidden 2 | 3.934 | 3.012 | 0.787 | 0.853 | 0.405 | 5.210 | 0.035 | 0.170 | 0.445 | 0.791 | 1.569 | 1.933 | 0.520 | 0.632 | 1.998 | 0.104 | 0.712 | 0.584 | 0.761 | 1.203 | 0.621 | 0.404 |
| Hidden 3 | 5.405 | 6.242 | 3.580 | 0.103 | 1.025 | 6.984 | 0.935 | 3.217 | 0.326 | 0.169 | 1.023 | 0.395 | 1.804 | 2.186 | 1.260 | 1.471 | 1.117 | 2.136 | 0.979 | 1.359 | 2.596 | 0.100 |
| Hidden 4 | 4.934 | 9.030 | 0.960 | 0.826 | 2.886 | 7.307 | 2.096 | 0.580 | 1.565 | 4.656 | 0.837 | 5.558 | 1.326 | 0.558 | 1.524 | 0.705 | 0.915 | 2.909 | 2.037 | 1.412 | 3.631 | 0.858 |
| Hidden 5 | 4.985 | 3.550 | 0.144 | 0.556 | 0.144 | 4.609 | 0.309 | 0.781 | 0.039 | 1.522 | 0.815 | 0.406 | 0.727 | 1.017 | 0.642 | 0.178 | 2.711 | 1.172 | 0.941 | 0.065 | 3.017 | 1.096 |
| Hidden 6 | 7.067 | 7.393 | 0.949 | 0.354 | 1.359 | 5.280 | 2.230 | 0.924 | 2.069 | 1.651 | 1.232 | 1.768 | 0.603 | 1.891 | 2.823 | 4.371 | 0.686 | 0.848 | 0.150 | 0.252 | 1.204 | 3.804 |
| Hidden 7 | 6.778 | 9.624 | 2.808 | 2.598 | 1.259 | 4.907 | 4.562 | 1.364 | 0.210 | 0.743 | 0.839 | 2.404 | 3.497 | 3.717 | 0.518 | 1.199 | 0.873 | 0.687 | 1.591 | 0.714 | 1.878 | 3.648 |
| Hidden 8 | 8.831 | 7.841 | 0.288 | 0.360 | 2.241 | 7.550 | 2.826 | 2.297 | 4.340 | 7.533 | 2.538 | 1.812 | 1.649 | 2.622 | 3.863 | 0.272 | 2.620 | 5.783 | 3.593 | 0.275 | 0.697 | 3.482 |
| Hidden 9 | 0.209 | 0.147 | 0.002 | 0.013 | 0.005 | 0.262 | 0.023 | 0.020 | 0.023 | 0.021 | 0.028 | 0.026 | 0.001 | 0.006 | 0.009 | 0.000 | 0.001 | 0.016 | 0.020 | 0.023 | 0.016 | 0.001 |
| Hidden 10 | 3.539 | 4.594 | 0.714 | 0.140 | 0.546 | 3.114 | 0.427 | 0.004 | 0.795 | 0.681 | 0.320 | 0.346 | 0.384 | 0.489 | 0.025 | 0.818 | 0.140 | 0.117 | 0.008 | 0.705 | 0.734 | 0.153 |
| Hidden 11 | 1.805 | 2.498 | 0.003 | 0.037 | 0.038 | 2.530 | 0.390 | 0.111 | 0.307 | 0.214 | 0.133 | 0.185 | 0.223 | 0.235 | 0.054 | 0.222 | 0.107 | 0.298 | 0.050 | 0.037 | 0.091 | 0.003 |
Table 11.
Product connection weight (pij) divided by the sum of all input variables to obtain ( ).
| F1 | F2 | F3 | F7 | F9 | F10 | F11 | F13 | F14 | F15 | F16 | F17 | F18 | F19 | F21 | F22 | F23 | F24 | F27 | F29 | F33 | F40 | |
|---|---|---|---|---|---|---|---|---|---|---|---|---|---|---|---|---|---|---|---|---|---|---|
| Hidden 1 | 0.128 | 0.242 | 0.002 | 0.030 | 0.039 | 0.118 | 0.025 | 0.002 | 0.020 | 0.002 | 0.020 | 0.010 | 0.049 | 0.032 | 0.013 | 0.023 | 0.007 | 0.055 | 0.014 | 0.070 | 0.012 | 0.089 |
| Hidden 2 | 0.147 | 0.113 | 0.030 | 0.032 | 0.015 | 0.195 | 0.001 | 0.006 | 0.017 | 0.030 | 0.059 | 0.072 | 0.020 | 0.024 | 0.075 | 0.004 | 0.027 | 0.022 | 0.029 | 0.045 | 0.023 | 0.015 |
| Hidden 3 | 0.122 | 0.141 | 0.081 | 0.002 | 0.023 | 0.157 | 0.021 | 0.072 | 0.007 | 0.004 | 0.023 | 0.009 | 0.041 | 0.049 | 0.028 | 0.033 | 0.025 | 0.048 | 0.022 | 0.031 | 0.058 | 0.002 |
| Hidden 4 | 0.086 | 0.158 | 0.017 | 0.014 | 0.051 | 0.128 | 0.037 | 0.010 | 0.027 | 0.082 | 0.015 | 0.097 | 0.023 | 0.010 | 0.027 | 0.012 | 0.016 | 0.051 | 0.036 | 0.025 | 0.064 | 0.015 |
| Hidden 5 | 0.169 | 0.121 | 0.005 | 0.019 | 0.005 | 0.157 | 0.011 | 0.027 | 0.001 | 0.052 | 0.028 | 0.014 | 0.025 | 0.035 | 0.022 | 0.006 | 0.092 | 0.040 | 0.032 | 0.002 | 0.103 | 0.037 |
| Hidden 6 | 0.145 | 0.151 | 0.019 | 0.007 | 0.028 | 0.108 | 0.046 | 0.019 | 0.042 | 0.034 | 0.025 | 0.036 | 0.012 | 0.039 | 0.058 | 0.089 | 0.014 | 0.017 | 0.003 | 0.005 | 0.025 | 0.078 |
| Hidden 7 | 0.120 | 0.171 | 0.050 | 0.046 | 0.022 | 0.087 | 0.081 | 0.024 | 0.004 | 0.013 | 0.015 | 0.043 | 0.062 | 0.066 | 0.009 | 0.021 | 0.015 | 0.012 | 0.028 | 0.013 | 0.033 | 0.065 |
| Hidden 8 | 0.120 | 0.107 | 0.004 | 0.005 | 0.031 | 0.103 | 0.039 | 0.031 | 0.059 | 0.103 | 0.035 | 0.025 | 0.022 | 0.036 | 0.053 | 0.004 | 0.036 | 0.079 | 0.049 | 0.004 | 0.010 | 0.047 |
| Hidden 9 | 0.240 | 0.168 | 0.002 | 0.014 | 0.006 | 0.300 | 0.027 | 0.023 | 0.027 | 0.024 | 0.032 | 0.030 | 0.001 | 0.007 | 0.010 | 0.000 | 0.001 | 0.018 | 0.023 | 0.027 | 0.019 | 0.001 |
| Hidden 10 | 0.188 | 0.244 | 0.038 | 0.007 | 0.029 | 0.166 | 0.023 | 0.000 | 0.042 | 0.036 | 0.017 | 0.018 | 0.020 | 0.026 | 0.001 | 0.044 | 0.007 | 0.006 | 0.000 | 0.038 | 0.039 | 0.008 |
| Hidden 11 | 0.189 | 0.261 | 0.000 | 0.004 | 0.004 | 0.264 | 0.041 | 0.012 | 0.032 | 0.022 | 0.014 | 0.019 | 0.023 | 0.025 | 0.006 | 0.023 | 0.011 | 0.031 | 0.005 | 0.004 | 0.009 | 0.000 |
| Sum (S) | 1.654 | 1.877 | 0.248 | 0.18 | 0.253 | 1.783 | 0.352 | 0.226 | 0.278 | 0.402 | 0.283 | 0.373 | 0.298 | 0.349 | 0.302 | 0.259 | 0.251 | 0.379 | 0.241 | 0.264 | 0.395 | 0.357 |
Table 12.
RWs and RIIs of the selected risk factors.
| Symbol | Risk Factors | Relative Weight by Garson Algorithm | Relative Importance Index | Rank of Risk Factors by RII |
|---|---|---|---|---|
| F1 | Delays in payment | 15.031% | 0.666667 | 19 |
| F2 | Variation/Change order | 17.062% | 0.698667 | 9 |
| F3 | Shortage in material | 2.249% | 0.698667 | 10 |
| F7 | Delay in material delivery | 1.649% | 0.778667 | 3 |
| F9 | Lack of peace and security | 2.294% | 0.696000 | 11 |
| F10 | Corruption and Bribery | 16.210% | 0.792000 | 2 |
| F11 | Scarcity of foreign exchange and rate fluctuation | 3.174% | 0.688000 | 13 |
| F13 | Poor implementation of plan (poor performance) | 2.065% | 0.706667 | 8 |
| F14 | Strike, revolution, riot, protest | 2.533% | 0.725333 | 5 |
| F15 | Construction methods | 3.647% | 0.581333 | 22 |
| F16 | Political insecurity and instability | 2.559% | 0.653333 | 20 |
| F17 | Slow decision making | 3.401% | 0.680000 | 17 |
| F18 | Defective design/incorrect/error | 2.712% | 0.717333 | 6 |
| F19 | Increase of material price, price fluctuation, | 3.149% | 0.677333 | 18 |
| F21 | Poor labor productivity | 2.738% | 0.685333 | 14 |
| F22 | Rebellion | 2.363% | 0.648000 | 21 |
| F23 | Poor resource management | 2.290% | 0.810667 | 1 |
| F24 | Unavailability of utility at site (electricity, water) | 3.452% | 0.693333 | 12 |
| F27 | Improper planning and scheduling | 2.189% | 0.728000 | 4 |
| F29 | Unrealistic contract duration and requirements imposed | 2.380% | 0.717333 | 7 |
| F33 | Inappropriate type of project bidding and award | 3.583% | 0.685333 | 15 |
| F40 | Inadequate modern equipment | 3.258% | 0.682667 | 16 |
Table 13.
Developed management strategies.
| List of Risk Factors | Possible Causes of the Risk Factors | If Implemented, the Following Can Improve the Risk Factors | ||||
|---|---|---|---|---|---|---|
| Owner | A/E | Contractor | Owner | A/E | Contractor | |
| Change order |
|
|
|
|
|
|
| Corruption or Bribery |
|
|
|
|
|
|
|
| |||||
| Delays in payment |
|
|
|
|
|
|
| Poor resource management |
|
|
|
|
|
|
| Delay in material delivery |
|
|
|
|
|
|
Table 14.
Sensitivity analysis of GA and RII.
| Top-3 Ranked Risk Factors by | Before Improvement | Improved by 10% | Improved by 20% | Improved by 30% | Improved by 40% |
|---|---|---|---|---|---|
| Garson Algorithm | 102.85 | 92.25 | 89.7 | 87.72 | 86.08 |
| Relative Importance Index | 102.85 | 100.52 | 98.62 | 96.95 | 95.50 |
Publisher’s Note: MDPI stays neutral with regard to jurisdictional claims in published maps and institutional affiliations. |
© 2021 by the authors. Licensee MDPI, Basel, Switzerland. This article is an open access article distributed under the terms and conditions of the Creative Commons Attribution (CC BY) license (https://creativecommons.org/licenses/by/4.0/).
Share and Cite
MDPI and ACS Style
Cheng, M.-Y.; Darsa, M.H. Construction Schedule Risk Assessment and Management Strategy for Foreign General Contractors Working in the Ethiopian Construction Industry. Sustainability 2021, 13, 7830. https://doi.org/10.3390/su13147830
AMA Style
Cheng M-Y, Darsa MH. Construction Schedule Risk Assessment and Management Strategy for Foreign General Contractors Working in the Ethiopian Construction Industry. Sustainability. 2021; 13(14):7830. https://doi.org/10.3390/su13147830
Chicago/Turabian StyleCheng, Min-Yuan, and Mohammadzen Hasan Darsa. 2021. "Construction Schedule Risk Assessment and Management Strategy for Foreign General Contractors Working in the Ethiopian Construction Industry" Sustainability 13, no. 14: 7830. https://doi.org/10.3390/su13147830
Note that from the first issue of 2016, this journal uses article numbers instead of page numbers. See further details here.