Article

Effects of Microencapsulated Organic Acid and Their Salts on Growth Performance, Immunity, and Disease Resistance of Pacific White Shrimp Litopenaeus vannamei

1
Jefo Nutrition Inc., 5020 JEFO Avenue, St-Hyacinthe, QC J2S 7B6, Canada
2
Laboratory of Aquatic Animal Nutrition and Feed, College of Fisheries, Guangdong Ocean University, Zhanjiang 524088, China
3
Nutritech Solutions, Shang Xue Road Malu, Shanghai 201801, China
*
Author to whom correspondence should be addressed.
Sustainability 2021, 13(14), 7791; https://doi.org/10.3390/su13147791
Submission received: 4 June 2021 / Revised: 5 July 2021 / Accepted: 5 July 2021 / Published: 13 July 2021
(This article belongs to the Collection Aquaculture and Environmental Impacts)

Abstract

:
Use of antibiotics and other chemicals to combat disease outbreaks has been a bottleneck for the sustainable growth of shrimp industry. Among various replacements proposed, organic acid (OA) and their salts (OS) are commonly used by farmers and feed millers. However, in free forms, their requirement is very high (2–3 kg/MT) as they tend to disassociate before reaching the hindgut. The dosage can be reduced by microencapsulation of the ingredients. In this study, a 63-day trial was conducted to assess the effects of OA and OS (COMP) microencapsulated (ENCAP) with fat (HF), fat + alginate (HA), wax esters (WE) and HA + WE (HAWE) on performance, digestive enzymes, immunity and resistance to Vibrio parahaemolyticus. A positive control (PC, 200 g/kg fishmeal-FM) and a negative control (NC, 130 g/kg FM) diet were formulated. Eight other diets were formulated, supplementing an NC diet with microencapsulated OA (OAHF, OAHA, OAWE, OAHAWE) and OS (OSHF, OSHA, OSWE, OSHAWE). Among the ENCAPs, significant difference was observed in serum malondialdehyde (p = 0.026), where HF showed the lowest level (6.4 ± 0.3 mmol/L). Significant interactions between COMP and ENCAP were observed in lipid deposition (p = 0.047), serum alkaline phosphatase, acid phosphatase, hepatopancreatic and serum phenol oxidase (p < 0.0001). Despite no differences, 96-h mortality during pathogenic Vibrio parahaemolyticus challenge in all treatment diets (45–56%) was lower compared to the NC diets (63%). In conclusion, use of HF microencapsulated OA diets could provide improved performance and disease resistance that could contribute to the reduction of antibiotic use by the shrimp industry.

1. Introduction

The global farmed shrimp industry is frequently plagued with disease outbreaks starting from yellow head (YHV) and white spot syndrome (WSSV) virus in the 1990s to, more recently, acute hepatopancreatic necrosis disease (AHPND) [1,2]. The frequent outbreaks led to an increased use of antibiotics as a metaphylactic or prophylactic to treat or prevent diseases, respectively, or as antibiotic growth promoters (AGP) [3]. Reducing antibiotic use in farmed animals for disease control and banning GP is a global trend driven mainly by the increasing risk of antibiotic resistant bacteria [4,5].
Various alternatives to AGP, such as phytogenic compounds or plant derived essential oils [6,7], probiotic, prebiotic and synbiotic [8,9], enzymes [10,11], organic acids and their salts [2,12,13,14,15,16], have been proposed in recent years. Organic acids are “Generally Regarded as Safe” compounds often containing one or more carboxyl groups (–COOH) [17,18]. The most common are those with short chain (C1–C6), such as formic, lactic, propionic, citric acids and their salts. Their probable mode of action includes reducing the digesta pH, stimulating digestive enzyme secretion, promoting intestinal integrity and regulating gut microbial populations. The efficacy of an acid in inhibiting microbes is dependent on its pKa value, which is the pH where 50% of the acid is dissociated. The pKa of organic acids ranges from 3.02 for fumaric acid to as high as 6.4 for citric acid [19].
Intestinal pH usually ranges from slightly acidic (>6.4) in the proximal intestine to full alkaline (>8.0) in the rest of the intestine, such as in tilapia [20]. In Pacific white shrimp, the pH remains above 8.0 throughout the gastrointestinal tract. The organic acids and their salts need to remain in undissociated form or, for dissociated form, pH needs to be highly acidic to be effective against most pathogens [21]. The required high dosage (2–5 g/kg) to suppress intestinal pH induces high stress and costs significant energy to maintain homeostasis [22,23]. An alternative strategy is to encapsulate active ingredients to bypass the proximal intestine ensuring their release in the microbe rich hind gut.
Microencapsulation is one of the most popular and practical approaches to delivering bioactive compounds to the GI tract of farmed animals [24,25,26,27]. An ideal encapsulation should not only present the stability of the active compound but also release them in the target regions of the intestine [28]. Many materials, including polysaccharides (alginate and xanthan gum), starch, proteins (whey protein and gelatin) and lipids (milk fat and hydrogenated fat), have been used for encapsulation for effective delivery to the gut [29,30,31,32,33]. Hydrogenated fat has been considered one of the most cost-effective materials for encapsulating bioactive compounds because of low cytotoxicity [34] and higher stability [35]. Alginate, derived from brown seaweed and a linear and anionic polysaccharide, is soluble in water in room temperature [36]. The ability to form gel without heating and cooling cycles makes alginate an attractive material for feed applications [37]. The inclusion of alginate to the starch or hydrogenated fat matrix improves the shape and surface properties that could be attributed to its remarkable crosslinking capability and excellent film-forming properties [38]. Another encapsulation material, the edible wax, has been recently used as lipid-based delivery system [39].
Both organic acids and their salts have been used in aquafeed for better performance and disease resistance in aquatic animals [40]. The blend of organic acids used in this study contains fumaric acid, sorbic acid and citric acid. Salts of organic acids used are calcium propionate, calcium formate and sodium acetate. Dietary fumaric acid (catfish) [41], fumaric and sorbic acid (E. coli) [42], citric acid (E. coli) [43], calcium propionate (tilapia [44] and silver catfish [45]), calcium formate (shrimp) [13] and sodium acetate (tilapia [46] and yellowfin seabream [47]) showed varying levels of antimicrobial activity in vitro and in various farmed species. Most studies to date tested a single compound in free-form and rarely a combination of two or more compounds. In addition, there are very few studies with shrimp using a dietary microencapsulated blend of organic acids or their salts.
The aim of this study is to find the most effective way to deliver alternative solutions to antibiotics and antibiotic growth promoters (AGP) such as organic acid or organic acid salts in the hindgut of shrimp. In this study, the effects of blends of organic acids (fumaric acid, sorbic acid and citric acid) and organic acid salts (calcium propionate, calcium formate and sodium acetate) encapsulated with hydrogenated fat-HF, a mixture of HF and alginate-HA, wax esters-WE and double coating with HA and WE-HAWE on Pacific white shrimp performance, immune response and disease resistance were assessed.

2. Materials and Methods

The experiment had two components: in vitro microencapsulation stability tests and in vivo feeding trial with Pacific white shrimp fed diets supplemented with microencapsulated blends of fumaric, sorbic and citric acids (OA), and calcium propionate, calcium formate and sodium acetate (OS).

2.1. Stability Tests

Four microencapsulation products using hydrogenated fat (HF), HF and alginate (HA), wax esters (WE) and double coating with HA followed by WE (HAWE) as encapsulation materials were tested to determine solubility or leaching of the active ingredient. All four products were prepared by spray drying and congealing where active ingredients are dispersed in HF, HA, WE and for the double coated HAWE; the process was conducted first with HA and them repeated with WE using a process slightly modified from Jyothi et al. [48]. Briefly, active ingredients are dispersed in a solution and spray-dried where the material solidifies onto the particles of active ingredients such that the microcapsules obtained are of matrix type.
For solubility, 10 g of each test product was mixed with 200 mL of deionized water, then stirred for 6 h at 100 rpm at 19 °C. After 6 h, the supernatant was filtered, and insoluble active ingredients from the filtrate were dried and weighed. A mix of organic acids corresponding to the active ingredients of the micro-encapsulated product was used as a control. The pH of the supernatant was determined after filtration. Each treatment was conducted in triplicate.

2.2. Feeding Trial

The feeding trial was conducted for 63 days at the Guangdong Ocean University field experimental station situated at Donghai Island, Zhanjiang of Guagdong province of China. Experimental procedure and animal care were accomplished in accordance with the ethical guidelines for the care and use of laboratory animals provided by the Animal Care Committee of the Guangdong Ocean University.

2.3. Experimental Design and Diet Preparation

Ten isoproteic (37.3 ± 0.12% CP) and isoenergetic (16.4 ± 0.02 MJ/kg) diets were prepared: diet 1—positive control with 20% FM (PC); diet 2—negative control with 13% fishmeal and 12% meat and bone meal (NC); diets 3–6 were manufactured by supplementing NC with 0.75 mg/kg of OA microencapsulated with HF, HA, WE and HAWE (OAHF, OAHA, OAWE and OAHAWE, respectively); diets 7–10 were manufactured by supplementing 0.85 mg/kg of OS microencapsulated with HF, HA, WE and HAWE (OSHF, OSHA, OSWE and OSHAWE, respectively) (Table 1 and Table 2). It was ensured that microencapsulated products contained the same amount of active ingredients. The microencapsulated test products were supplied by Jefo Nutrition Inc., Quebec, Canada. Diet composition and their proximate chemical composition including amino acid profile are provided in Table 1 and Table 2, respectively.
All feed ingredients were ground, sieved through 80-mesh screens, mixed with a V-type mixer (Shanghai Tianxiang & Chentai Pharmaceutical Co., Ltd., Shanghai, China), pelleted with a screw pelletizer (South China university of technology, Guangzhou, China) after adding 30% water, air-dried and then stored at −20 °C until used. Pellets of two different sizes, 1.0- and 1.5-mm diameter, were produced for the trial.

2.4. Experimental Conditions

Twenty-five thousand PL10 Pacific white shrimp L. vannamei postlarvae were obtained from Allied Pacific Aquaculture Co., Ltd., Zhanjiang, Guangdong, China. The shrimp were acclimatized in two cement pools for 40 days until the average body weight reached 0.3 g. From the cement pools, a total of 1600 white shrimp (0.33 ± 0.02g ABW) were selected and 40 shrimp/tank were randomly distributed into 40 cone-shaped tanks (350-L volume each) with four replicates per treatment.
The shrimp were fed the experimental diets four times daily (7:00, 11:00, 17:00 and 21:00 h) at 8–10% of their body weight. The water was completely exchanged once in every 2–3 days from the first to the fourth week and once daily from fifth to the ninth week.

2.5. Sampling

At the end of the experiment, shrimp were fasted for 24 h before the final sampling. For serum and hepatopancreatic analyses, 15 and 10 shrimps were randomly selected from each tank, respectively. Both analyses were not conducted on the same shrimp because of the possibility of interference of one sampling on another. For serum, the blood was drawn using a dispensable 1 mL syringe into 1.5 mL test-tube. The test-tubes were then stored at 4 °C overnight before being centrifuged at 5867× g for 10-min at 4 °C (3K30, Sigma, Hamburg, Germany). The supernatant was then collected into 1.5 mL tubes and stored at −80 °C for subsequent analyses. The hepatopancreas was removed from each shrimp, immediately frozen in liquid nitrogen and then stored at −80 °C for analysis. Another six shrimps from each tank were taken for body chemical composition, ground into slurry, lyophilized and kept at −20 °C until analysis.

2.6. Chemical Analyses and Enzymatic Assay

Diets, ingredients and body chemical composition were analyzed following AOAC (1995) protocols. Nitrogen for crude protein (CP, %N × 6.25) was analyzed using a Kjeldahl apparatus (KjeltecTM 8400, FOSS, Goteborg, Sweden), moisture by drying the samples at 105 °C under atmospheric pressure for 24 h, crude lipid using a Soxhlet apparatus (SoxtecTM 2050, FOSS, Goteborg, Sweden), crude ash by burning the samples at 550 °C using a muffle furnace (Shanghai Boxun industry & Commerce Co., Ltd., Shanghai, China) and gross energy using a bomb calorimeter (Changsha Kaiyuan Instruments, Changsha, China).
The activity of acid (ACP) and alkaline (ALP) phosphatase, total superoxide dismutase (T-SOD), malondialdehyde (MDA), lipase and amylase were determined using diagnostic kits (Nanjing Jiancheng Bioengineering Institute, Nanjing, China). Prophenoloxidase (PO) activity was measured spectrophotometrically by recording formation of dopachrome produced from L-di-hydroxy-phenylalanine (L-DOPA) following a procedure slightly modified from Huang et al. (2010). Briefly, 3 mg/mL L-DOPA solution was prepared by using 1 L of 0.1 M potassium phosphate buffer (0.1 M K2HPO4·3H2O, 0.1 M KH2PO4, adjusted to pH 6.6). Shrimp serum (20 μL) was mixed thoroughly with 980 μL L-DOPA solution. A 300 μL sample of the mixture was placed in a 96-well plate and incubated at room temperature. The absorbance was recorded after 6 min (ODsample) on a Microplate Spectrophotometer (Multilskan spectrum, Thermo Fisher Scientific, Waltham, MA, USA) at 490 nm. At the same time, 300 µL of L-DOPA solution was placed in a 96-well plate and absorbance of the blank control group was recorded (ODblank). Enzymatic activity for all assays was expressed as the change in absorbance/min.

2.7. Resistance to Vibrio Parahaemolyticus

Resistance to the pathogen V. parahaemolyticus was determined from the cumulative mortality of shrimp in 96 h. For this, 10 shrimps for each replicate (3 replicates in each treatment) were used. After injecting each shrimp with 2.4 × 10⁷ colony-forming units (CFU) of V. parahaemolyticus, the cumulative mortality in 96 h was recorded.

2.8. Scoring

All variables from treatment 3–8 were grouped into three categories to determine the most suitable composition (COMP: free acid vs. acid-salt) and microencapsulation (ENCAP: HF, HA, WE and HAWE), and scored ranging from 1–8. The scores assigned from smallest to largest are as follows: growth performance (SGR–1-8; FCR–8-1; and PER–1-8), nutrient utilization (PRE–1-8; LRE–1-8; and amylase (1-8) and lipase (1-8) activity) and immune response (serum SOD–1-8, ALP–1-8, ACP–1-8, PO–1-8 and MDA–8-1; and cumulative mortality–8-1).

2.9. Calculation

The equations to calculate different parameters are given below:
SGR = [ { ln FBW   ln IBW ] Days × 100  
where, SGR is specific growth rate, FBW is final body weight (g) and IBW is initial body weight (g).
F C R = F I W G
where FCR is feed conversion ratio, FI is feed intake (g) and WG is weight gain (g).
PER = W G P I × 100
where PER is protein efficiency ratio and PI is protein intake (g).
M D A s e r u m = [ O D s a m p l e O D s a m p l e   _ b l a n k O D s t a n d a r d O D s t a n d a r d _ b l a n k ] × S C × t i m e
where MDA is malondialdehyde (U/mL), SC is standard concentration (10 nmol/mL) and OD is optical density.
T S O D S e r u m = [ O D c o n t r a s t O D s a m p l e O D c o n t r a s t ] / 50 % × r e a c t i o n _ s y s t e m _ d i l u t e _ m u l t i p l e × s a m p l e _ d i l u t e _ m u l t i p l e  
where SOD is superoxide dismutase (U/mL).
T S O D H e p a t o p a n c r e a s = [ O D c o n t r a s t O D s a m p l e O D c o n t r a s t ] / 50 % × r e a c t i o n _ s y s t e m _ d i l u t e _ m u l t i p l e × h e p a t o p a n c r e a s _ p r o t e i n _ c o n t e n t  
where hepatopancreas protein content is expressed as mg_protin/mL.
A C P S e r u m = O D S a m p l e O D B l a n k O D S t a n d a r d O D B l a n k × S t d . C o n c . × 100   m L × S a m p l e _ d i l u t i o n _ t i m e s _ b e f o r e _ a s s a y
where ACP is acid phosphatase (King U/100 mL), Std.Conc. is standard concentration (0.1 mg/mL).
A C P H e p a t o p a n c r e a s = O D S a m p l e O D B l a n k O D S t a n d a r d O D B l a n k × S t d .   C o n c . P r o t e i n H e p a t o p a n c r e a s
where ACP is acid phosphatase (King U/g protein), Std.Conc. is standard concentration (0.1 mg/mL), protein content in hepatopancreas is expressed as g protein/mL.
A L P S e r u m = O D S a m p l e O D B l a n k O D S t a n d a r d O D B l a n k × S t d . C o n c . × 100   m L × S a m p l e _ d i l u t i o n _ t i m e s _ b e f o r e _ a s s a y
where ALP is alkaline phosphatase (King U/100 mL), Std.Conc. is standard concentration (0.1 mg/mL).
A L P H p a t o p a n c r e a s = O D S a m p l e O D B l a n k O D S t a n d a r d O D B l a n k × S t d .   C o n c . P r o t e i n H e p a t o p a n c r e a s
where ALP is alkaline phosphatase (King U/g protein), Std.Conc. is standard concentration (0.1 mg/mL), protein content in hepatopancreas is expressed as g protein/mL.
P h e n o l   O x i d a s e   U / m L = O D S a m p l e   ~   O D B l a n k 6 × 50 , 000
A m y l a s e   U / g   p r o t = O D B l a n k O D A s s a y O D B l a n k × 80 / [ S a m p l e   v o l u m e   0.1   m L × p r o t e i n   c o n c e n t r a t i o n   ( m g   p r o t / m L ]   × 1000
L i p a s e   U / g   p r o t = A S a m p l e 1 A S a m p l e 2 A S t a n d a r d × S t a n d a r d   t u b e   c o n c e n t r a t i o n   454   μ m o l / L × S a m p l e   d i l u t i o n   t i m e   i n   r e a c t i o n   s y s t e m / R e a c t i o n   t i m e   10   m i n P r o t e i n   c o n c e n t r a t i o n   i n   s a m p l e   h o m o g e n a t e   g   p r o t / L  

2.10. Statistical Analysis

All data were expressed as the mean ± SD (standard deviation) and subjected to one-way ANOVA (SPSS 17.0, Chicago, IL, USA). Percentage data were arcsine-square root transformed before statistical analysis. If there was a difference, multiple comparison analyses were performed using Duncan’s multiple-range tests. Statistically significant differences were considered when p < 0.05.

3. Results

During the feeding trial, the water temperature was ranged between 28 °C and 34 °C, and salinity, dissolved oxygen and total ammonia nitrogen content were maintained at 27–28 g/L, >7 mg/L and <0.03 mg/L, respectively. Feed intake was normal, and survival was not affected by the dietary treatments.

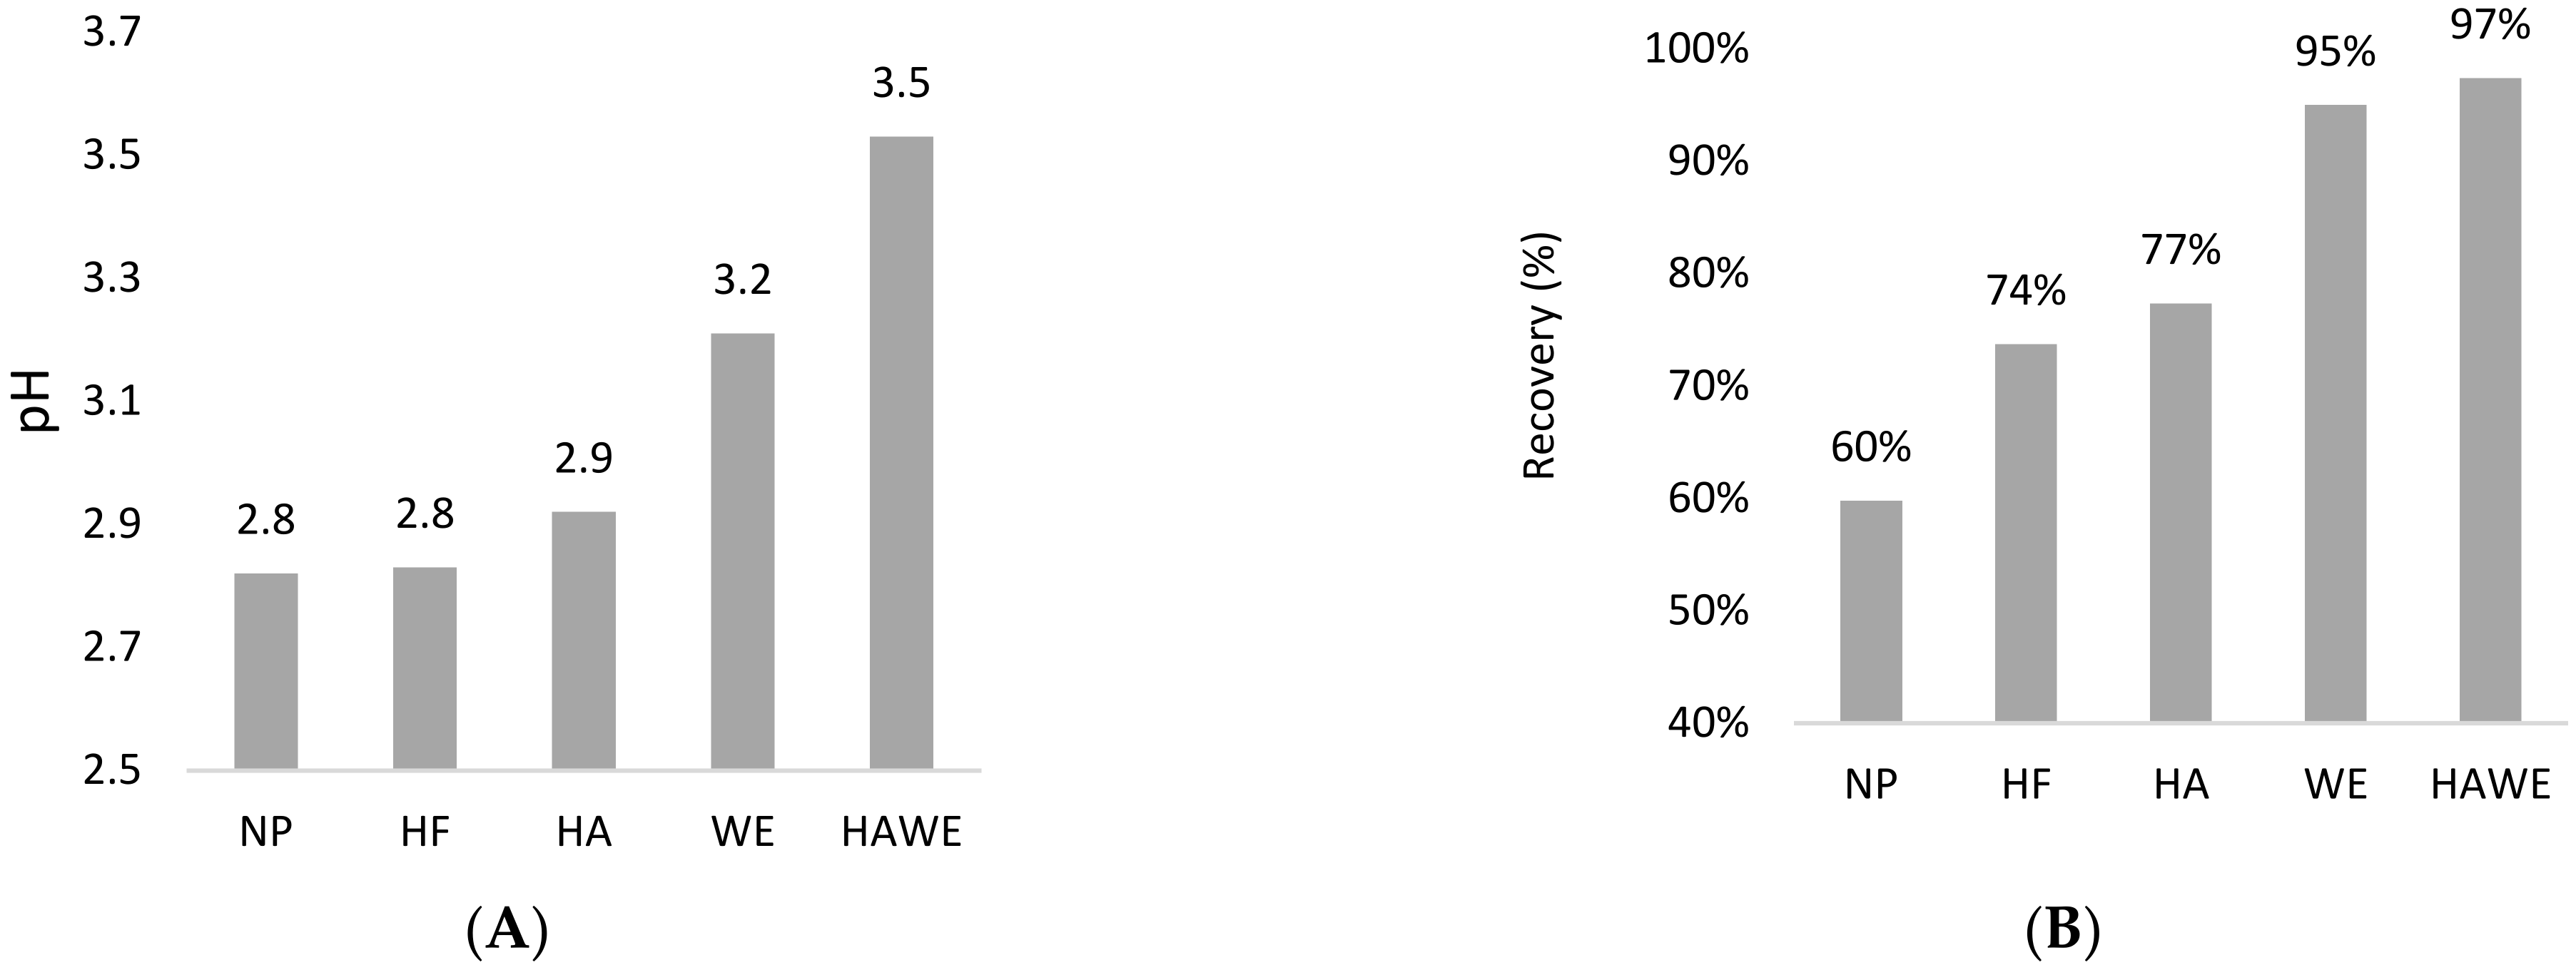
3.1. Stability of the Microencapsulation Materials

The pH values were similar among the non-protected acids, HF and HA microencapsulation (2.8–2.9) which slightly increased with WE (3.2) and HAWE (3.5) microencapsulation (Figure 1A). All four microencapsulation materials showed significantly higher recovery than the free acid. Corresponding to the pH values, the recovery was significantly higher for WE (95%) and HAWE (97%) compared to HF (74%) and HA (77%) (Figure 1B).

3.2. Growth Performance and Body Composition

Feed intake and growth were normal, similar to the studies conducted at the laboratory. Effects of the microencapsulated OA and OS on body chemical composition and final body weight, specific growth rate (SGR), feed conversion ratio (FCR) and protein efficiency ratio (PER) are presented in Table 3 and Table 4, respectively. The form of organic acids (free or salt) significantly affected the feed intake and FCR where shrimp fed diets with OA showed lower FCR and feed intake compared to those fed the OS diets (p < 0.05). There were no differences (p > 0.05) in body chemical composition among the treatments.

Nutrient Utilization and Hepatopancreatic Enzyme Activity

Either the form of organic acid (COMP) or the microencapsulation (¬ENCAP) did not affect (p > 0.05) protein deposition, lipid retention efficiency or hepatopancreatic amylase and lipase activity (Table 5). However, protein retention efficiency in shrimp fed diets supplemented with OA (0.29) was significantly higher (p = 0.016) than those fed the OS (0.28) diets. Significant interaction (COMP × ENCAP) was also observed in lipid deposition where OS (0.27) and HAWE (0.28) were higher compared to OA (0.26) and HF (0.24), HA (0.27) and WE (0.25) (p = 0.047).

3.3. Immune Response and Disease Resistance

No differences in cumulative 96-h mortality when challenged with Vibrio parahaemolyticus (Figure 2) and serum SOD, hepatopancreatic ALP, ACP and MDA (Table 6) were observed with either the main effects of COMP, ENCAP or their interaction (Table 6). Significant interaction was observed for serum ALP (p < 0.0001), ACP (p < 0.0001) and hepatopancreatic and serum phenol oxidase level (p < 0.0001). A significantly lower serum MDA level (p < 0.026) was observed in HF (6.4) compared to the other ENCAP (HA = 7.7, WE = 6.9 and HAWE = 7.7).

3.4. Scoring

Shrimp fed the OA diets showed higher scores in growth performance (58 vs. 38), nutrient utilization (67 vs. 57) and immune response (112 vs. 96) than those fed the OS diets with a combined score of 237 compared to 191 (Table 7). Among the four ENCAP, the overall scores of HF and HA (118 and 117, respectively) were higher than WE (95) and HAWE (98) (p < 0.05) (Table 7).

4. Discussion

This study investigated the efficacy of dietary organic acids (free or salt) microencapsulated with hydrogenated fat (HF), hydrogenated fat + alginate (HA), wax esters (WE) and the double coating of HAWE (first coated with HA followed by WE) on the performance of Pacific white shrimp. The organic acid blend contained fumaric acid (pKa = 3.03), sorbic acid (pKa = 4.75) and citric acid (pKa = 2.92–5.21). The organic acid salt blend contained Ca-propionate, Ca-formate and Na-acetate.
Organic acids are low molecular weight aldehyde-containing compounds with one or more carboxyl groups. They are used as a dietary supplement to reduce gastrointestinal tract pH and inhibit the growth of gram-negative bacteria through the disassociation of the acids and production of anions in bacterial cells [49]. As weak acids, the pKa values or the disassociation constant of organic acids are higher than the strong acids, such as HCl or H2SO4 [50]. These acids do not dissociate in the highly acidic stomach pH but tend to dissociate quickly in the proximal intestine as pH increases and the condition becomes alkaline. Shrimp are slow-eating animals taking 1–2 h to hold and chew the pellets. In free-form, organic acid or their salts have considerable risk of leaching in water, preventing them from reaching the hepatopancreas and gut in undissociated form [51]. Coating or encapsulation may significantly reduce leaching and, consequently, can remain effective at a lower dosage [11]. For example, micro-encapsulated organic acid salt blend used by Yao et al. [11] was much lower (835 mg/kg) than in their free form (2000–6000 mg/kg) reported in various studies [52,53]. Micro-encapsulation provides better protection than simple coating that may prevent or reduce the loss of the active ingredient in the case of breakage of the pills, as active ingredients are embedded in the matrix of coating material [54].
Microencapsulation of easily degradable bioactive compounds has become a popular and practical approach for masking unpleasant characteristics of the compounds and delivering them at the intended location of the gastrointestinal tract [24,55]. In this study, despite their lower solubility and recovery, both HF and HA (118 and 117, respectively) had higher total performance scores in vivo compared to WE and HAWE (95 and 98, respectively (Table 7). However, between HF and HA, the growth performance score was higher for HA but lower for immune response than those for HF. No differences in the nutrient utilization scores were observed between the two materials. Both HF and HA were tested in vitro by Omnojio et al. [26], and they observed well-timed release of the active ingredient. Timely release of the active ingredient at the intended location of the digestive tract is utterly important for their efficacy. Hydrogenated fat can be easily digested by intestinal lipase thus guaranteeing the slow release of the active ingredient along the GI tract. In a recent study, the efficacy of HF-based microencapsulated aluminum and iron sulfate in in situ chelation of undigestible phosphorus in the hind gut of rainbow trout were also reported by Ndiyae et al. [56]. The study confirms the release of the active ingredient in the hindgut where it was intended to bind with phosphorus, thus reducing the risk of eutrophication of the surrounding environment. The relatively poor performance of shrimp fed WE diets compared to those fed other treatment diets may be attributed to low solubility and higher retention of active ingredient than hydrogenated fat (Figure 1). Wax-based solid lipid matrix provides better physical stability and more protection against chemical reaction [39]. The positive characteristics, such as slower degradation and mass transfer rate, may not be suitable for shrimp for their short gut-transit time (~2 h) to release the active ingredient.
Blends of organic acids and their salts in free or microencapsulated forms have shown to improve the growth performance of fish [40,57,58] and shrimp [2,11,33,59], as well as antioxidant status [60]. Several studies reported improved growth performance, nutrient utilization and immune response in crustaceans fed a microencapsulated blend of organic acid or acid salts. Safari et al. [61] reported the efficacy of an encapsulated blend of Na-butyrate, Na-lactate and Na-propionate on growth performance and survival of crawfish at 20 g/kg. The OS blend used in the present study contains Ca-propionate, Ca-formate and Na-acetate, and showed higher feed intake compared to those fed the OA diets. Yao et al. [11] also reported improved weight gain and FCR in Pacific white shrimp compared to NC diet with the same OS blend. When compared between the OA and OS treatments of this study, shrimps fed the OA diets showed improved FCR, protein retention and immune response, i.e., higher ALP and PO than the OS blend (Table 4, Table 5 and Table 6). This is in accordance with the findings of Romano et al. (2015), who reported improved growth performance of Pacific white shrimp with 1–4% microencapsulated OA (blend of formic, lactic, malic and citric acids).
In an in vitro study, Mine and Boopathy [12] demonstrated EC50 values of 0.023%, 0.041%, 0.03% and 0.066% for formic, acetic, propionic and butyric acid, respectively, against Vibrio harveyi. Romano et al. [33] reported similar efficacy in V. harveyi resistance when shrimp were fed OA supplemented diets. Efficacy of organic acid in combination with essential oil against Vibrio sp. Infections was also demonstrated by He et al. [60], where a microencapsulated blend of organic acid (citric acid and sorbic acid) and essential oils (thymol and vanillin) showed significantly higher survival in Pacific white shrimp challenged with V. parahaemolyticus after 48-h compared to those fed the control diets. These are in accordance with the findings of the present study where treatments containing microencapsulated organic acid and organic acid salt blends showed significantly lower cumulative 96-h mortality ranging from 45 to 56% compared to 63% for those fed the NC diets when challenged with pathogenic V. parahaemolyticus (Figure 2).

5. Conclusions

This is one of the first reports comparing the effects of OA and OS on performance, nutrient utilization, immune response and disease resistance of Pacific white shrimp, as well as comparing different microencapsulation materials and techniques. Finding an effective microencapsulation strategy along with the effective composition of organic acid or their salts is important for sustainable development of the industry.
Based on the findings, it can be concluded that an organic acid blend microencapsulated with hydrogenated fat or hydrogenated fat + alginate may provide better responses in Pacific white shrimp and can be used as an effective strategy to improve immune response and disease resistance. Further studies are recommended to investigate the effects of microencapsulated organic acid compounds on intestinal health, metabolic response and gut microbiome of farmed Pacific white shrimp.

Author Contributions

Conceptualization, M.A.K.C. and X.-H.D.; Formal analysis, H.S., Y.L. and J.-D.B.; Investigation, H.S. and Y.L.; Supervision, X.-H.D.; Writing—original draft, M.A.K.C.; Writing—review & editing, J.-D.B. and X.-H.D. All authors have read and agreed to the published version of the manuscript.

Funding

This study was supported by the Special Fund for Agroscientific Research of Public Interest (No.201003020), by Guangdong Ocean University and Jefo Nutrition Inc., Canada.

Institutional Review Board Statement

The study was conducted according to the guidelines of the Guangdong Ocean University, China and approved by the Animal Care Committee.

Informed Consent Statement

Not applicable.

Data Availability Statement

Not applicable.

Conflicts of Interest

The authors declare no conflict of interest.

References

  1. Flegel, T.W. A future vision for disease control in shrimp aquaculture. J. World Aquacul. Soc. 2019, 50, 249–266. [Google Scholar] [CrossRef]
  2. Ng, W.-K.; Koh, C.-K.; Teoh, C.-Y.; Romano, N. Farm-raised tiger shrimp, Penaeus monodon, fed commercial feeds with added organic acids showed enhanced nutrient utilization, immune response and resistance to Vibrio harveyi challenge. Aquaculture 2015, 449, 69–77. [Google Scholar] [CrossRef] [Green Version]
  3. Limbu, S.M.; Chen, L.-Q.; Zhang, M.-L.; Du, Z.-Y. A global analysis on the systemic effects of antibiotics in cultured fish and their potential human health risk: A review. Rev. Aquacult. 2020. [Google Scholar] [CrossRef]
  4. World Health Organization (WHO). WHO Guidelines on Use of Medically Important Antimicrobials in Food-producing Animals; WHO: Geneva, Switzerland, 2017; 68p. [Google Scholar]
  5. Zhao, Y.; Yang, Q.E.; Zhou, X.; Wang, F.-H.; Muurinen, J.; Virta, M.P.; Brandt, K.K.; Zhu, Y.-G. Antibiotic resistome in the livestock and aquaculture industries: Status and solutions. Crit. Rev. Environ. Sci. Technol. 2020. [Google Scholar] [CrossRef]
  6. Kesselring, J.; Gruber, C.; Standen, B.; Wein, S. Effect of a phytogenic feed additive on the growth performance and immunity of Pacific white leg shrimp, Litopenaeus vannamei, fed a low fishmeal diet. J. World Aquacult. Soc. 2020, 1–13. [Google Scholar] [CrossRef]
  7. Yang, C.; Chowdhury, M.A.K.; Hou, Y.; Gong, J. Phytogenic compounds as alternatives to in-feed antibiotics: Potentials and challenges in application. Pathogens 2015, 4, 137–156. [Google Scholar] [CrossRef] [Green Version]
  8. Jamal, M.T.; Abdulrahman, I.A.; Al-Harbi, M.; Chithambaran, S. Probiotics as alternative control measures in shrimp aquaculture: A review. Appl. Biol. Biotech. 2019, 7, 69–77. [Google Scholar]
  9. Jueliang, P.; Chuchird, N.; Limsuwan, C. The effects of probiotic, β-1,3-glucan and organic acid on Pacific white shrimp’s (Litopenaeus vannamei) immune system and survival upon challenge with Vibrio harveyi. Fish. Environ. 2013, 3, 25–37. [Google Scholar]
  10. Song, H.-L.; Tan, B.-P.; Chi, S.-Y.; Liu, Y.; Chowdhury, M.A.K.; Dong, X.-H. The effects of a dietary protease-complex on performance, digestive and immune enzyme activity, and disease resistance of Litopenaeus vannamei fed high plant protein diets. Aquac. Res. 2017, 48, 2550–2560. [Google Scholar] [CrossRef]
  11. Yao, W.; Li, X.; Chowdhury, M.A.K.; Wang, J.; Leng, X.-J. Dietary protease, carbohydrase and micro-encapsulated organic acid salts individually or in-combination improved growth, feed utilization and intestinal histology of Pacific white shrimp. Aquaculture 2019, 503, 88–95. [Google Scholar] [CrossRef]
  12. Mine, S.; Boopathy, R. Effect of organic acids on shrimp Ppathogen, Vibrio harveyi. Curr. Microbiol. 2011, 63, 1–7. [Google Scholar] [CrossRef] [PubMed]
  13. DaSilva, B.C.; Vieira, F.N.; Mourino, J.L.P.; Ferreira, G.S.; Seiffert, W.Q. Salts of organic acids selection by multiple characteristics for marine shrimp nutrition. Aquaculture 2013, 384–387, 104–110. [Google Scholar] [CrossRef]
  14. Ng, W.-K.; Lim, C.-L.; Romano, N.; Kua, B.-C. Dietary short-chain organic acids enhanced resistance to bacterial infection and hepatopancreatic structural integrity of the giant freshwater prawn, Macrobrachium rosenbergii. Int. Aquat. Res. 2017, 9, 293–302. [Google Scholar] [CrossRef] [Green Version]
  15. Krome, C.; Schuele, F.; Jauncey, K.; Focken, U. Influence of a sodium formate/formic acid mixture on growth of juvenile common carp (Cyprinus carpio) fed different fishmeal replacement levels of detoxified Jatropha curcas kernel meal in practical, mixed diets. J. Appl. Aquac. 2018, 30, 137–156. [Google Scholar] [CrossRef]
  16. Nascimento, M.S.; Mattos, B.O.; Bussons, M.R.F.M.; Oliveira, A.T.; Liebi, A.R.S.; Carvalho, T.B. Supplementation of citric acid in plant protein- based diets for juvenile tambaqui, Colossoma macropomum. J. World Aquac. Soc. 2020. [Google Scholar] [CrossRef]
  17. Defoirdt, T.; Boon, N.; Sorgeloos, P.; Verstraete, W.; Bossier, P. Short-chain fatty acids and poly-β-hydroxyalkanoates: (New) Biocontrol agents for a sustainable animal production. Biotechnol. Adv. 2009, 27, 680–685. [Google Scholar] [CrossRef]
  18. Sarder, P.; Shamna, N.; Sahu, N.P. Acidifiers in aquafeed as an alternate growth promoter: A short review. Anim. Nutr. Feed Tech. 2020, 20, 253–366. [Google Scholar] [CrossRef]
  19. Ng, W.-K.; Koh, C.-B. The utilization and mode of action of organic acids in the feeds of cultured aquatic animals. Rev. Aquac. 2016, 9, 342–368. [Google Scholar] [CrossRef]
  20. Payne, A.I. Gut pH and digestive strategies in estuarine grey mullet (Mugilidae) and tilapia (Cichlidae). Fish. Biol. 1978, 13, 627–629. [Google Scholar] [CrossRef]
  21. Eklund, T. The antimicrobial effect of dissociated and undissociated sorbic acid at different pH levels. J. Appl. Bacteriol. 1983, 54, 383–389. [Google Scholar] [CrossRef]
  22. Li, H.; Ren, C.; Jiang, X.; Cheng, C.; Ruan, Y.; Zhang, X.; Huang, W.; Chen, T.; Hu, C. Na+/H+ exchanger (NHE) in Pacific white shrimp (Litopenaeus vannamei): Molecular cloning, transcriptional response to acidity stress, and physiological roles in pH homeostasis. PLoS ONE 2019, 14, e0212887. [Google Scholar] [CrossRef]
  23. Yu, Q.; Xie, J.; Huang, M.; Chen, C.; Qian, D.; Qin, J.G.; Chen, L.; Jia, Y.; Li, E. Growth and health responses to a long-term pH stress in Pacific white shrimp Litopenaeus vannamei. Aquac. Rep. 2020, 16, 100280. [Google Scholar] [CrossRef]
  24. Piva, A.; Pizzamiglio, V.; Mauro, M.; Tedeshchi, M.; Piva, G. Lipid microencapsulation allows slow release of organic acids and natural identical flavors along the swine intestine. Anim. Sci. 2007, 85, 486–493. [Google Scholar] [CrossRef] [PubMed] [Green Version]
  25. Chitprasert, P.; Sutaphanit, P. Holy basil (Ocimum sanctum Linn.) Essential oil delivery to swine gastrointestinal tract using gelatin microcapsules coated with aluminum carboxymethyl cellulose and beeswax. Agric. Food Chem. 2014, 62, 12641–12648. [Google Scholar] [CrossRef]
  26. Omonjio, F.A. Microencapsulation for Effective Delivery of Essential Oils to Improve Gut Health in Pigs. MSc Thesis, University of Manitoba, Winnipeg, MB, Canada, 2018; 126p. [Google Scholar]
  27. Yang, X.; Liu, Y.; Yan, F.; Yang, C.; Yang, X. Effects of encapsulated organic acids and essential oils on intestinal barrier, microbial count, and bacterial metabolites in broiler chickens. Poult. Sci. 2019, 98, 2858–2865. [Google Scholar] [CrossRef] [PubMed]
  28. Chen, H.; Ma, D.; Li, Y.; Liu, Y.; Wang, Y. Optimization the process of microencapsulation of Bifidobacterium bifidum BB01 by Box-Behnken design. Acta Univ. Cibiniensis. Ser. E Food. Tech. 2016, 20, 17–28. [Google Scholar] [CrossRef] [Green Version]
  29. Tester, R.F.; Karkalas, J.; Qi, X. Starch composition, fine structure and architecture. Cereal. Sci. 2004, 39, 151–165. [Google Scholar] [CrossRef]
  30. Udachan, I.S.; Sahu, A.K.; Hend, F.M. Extraction and characterization of sorghum (Sorghum bicolor L. Moench) starch. Int. Food Res. J. 2012, 19, 315–319. [Google Scholar]
  31. Fiorda, F.A.; Soares, M.S., Jr.; DaSilva, F.A.; DeMoura, C.M.A.; Grossmann, M.V.E. Physical quality of snacks and technological properties of pre-gelatinized flours formulated with cassava starch and dehydrated cassava bagasse as a function of extrusion variables. LWT Food Sci. Tech. 2015, 62, 1112–1119. [Google Scholar] [CrossRef]
  32. Zhu, F. Encapsulation and delivery of food ingredients using starch based systems. Food Chem. 2017, 229, 542–552. [Google Scholar] [CrossRef]
  33. Romano, N.; Mobili, P.; Zuniga-Hansen, M.E.; Gomez-Zavaglia, A. Physico-chemical and structural properties of crystalline inulin explain the stability of Lactobacillus plantarum during spray-drying and storage. Food Res. Int. 2018, 113, 167–174. [Google Scholar] [CrossRef]
  34. Müller, R.H.; Radtke, M.M.; Wissing, S.A. Nanostructured lipid matrices for improved microencapsulation of drug. Int. J. Pharm. 2000, 242, 121–128. [Google Scholar] [CrossRef]
  35. Souto, E.B.; Müller, R.H. Lipid nanoparticles: Effect on bioavailability and pharmacokinetic changes. Handb. Exp. Pharmacol. 2010, 197, 115–141. [Google Scholar]
  36. Dragan, E.S. Design and applications of interpenetrating polymer network hydrogels. A review. Chem. Eng. J. 2014, 243, 572–590. [Google Scholar] [CrossRef]
  37. Benavides, S.; Cortes, P.; Parada, J.; Franco, W. Development of alginate microspheres containing thyme essential oil using ionic gelation. Food Chem. 2016, 204, 77–83. [Google Scholar] [CrossRef] [PubMed]
  38. Costa, R.S.; Teixeria, C.; Alves, T.V.G.; Ribeiro-Costa, R.M.; Casazza, A.A.; Aliakbarian, B.; Coverti, A.; Silva, J.O.C., Jr.; Perego, P. Optimization of spray drying conditions to microencapsulate cupuassu (Theobroma grandiflorum) seed by-product extract. Nat. Prod. Res. 2018, 33, 2600–2608. [Google Scholar] [CrossRef]
  39. Soleimanian, Y.; Goli, S.A.H.; Shirvani, A.; Elmizadfeh, A.; Marangoni, A.G. Wax-based delivery systems: Preparation, characterization, and food applications. Comp. Rev. Food Sci. Food Saf. 2020. [Google Scholar] [CrossRef]
  40. Huan, D.; Li, X.; Chowdhury, M.A.K.; Yang, H.; Liang, G.; Leng, X.J. Organic acid salts, protease and their combination in fish meal-free diets improved growth, nutrient retention and digestibility of tilapia (Oreochromis niloticus × O. aureus). Aquac. Nutr. 2018, 24, 1813–1821. [Google Scholar] [CrossRef]
  41. Omosowone, O.; Dada, A.; Adeparusi, E. Effects of dietary supplementation of fumaric acid on growth performance of African catfish Clarius gariepinus and Aeromonas sobria challenge. Croat. J. Fish. 2015, 73, 13–19. [Google Scholar] [CrossRef] [Green Version]
  42. Lu, H.J.; Breidt, F.; Perez-Diaz, I.M.; Osborne, J.A. Antimicrobial effects of weak Acids on the survival of Escherichia coli O157:H7 under anaerobic conditions. J. Food Protect. 2011, 74, 893–898. [Google Scholar] [CrossRef]
  43. Allende, A.; McEvoy, J.; Tao, Y.; Luo, Y. Antimicrobial effect of acidified sodium chlorite, sodium chlorite, sodium hypochlorite, and citric acid on Escherichia coli O157:H7 and natural microflora of fresh-cut cilantro. Food Control. 2009, 20, 230–234. [Google Scholar] [CrossRef]
  44. Reda, R.M.; Mahmoud, R.; Selim, K.M.; El-Araby, I.E. Effects of dietary acidifiers on growth, hematology, immune response and disease resistance of Nile tilapia, Oreochromis niloticus. Fish Shellfish. Immun. 2016, 50, 255–262. [Google Scholar] [CrossRef]
  45. Pereira, S.A.; Oliveira, H.M.; Jesus, G.F.A.; Adam, K.G.S.; Silva, B.C.; Yamashita, M.M.; Lehmann, N.B.; Martins, M.L.; Mourinho, J.L.P. Can the minerals calcium and sodium, chelated to propionic acid, influence the health and zootechnical parameters of native silver catfish Rhamdia quelen? Aquaculture 2018, 496, 88–95. [Google Scholar] [CrossRef]
  46. Li, M.; Hu, F.-C.; Qiao, F.; Du, Z.-Y.; Zhang, M.-L. Sodium acetate alleviated high-carbohydrate induced intestinal inflammation by suppressing MAPK and NF-κB signaling pathways in Nile tilapia (Oreochromis niloticus). Fish Shellfish. Immun. 2020, 98, 758–765. [Google Scholar] [CrossRef] [PubMed]
  47. Sangari, M.; Sotoudeh, E.; Bagheri, D.; Morammazi, S.; Torfi, M. Growth, body composition, and hematology of yellowfin seabream (Acanthopagrus latus) given feeds supplemented with organic acid salts (sodium acetate and sodium propionate). Aquac. Int. 2021, 29, 261–273. [Google Scholar] [CrossRef]
  48. Jyothi, N.V.N.; Prasanna, P.M.; Sarkerkar, S.N.; Prabha, K.S.; Ramaiah, P.S.; Srawan, G.Y. Microencapsulation techniques, factors influencing encapsulation efficiency. Microencap 2010, 27, 187–197. [Google Scholar] [CrossRef]
  49. Hosseinifar, S.H.; Sun, Y.-Z.; Caipang, C.M. Short-chain fatty acids as feed supplements for sustainable aquaculture: An updated view. Aquac. Res. 2016, 48, 1380–1391. [Google Scholar] [CrossRef]
  50. Soames, A.; Iglauer, S.; Barifcani, A.; Gubner, R. Acid dissociation constant (pKa) of common monoethylene glycol (MEG) regeneration organic acids and methyldiethanolamine at varying MEG concentration, temperature, and ionic strength. Chem. Eng. Dat. 2018, 63, 2904–2913. [Google Scholar] [CrossRef]
  51. Romano, N.; Koh, C.-B.; Ng, W.-K. Dietary microencapsulated organic acids blend enhances growth, phosphorus utilization, immune response, hepatopancreatic integrity and resistance against Vibrio harveyi in white shrimp, Litopenaeus vannamei. Aquaculture 2015, 435, 228–236. [Google Scholar] [CrossRef]
  52. Su, X.; Li, X.; Leng, X.; Tan, C.; Liu, B.; Chai, X.; Guo, T. The improvement of growth, digestive enzyme activity and disease resistance of white shrimp by the dietary citric acid. Aquac. Int. 2014, 22, 1823–1835. [Google Scholar] [CrossRef]
  53. Chuchird, N.; Rorkwiree, P.; Rairat, T. Effect of dietary formic acid and astaxanthin on the survival and growth of Pacific white shrimp (Litopenaeus vannamei) and their resistance to Vibrio patahaemolyticus. Springerplus 2015, 4, 440. [Google Scholar] [CrossRef] [PubMed] [Green Version]
  54. Bakry, A.M.; Abbas, S.; Ali, B.; Majeed, H.; Abouelwafa, M.Y.; Mousa, A.; Li, L. Microencapsulation of oils: A comprehensive review of benefits, techniques, and applications. Comp. Rev. Food Sci. Saf. 2015, 15, 143–182. [Google Scholar] [CrossRef]
  55. Chen, J.; Wang, Q.; Liu, C.M.; Gong, J. Issues deserve attention in encapsulating probiotics: Critical review of existing literatures. Crit. Rev. Food Sci. Nut. 2017, 57, 1228–1238. [Google Scholar] [CrossRef]
  56. Ndiaye, W.N.; Deschamps, M.-H.; Comeau, Y.; Chowdhury, K.; Bunod, J.-D.; Letourneau-Montminy, M.-P.; Vandenberg, G. In situ chelation of phosphorus using microencapsulated aluminum and iron sulfate to bind intestinal phosphorus in rainbow trout (Oncorhynchus mykiss). Anim. Feed Sci. Tech. 2020. [Google Scholar] [CrossRef]
  57. Moradi, S. Effect of Feeding Diets Containing Organic Acid (Propionic Acid and Formic Acid) on Growth Indices, Salinity Stress Resistance and Intestine Microbiota in Common Carp (Cyprinus carpio). Master Thesis, Gorgan University of Agricultural Sciences and Natural Resources, Gorgan, Iran, 2015; p. 70. [Google Scholar]
  58. Sherif, A.H.; Doaa, M.G. Studies on the effect of acidifier on cultured Oreochromis niloticus fish. J. Arab. Aquac. Soc. 2013, 8, 229–236. [Google Scholar]
  59. Rombenso, A.N.; Truong, H.; Simon, C. Dietary butyrate alone or in combination with succinate and fumarate improved survival, feed intake, growth and nutrient retention efficiency of juvenile Penaeus monodon. Aquaculture 2020, 528, 735492. [Google Scholar] [CrossRef]
  60. He, W.; Rahimnejad, S.; Wang, L.; Song, K.; Lu, K.; Zhang, C. Effects of organic acids and essential oils blend on growth, gut microbiota, immune response and disease resistance of Pacific white shrimp (Litopenaeus vannamei) against Vibrio parahaemolyticus. Fish Shell. Immun. 2017, 70, 164–173. [Google Scholar] [CrossRef] [PubMed]
  61. Safari, O.; Paolucci, M.; Motlagh, H.M. Effect of dietary encapsulated organic salts (Na-acetate, Na-butyrate, Na-lactate and Na-propionate) on growth performance, haemolymph, antioxidant and digestive enzyme activities and gut microbiota of juvenile narrow clawed crayfish, Astacus leptodactylus Eschscholtz, 1823. Aquac. Nutr. 2021, 27, 91–104. [Google Scholar]
Figure 1. The pH value (A) and recovery (B) of the active ingredient during the in vitro solubility test of four microencapsulations (HF, HA, WE and HAWE) compared the non-protected product (NP). Note: NP—unprotected, HF—hydrogenated fat, HA—HA + alginate, WE—wax ester, HAWE—double coating with HA and WE.
Sustainability 13 07791 g001
Figure 2. Cumulative 96-h mortality under pathogenic Vibrio parahaemolyticus challenge of shrimp fed the control and test diets. Note: PC—positive control, NC—negative control, OA—organic acid, OS—organic acid salt, HF—hydrogenated fat, HA—HA + alginate, WE—wax ester, HAWE—double coating with HA and WE.
Sustainability 13 07791 g002
Table 1. Ingredient composition of the control and test diets.
Ingredient (g/kg)PCNCOAHFOAHAOAWEOAHAWEOSHFOSHAOSWEOSHAWE
Fish meal, 70% CP200.0130.0130.0130.0130.0130.0130.0130.0130.0130.0
Shrimp meal, 46%CP30.030.030.030.030.030.030.030.030.030.0
Soybean meal 50%CP30.0120.0120.0120.0120.0120.0120.0120.0120.0120.0
Corn gluten meal, 61% CP60.060.060.060.060.060.060.060.060.060.0
Peanut meal, 41%CP75.075.075.075.075.075.075.075.075.075.0
Soybean meal, 52%CP120.0120.0120.0120.0120.0120.0120.0120.0120.0120.0
Wheat flour318.0318.0318.0318.0318.0318.0318.0318.0318.0318.0
Fish oil15.015.015.015.015.015.015.015.015.015.0
Soy lecithin10.010.010.010.010.010.010.010.010.010.0
Soybean oil15.015.015.015.015.015.015.015.015.015.0
Lysine-HCl0.02.32.32.32.32.32.32.32.32.3
Methionine0.01.21.21.21.21.21.21.21.21.2
Choline chloride5.05.05.05.05.05.05.05.05.05.0
Di-calcium phosphate10.810.810.810.810.810.810.810.810.810.8
Mineral premix a8.08.08.08.08.08.08.08.08.08.0
Vitamin premix b2.02.02.02.02.02.02.02.02.02.0
Antioxidant0.30.30.30.30.30.30.30.30.30.3
Microencapsulated OA or OS0.00.00.750.750.750.80.850.90.90.9
Cellulose99.475.975.275.275.275.275.175.175.175.1
Vitamin C0.50.50.50.50.50.50.50.50.50.5
Attractant1.01.01.01.01.01.01.01.01.01.0
Total1000.01000.01000.01000.01000.01000.01000.01000.01000.01000.0
Note: PC—positive control, NC—negative control, OA—organic acid, OS—organic acid salt, HF—hydrogenated fat, HA—HA + alginate, WE—wax ester, HAWE—double coating with HA and WE. a Contained the following (per kg of mineral premix): KIO4 0.03 g, CoCl2∙6H2O 4.07 g, CuSO4∙5H2O 19.84 g, ferric citrate 13.71 g, ZnSO4∙7H2O 28.28 g, MgSO4∙7H2O 0.12 g, CaH2PO4 80 g, MnSO4∙H2O 12.43 g, KCl 15.33 g, Na2SeO3 2 g, zeolite power 824.19 g. b Contained the following (per kg of vitamin premix): Vit-A 10 g, Vit-D3 50 g, Vit-E 99 g, Vit-K 5.0 g, Vit-B1 25.50 g, Vit-B2 25 g, Vit-B6 50 g, Vit-B12 0.1 g, calcium pantothenate 61 g, nicotinic acid 101 g, biotin 25 g, inositol 153.06 g, folic acid 6.25 g, cellulose 389.09 g.
Table 2. Proximate chemical composition and calculated essential amino acid profile of the control and test diets (dry matter—DM basis).
Proximate Composition, DM BasisPCNCOAHFOAHAOAWEOAHAWEOSHFOSHAOSWEOSHAWE
Dry matter, %91.391.691.591.691.691.591.891.691.591.5
Crude protein, %37.237.237.237.437.137.437.337.437.437.4
Crude lipid, %8.08.07.97.97.98.07.98.08.08.0
Crude ash, %8.08.07.97.97.98.08.07.98.08.0
Gross energy, MJ/kg16.416.416.416.416.416.416.516.516.416.4
Digestible EAA, %
Methionine, %0.800.800.800.800.800.800.800.800.800.80
Cystine, %0.470.450.450.450.450.450.450.450.450.45
Methionine + Cystine, % 1.271.241.241.241.241.241.241.241.241.24
Lysine, %2.172.172.172.172.172.172.172.172.172.17
Tryptophan, %0.390.350.350.350.350.350.350.350.350.35
Threonine, %1.311.281.281.281.281.281.281.281.281.28
Isoleucine, %1.331.281.281.281.281.281.281.281.281.28
Histidine, %0.880.900.900.900.900.900.900.900.900.90
Valine, %2.081.911.911.911.911.911.911.911.911.91
Leucine, %2.522.452.452.452.452.452.452.452.452.45
Arginine, %2.412.282.282.282.282.282.282.282.282.28
Phenylalanine, %1.411.401.401.401.401.401.401.401.401.40
Tyrosine, %0.860.710.710.710.710.710.710.710.710.71
Phenylalanine + Tyrosine, %2.272.112.112.112.112.112.112.112.112.11
Note: PC—positive control, NC—negative control, OA—organic acid, OS—organic acid salt, HF—hydrogenated fat, HA—HA + alginate, WE—wax ester, HAWE—double coating with HA and WE.
Table 3. Whole body chemical composition of Pacific white shrimp fed the control and test diets (dry matter basis).
TreatmentsDry Matter (%)Crude Protein (%)Crude Lipid (%)Crude Ash (%)
PC22.9 ± 0.7273.2 ± 0.328.7 ± 0.5713.5 ± 0.35
NC22.6 ± 0.9873.9 ± 1.118.5 ± 0.4913.2 ± 0.67
OAHF22.3 ± 0.8473.4 ± 1.838.2 ± 0.7713.3 ± 1.05
OAHA23.2 ± 0.5874.6 ± 1.068.7 ± 0.3013.1 ± 0.21
OAWE22.8 ± 0.5374.3 ± 0.158.2 ± 0.8213.7 ± 0.69
OAHAWE22.9 ± 0.7774.0 ± 0.918.5 ± 0.6213.5 ± 0.63
OSHF22.5 ± 0.7873.7 ± 0.988.1 ± 0.4513.5 ± 0.30
OSHA23.2 ± 0.7773.6 ± 0.308.9 ± 0.6213.2 ± 0.76
OSWE23.1 ± 0.5873.4 ± 1.479.0 ± 0.4613.2 ± 0.72
OSHAWE22.8 ± 0.6573.7 ± 0.778.8 ± 0.6814.0 ± 0.70
COMP
OA22.7 ± 0.3613.3 ± 0.2874.0 ± 0.498.4 ± 0.24
OS22.9 ± 0.2913.3 ± 0.1573.7 ± 0.288.6 ± 0.39
ENCAP
HF22.4 ± 0.13 b13.4 ± 0.1373.6 ± 0.208.2 ± 0.07
HA23.2 ± 0.00 a13.2 ± 0.0874.1 ± 0.678.8 ± 0.18
WE23.0 ± 0.17 a13.5 ± 0.3973.8 ± 0.638.6 ± 0.57
HAWE22.9 ± 0.07 a13.7 ± 0.3873.9 ± 0.258.7 ± 0.17
p-Value
COMP0.3010.1680.4550.860
ENCAP0.0290.4560.9630.997
COMP × ENCAP0.0800.2100.5760.414
Note: PC—positive control, NC—negative control, OA—organic acid, OS—organic acid salt, HF—hydrogenated fat, HA—HA + alginate, WE-wax ester, HAWE-double coating with HA and WE; COMP—composition; ENCAP—microencapsulation. Values in a column with different superscripts (a, b, …) are significantly different from each other (p < 0.05). p-values in bold are significant.
Table 4. Growth performance (final body weight, specific growth rate, feed intake, feed conversion ratio, protein efficiency ratio) of shrimp fed the control and test diets.
TreatmentsFBW (g)SGRFI (g/shrimp)FCRPER
PC13.0 ± 1.9 ab5.7 ± 0.2 ab20.9 ± 2.8 ab1.65 ± 0.04 ab1.63 ± 0.04 ab
NC12.3 ± 0.6 b5.6 ± 0.1 b20.5 ± 0.5 ab1.72 ± 0.05 a1.57 ± 0.04 b
OAHF13.1 ± 1.3 ab5.7 ± 0.2 ab19.8 ± 1.8 b1.56 ± 0.10 b1.73 ± 0.11 a
OAHA13.3 ± 1.0 ab5.8 ± 0.1 ab19.9 ± 1.7 b1.54 ± 0.05 b1.74 ± 0.06 a
OAWE12.4 ± 1.3 ab5.7 ± 0.2 ab18.7 ± 2.0 b1.55 ± 0.00 b1.74 ± 0.00 a
OAHAWE14.0 ± 2.2 ab5.8 ± 0.2 ab21.8 ± 3.6 ab1.60 ± 0.03 ab1.67 ± 0.04 ab
OSHF13.0 ± 1.6 ab5.7 ± 0.2 ab20.4 ± 2.3 ab1.62 ± 0.14 ab1.67 ± 0.14 ab
OSHA13.7 ± 1.0 ab5.8 ± 0.1 ab21.8 ± 0.6 ab1.63 ± 0.08 ab1.64 ± 0.08 ab
OSWE13.8 ± 0.3 ab5.8 ± 0.0 ab22.2 ± 1.4 ab1.65 ± 0.07 ab1.63 ± 0.07 ab
OSHAWE14.6 ± 1.0 a5.9 ± 0.1 a23.6 ± 2.7 a1.65 ± 0.09 ab1.62 ± 0.09 ab
COMP
OA13.2 ± 0.665.8 ± 0.0620.1 ± 1.29 b1.56 ± 0.03 b1.72 ± 0.03 a
OS13.8 ± 0.665.8 ± 0.0822.0 ± 1.32 a1.63 ± 0.02 a1.64 ± 0.02 b
ENCAP
HF13.1 ± 0.075.7 ± 0.0720.1 ± 0.421.59 ± 0.04 b1.70 ± 0.04
HA13.5 ± 0.285.8 ± 0.0020.9 ± 1.341.59 ± 0.06 ab1.69 ± 0.07
WE13.1 ± 0.995.8 ± 0.0720.5 ± 2.471.60 ± 0.06 ab1.69 ± 0.08
HAWE14.3 ± 0.425.9 ± 0.0722.7 ± 1.271.63 ± 0.04 a1.65 ± 0.04
p-Value
COMP0.1170.1250.0170.0120.013
ENCAP0.3970.5040.1220.3390.208
COMP × ENCAP0.4010.4530.4260.4700.382
Note: FBW—final body weight, SGR—specific growth rate, FI—feed intake, FCR—feed conversion ratio, PER—protein efficiency ratio, PC—positive control, NC—negative control, OA—organic acid, OS—organic acid salt, HF—hydrogenated fat, HA—HA + alginate, WE—wax ester, HAWE—double coating with HA and WE; COMP—composition; ENCAP—microencapsulation. Values in a column with different superscripts (a, b, …) are significantly different from each other (p < 0.05). p-values in bold are significant.
Table 5. Nutrient utilization and digestive enzyme (amylase and lipase) activity in shrimps fed the control and test diets.
TreatmentsPD (g)LD (g)PRE (%)LRE (%)HP Amylase
(U/gprot)
HP Lipase
(U/gprot)
PC2.13 ± 0.360.25 ± 0.05 abc27.3 ± 1.2 ab15.2 ± 1.2 ab54.1 ± 12.1 a21.5 ± 3.2 a
NC1.99 ± 0.160.23 ± 0.03 bc26.1 ± 1.5 b13.8 ± 1.3 b41.6 ± 6.0 b8.9 ± 0.7 e
OAHF2.15 ± 0.270.24 ± 0.04 abc29.1 ± 3.2 ab15.4 ± 2.0 ab51.2 ± 6.0 ab16.6 ± 4.5 bcd
OAHA2.23 ± 0.150.26 ± 0.02 abc30.0 ± 1.5 a16.5 ± 0.5 a47.4 ± 5.9 ab12.1 ± 1.5 de
OAWE2.05 ± 0.260.23 ± 0.03 c29.5 ± 0.6 a15.1 ± 1.6 ab49.1 ± 7.2 ab15.7 ± 3.2 bcd
OAHAWE2.33 ± 0.470.27 ± 0.04 abc28.4 ± 1.7 ab15.2 ± 0.5 ab47.8 ± 1.8 ab14.6 ± 2.4 bcd
OSHF2.10 ± 0.300.23 ± 0.03 abc27.7 ± 3.1 ab14.3 ± 1.0 ab47.8 ± 3.7 ab18.3 ± 4.0 ab
OSHA2.28 ± 0.140.28 ± 0.02 abc27.9 ± 1.1 ab15.9 ± 1.3 ab49.6 ± 7.3 ab17.7 ± 2.8 abc
OSWE2.25 ± 0.060.27 ± 0.01 abc27.2 ± 1.7 ab15.6 ± 1.2 ab47.6 ± 2.0 ab14.2 ± 2.3 bcd
OSHAWE2.39 ± 0.180.28 ± 0.01 a27.2 ± 2.0 ab15.1 ± 1.7 ab49.1 ± 5.9 ab14.8 ± 3.2 bcd
COMP
OA2.19 ± 0.120.26 ± 0.000.29 ± 0.68 a15.6 ± 0.6548.9 ± 1.7114.8 ± 1.95
OS2.26 ± 0.120.27 ± 0.020.28 ± 0.36 b15.2 ± 0.7048.5 ± 0.9816.3 ± 2.05
ENCAP
HF2.12 ± 0.040.24 ± 0.01 b28.4 ± 0.9914.9 ± 0.7849.5 ± 1.4017.5 ± 1.20
HA2.25 ± 0.040.27 ± 0.01 a29.0 ± 1.4816.2 ± 0.4249.5 ± 1.5614.9 ± 3.96
WE2.15 ± 0.140.25 ± 0.03 ab28.4 ± 1.6315.4 ± 0.3548.4 ± 1.0615.0 ± 1.06
HAWE2.36 ± 0.040.28 ± 0.01 a27.8 ± 0.8515.2 ± 0.0748.5 ± 0.9214.7 ± 0.14
p-Value
COMP0.1480.0740.0220.4810.7160.677
ENCAP0.2660.0470.0790.6420.4860.560
COMP × ENCAP0.2470.0470.3790.2160.1220.882
Note: PD—protein deposition, LD—lipid deposition, PRE—protein retention efficiency, LRE—lipid retention efficiency, HP—hepatopancreatic, PC—positive control, NC—negative control, OA—organic acid, OS—organic acid salt, HF—hydrogenated fat, HA—HA + alginate, WE—wax ester, HAWE—double coating with HA and WE; COMP—composition; ENCAP—microencapsulation. Values in a column with different superscripts (a, b, c, …) are significantly different from each other (p < 0.05). p-values in bold are significant.
Table 6. Antioxidant capacity, immune response and cumulative 96-h mortality under pathogenic Vibrio parahaemolyticus challenge of shrimp fed the control and test diets.
TreatmentsSOD (Unit/mL)ALP (Unit/mL)ACP (Unit/mL)PO (Unit/mL)MDA (mmol/L)CM (%)
SerumHepatopancreasSerumHepatopancreasSerumHepatopancreasSerumHepatopancreasSerum
PC339.1 ± 23.9 a397.9 ± 21.0 abc17.4 ± 3.3 ab493.5 ± 8.8 a62.9 ± 1.3 a885.4 ± 46.8 ab761.5 ± 14.2 a2.3 ± 0.2 abc7.1 ± 0.7 bcd42.2 ± 1.8 d
NC264.4 ± 31.8 c306.2 ± 69.4 d7.2 ± 0.9 f431.6 ± 5.4 b19.8 ± 0.4 e535.4 ± 68.8 f427.4 ± 21.9 e2.5 ± 0.2 abc9.3 ± 0.7 a62.8 ± 5.9 a
OAHF316.4 ± 42.6 ab340.5 ± 56.2 cd16.8 ± 1.7 b475.9 ± 15.3 ab38.6 ± 2.9 b800.0 ± 10.8 abcd694.1 ± 79.7 ab2.4 ± 0.3 abc6.6 ± 0.8 cd47.2 ± 2.3 bcd
OAHA296.5 ± 19.6 abc356.1 ± 61.8 bcd7.8 ± 0.3 ef491.2 ± 77.5 a21.2 ± 0.7 de704.2 ± 87.3 de715.3 ± 47.8 ab2.3 ± 0.4 abc7.8 ± 1.5 bc51.3 ± 9.2 bc
OAWE306.1 ± 18.0 abc387.7 ± 56.4 abc9.3 ± 0.9 def518.3 ± 22.0 a14.0 ± 0.2 f820.8 ± 138.5 abcd625.0 ± 88.8 bc2.2 ± 0.3 c6.8 ± 0.4 bcd55.6 ± 9.1 ab
OAHAWE291.5 ± 39.1 bc420.9 ± 55.0 ab14.6 ± 0.4 c503.0 ± 27.1 a36.8 ± 4.5 b718.8 ± 90.1 cd460.4 ± 42.7 de2.2 ± 0.2 c7.5 ± 1.4 bcd45.0 ± 4.1 cd
OSHF300.6 ± 20.5 abc459.5 ± 25.3 a8.6 ± 0.0 def511.8 ± 37.5 a25.7 ± 3.7 c600.0 ± 64.2 ef464.6 ± 20.8 de2.2 ± 0.3 c6.2 ± 0.7 d52.2 ± 6.4 bc
OSHA323.5 ± 26.7 abc352.1 ± 29.7 bcd18.8 ± 1.0 a513.2 ± 37.9 a25.6 ± 1.3 c906.3 ± 61.4 a537.5 ± 110.8 cd2.3 ± 0.1 bc7.5 ± 0.8 bcd50.0 ± 4.5 bcd
OSWE296.8 ± 8.0 abc382.5 ± 32.0 bcd14.7 ± 0.4 c463.0 ± 27.3 ab13.4 ± 0.9 f779.2 ± 10.8 bcd431.9 ± 14.2 e2.7 ± 0.1 ab7.0 ± 0.7 bcd45.0 ± 4.1 cd
OSHAWE303.2 ± 26.8 abc351.8 ± 36.7 bcd10.1 ± 0.4 d472.3 ± 36.9 ab23.1 ± 1.9 cd829.2 ± 54.3 abc437.5 ± 3.4 e2.4 ± 0.4 abc7.9 ± 0.9 abc47.2 ± 2.3 bcd
COMP
OA302.6 ± 11.0376.3 ± 35.6 b12.1 ± 4.27 b497.1 ± 18.927.7 ± 12.0761.0 ± 58.0623.7 ± 115.52.3 ± 0.107.2 ± 0.5749.8 ± 4.68
OS306.0 ± 11.9386.5 ± 50.8 a13.1 ± 4.63 a490.1 ± 26.222.0 ± 5.8778.7 ± 130.1467.9 ± 48.62.4 ± 0.227.2 ± 0.7348.6 ± 3.15
ENCAP
HF308.5 ± 11.2400.0 ± 84.212.7 ± 5.80 ab493.9 ± 25.432.15 ± 9.1 a700.0 ± 141.4 b579.3 ± 162.7 ab2.3 ± 0.146.4 ± 0.28 c49.7 ± 3.54
HA310.0 ± 19.1354.1 ± 2.913.3 ± 7.78 a502.2 ± 15.623.4 ± 3.1 b805.3 ± 142.9 a626.4 ± 125.7 a2.3 ± 0.007.7 ± 0.21 a50.7 ± 0.92
WE301.5 ± 6.6385.1 ± 3.712.0 ± 3.82 b490.7 ± 39.113.7 ± 0.4 b800.0 ± 29.4 a528.5 ± 136.5 b2.5 ± 0.356.9 ± 0.14 b50.3 ± 7.50
HAWE297.4 ± 8.3386.4 ± 48.912.4 ± 3.18 ab487.7 ± 21.730.0 ± 5.7 ab774.0 ± 78.1 ab449.0 ± 16.2 c2.2 ± 0.037.7 ± 0.28 a46.1 ± 1.56
p-Value
COMP0.0900.0170.0040.954<0.001<0.001<0.0010.2340.3290.429
ENCAP0.2210.971<0.0010.369<0.0010.039<0.0010.6050.0260.630
COMP × ENCAP0.2300.298<0.0010.650<0.001<0.001<0.0010.2720.3470.702
Note: SOD—Superoxide dismutase, ALP—Alkaline phosphatase, ACP—Acid phosphatase, PO—Phenol oxidase, MDA—Malondialdehyde, CM—Cumulative mortality, PC—positive control, NC—negative control, OA—organic acid, OS—organic acid salt, HF—hydrogenated fat, HA—HA + alginate, WE—wax ester, HAWE—double coating with HA and WE; COMP—composition; ENCAP—microencapsulation. Values in a column with different superscripts (a, b, c, …) are significantly different from each other (p < 0.05). p-values in bold are significant.
Table 7. Performance score of “COMP” (organic acid and organic acid salts) and “ENCAP” (hydrogenated fat, hydrogenated fat + alginate, wax ester and double coating with hydrogenated fat + alginate and wax ester) based on growth performance, nutrient utilization and immune response of shrimps fed the control and test diets.
FactorsTypeGrowth PerformanceNutrient UtilizationImmune ResponseTotal Score
COMPOA58 b67 b112237 b
OS38 a57 a96191 a
ENCAPHF2235 b61 b118 b
HA2737 b53 ab117 b
WE2227 a46 a95 a
HAWE2525 a48 a98 a
Note: PC—positive control, NC—negative control, OA—organic acid, OS—organic acid salt, HF—hydrogenated fat, HA—HA + alginate, WE—wax ester, HAWE—double coating with HA and WE. Values in a column with different superscripts (a, b, …) are significantly different from each other (p < 0.05).
Publisher’s Note: MDPI stays neutral with regard to jurisdictional claims in published maps and institutional affiliations.

