Article

A Simple Way to Increase the Prediction Accuracy of Hydrological Processes Using an Artificial Intelligence Model

by
Ieva Meidute-Kavaliauskiene
1,*,
Milad Alizadeh Jabehdar
2,
Vida Davidavičienė
1,
Mohammad Ali Ghorbani
2 and
Saad Sh. Sammen
3
1
Department of Business Technologies and Entrepreneurship, Vilnius Gediminas Technical University, 10223 Vilnius, Lithuania
2
Department of Water Engineering, Faculty of Agriculture, University of Tabriz, Tabriz 5166616471, Iran
3
Department of Civil Engineering, College of Engineering, Diyala University, Baqubah 32001, Diyala, Iraq
*
Author to whom correspondence should be addressed.
Sustainability 2021, 13(14), 7752; https://doi.org/10.3390/su13147752
Submission received: 10 June 2021 / Revised: 7 July 2021 / Accepted: 8 July 2021 / Published: 12 July 2021

Abstract

:
Rainfall and evaporation, which are known as two complex and unclear processes in hydrology, are among the key processes in the design and management of water resource projects. The application of artificial intelligence, in comparison with physical and empirical models, can be effective in the face of the complexity of hydrological processes. The present study was prepared with the aim of increasing the accuracy in monthly prediction of rainfall (R) and pan evaporation (EP) by providing a simple solution to determining new inputs for forecasting scenarios. Initially, the prediction of two parameters, R and EP, for the current and one–three lead times, by determining the different input modes, was developed with the SVM model. Then, in order to increase the accuracy of the predictions, the month number (τ) was added to all scenarios in predicting both the R and EP parameters. The results of the intelligent model using several statistical indices (i.e., root mean square error (RMSE), Kling–Gupta (KGE) and correlation coefficient (CC)), with the help of case visual indicators, were compared. The month number (τ) was able to greatly improve the prediction accuracy of both the R and EP parameters under the SVM model and overcome the complexities within these two hydrological processes that the scenarios were not initially able to solve with high accuracy. This is proven in all time steps. According to the RMSE, KGE and CC indices, the highest increase in the forecast accuracy for the upcoming two months of rainfall (Rt+2) for Ardabil station in scenario 2 (SVM-2) was 19.1, 858 and 125%, and for the current month of pan evaporation (EPt) for Urmia station in scenario 6 (SVM-6), this occurred at the rates of 40.2, 11.1 and 7.6%, respectively. Finally, in order to investigate the characteristic of the month number in the SVM model under special conditions such as considering the highest values of the R and EP time series, it was proved that by using the month number of the SVM model, again, the accuracy could be improved (on average, 17% improvement for rainfall, and 13% for pan evaporation) in almost all time steps. Due to the wide range of effects of the two variables studied in the hydrological discussion, the results of the present study can be useful in agricultural sciences and in water management in general and will help owners.

1. Introduction

Hydrology is the scientific field that deals with water occurrence, its properties, its distribution and the effect of the atmosphere [1]. It is also related to the design and management of water resource projects. Almost all hydrological activities are unclear because these activities are mainly affected by different interrelated elements [2]. Additionally, hydrological processes are affected by spatial and temporal variability [3]. Therefore, the main challenge that confronts hydrologists is the uncertainty that is considered as the main feature of hydrological studies. Decision makers and researchers are usually faced with this uncertainty when they try to solve problems related to hydrological events such as floods, evaporation, precipitation, contaminant transport and drought phenomena [2].
There are different approaches that are used in hydrological modeling around the world which include physical models and empirical models. For almost all hydrological studies, physical models were the conventional modeling tools that were used in recent decades [4]. Physically based models are a representation of the ‘physics’ behind a hydrological system and try to solve partial differential equations in order to represent the best understanding of hydrological processes. Physically based models often use two-dimensionally, but sometimes three-dimensionally, distributed data. Due to this data distribution approach, the data required for these models are typically very large. However, the accuracy of these models highly depends on the availability of detailed and accurate data about complex hydrological system properties, which are not usually available due to cost and time limitations, especially in developing countries, resulting in model uncertainties and unsatisfactory performance, which in turn result in insufficient water resource management decisions [5,6]. Empirical models are often used when relations become extremely complicated and difficult to describe. Empirical models are most often utilized in areas with little available information about hydrologic systems. On the downside, empirical models have certain drawbacks concerning their applicability. Based on the above, and due to the aforementioned limitation of using physical and empirical models, it became necessary to find another alternative approach to hydrological modeling [7,8]. Therefore, in recent years, artificial intelligence has attracted considerable attention and has been widely used in modeling different hydrological processes such as rainfall, evaporation, floods and the rainfall–runoff relationship [9,10,11,12,13,14].
The authors of [15] used an ANFIS (adaptive neuro-fuzzy inference system) in order to predict rainfall in the South Tangerang region, Indonesia. They adopted different input combinations and different membership functions during the training and testing of the model. The authors of [16] presented a comparison study to predict rainfall in Malaysia using different AI techniques that included Bayesian linear regression (BLR), boosted decision tree regression (BDTR), decision forest regression (DFR) and neural network regression (NNR). The authors of [17] adopted an echo state network (ESN), deep echo state network (DeepESN), back-propagation network (BPN) and support vector regression (SVR) to estimate rainfall. The meteorological hourly data from 2002 to 2014 at the Tainan Observatory in southern Taiwan were used to develop the models. The results showed that the correlation coefficient of DeepESN was better than that of ESN, BPN and SVR. On the other hand, the authors of [18] studied the efficiency of some data-driven techniques including support vector regression (SVR) and artificial neural networks (ANN), and combinations of them with wavelet transforms (WSVR and WANN) were investigated for predicting evaporation rates at Tabriz (Iran) and Antalya (Turkey) stations. They used four statistical indices, namely, the root mean square error (RMSE), the mean absolute error (MAE), the correlation coefficient (R) and Nash–Sutcliffe efficiency (NSE), for evaluating the results of modeling. The results indicated that the ANN model performed better than the WANN, SVM and WSVM models for both stations. The authors of [19] built three different AI models based on artificial neural networks (ANNs) (multilayer perceptron (MLP) and radial basis function network (RBFN)) and support vector regression (SVR) in order to estimate the evaporation in Turkey. For the purpose of evaluation, they compared the results of modeling with observed class A pan evaporation data. The outcome showed that the performance of ANN and SVM was similar. The authors of [20] compared radial basis neural network (RBFNN), self-organizing map neural network (SOMNN) and multiple linear regression (MLR) models for prediction of the daily EP in Pantnagar in India. They used the gamma test to choose the input combination. They concluded that the RBFNN model with six input meteorological parameters performed with the highest accuracy compared to the other models. The author of [21] studied the capabilities of a neuro-fuzzy (NF) technique to estimate daily pan evaporation. The results of the NF model were compared with the results of an ANN model. The results revealed that the proposed NF and ANN models have good abilities to estimate the value of evaporation using different meteorological data. The authors of [22] investigated the accuracy of two heuristic regression approaches, multivariate adaptive regression splines (MARS) and M5 model tree (M5Tree), in estimating pan evaporation using only temperature data as input. The results revealed that the MARS model performed better than the other models.
The overall purpose of the presented study is to increase the accuracy of the developed SVM model for monthly prediction of rainfall (R) and pan evaporation (EP) in different time steps, using a simple and new method, along with input scenarios for the model. In this way, the results of the model in the shadow of this new simple method can be used to predict the monthly rainfall (R) at Ardabil station and pan evaporation (EP) at Urmia station, with high accuracy and for different time steps. The SVM model, unlike other artificial intelligence methods, has a certain mathematical structure, meaning that it does not over-fit during modeling. Due to the lack of long-term data required by SVM, this algorithm contains specific objective and kernel functions and can provide ideal results using optimized mathematical methods [23].

2. Methods and Material

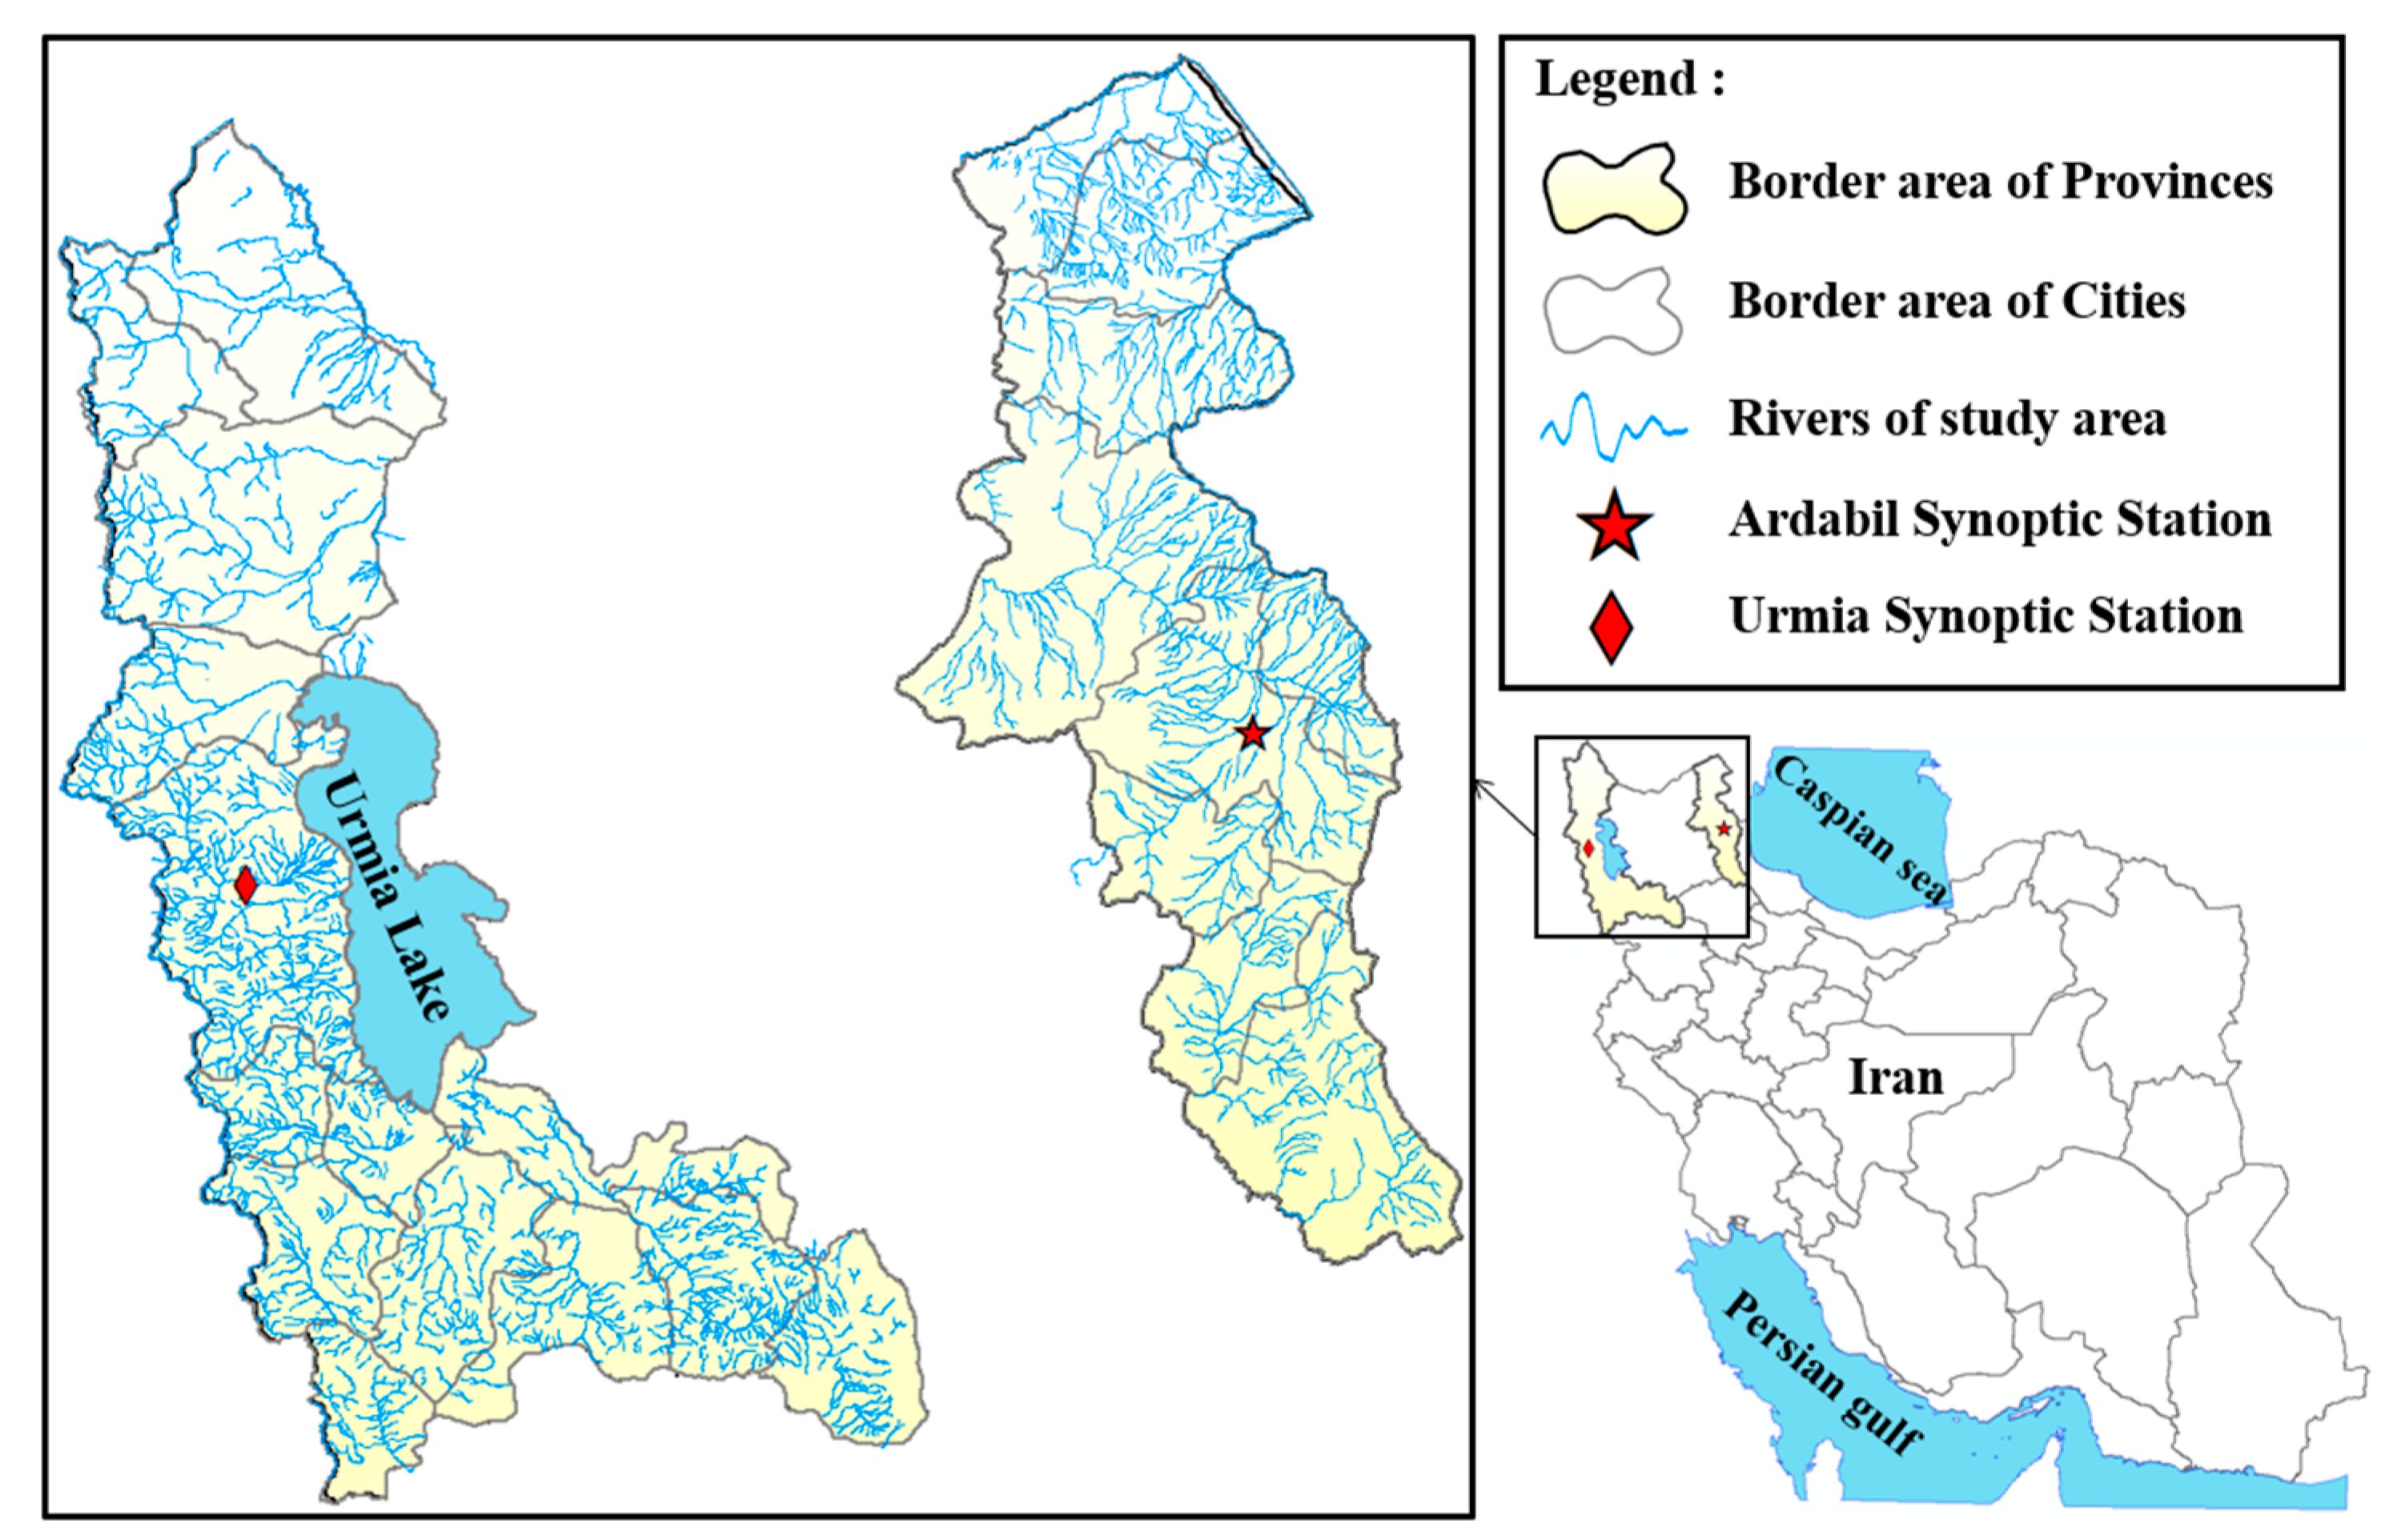
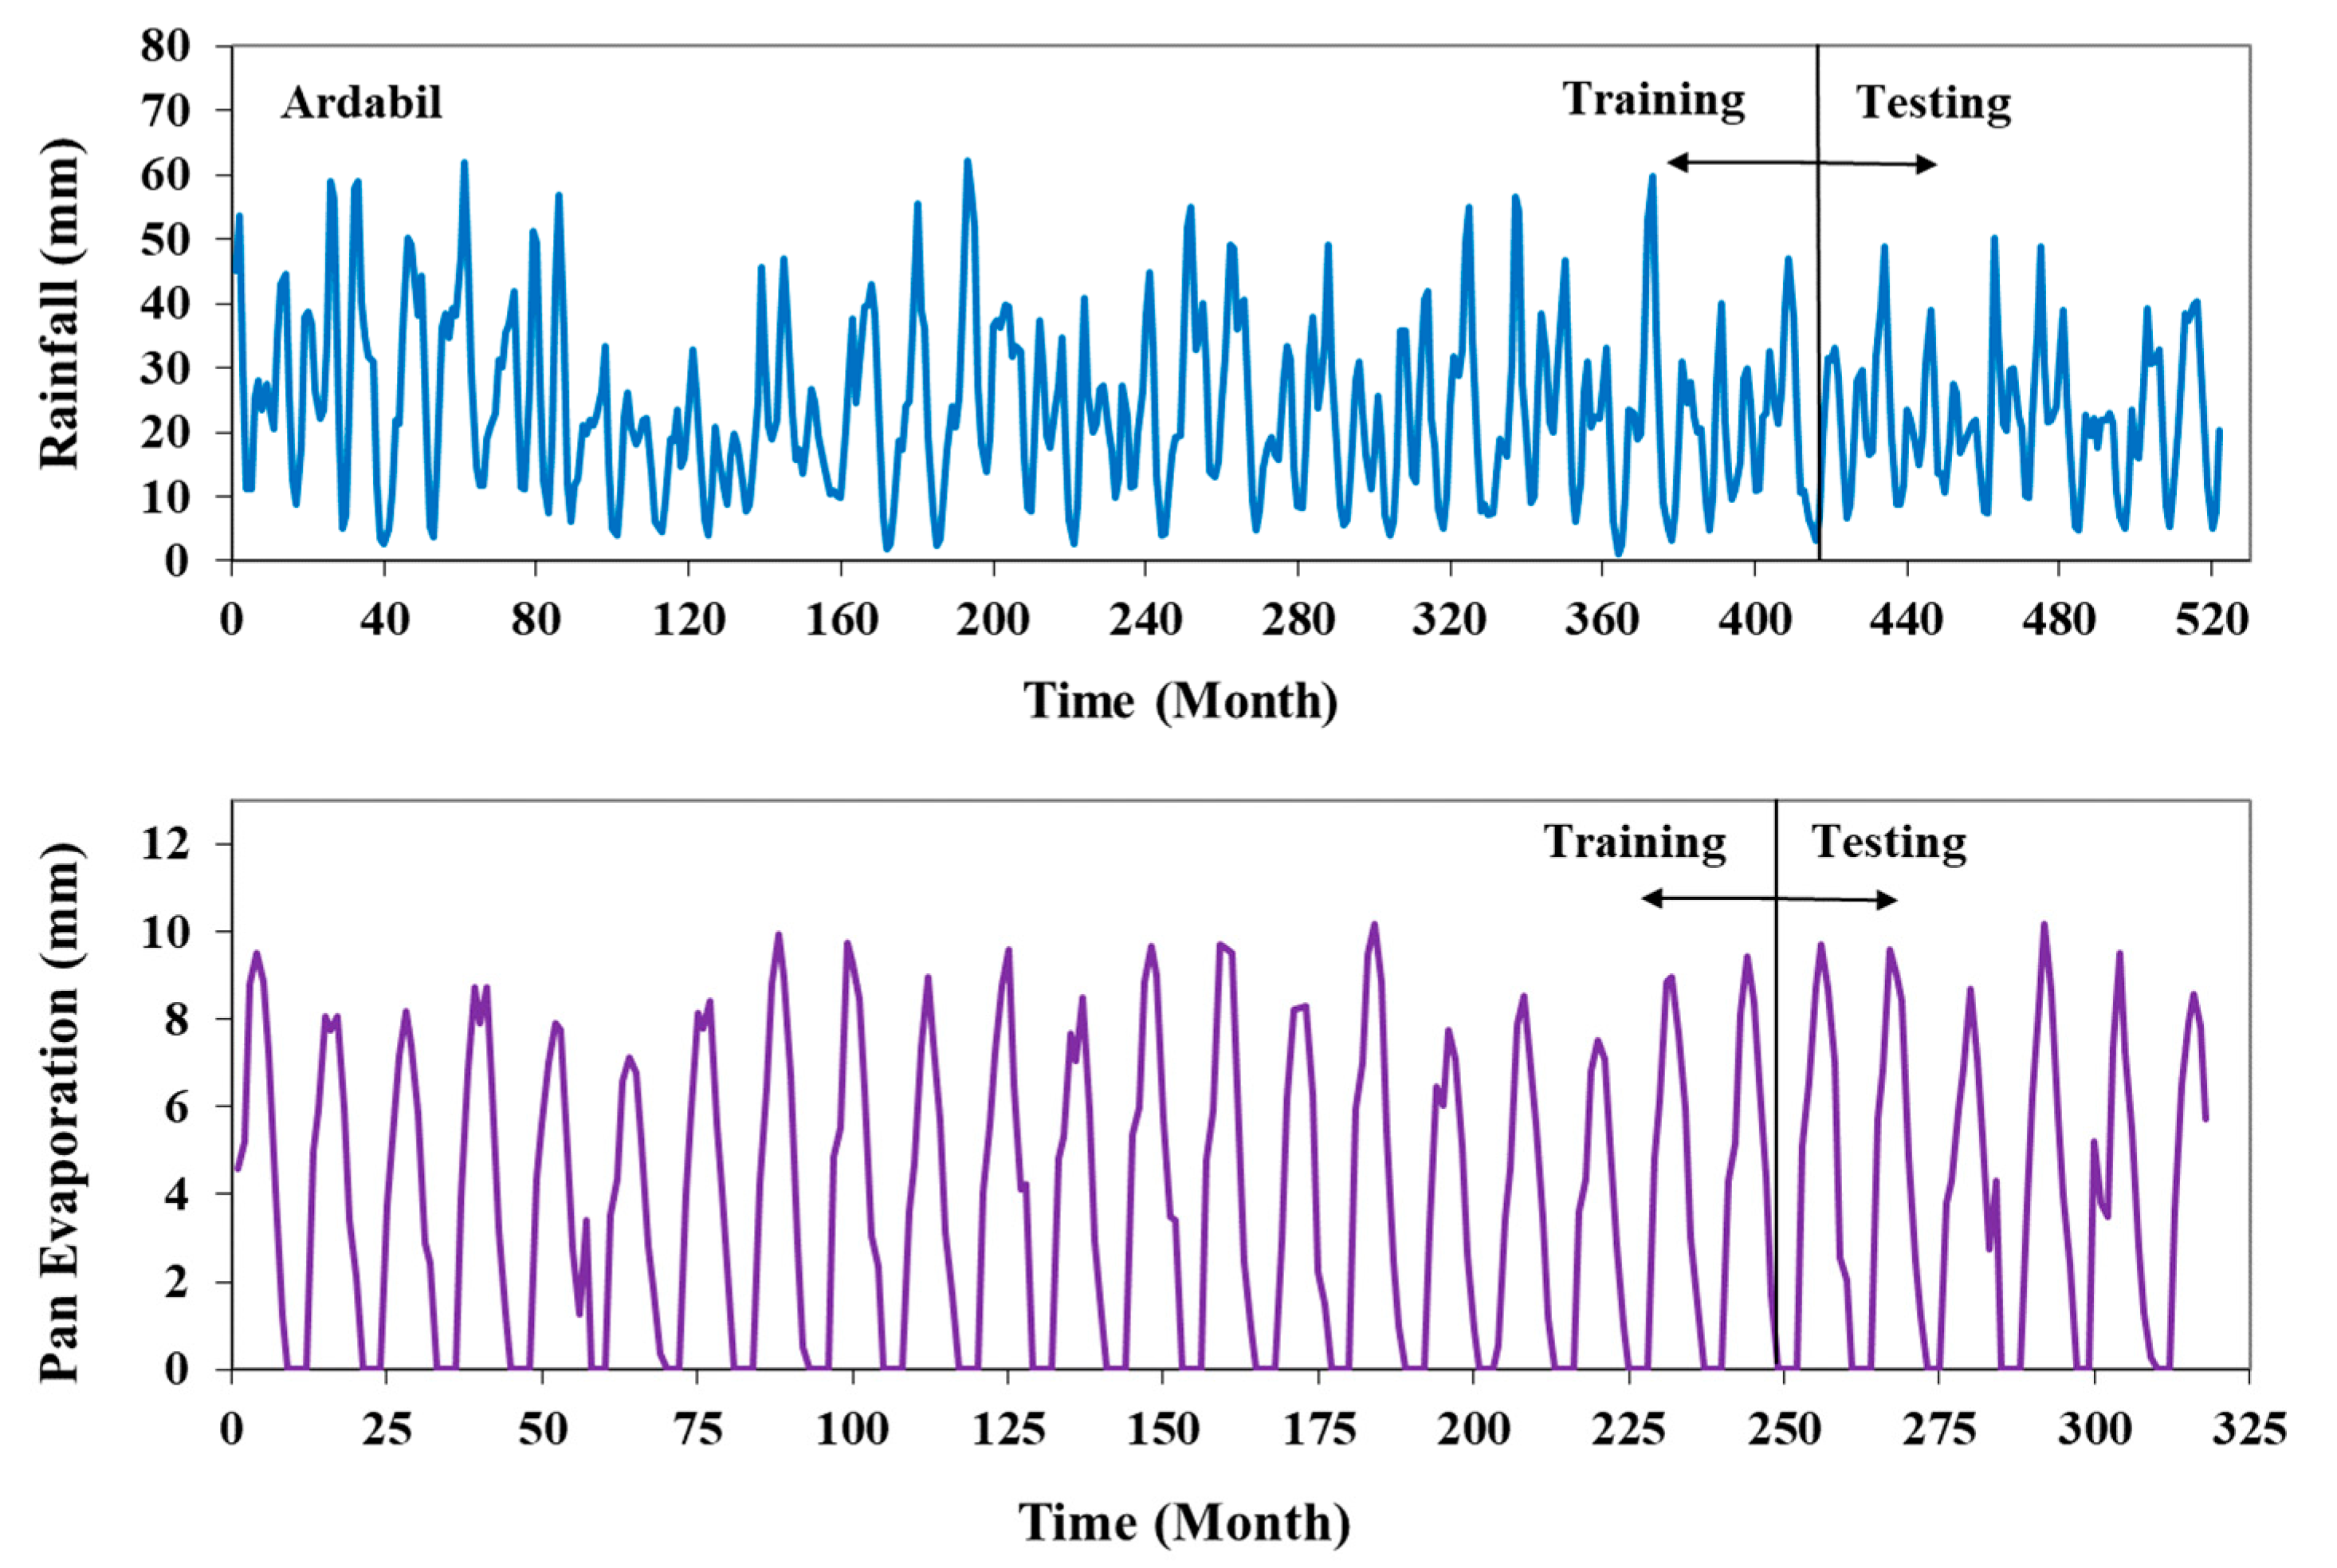
2.1. Study Region and Datasets

This study was conducted to investigate the capability of the developed support vector machine (SVM) model to predict monthly rainfall (R) at Ardabil station and monthly pan evaporation (EP) at Urmia station, with the effect of the month number (τ) characteristic within the scenarios. For this purpose, these two stations will be introduced first. In order to predict the monthly R and EP, in this study, the monthly rainfall information from Ardabil meteorological station and the EP information from Urmia meteorological station were used. Ardabil and Urmia, as the provincial capitals of Ardabil and West Azerbaijan, are located in Iran, in the mountainous region, and have a semi-arid and cold climate. Additionally, in these areas, rainfall has a disproportionate seasonal distribution. Thus, most of the rainfall, whether in the form of rain or snow, occurs in the autumn–winter and spring seasons. Ardabil meteorological station is located at an altitude of 1335 m above sea level, with a longitude of 47° and 2′ and latitude of 38° and 13′, and Urmia meteorological station has a latitude of 37° and 32′ and a longitude of 45° and 5′, and an elevation of 1316 m. They are both located above sea level. Figure 1 shows a visual view of the geographical location of the meteorological stations under study.
In this study, rainfall (R) data of Ardabil meteorological station, on a monthly basis in the statistical period 1976–2019, and pan evaporation (EP) data of Urmia meteorological station, on a monthly basis in the statistical period 1993–2019, were obtained from the Meteorological Organization. Data were divided so that 80% of the data were isolated for training, and 20% for the testing phase. To be more precise, out of the total 522 months of R data of Ardabil station, 417 months were considered for training (1976–2010), and 105 months for testing (2019–2011). For modeling the EP of Urmia station, out of the total number of 318 months of EP data, 249 months (2013–1993) were considered for training, and 69 months for testing (2019–2014). Figure 2 shows the data segmentation diagram for predicting R and EP at Ardabil and Urmia stations in two sections: training and testing. Table 1 shows the statistical characteristics (minimum, maximum, mean, standard deviation and skewness) at Ardabil and Urmia stations for the training and testing datasets. In order to investigate the different input and output modes of the smart model, cross-correlation analysis was performed between the types of modes. The visual view obtained from the study of the interrelationship of inputs and outputs for the monthly rainfall of Ardabil station and monthly EP of Urmia station is shown in Figure 3.

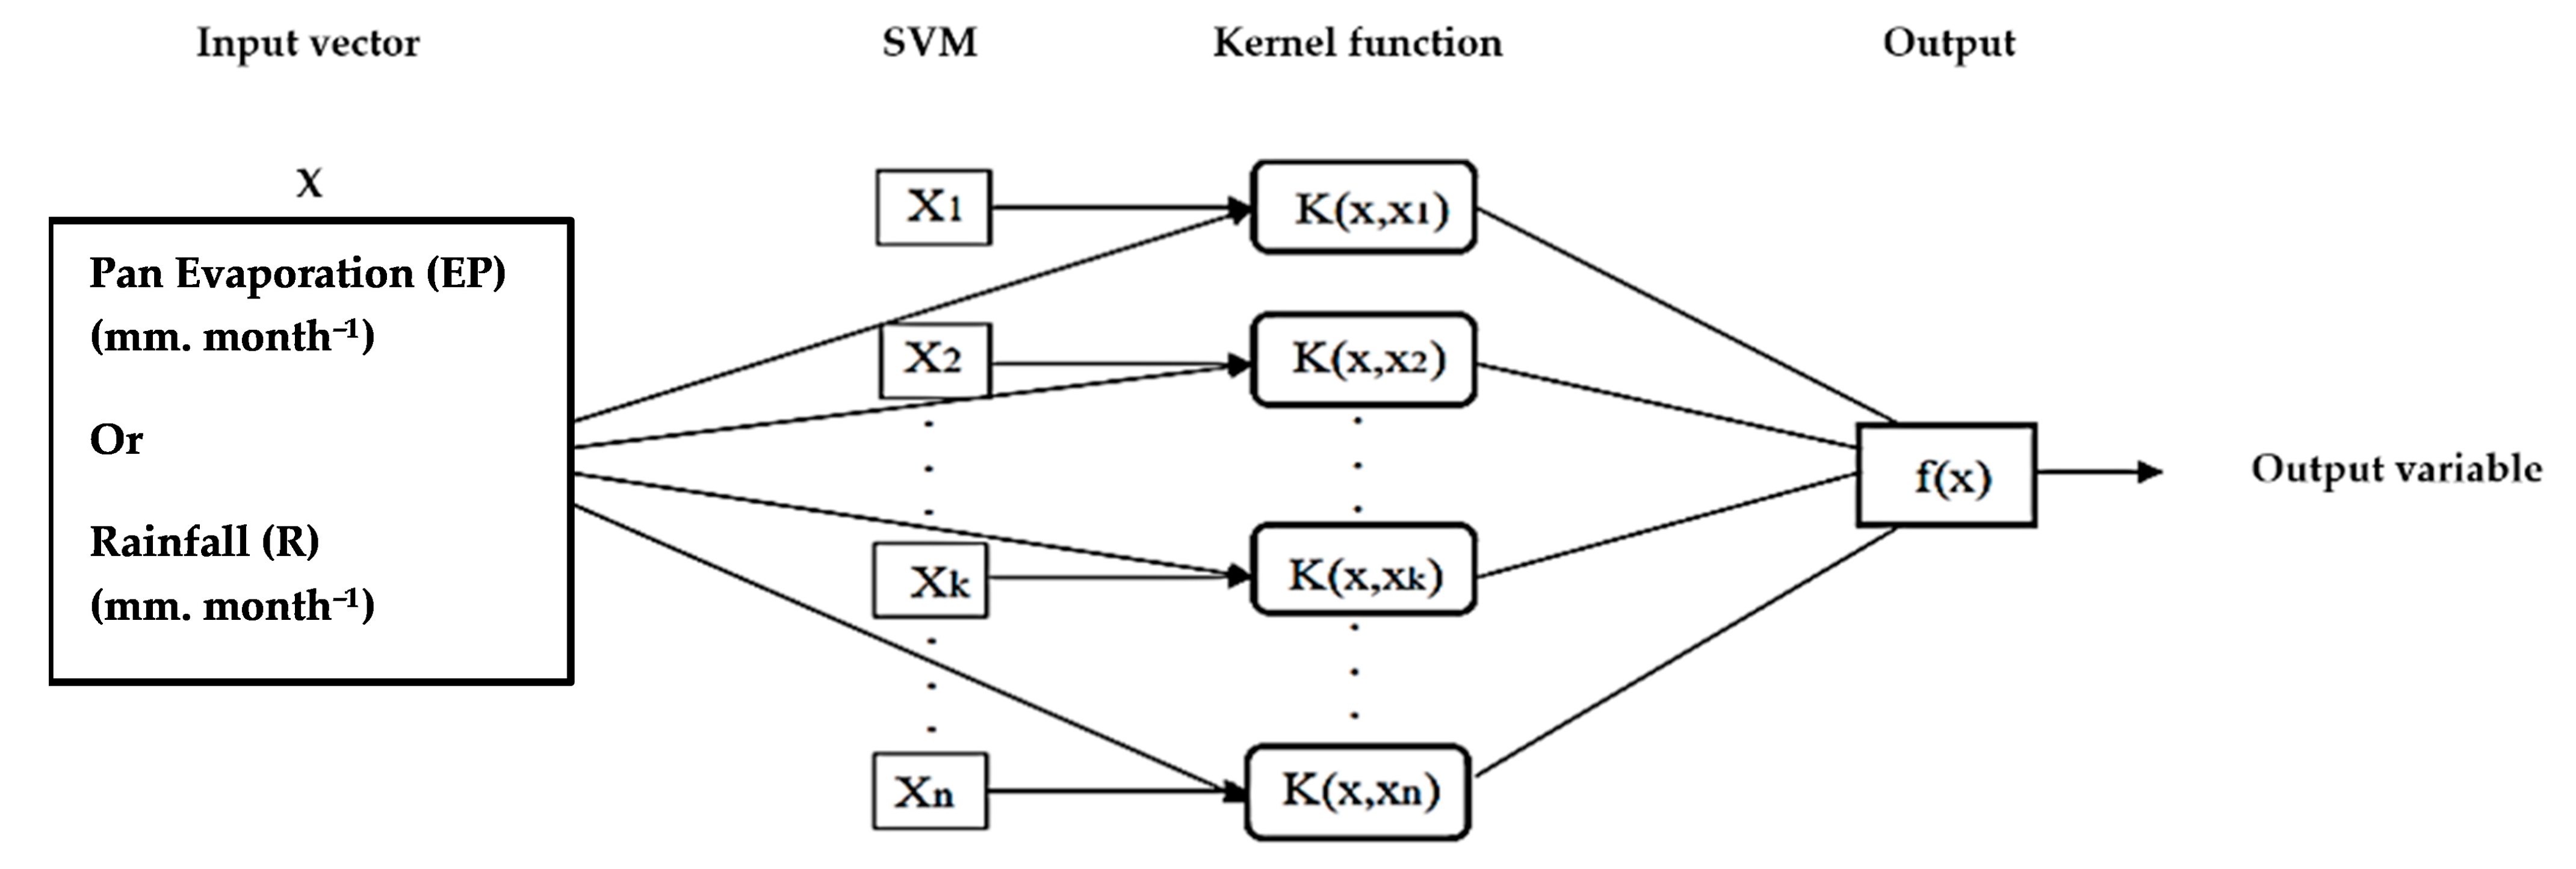
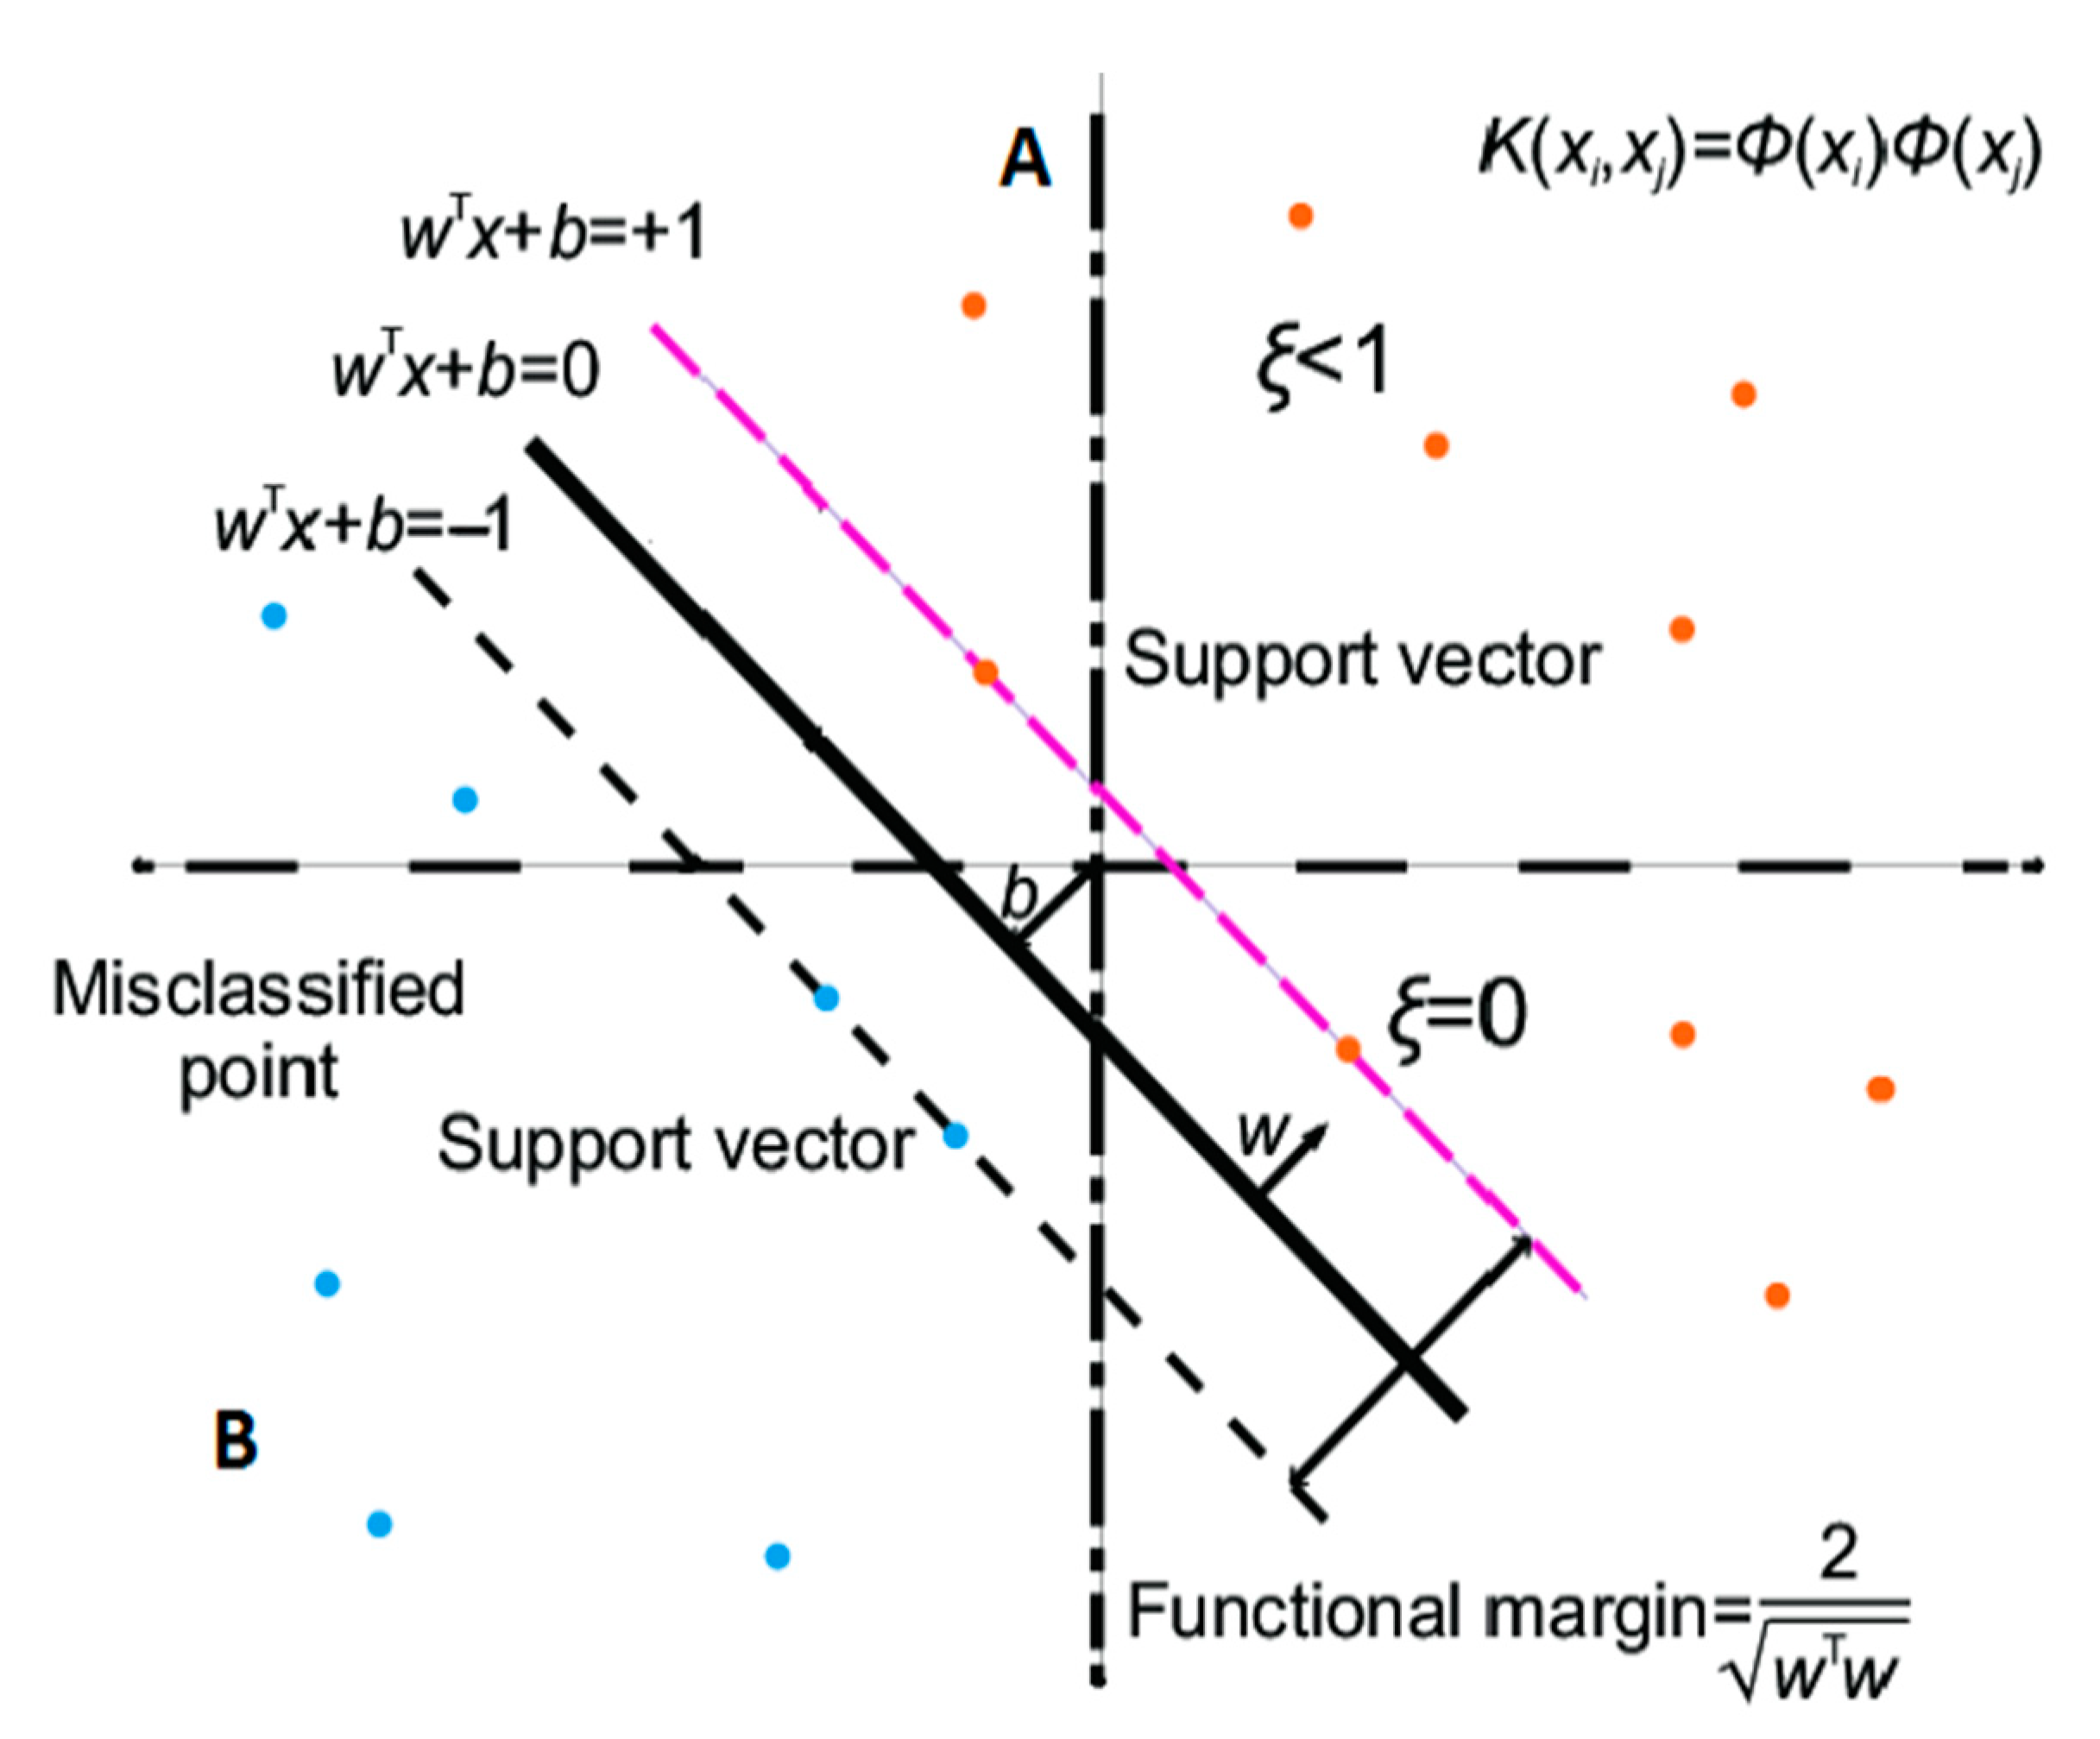
2.2. Support Vector Machine (SVM)

Support vector machines (SVMs) were developed in 1992 by the Russian mathematician Vapnik, based on statistical learning theory. SVM is one of the learning methods with supervised learning which is used to analyze data that are implemented for regression analysis and classification. This learning system is used to both classify and predict the data fitness function to minimize errors in the data classification or fitness function. In linear data classification, an attempt is made to select a line that has a more reliable margin. Support vectors are the closest training points at the edge of the cloud and are used to define the boundary between classes [24]. If the data are linear and separate, the SVM uses linear machines to separate and train an optimal level with the least error and the maximum distance between the page and the nearest training points (support vectors) [24]. The structure of a support vector machine is shown in Figure 4 [25].
If the training points are in the form of [xi, yi], and the input vector is in the form of xRn, then the value of each class is defined as yi ∈ [−1, 1] i = 1, …, i. The decision rules that can then be expressed by an optimal page that separates binary decision classes can be expressed as Equation (1):
Y = s g n ( i = 1 N y i a i ( X × X i ) + b )
In the above relation, Y is the output of the relation, yi is the value of the sample class and Xi, ai and b are the parameters that determine the hyperplane. If linear separation is not possible, then Equation (1) is changed as follows:
Y = s g n ( i = 1 N y i a i K ( X × X i ) + b )
In Equation (2), K (X × Xi) is a kernel function that generates internal multiplications to create SVM models with different modes of nonlinear decision levels in the data space, and for this purpose, it is necessary to define the line equation. The line equation in the 2D space is calculated by Equation (3), the plane equation is calculated by Equation (4) and the screen equation is calculated by Equation (5) [26].
w 1 x 1 + w 2 x 2 + b = 0
w 1 x 1 + w 2 x 2 + w 3 x 3 + b = 0  
i = 1 n w i x i + b = 0 w T x + b = 0 , w = [ w 1 w i ] , x = [ x 1 x i ]
According to Figure 5, the continuous bold line with the equation wT x + b = 0 is known as the line separating the data on the plane and divides them into two categories, A and B. This line leads to the formation of a space in which the data belonging to category A take a positive number and the data belonging to category B take a negative number. However, in SVM models, in addition to using the delimiter line, a confidence margin is also used for classification (Figure 5). In this case, none of the data are allowed to be in the middle area. Assuming that the line with the equation wT x + b = 0 is a boundary zero point, then for the data, depending on the position in classes A and B, respectively, the equations wT x + b > 1 and wT x + b < −1 are established. The thickness of the separator in the SVM includes an area and makes the classification process more resistant to the risk of misalignment [27].
One of the common methods for solving nonlinear problems is to use kernel functions. In fact, with a nonlinear transformation of the input space into a larger space, usury issues can be separated linearly. The choice of the kernel function is very important in SVM models, and different issues can be considered depending on the nature of the problem. Therefore, a function cannot be definitively introduced as the most suitable function for SVM. The types of important kernel functions that are common in engineering applications [28,29,30] and were used in the present study are shown in Table 2.

2.3. Model Performance Evaluation Indicators

To evaluate the accuracy of SVM model scenarios according to Equations (6)–(8), the performance evaluation criteria of root mean square error (RMSE), coefficient of determination (CC) and Kling–Gupta (KGE) were used. The RMSE measures the best fit with the priority of high values of monthly rainfall and EP [31,32]. The KGE criterion in Equation (8) is one of the new criteria in the evaluation of hydrological models proposed by [33] and is in fact a modified version of the Nash–Sutcliffe efficiency (NSE) index.
R M S E = 1 n i = 1 n ( x i y i ) 2
C C = ( i = 1 n x i y i 1 n i = 1 n x i i = 1 n y i ) ( i = 1 n x i 2 1 n ( i = 1 n x i ) 2 ) ( i = 1 n y i 2 1 n ( i = 1 n y i ) 2
K G E = 1 ( c c 1 ) 2 + ( α 1 ) 2 + ( β 1 ) 2
In Equations (6)–(8), xi and yi are real and estimated values, n is the number of data evaluated, CC is the linear correlation coefficient between xi and yi, α is equal to the ratio of standard deviation yi to standard deviation xi and β is equal to the ratio of average yi to average xi.

3. Results and Discussion

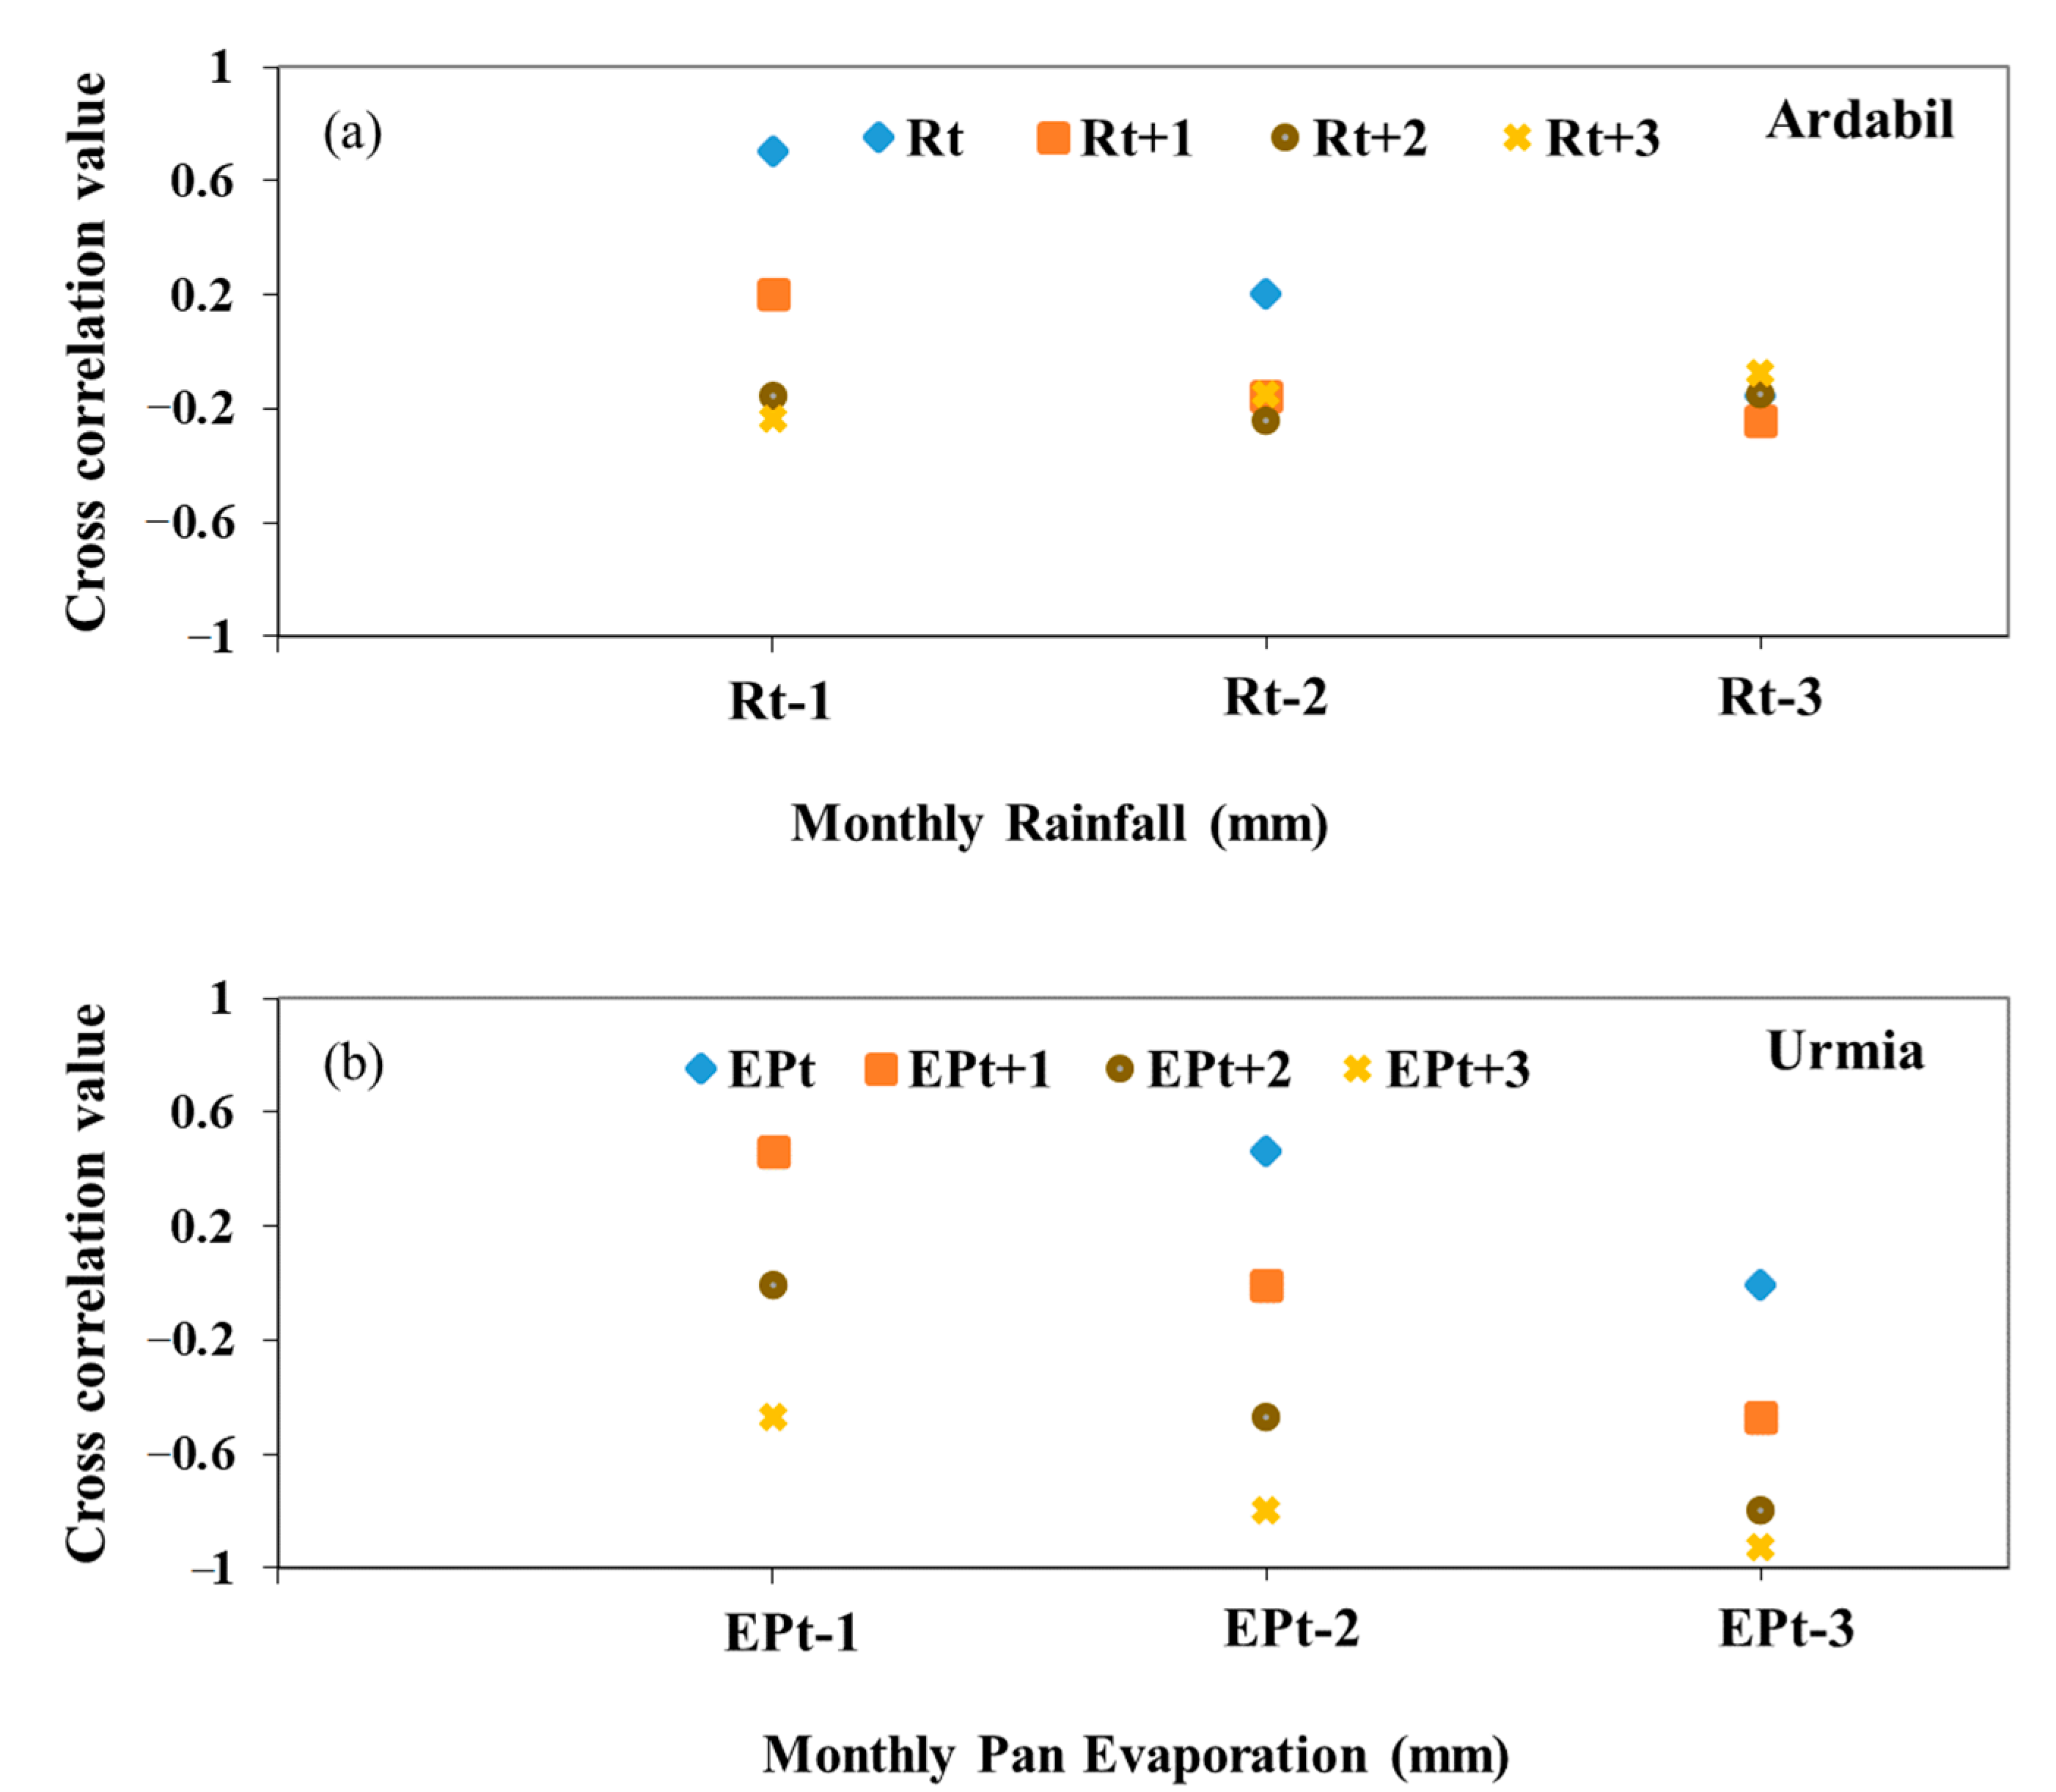
3.1. Determining the Most Effective Input Compounds to Model Output Aims

In order to determine the input of the SVM model, with the aim of predicting the current and lead times of one–three monthly rainfall (R) and pan evaporation (EP) events, the cross-correlations of lag times (Rt−1, Rt−2, Rt−3 or EPt−1, EPt−2, EPt−3) against the target months (Rt, Rt+1, Rt+2, Rt+3 or EPt, EPt+1, EPt+2, EPt+3) were examined, and the results are shown in Figure 3. Therefore, for rainfall, various combinations of lag times to predict the current and lead times of one–three monthly rainfall (R) events were considered as the input of the SVM model and are listed in Table 3 and Table 4. For each of the predicted time steps, we have a total of six scenarios. Of these six scenarios, three scenarios are shown in Table 3, and three scenarios are shown in Table 4. The scenarios in Table 3 show the different combinations of rainfall (R) lag times as input to the SVM model. According to the scenarios in Table 4, in addition to lag times, the month number (τ) was placed as an input next to other inputs to check the results of the scenarios without and with the month number. This is also true for the prediction of pan evaporation (EP), which can be seen in Table 5 and Table 6.

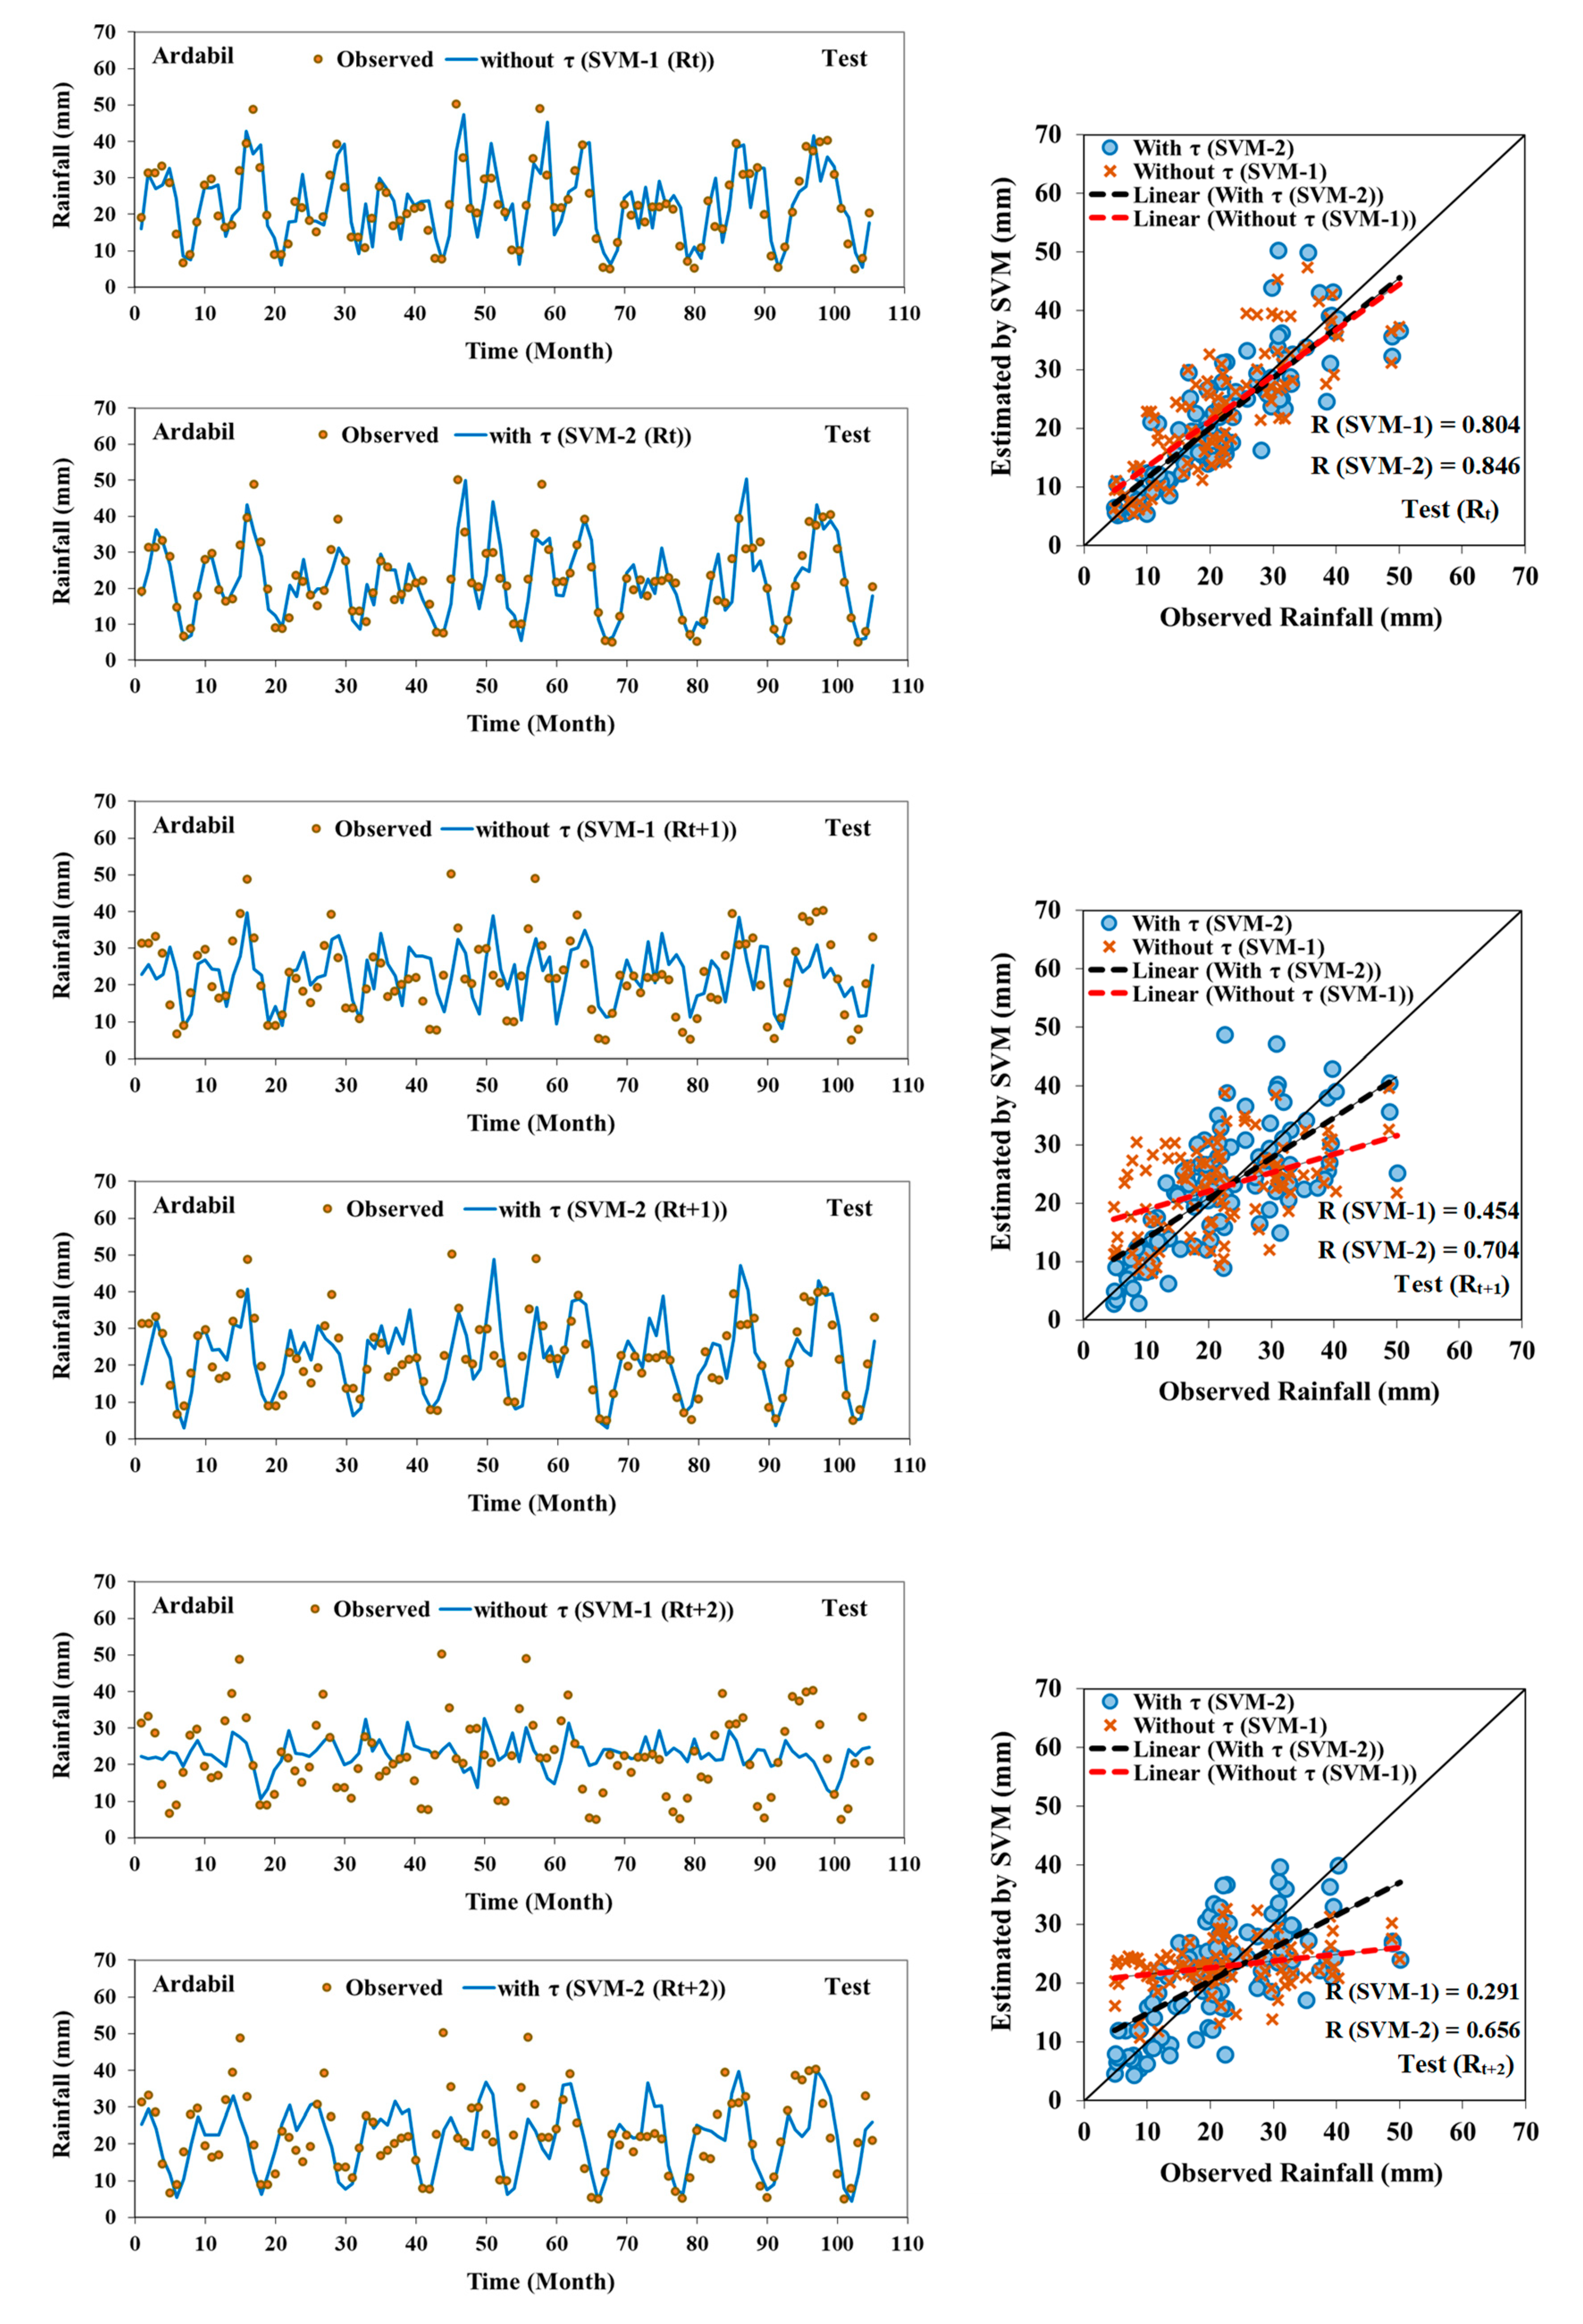
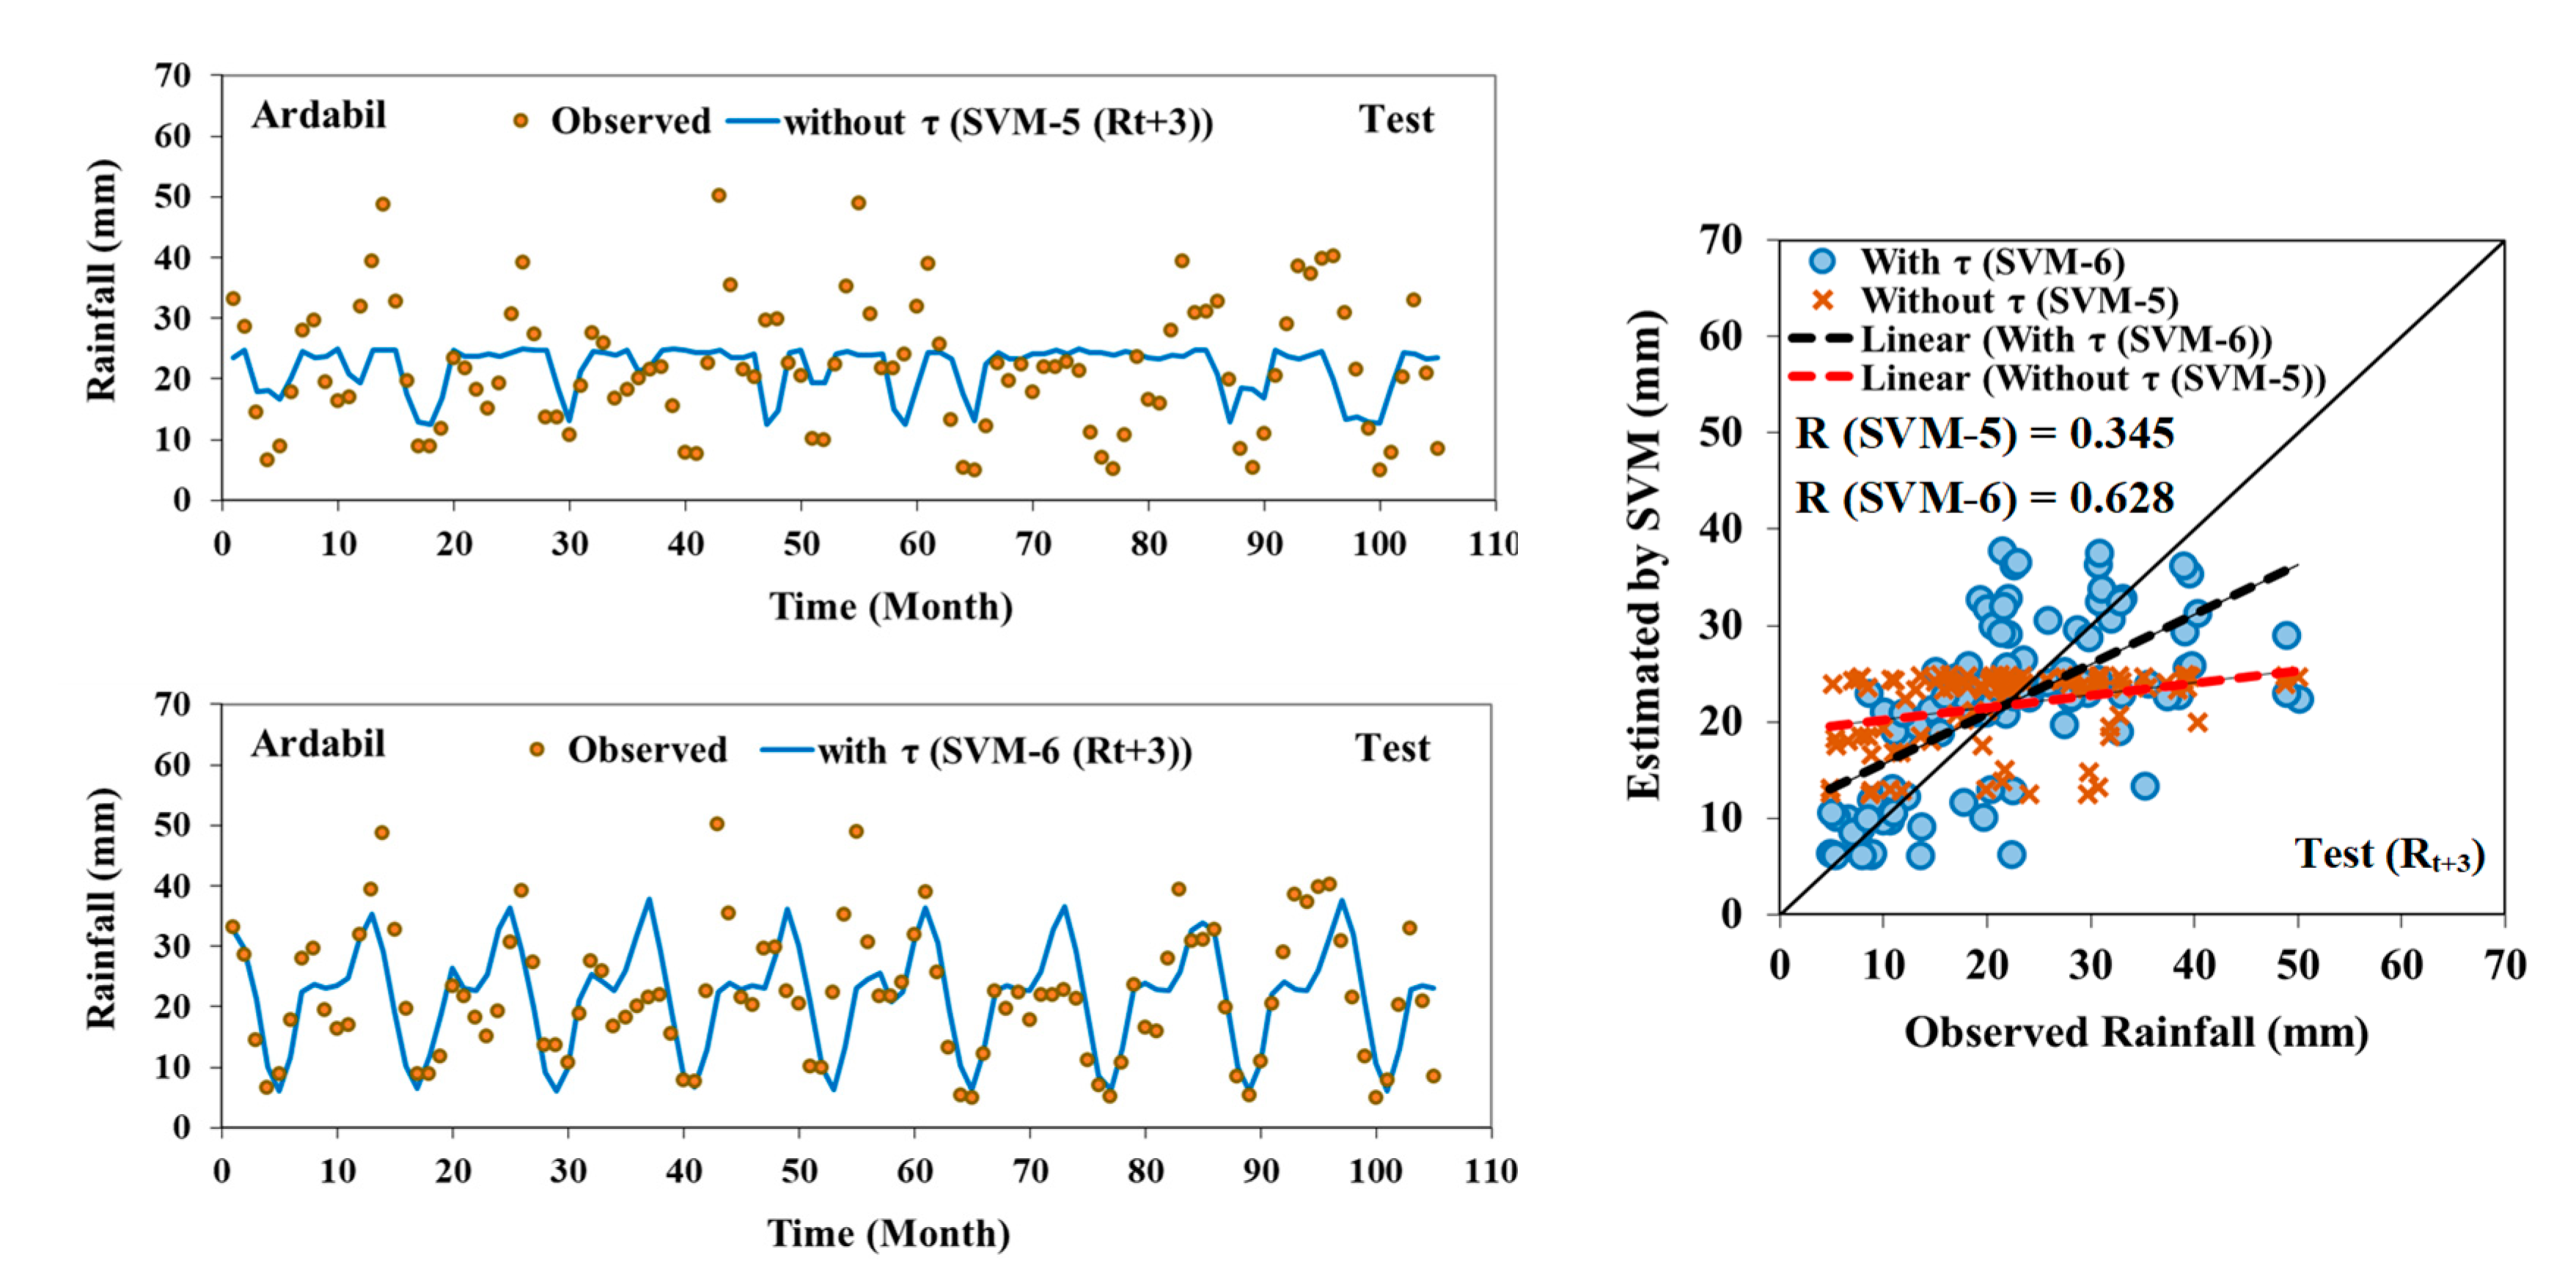
3.2. Simulation of Monthly Rainfall (R) at Ardabil Station

In order to evaluate the strength of the developed support vector machine (SVM) model in predicting the monthly rainfall (R) of Ardabil station for the current and lead times of one–three monthly rainfall events, and in case the month number (τ) is not among the input scenarios, statistical indicators RMSE (mm. Month−1), KGE and CC were calculated for the test phase. The results of these indicators are listed in Table 3. According to Table 3, and in the absence of the month number (τ) as input in the scenarios, scenario 3 (SVM-3), with the input of two monthly rainfall lag times (Rt−1, Rt−2), was able to produce the least errors compared to other scenarios in predicting the current month’s rainfall (Rt), with RMSE = 6.23 mm. month−1, KGE = 0.807 and CC = 0.815. In predicting 1 month of upcoming rainfall (Rt+1), again, scenario 3 (SVM-3) managed the lowest value of RMSE = 9.56 mm. month−1 and had the highest values of KGE = 0.306 and CC = 0.438, compared to other scenarios in this time step.
In predicting the rainfall of the upcoming two months (Rt+2), better results from scenario 1 (SVM-1) compared to the other scenarios, with RMSE = 10.067 mm. month−1 KGE = 0.065 and CC = 0.291, were observed. The last goal in Table 3 is to forecast the upcoming three months of rainfall (Rt+3). According to the results of Table 3, it can be said that by targeting the upcoming one, two and three months of rainfall, the accuracy of the forecast with the same fixed scenarios was less than the target of the current month’s rainfall (Rt), from CC = 0.815 in the current step (Rt) to CC = 0.438, 0.291 and 0.401 in the time steps, respectively, reached for Rt+1, Rt+2 and Rt+3. Another point related to the results of Table 3 is that the selected scenario is the same in the current time steps and upcoming month of rainfall (Rt, Rt+1), and scenario 3 (SVM-3) in both steps is selected as the best scenario. This happened in the time steps of the upcoming two and three months (Rt+2, Rt+3) for scenario 1 (SVM-1).
In the next step, considering the month number (τ) as input within scenarios 1, 3 and 5 (SVM-1, SVM-3, SVM-5), new scenarios 2, 4 and 6 (SVM-2, SVM-4, SVM-6) were obtained. New scenarios were introduced as input to the SVM model. The results of the statistical indicators obtained from the new scenarios are shown in Table 4. According to Table 4, it is generally observed that the results in all time steps significantly improved compared to the case where the month number (τ) was not among the inputs. In Table 4, and the current time step (Rt), scenario 2 (SVM-2), with inputs (τ, Rt−1, Rt−2, Rt−3) and the lowest RMSE = 5.815 mm. month−1, showed the highest values of KGE = 0.845 and CC = 0.846 compared to scenarios 4 and 6 (SVM-4 and SVM-6); compared to the result of the superior scenario 3 (SVM-3) related to the current time step (Rt) in Table 3, we saw an improvement of 6.7, 4.7 and 3.8% in the RMSE, KGE and CC statistical indices, respectively, in the case that the month number (τ) was considered as input in the scenarios. In the next time step, i.e., rainfall for the upcoming month (Rt+1), scenario 2 (SVM-2), with RMSE = 7.974 mm. month−1, KGE = 0.703 and CC = 0.704, was selected as the best scenario in this time step, and the RMSE, KGE and CC indices improved by 16.6, 129 and 60.7%, respectively, compared to the best scenario 3 (SVM-3) for the month number (τ). According to Table 4, scenario 2 (SVM-2), as the best scenario, with the lowest RMSE = 8.148 mm. month−1 and the highest values of KGE = 0.623 and CC = 0.656, compared to the other scenarios, was selected to predict rainfall for the upcoming two months (Rt+2) at Ardabil station. In this time step, we also saw a 19.1, 858 and 125% improvement in RMSE, KGE and CC values, respectively, compared to the best scenario 1 (SVM-1) in the case without τ in the same time step (Table 3). In the last target time step, i.e., the upcoming three months of rainfall time step (Rt+3), scenario 6 (SVM-6), with RMSE = 8.411 mm. month−1, KGE = 0.587 and CC = 0.628, was identified as the best scenario, and we saw an improvement of 12.4, 313 and 56.6% in RMSE, KGE and CC statistical indices, respectively, compared to the best scenario in Table 3.
In order to carefully examine the increase in the accuracy of the SVM model in predicting the time steps of the upcoming one, two and three months, in the presence and absence of the month number (τ) input, time series, observational scatter plots and rainfall forecasts for the top scenarios with the month are drawn in Table 4, and the corresponding scenarios without the month number (τ) in Table 3 are drawn according to Figure 6 for the test period. According to Figure 6, and to the observed time series diagrams and rainfall forecast at the current time step (Rt), it is observed that the forecasted data in the scenario mode with the number of the month (SVM-2) are more consistent with the observational data. The time step scatter plot diagram also confirms this. Therefore, it is observed that the regression line related to the scenario with the month number (SVM-2) is closer to the bisector line than the scenario without the month number (SVM-1), and less overestimation is observed in this scenario. The improvement in the results in the scenario with the month (τ) in rainfall prediction with a time step of one month later (Rt+1) is very evident in the observational and forecast time series diagram; compared to the no-month scenario (SVM-1), there is more compliance with the observational data. In the observed and predicted scatter diagrams of one upcoming month (Rt+1), the scenario regression line with the month (SVM-2) is much closer to the bisector line than the scenario without the month (SVM-1). Additionally, it requires fewer estimation changes.
As the rainfall forecast time steps at Ardabil station move forward, the accuracy of scenarios with the same month as the results of the statistical indicators becomes more visible. As it is shown in the rainfall data distribution diagram for the upcoming two months, and as predicted by the scenario without the month number (SVM-2) and with the month number (SVM-1), the improvement in the results by the SVM-2 model is very obvious, and the regression line of this scenario is closer to the bisector line than SVM-1; therefore, the accuracy of estimating rainfall for the upcoming two months (Rt+2) is higher. In Figure 6, the very poor results of forecasting the upcoming three months of rainfall (Rt+3) by the scenario without the month number (SVM-5) in the time series diagrams, as well as the observed and predicted distribution, are clear, and the scenario with the month number (SVM-6) could improve the results better than the SVM-5 scenario and increase the accuracy of the forecast. Finally, it can be said that adding a simple characteristic such as the month number (τ) in the delay scenarios, with the aim of predicting the rainfall of Ardabil station in different time steps, enabled dramatically improving the results, especially in the step of the upcoming one, two and three months.

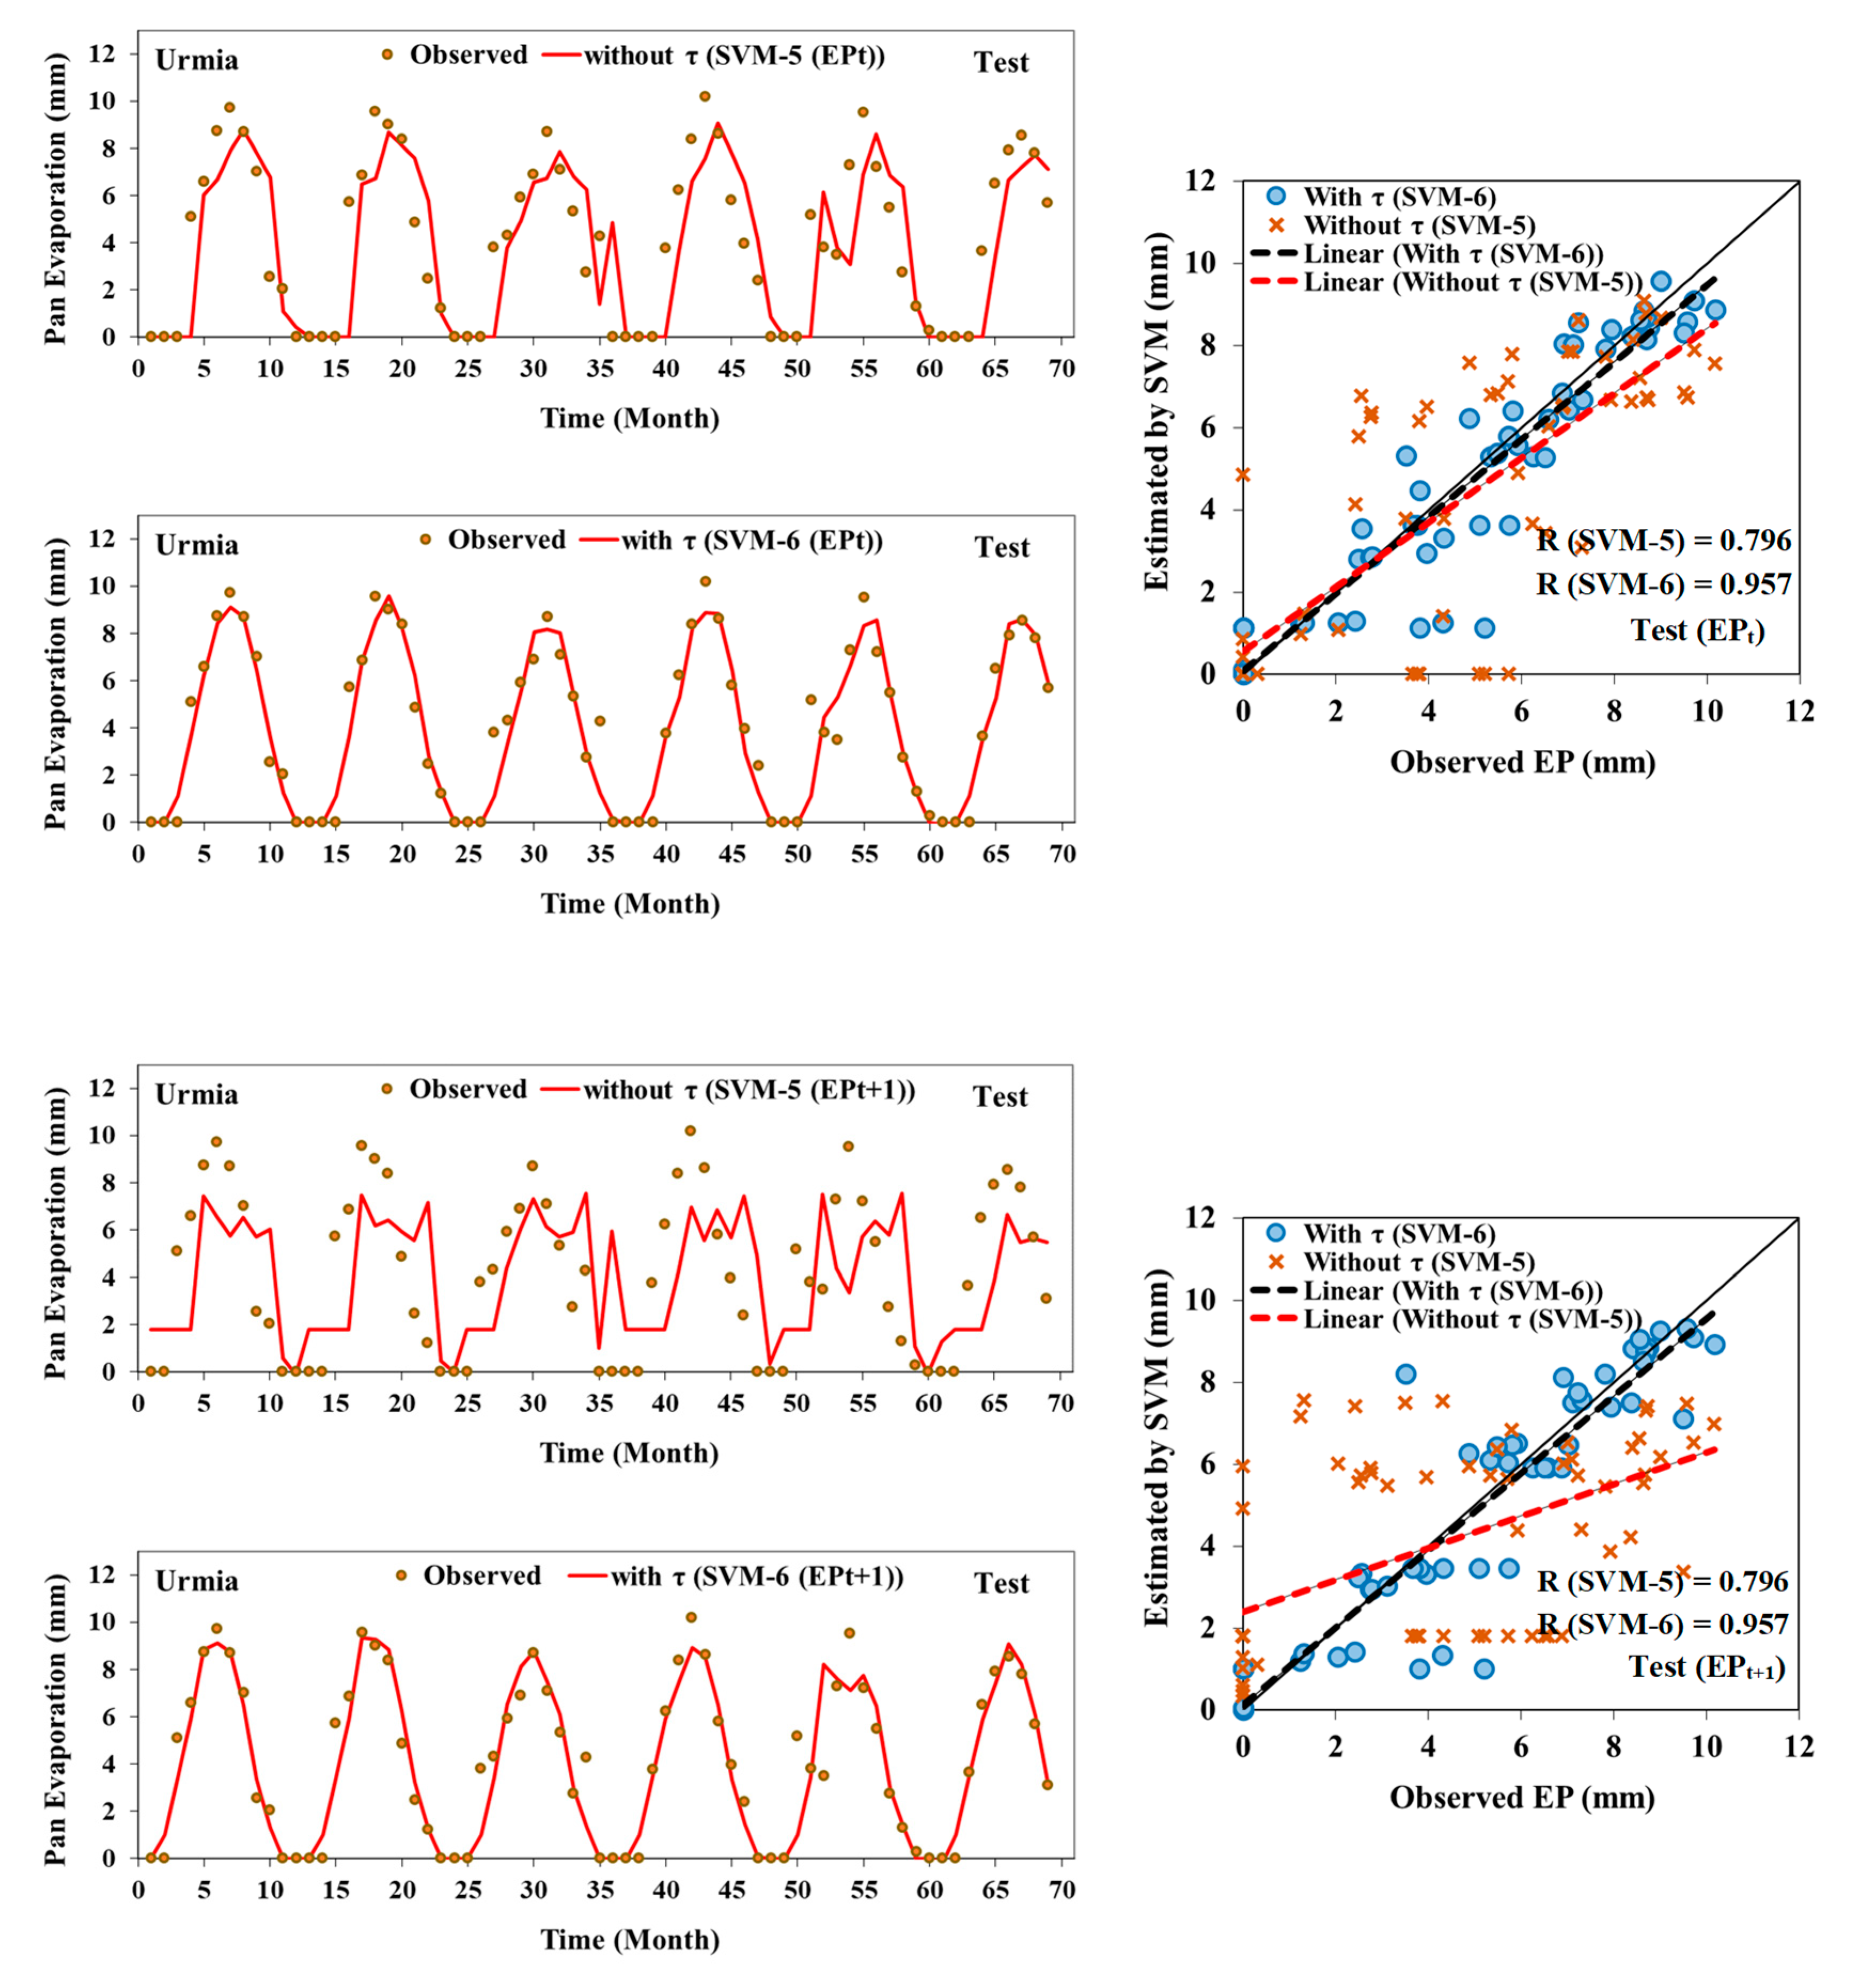
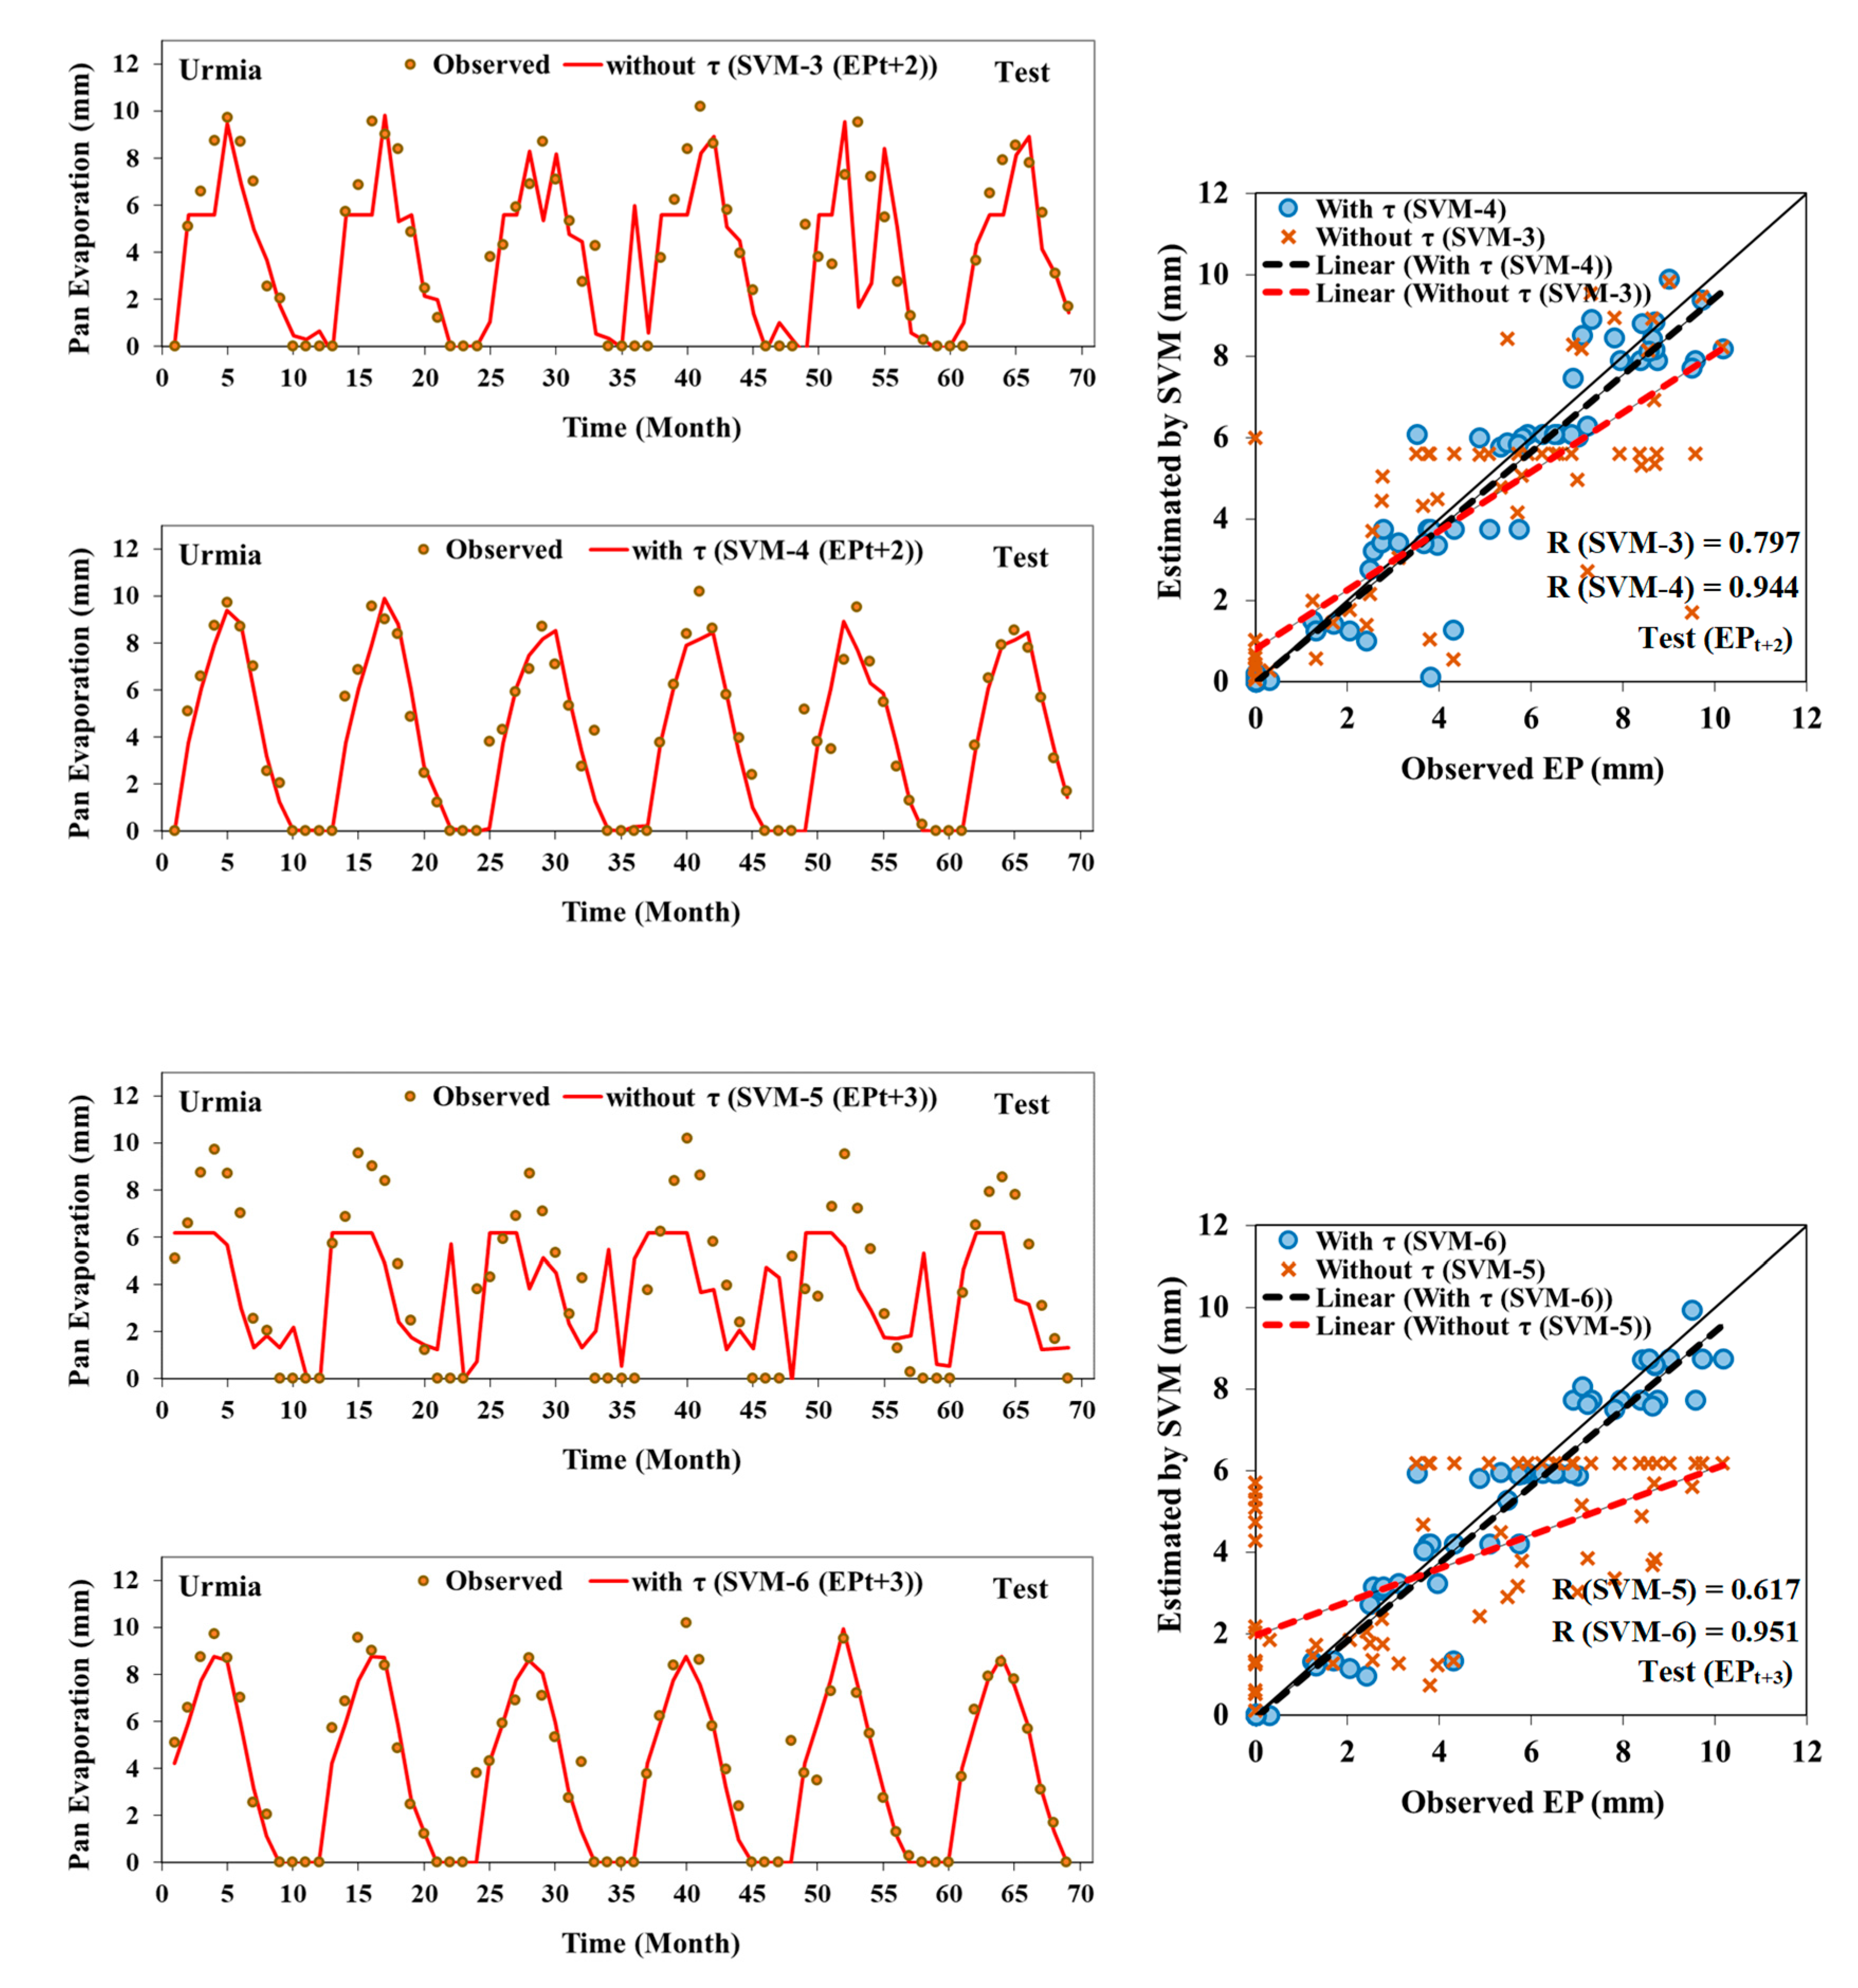
3.3. Simulation of Monthly Pan Evaporation (EP) at Urmia Station

In order to investigate the changes in the case of a simple characteristic such as the month number (τ) in the time delay input scenarios for the monthly estimation of another parameter except rainfall, the SVM model was implemented for the monthly pan evaporation (EP) of Urmia station. Initially, in order to predict the evaporation from the EP of Urmia station for four time steps (current month, and upcoming one, two and three months), the SVM model was implemented for scenarios that do not have the month number (τ), and the results of the statistical indicators obtained from this work are listed in Table 5. According to Table 5, in estimating the evaporation from the current lunar pan (EPt), scenario 1, with inputs of one-, two- and three-month lag times of EP (EPt−1, EPt−2, EPt−3), had the lowest RMSE = 1.666 mm. Month−1 and the highest values of KGE = 0.844 and CC = 0.889, compared to other scenarios, and it should be selected as the best scenario in this time step. In predicting EP with the aim of predicting the time step of the upcoming month (EPt+1), again, scenario 1 (SVM-1), with RMSE = 1.751 mm. month−1, KGE = 0.845 and CC = 0.866, showed better accuracy in this time step. In a step ahead of time, i.e., predicting EP for the upcoming two months (EPt+2), scenario 1 (SVM-1), due to having the lowest value of RMSE = 1.603 mm. month−1 and the highest values of KGE = 0.85 and CC = 0.888, appeared more successful than the other scenarios in this time step. In the last step, for the prediction of EP for the upcoming three months (EPt+3), again, scenario 1 (SVM-1), as the best scenario, with RMSE = 1.339 mm. month−1, KGE = 0.846 and CC = 0.93, was selected. As a result, based on the results of Table 5, it is observed that unlike rainfall, in predicting EP with increasing time steps, the accuracy of the SVM model did not decrease much, and the model has a good accuracy. Even the upcoming three months’ time step of EP (EPt+3) was able to achieve the best result in the same scenario 1 (SVM-1) compared to the current month’s time step (EPt), and this is interesting. Additionally, scenario 1 (SVM-1), with inputs of one-, two- and three-month lag times of EP (EPt−1, EPt−2, EPt−3), could be selected as the best scenario in all time steps; other scenarios that were examined were not better than that.
The results in Table 5 show the high power of the SVM model in the monthly forecast of the EP process at Urmia station under scenarios 1, 3 and 5. However, in order to evaluate the possibility of increasing the accuracy in predicting this parameter, the month number (τ) was considered as input in the mentioned scenarios, and the accuracy of the scenarios was measured again; the obtained results of the statistical indicators are presented in Table 6. The results of evaluating the statistical indicators in Table 6 show that the accuracy of the SVM model increases again in all scenarios when considering the month number (τ) along with other inputs. If the case is viewed similarly to the prediction of the monthly rainfall process at Ardabil station in different future time steps, in the top scenarios in Table 6, there is increased accuracy in predicting EP for three lead times. When the month number was applied to the scenarios with the aim of increasing the accuracy in predicting EP in the current month (EPt), the best scenario, scenario 6, with the input of the month number and one-month delayed evaporation from the monthly pan (τ, EPt−1), with RMSE = 0.996 mm. month−1, KGE = 0.938 and CC = 0.957, was determined.
Compared to the best result set out in Table 4 for this time step, the SVM model (SVM-6) was able to use the month number to accurately predict the RMSE, KGE and CC of the current month’s EP (EPt), seeing improvements of 40.2, 11.1 and 7.6%. In the time step of the upcoming month (EPt+1), again, scenario 6, with RMSE =1.144 mm. month−1, KGE = 0.936 and CC = 0.942, returned the best results among the scenarios in this time step; compared to the best scenario in Table 5, the accuracy of RMSE, KGE and CC indices increased by 34.7, 10.8 and 8.8%, respectively. In the next modeling step, which was performed with the aim of predicting EP for the next two months (EPt+2), scenario 4 (SVM-4), with the input of the month number and lag times of one and two months (τ, EPt−1, EPt−2), and with RMSE = 1.144 mm. month−1, KGE = 0.919 and CC = 0.944, was selected as the best scenario. Comparing the results of these indicators with the indicators of the best scenario for predicting the time step, we see 28.6, 8.1 and 6.3% improvements in the results if the number of the month (τ) is used in the input of the scenarios with time delays. In the last time step evaluated, which is the prediction of evaporation from the pan for the upcoming three months (EPt+3), scenario 6 (SVM-6), with RMSE = 1.076 mm. month−1, KGE = 0.918 and CC = 0.951, was selected as the best scenario; compared to the best result in the case without using τ, increases of 19.6, 8.5 and 2.3% in the accuracy of the evaluation indicators, respectively, were found. Finally, it can be said that in predicting the monthly EP in the case that the month number was added to the lag time scenarios, not only do we not see a decrease in the forecasting accuracy but the accuracy increases to the extent that it persuades the user to use this simple and effective solution.
Evaluation of the scenarios in the test phase in the presence of the moon number is also shown in Figure 7. Thus, the best scenarios selected from Table 6 compared to their unnumbered scenarios of the month were examined in terms of time series diagrams and the observational distribution and prediction in all time steps. As it is shown in Figure 7, if the monthly prediction of the current time step EP (EPt) is examined, the observed and predicted time series diagrams show a high correlation of the predicted data under the scenario containing the number. The scenario with the month number (SVM-6) used observational data and was able to detect the evaporation trend well compared to the scenario without τ (SVM-5). The observational scatter plot and prediction of the current month’s EP (EPt) under the SVM-5 and SVM-6 scenarios show that the SVM-6 scenario regression line is more in line with the bisector line than the SVM-5 scenario. Estimation and underestimation in the scenario with τ (SVM-6) are less than those of SVM-5. The increased accuracy in predicting EP under the scenario with τ in the time step of the next month (EPt+1) compared to the scenario without τ, as shown in Figure 7, in both time series diagrams and the observational distribution and forecast, is completely clear. The SVM-6 scenario was able to predict EPt+1 and establish high compliance with the observational data. The issue in the distribution chart is also clearly defined, and the SVM-6 scenario’s regression line is much more compatible than that of SVM-5. Visual examination of time series diagrams and the observational distribution and prediction of the upcoming two months of EP (EPt+2) also indicates that the forecast accuracy is increased by the SVM-4 scenario compared to the SVM-3 scenario. In terms of the observational distribution and prediction diagrams, the scenario with τ (SVM-4) was able to overcome the weakness of overestimation found in the SVM-3 scenario, to some extent. In the last time step in Figure 7, i.e., the upcoming three months of EP (EPt+3), the increase in the accuracy of the scenario with τ (SVM-6) compared to the scenario without τ (SVM-5), in both time series and distribution diagrams, is evident. According to the observational distribution chart and forecast for the upcoming three months (EPt+3), the SVM-6 scenario, which contains the month number, was able to eliminate the overestimation and underestimation of scenario 5 (SVM-5) without τ, with high accuracy.

3.4. Simulation for Months with Maximum Rainfall and Pan Evaporation

According to the results of the previous sections, it was observed that the month number (τ) characteristic was able to improve the prediction accuracy of both rainfall (R) and pan evaporation (EP) parameters under the SVM model when entering the scenarios. In order to describe the potential physical or numerical reasons for these results, a study was conducted on how to improve the accuracy of the SVM model, especially under specific situations. According to the observed precipitation and evaporation time series diagrams in Figure 2, a seasonal pattern is observed, especially for pan evaporation (EP). The reason for the increased accuracy of the SVM model in the case of entering the month number (τ) can be due to the strong seasonal signal in the time series. For example, according to Figure 2, there is a clear pattern whereby certain months of the year have extremely low monthly average values. As a result, it is doubtful that the SVM model, by adding the month number (τ), detects this numerical pattern and produces high-precision results. Given that the months that contain the highest values are physically one of the most important characteristics of hydrological variables, in the following, we will examine how the SVM model will perform in the presence or absence of the month number under these special conditions. For this purpose, first, the highest monthly values (peak points) of the rainfall (70 months) and pan evaporation (28 months) variables were extracted according to the time series (Figure 2) related to each. In order to compare the results with the results of Section 3.2 and Section 3.3, the input scenarios and target time steps are exactly the same as those mentioned. To enter the SVM model, the data were divided under these conditions, meaning that 60% of the data were separated for the training phase, and 40% for the testing phase.
In this regard, the results of the statistical indicators under these specific conditions with three target time steps, for rainfall (R) in Table 7 and Table 8 (respectively, without and with τ), and for pan evaporation (EP) in Table 9 and Table 10 (respectively, without and with τ), were collected. In general, it can be seen that the SVM model was unable to create high accuracy under these new special conditions, one of the reasons for which could be related to the small amount of data in the training phase. In order to evaluate the improvement or deterioration in the results when considering the month number, first, for the precipitation variable, according to Table 7 and Table 8, it can be stated that by using the month number, the SVM model was able to improve the results for almost all targeted time steps (except Rt+2). For the best conditions (Rt), the accuracy was improved by 17% according to the RMSE index. Under these special conditions, and due to the more random rainfall time series, an acceptable score can be given to the SVM model. For the pan evaporation variable, according to Table 9 and Table 10, although the results under the conditions of using the highest values are weaker than the application mode of all data, the results improved in the case of considering the month number compared to the cases without the month number (except EPt+3). For the best conditions (EPt+2), the accuracy was improved by 13% according to the RMSE index. According to the above results, it is observed that due to the fact that the precipitation variable is more random, using the highest values, the improvement in the results with the month number was greater than the evaporation variable. According to the observational pan evaporation time series in Figure 2, this time series is completely periodic, and the SVM model could provide ideal results by relying on this; however, in these special circumstances, the month number proved its ability to improve the results.

4. Conclusions

The present study was prepared with the aim of increasing the accuracy in predicting monthly rainfall (R) and pan evaporation (EP) as two important hydrological processes, by providing a simple solution to determining new inputs for forecasting scenarios. For this purpose, monthly rainfall (R) data of Ardabil station in the period 1976–2019, and pan evaporation (EP) data of Urmia station in the period 1993–2019 were used. Initially, the prediction of the two parameters R and EP for the current and one–three lead times, by determining the different input modes that were a combination of lag times of one, two and three months, was developed with the help of the developed SVM model. Then, in the next step, in order to increase the accuracy of the predictions, application of the simplest input to the scenarios was put on the agenda, and the month number (τ) was added to all scenarios in predicting both the R and EP parameters. The month number was able to greatly improve the prediction accuracy of both the R and EP parameters under the SVM model by entering the scenarios and was able to overcome the complexities within these two hydrological processes that the scenarios were not initially able to solve with high accuracy. This was proven in all current time steps, and the upcoming one, two and three months. Finally, in order to investigate the characteristic of the month number in the SVM model under special conditions such as considering the highest values of the rainfall and pan evaporation time series, it was proved that by using the month number of the SVM model, again, it could improve the accuracy (on average, 17% improvement for rainfall, and 13% for pan evaporation) in almost all time steps. Due to the different conditions of meteorological stations relative to each other, this approach should be considered in different areas, and this is one of the limitations of the present study. Due to the wide range of effects of the two variables studied in the hydrological discussion, the results of the present study can be useful in agricultural sciences and in water management in general and will help owners.

Author Contributions

Conceptualization, M.A.J., I.M.-K. and M.A.G.; methodology, M.A.G.; software, S.S.S. and M.A.J.; validation, M.A.J. and I.M.-K.; formal analysis, M.A.G. and V.D.; investigation, S.S.S.; resources, S.S.S. and V.D.; writing—original draft preparation, M.A.J. and M.A.G.; writing—review and editing, I.M.-K. and V.D.; visualization, S.S.S.; supervision, M.A.G. and I.M.-K. All authors have read and agreed to the published version of the manuscript.

Funding

This research received no external funding.

Institutional Review Board Statement

Not applicable.

Informed Consent Statement

Not applicable.

Data Availability Statement

The data of this study are available from the authors upon request.

Conflicts of Interest

The authors declare no conflict of interest.

References

  1. McCuen, R. Vol. 3 of Hydrologic Analysis and Design; Prentice Hall: Upper Saddle River, NJ, USA, 2016. [Google Scholar]
  2. Daliakopoulos, I.N.; Coulibaly, P.; Tsanis, I.K. Groundwater level forecasting using artificial neural networks. J. Hydrol. 2005, 309, 229–240. [Google Scholar] [CrossRef]
  3. ASCE Task Committee on Application of Artificial Neural Networks in Hydrology. Artificial neural networks in hydrology. I: Preliminary concepts. J. Hydrol. Eng. 2000, 5, 115–123. [Google Scholar] [CrossRef]
  4. Javadi, A.A.; Al-Najjar, M.M. Finite element modeling of contaminant transport in soils including the effect of chemical reactions. J. Hazard. Mater. 2007, 143, 690–701. [Google Scholar] [CrossRef] [PubMed]
  5. Coppola, E.A., Jr.; Rana, A.J.; Poulton, M.M.; Szidarovszky, F.; Uhl, V.W. A neural network model for predicting aquifer water level elevations. Groundwater 2005, 43, 231–241. [Google Scholar] [CrossRef] [PubMed]
  6. Krishna, B.; Satyaji Rao, Y.R.; Vijaya, T. Modelling groundwater levels in an urban coastal aquifer using artificial neural networks. Hydrol. Process. Int. J. 2008, 22, 1180–1188. [Google Scholar] [CrossRef]
  7. Basheer, I.A.; Hajmeer, M. Artificial neural networks: Fundamentals, computing, design, and application. J. Microbiol. Methods 2000, 43, 3–31. [Google Scholar] [CrossRef]
  8. Chen, S.H.; Jakeman, A.J.; Norton, J.P. Artificial intelligence techniques: An introduction to their use for modelling environmental systems. Math. Comput. Simul. 2008, 78, 379–400. [Google Scholar] [CrossRef]
  9. Choubin, B.; Zehtabian, G.; Azareh, A.; Rafiei-Sardooi, E.; Sajedi-Hosseini, F.; Kişi, Ö. Precipitation forecasting using classification and regression trees (CART) model: A comparative study of different approaches. Environ. Earth Sci. 2018, 77, 1–13. [Google Scholar] [CrossRef]
  10. Diop, L.; Samadianfard, S.; Bodian, A.; Yaseen, Z.M.; Ghorbani, M.A.; Salimi, H. Annual rainfall forecasting using hybrid artificial intelligence model: Integration of multilayer perceptron with whale optimization algorithm. Water Resour. Manag. 2020, 34, 733–746. [Google Scholar] [CrossRef]
  11. Ghorbani, M.A.; Deo, R.C.; Yaseen, Z.M.; Kashani, M.H.; Mohammadi, B. Pan evaporation prediction using a hybrid multilayer perceptron-firefly algorithm (MLP-FFA) model: Case study in North Iran. Theor. Appl. Climatol. 2018, 133, 1119–1131. [Google Scholar] [CrossRef]
  12. Hadi, S.J.; Abba, S.I.; Sammen, S.S.; Salih, S.Q.; Al-Ansari, N.; Yaseen, Z.M. Non-linear input variable selection approach integrated with non-tuned data intelligence model for streamflow pattern simulation. IEEE Access 2019, 7, 141533–141548. [Google Scholar] [CrossRef]
  13. Sammen, S.S.; Mohamed, T.A.; Ghazali, A.H.; El-Shafie, A.H.; Sidek, L.M. Generalized regression neural network for prediction of peak outflow from dam breach. Water Resour. Manag. 2017, 31, 549–562. [Google Scholar] [CrossRef]
  14. Tikhamarine, Y.; Souag-Gamane, D.; Ahmed, A.N.; Sammen, S.S.; Kisi, O.; Huang, Y.F.; El-Shafie, A. Rainfall-runoff modelling using improved machine learning methods: Harris hawks optimizer vs. particle swarm optimization. J. Hydrol. 2020, 589, 125133. [Google Scholar] [CrossRef]
  15. Suparta, W.; Samah, A.A. Rainfall prediction by using ANFIS times series technique in South Tangerang, Indonesia. Geod. Geodyn. 2020, 11, 411–417. [Google Scholar] [CrossRef]
  16. Ridwan, W.M.; Sapitang, M.; Aziz, A.; Kushiar, K.F.; Ahmed, A.N.; El-Shafie, A. Rainfall forecasting model using machine learning methods: Case study Terengganu, Malaysia. Ain Shams Eng. J. 2020, 12, 1651–1663. [Google Scholar] [CrossRef]
  17. Yen, M.H.; Liu, D.W.; Hsin, Y.C.; Lin, C.E.; Chen, C.C. Application of the deep learning for the prediction of rainfall in Southern Taiwan. Sci. Rep. 2019, 9, 1–9. [Google Scholar] [CrossRef] [Green Version]
  18. Qasem, S.N.; Samadianfard, S.; Kheshtgar, S.; Jarhan, S.; Kisi, O.; Shamshirband, S.; Chau, K.W. Modeling monthly pan evaporation using wavelet support vector regression and wavelet artificial neural networks in arid and humid climates. Eng. Appl. Comput. Fluid Mech. 2019, 13, 177–187. [Google Scholar] [CrossRef] [Green Version]
  19. Tezel, G.; Buyukyildiz, M. Monthly evaporation forecasting using artificial neural networks and support vector machines. Theor. Appl. Climatol. 2016, 124, 69–80. [Google Scholar] [CrossRef]
  20. Malik, A.; Kumar, A.; Kisi, O. Daily pan evaporation estimation using heuristic methods with gamma test. J. Irrig. Drain. Eng. 2018, 144, 04018023. [Google Scholar] [CrossRef]
  21. Shiri, J. Evaluation of a neuro-fuzzy technique in estimating pan evaporation values in low-altitude locations. Meteorol. Appl. 2019, 26, 204–212. [Google Scholar] [CrossRef] [Green Version]
  22. Kisi, O.; Heddam, S. Evaporation modelling by heuristic regression approaches using only temperature data. Hydrol. Sci. J. 2019, 64, 653–672. [Google Scholar] [CrossRef]
  23. Moraes, R.; Valiati, J.F.; Neto, W.P. Document-level sentiment classification: An empirical comparison between SVM and ANN. Expert Syst. Appl. 2013, 40, 621–633. [Google Scholar] [CrossRef]
  24. Shin, K.S.; Lee, T.S.; Kim, H.J. An application of support vector machines in bankruptcy prediction model. Expert Syst. Appl. 2005, 28, 127–135. [Google Scholar] [CrossRef]
  25. Yoon, H.; Jun, S.C.; Hyun, Y.; Bae, G.O.; Lee, K.K. A comparative study of artificial neural networks and support vector machines for predicting groundwater levels in a coastal aquifer. J. Hydrol. 2011, 396, 128–138. [Google Scholar] [CrossRef]
  26. Chen, Q.; Dai, G.; Liu, H. Volume of fluid model for turbulence numerical simulation of stepped spillway overflow. J. Hydraul. Eng. 2002, 128, 683–688. [Google Scholar] [CrossRef]
  27. Ehteram, M.; Salih, S.Q.; Yaseen, Z.M. Efficiency evaluation of reverse osmosis desalination plant using hybridized multilayer perceptron with particle swarm optimization. Environ. Sci. Pollut. Res. 2020, 27, 1–14. [Google Scholar] [CrossRef] [PubMed]
  28. Han, S.; Qubo, C.; Meng, H. Parameter selection in SVM with RBF kernel function. In Proceedings of the World Automation Congress, Puerto Vallarta, Mexico, 24–28 June 2012; pp. 1–4. [Google Scholar]
  29. Nguyen, K.A.; Chen, W.; Lin, B.S.; Seeboonruang, U. Using Machine Learning-Based Algorithms to Analyze Erosion Rates of a Watershed in Northern Taiwan. Sustainability 2020, 12, 2022. [Google Scholar] [CrossRef] [Green Version]
  30. Shiru, M.S.; Shahid, S.; Park, I. Projection of Water Availability and Sustainability in Nigeria Due to Climate Change. Sustainability 2021, 13, 6284. [Google Scholar] [CrossRef]
  31. Yaseen, Z.M.; Al-Juboori, A.M.; Beyaztas, U.; Al-Ansari, N.; Chau, K.W.; Qi, C.; Alig, M.; Salihh, S.Q.; Shahid, S. Prediction of evaporation in arid and semi-arid regions: A comparative study using different machine learning models. Eng. Appl. Comput. Fluid Mech. 2020, 14, 70–89. [Google Scholar] [CrossRef] [Green Version]
  32. Yaseen, Z.M.; Sulaiman, S.O.; Deo, R.C.; Chau, K.W. An enhanced extreme learning machine model for river flow forecasting: State-of-the-art, practical applications in water resource engineering area and future research direction. J. Hydrol. 2019, 569, 387–408. [Google Scholar] [CrossRef]
  33. Gupta, H.V.; Kling, H.; Yilmaz, K.K.; Martinez, G.F. Decomposition of the mean squared error and NSE performance criteria: Implications for improving hydrological modelling. J. Hydrol. 2009, 377, 80–91. [Google Scholar] [CrossRef] [Green Version]
Figure 1. Geographical location of Ardabil and Urmia meteorological stations.
Sustainability 13 07752 g001
Figure 2. Variation in the monthly rainfall (R) (1976–2019) and pan evaporation (EP) (1993–2019) time series depicting the training and testing datasets at Ardabil and Urmia meteorological stations.
Sustainability 13 07752 g002
Figure 3. Cross-correlation analysis plots between input and output variables at (a) Ardabil and (b) Urmia stations.
Sustainability 13 07752 g003
Figure 4. Support vector machine structure.
Sustainability 13 07752 g004
Figure 5. Graphic display of support vectors.
Sustainability 13 07752 g005
Figure 6. Time series and scatter plots between observed and simulated current and lead times of 1–3 monthly rainfall values by SVM best scenarios without and with τ input (Table 3 and Table 4) during testing period at Ardabil station.
Sustainability 13 07752 g006aSustainability 13 07752 g006b
Figure 7. Time series and scatter plots between observed and simulated current and lead times of 1–3 monthly EP values by SVM best scenarios without and with τ input (Table 5 and Table 6) during testing period at Urmia station.
Sustainability 13 07752 g007aSustainability 13 07752 g007b
Table 1. The monthly statistical parameters of rainfall data at Ardabil station and EP data at Urmia station.
StationDatasetsData No.* Statistics
MinMaxAveSDSkewness
ArdabilTotal5191.0262.2523.1912.920.63
Training4141.0262.2523.4813.470.62
Testing1054.8550.0722.0510.470.44
UrmiaTotal318010.173.913.360.17
Training249010.163.863.360.19
Testing69010.174.113.410.11
* Min, minimum; Max, maximum; Ave, average; SD, standard deviation.
Table 2. The kernel functions used in the present study.
Function TypeKernel Function
Polynomial kernel function k ( x i , x j ) = ( x i T x j + 1 ) p
Radial-based kernel function (RBF) k ( x i , x j ) = e y | x i x j | 2
Pearson kernel function (PUK) k ( x i , x j ) = 1 [ 1 + ( 2 | x i x j | 2 × 2 1 ω ) 2 ] ω
Table 3. Values of the RMSE (mm. month−1), KGE and CC criteria for the developed SVM model of monthly rainfall prediction in scenarios without the month number (τ) during training and testing periods at Ardabil station.
Input ScenarioOutputModelTraining Testing
CCKGERMSE
(mm. Month−1)
CCKGERMSE
(mm. Month−1)
(1) Rt−1, Rt−2, Rt−3RtSVM-10.8630.8206.8320.8040.7996.464
* (3) Rt−1, Rt−2RtSVM-30.8390.7797.3910.8150.8076.230
(5) Rt−1RtSVM-50.7170.6099.4590.6660.6157.912
(1) Rt−1, Rt−2, Rt−3Rt+1SVM-10.5800.41711.0610.4540.3779.694
* (3) Rt−1, Rt−2Rt+1SVM-30.5020.30911.8060.4380.3069.560
(5) Rt−1Rt+1SVM-50.240−0.09813.1770.083−0.20310.538
* (1) Rt−1, Rt−2, Rt−3Rt+2SVM-10.3730.12012.5520.2910.06510.067
(3) Rt−1, Rt−2Rt+2SVM-30.2770.02513.1900.2740.05710.120
(5) Rt−1Rt+2SVM-50.152−0.17113.4170.185−0.15110.255
* (1) Rt−1, Rt−2, Rt−3Rt+3SVM-10.4110.15412.4300.4010.1429.603
(3) Rt−1, Rt−2Rt+3SVM-30.3150.03512.8930.3450.0669.847
(5) Rt−1Rt+3SVM-50.2650.00713.2520.3450.0939.840
* The results in bold show the selected model.
Table 4. Values of the RMSE (mm. month−1), KGE and CC criteria for the developed SVM model of monthly rainfall prediction in scenarios with the month number (τ) during training and testing periods at Ardabil station.
Input ScenarioOutputModelTraining Testing
CCKGERMSE
(mm. Month−1)
CCKGERMSE
(mm. Month−1)
* (2) τ, Rt−1, Rt−2, Rt−3RtSVM-20.9110.8415.6610.8460.8455.815
(4) τ, Rt−1, Rt−2RtSVM-40.9020.8505.8640.8320.8266.199
(6) τ, Rt−1RtSVM-60.8600.7756.9480.8120.8116.428
* (2) τ, Rt−1, Rt−2, Rt−3Rt+1SVM-20.7710.6658.6020.7040.7037.974
(4) τ, Rt−1, Rt−2Rt+1SVM-40.7440.6399.0450.7090.7098.013
(6) τ, Rt−1Rt+1SVM-60.6970.5579.7900.6500.6338.403
* (2) τ, Rt−1, Rt−2, Rt−3Rt+2SVM-20.7060.5519.6020.6560.6238.148
(4) τ, Rt−1, Rt−2Rt+2SVM-40.6680.51110.1110.6530.6288.244
(6) τ, Rt−1Rt+2SVM-60.6410.48310.4550.6320.6048.467
(2) τ, Rt−1, Rt−2, Rt−3Rt+3SVM-20.7230.5799.3560.6160.6018.739
(4) τ, Rt−1, Rt−2Rt+3SVM-40.6840.5329.8600.6160.5868.597
* (6) τ, Rt−1Rt+3SVM-60.6510.48910.2880.6280.5878.411
* The results in bold show the selected model.
Table 5. Values of the RMSE (mm. month−1), KGE and CC criteria for the developed SVM model of monthly EP prediction in scenarios without τ during training and testing periods at Urmia station.
Input ScenarioOutputModelTraining Testing
CCKGERMSE
(mm. Month−1)
CCKGERMSE
(mm. Month−1)
* (1) EPt−1, EPt−2, EPt−3EPtSVM-10.9370.9021.2300.8890.8441.666
(3) EPt−1, EPt−2EPtSVM-30.9010.8641.5430.8680.8311.804
(5) EPt−1EPtSVM-50.8280.8181.9690.7960.7812.175
* (1) EPt−1, EPt−2, EPt−3EPt+1SVM-10.9690.9550.8330.8660.8451.751
(3) EPt−1, EPt−2EPt+1SVM-30.8760.8021.6290.8070.7611.990
(5) EPt−1EPt+1SVM-50.5640.4942.8420.5320.4592.921
* (1) EPt−1, EPt−2, EPt−3EPt+2SVM-10.9650.9460.8830.8880.8501.603
(3) EPt−1, EPt−2EPt+2SVM-30.9110.8611.3940.7970.7642.072
(5) EPt−1EPt+2SVM-50.4210.2663.1060.4000.2503.093
* (1) EPt−1, EPt−2, EPt−3EPt+3SVM-10.9780.9560.7010.9300.8461.339
(3) EPt−1, EPt−2EPt+3SVM-30.9450.9261.1020.8690.8341.712
(5) EPt−1EPt+3SVM-50.6890.5362.4390.6170.4782.672
* The results in bold show the selected model.
Table 6. Values of the RMSE (mm. month−1), KGE and CC criteria for the developed SVM model of monthly EP prediction in scenarios with τ during training and testing periods at Urmia station.
Input ScenarioOutputModelTraining Testing
CCKGERMSE
(mm. Month−1)
CCKGERMSE
(mm. Month−1)
(2) τ, EPt−1, EPt−2, EPt−3EPtSVM-20.9840.9690.6020.9400.9131.205
(4) τ, EPt−1, EPt−2EPtSVM-40.9790.9700.6780.9510.9461.065
* (6) τ, EPt−1EPtSVM-60.9760.9550.7310.9570.9380.996
(2) τ, EPt−1, EPt−2, EPt−3EPt+1SVM-20.9820.9760.6410.9200.8991.370
(4) τ, EPt−1, EPt−2EPt+1SVM-40.9800.9680.6660.9380.9241.197
* (6) τ, EPt−1EPt+1SVM-60.9770.9660.7230.9420.9361.144
(2) τ, Rt−1, Rt−2, Rt−3EPt+2SVM-20.9820.9750.6490.9340.8931.244
* (4) τ, EPt−1, EPt−2EPt+2SVM-40.9800.9740.6760.9440.9191.144
(6) τ, EPt−1EPt+2SVM-60.9770.9590.7220.9420.9121.173
(2) τ, EPt−1, EPt−2, EPt−3EPt+3SVM-20.9820.9780.6440.9450.8811.167
(4) τ, EPt−1, EPt−2EPt+3SVM-40.9800.9720.6750.9490.9021.102
* (6) τ, EPt−1EPt+3SVM-60.9790.9680.6840.9510.9181.076
* The results in bold show the selected model.
Table 7. Values of the RMSE (mm. month−1), KGE and CC criteria for the developed SVM model of highest monthly rainfall values in scenarios without month number (τ) during training and testing periods at Ardabil station.
Input ScenarioOutputModelTraining Testing
CCKGERMSE
(mm. Month−1)
CCKGERMSE
(mm. Month−1)
(1) Rt−1, Rt−2, Rt−3RtSVM-10.7590.6267.8730.1350.13314.853
(3) Rt−1, Rt−2RtSVM-30.6140.5409.6630.0020.000115.733
* (5) Rt−1RtSVM-50.5400.30910.280−0.062−0.15913.378
(1) Rt−1, Rt−2, Rt−3Rt+1SVM-10.7180.4678.822−0.290−0.37115.698
(3) Rt−1, Rt−2Rt+1SVM-30.3710.05211.503−0.112−0.26413.285
* (5) Rt−1Rt+1SVM-50.179−0.15312.096−0.182−0.44311.695
(1) Rt−1, Rt−2, Rt−3Rt+2SVM-10.8140.6067.577−0.353−0.39217.562
(3) Rt−1, Rt−2Rt+2SVM-30.5190.26310.565−0.207−0.29814.177
* (5) Rt−1Rt+2SVM-50.197−0.15411.984−0.300−0.52711.241
(1) Rt−1, Rt−2, Rt−3Rt+3SVM-10.8150.6417.030−0.198−0.22615.986
(3) Rt−1, Rt−2Rt+3SVM-30.5010.29410.229−0.267−0.34714.576
* (5) Rt−1Rt+3SVM-50.108−0.24011.740−0.378−0.62711.990
* The results in bold show the selected model.
Table 8. Values of the RMSE (mm. month−1), KGE and CC criteria for the developed SVM model of highest monthly rainfall values in scenarios with month number (τ) during training and testing periods at Ardabil station.
Input ScenarioOutputModelTraining Testing
CCKGERMSE
(mm. Month−1)
CCKGERMSE
(mm. Month−1)
(2) τ, Rt−1, Rt−2, Rt−3RtSVM-20.9120.7955.2380.3090.30012.294
(4) τ, Rt−1, Rt−2RtSVM-40.7540.6337.9310.2560.25413.864
* (6) τ, Rt−1RtSVM-60.4890.20910.6030.160−0.08211.394
(2) τ, Rt−1, Rt−2, Rt−3Rt+1SVM-20.8270.6956.999−0.050−0.07815.353
(4) τ, Rt−1, Rt−2Rt+1SVM-40.3800.15711.441−0.203−0.33713.524
* (6) τ, Rt−1Rt+1SVM-60.293−0.01311.7830.026−0.17711.512
(2) τ, Rt−1, Rt−2, Rt−3Rt+2SVM-20.8970.7335.6980.009−0.09913.898
(4) τ, Rt−1, Rt−2Rt+2SVM-40.6490.5009.5060.045−0.00714.704
* (6) τ, Rt−1Rt+2SVM-60.4550.25610.929−0.020−0.08412.816
(2) τ, Rt−1, Rt−2, Rt−3Rt+3SVM-20.9500.8273.9390.055−0.03813.888
(4) τ, Rt−1, Rt−2Rt+3SVM-40.7520.5268.0200.063−0.00313.175
* (6) τ, Rt−1Rt+3SVM-60.4840.24310.448−0.047−0.21511.546
* The results in bold show the selected model.
Table 9. Values of the RMSE (mm. month−1), KGE and CC criteria for the developed SVM model of highest monthly EP values in scenarios without τ during training and testing periods at Urmia station.
Input ScenarioOutputModelTraining Testing
CCKGERMSE
(mm. Month−1)
CCKGERMSE
(mm. Month−1)
* (1) EPt−1, EPt−2, EPt−3EPtSVM-10.9390.7160.3690.1880.0300.876
(3) EPt−1, EPt−2EPtSVM-30.9280.7900.337−0.105−0.1311.128
(5) EPt−1EPtSVM-50.5380.2130.7170.007−0.1440.919
(1) EPt−1, EPt−2, EPt−3EPt+1SVM-10.9570.8550.278−0.371−0.4641.070
(3) EPt−1, EPt−2EPt+1SVM-30.9260.7210.378−0.181−0.2831.042
* (5) EPt−1EPt+1SVM-50.4690.3010.7880.2720.0880.858
(1) EPt−1, EPt−2, EPt−3EPt+2SVM-10.8940.6970.459−0.612−0.6511.115
(3) EPt−1, EPt−2EPt+2SVM-30.8500.6030.533−0.366−0.4400.981
* (5) EPt−1EPt+2SVM-50.4650.3560.8460.046−0.0090.886
(1) EPt−1, EPt−2, EPt−3EPt+3SVM-10.9270.8790.357−0.299−0.3001.245
(3) EPt−1, EPt−2EPt+3SVM-30.8270.5950.547−0.576−0.5811.254
* (5) EPt−1EPt+3SVM-50.4950.2960.788−0.212−0.2930.930
* The results in bold show the selected model.
Table 10. Values of the RMSE (mm. month−1), KGE and CC criteria for the developed SVM model of highest monthly EP values in scenarios with τ during training and testing periods at Urmia station.
Input ScenarioOutputModelTraining Testing
CCKGERMSE
(mm. Month−1)
CCKGERMSE
(mm. Month−1)
(2) τ, EPt−1, EPt−2, EPt−3EPtSVM-21.0000.9880.0150.2460.2050.923
* (4) τ, EPt−1, EPt−2EPtSVM-40.9820.8620.1950.3300.2360.843
(6) τ, EPt−1EPtSVM-60.7260.5500.5740.1480.0990.986
(2) τ, EPt−1, EPt−2, EPt−3EPt+1SVM-20.9810.8790.199−0.477−0.6051.038
(4) τ, EPt−1, EPt−2EPt+1SVM-40.9560.7890.321−0.486−0.5891.098
* (6) τ, EPt−1EPt+1SVM-60.6900.5220.6400.4310.2370.775
(2) τ, Rt−1, Rt−2, Rt−3EPt+2SVM-20.9900.9510.1400.047−0.0500.864
(4) τ, EPt−1, EPt−2EPt+2SVM-40.8570.7480.485−0.053−0.2170.895
* (6) τ, EPt−1EPt+2SVM-60.7550.6460.6120.4800.2450.787
(2) τ, EPt−1, EPt−2, EPt−3EPt+3SVM-21.0000.9770.033−0.230−0.2311.175
(4) τ, EPt−1, EPt−2EPt+3SVM-40.7540.6370.624−0.457−0.5381.076
* (6) τ, EPt−1EPt+3SVM-60.6360.5170.735−0.200−0.2581.049
* The results in bold show the selected model.
Publisher’s Note: MDPI stays neutral with regard to jurisdictional claims in published maps and institutional affiliations.

