
Can Environmental Regulations Promote Greenhouse Gas Abatement in OECD Countries? Command-and-Control vs. Market-Based Policies

1
School of Maritime Economics and Management, Dalian Maritime University, Dalian 116026, China
2
School of Economics and Management, Dalian University of Technology, Dalian 116024, China
*
Author to whom correspondence should be addressed.
Sustainability 2021, 13(12), 6913; https://doi.org/10.3390/su13126913
Submission received: 12 May 2021
/
Revised: 3 June 2021
/
Accepted: 15 June 2021
/
Published: 18 June 2021
Abstract
:In response to global warming, greenhouse gas (GHG) abatement has been one of the top priorities of governments, and a large variety of environmental regulation policies have been implemented in past decades. Using panel data from 27 OECD countries over the period of 2005–2012, this study measures and compares the stringency level of command-and-control and market-based environmental regulations. The differentiated impacts and indirect effects of environmental regulations on GHG emissions are tested empirically. The results show that: (1) Both command-and-control and market-based environmental regulations have effects on GHG abatement in OECD countries, and there is a non-linear relationship between environmental regulations and GHG discharge, in which stringent command-and-control environmental regulations and mild market-based regulation policies are preferred; (2) Command-and-control environmental regulations reduce GHG emissions by improving the technological level, rather than the energy consumption structure. In contrast, market-based environmental regulations can promote GHG abatement through the intermediary effects of both technological progress and the energy consumption structure. The findings provide implications for OECD countries to further reduce GHG emissions.
1. Introduction
A continuously increasing amount of greenhouse gases (GHG) has been emitted due to the development of global industrialization, resulting in a global crisis of climate change. Based on the consensus of the risks of global warming, GHG abatement has been one of the top priorities of worldwide governments. From the Kyoto Protocol in 1997 to the Paris Agreement in 2015, considerable efforts have been made via international climate negotiations to reduce carbon emissions and combat climate change. In the meantime, governments have carried out various environmental regulation policies to achieve GHG emissions reduction targets. Depending on the regulation mechanisms and constraints, environmental regulation policies are generally divided into two types: command-and-control environmental regulations and market-based environmental regulations [1,2,3,4]. Are both types of environmental regulations effective in reducing GHG, and what are the specific indirect effects through which each type of environmental regulation affects GHG abatement? Studying these issues is significant for the implementation of effective environmental regulation policies to achieve the goal of GHG emissions reduction.
Command-and-control environmental regulations force polluters to control pollution emissions on the strength of laws and regulations, including emissions standards, technical standards, and compulsory measures, with relatively little flexibility [5,6,7]. The main feature associated with command-and-control policies is their coerciveness [8]. Under the administration and supervision of government departments, polluting enterprises have to control their pollution emissions to meet legal requirements, through production reduction or production technology improvement. However, the polluting enterprises have no additional incentives to further reduce pollution emissions if they do achieve the pollution reduction target. In addition, due to information asymmetry, some enterprises may hide their emissions information, or even discharge pollution illegally to avoid penalties [9].
Market-based environmental regulations refer to flexible instruments through which regulatory information is reflected through market price [2,10], including environmental taxation, emissions trading schemes, deposit return systems, etc. Market-based environmental regulations are able to internalize a negative externality created by a polluting producer. Unlike command-and-control environmental regulations, market-based environmental regulations allow the producer to choose the extent to which this externality is internalized. Market-based environmental regulations provide choices for polluters to pay for the emissions or invest in pollution abatement. The polluters will choose to reduce emissions unless the marginal cost of doing so is higher than emissions tax rates. In addition, the polluters may consider the cost of pollution emissions in production decisions, and have financial incentives to reduce emissions voluntarily [11].
Command-and-control and market-based environmental regulations have obvious differences in regulation mode, compliance cost, supervision, and punishment measures. Consequently, the two types of environmental regulations are believed to influence the environment and economic performance differently [12]. Many scholars have discussed the impact of command-and-control and market-based environmental regulations on productivity [9,13], technology innovation [14], industry competitiveness [15], and so on. However, few studies have investigated the effects of command-and-control and market-based environmental regulations on GHG emissions and their indirect effects. In addition, existing studies generally use a single indicator to measure environmental regulation. For example, Tang et al. use the number of employees in the environmental protection system as a proxy for command-and-control environmental regulations [11], and sewage charges as a proxy for market-based environmental regulations. Different types of environmental regulations usually include multiple policy instruments, and single indicators cannot comprehensively reflect the real regulatory stringency.
Thus, to fill this gap, we researched the different impacts of command-and-control and market-based environmental regulations on GHG emissions and their indirect effects, based on panel data from OECD countries. First, we measured the stringency index of both types of environmental regulations in OECD countries, and compared the indices across years and countries, to analyze the level of environmental regulations in OECD countries overall. Subsequently, the effects of command-and-control and market-based environmental regulations on GHG emissions were tested empirically. Afterwards, the indirect effects of each type of environmental regulation on GHG abatement were examined, in which technological progress and energy consumption structure were the two mediating variables considered.
Unlike previous research, the contributions of this study include three aspects. Firstly, we divided the environmental regulations of OECD countries into command-and-control and market-based environmental regulations and measured each type of environmental regulations with the environmental policy stringency (EPS) index. The proxy for the stringency of environmental regulations generally used in the existing literature is a single indicator, such as pollution abatement and control expenditures (PACE) [16] or pollution abatement fees (PAF) [17,18], but there are at least seven types of environmental regulation instruments used in OECD countries, and each instrument covers several indicators. Compared to a single indicator, the EPS index is a composite indicator covering several policy tools, which can measure the environmental regulation intensity comprehensively. Secondly, we compared the differentiated influences of command-and-control and market-based environmental regulations on GHG emissions in OECD countries, in which non-linear impacts are considered. The result showed that both command-and-control and market-based environmental regulations can significantly reduce GHG emissions, but stringent command-and-control environmental regulations and mild market-based regulation policies were more effective. Thirdly, we analyzed the intermediary mechanism of environmental regulations affecting GHG abatement. Specifically, we used energy efficiency and the share of renewable energy consumption to represent technological progress and the energy consumption structure respectively. The results revealed that command-and-control environmental regulations primarily promoted GHG abatement through improving technological progress, rather than the energy consumption structure, whereas market-based environmental regulations could reduce GHG emissions through the intermediary effects of both technological progress and the energy consumption structure.
The study is arranged as follows: Section 2 provides a review of the related literature on the effects of environmental regulations on economic and environmental issues and the impacts of different types of environmental regulations; Section 3 measures the command-and-control and market-based environmental regulations levels of OECD countries using the EPS index; Section 4 introduces the data and methodology; Section 5 is composed of the empirical results by dynamic panel regressions and the intermediary effects model; Section 6 provides a summary of the research findings and discusses relevant policy implications.
2. Literature Review
2.1. The Effects of Environmental Regulations
Throughout the development of environmental economics, the effects of environmental regulations on economic and environmental performance have remained a controversial research topic. The relevant research mainly focuses on five aspects: energy consumption, technological innovation, productivity (efficiency), foreign direct investment (FDI) flow, and pollution emissions.
Regarding the influence of environmental regulations on energy consumption, a branch of studies has revealed that environmental regulations result in the cost effect and the “Green Paradox” effect [19]. The cost effect means that the production cost of polluting enterprises is increased by compliance with environmental regulation policies, thus the energy input of production decisions is accordingly adjusted. The “Green Paradox” effect indicates that the environmental policies of promoting renewable energy will accelerate fossil fuel consumption in the short term and correspondingly result in more pollution emissions [20,21]. Thus, the effects of environmental regulations on energy consumption are mediated by both the cost effect and the “Green Paradox” effect, and therefore uncertain.
Regarding the impact of environmental regulations on technological innovation, the existing literature draws different conclusions. Investment in R&D activities of enterprises can be correspondingly cut down, due to the compliance cost effect brought by environmental regulations [13]. However, other scholars believe that an appropriate level of environmental regulations may generate an “innovative offset” effect, resulting in effective resource allocation and technical progress of enterprises, which can weaken or eliminate the compliance cost effect [22,23,24].
Some research has discussed the relationship between environmental regulations and productivity. In terms of total factor productivity, numerous scholars reveal that environmental regulations exert a negative effect on the productivity growth of firms by forcing production factors to flow from the production end to the emission-reduction end [13,25]. However, some scholars have come to the opposite conclusion [26]. In the short term, environmental regulations were found to enhance the green total factor productivity of the manufacturing industry in China, but the influence was weakened in the long term [27]. In terms of energy efficiency, some scholars have found that environmental regulations can enhance energy efficiency [21]. The mandatory building design regulations implemented by the Hong Kong government were beneficial for saving energy [28]. However, other scholars found different results. The implementation of environmental licensing and ban policies in Denmark failed to accelerate energy efficiency [29]. Therefore, the effect of environmental regulations on productivity is still controversial.
Some researchers claim that environmental regulations can alter the flow of international capital. Environmental standards are generally more stringent in developed countries, which effectively increases the cost of production. To avoid the additional cost of complying with these regulations, firms shift their production to developing countries with fewer environmental restrictions [30,31]. The pollution haven hypothesis holds that pollution-intense production activities tend to be transferred to countries with looser environmental standards, where compliance with environmental regulations in the form of FDI is less costly. The pollution haven hypothesis states that there is a positive relationship between FDI inflow and environmental degradation [32]. Inversely, the halo effect hypothesis states that there is a negative relationship between FDI inflow and environmental pollution [33,34]. As such, the impact of the inflow of foreign direct investment resulting from looser environmental regulations on the environment is uncertain.
In addition, some research has paid attention to the impacts of environmental regulations on pollution emissions, and the empirical results are still inconclusive. For instance, Jin et al. found that environmental regulations were not beneficial for the reduction of industrial wastewater emissions in China [35]. The opposite conclusion was found by Calel and Dechezlepretre [36], who found that emissions trading schemes mitigate carbon emissions in a cost-effective, low-carbon, and innovative way. An emissions trading scheme, as one of the market-based policies, is believed not only to reduce carbon emissions effectively but also to stimulate technological development of alternative energies. Emissions trading schemes can provide a financial incentive for regulated firms to reduce emissions intensity through production scale adjustment or production process improvement. Zhao et al. conclude that environmental regulations significantly promoted the use of renewable energy in industrial enterprises, which is beneficial for CO2 abatement [37]. Guo and Chen contend that environmental regulations have an inverted U-shaped relationship with CO2 emissions, and that the influence of environmental regulations may change from the “Green Paradox” effect to the “Back-forced Reduction” effect when the environmental regulation intensity becomes stronger [38].
In conclusion, the studies on the effects of environmental regulations on energy consumption, technological innovation, productivity (efficiency), foreign direct investment (FDI) flow, and pollution emissions have not reached a consensus.
2.2. Different Types of Environmental Regulations
In past research on environmental regulations, a small part of the literature focuses on the specific type of regulation policies. Different environmental regulations are designed and implemented to address different environmental problems [39]. Thus, the impacts of different types of environmental regulations are believed to be significantly different [9]. In general, environmental regulations are usually classified into command-and-control environmental regulations and market-based environmental regulations.
Regarding command-and-control environmental regulations, Zhao et al. applied a structural equation model to explore the impacts of command-and-control regulation policies, including emissions standards, fines, supervision, environmental assessment systems, and production technology standards [12]. The findings displayed that command-and-control environmental regulations can significantly enhance technological innovation. Du et al. discovered that by imposing emissions cap policies, governments could effectively encourage enterprises to adopt low-carbon production modes [40]. Further, Du et al. found that emissions cap policies could also significantly control the total amount of carbon emissions of enterprises [41].
As for market-based environmental regulations, Cui et al. examined the cost-saving effect of emissions trading schemes in China, which could reduce the CO2 emissions of industrial enterprises [42]. The cost-saving effect in the central region was weaker than in the eastern and western regions. Zhao et al. empirically investigated the impacts of market-based regulation policies on productivity and CO2 emissions, considering tax credits, CDM, and emissions trading systems [43]. Market-based environmental regulations were found to have a remarkable influence on efficiency improvement and CO2 abatement. Xie et al. revealed that market-based environmental regulations measured by pollutant discharge fees were productivity growth-friendly [9]. Market-based environmental regulations are supposed to have high flexibility in emissions control, by allowing the polluters to select either the timing of the adjustment or the most suitable technology solution [13].
Moreover, several studies have compared the effects of the two types of environmental regulations, but the research conclusions are still conflicting. Some research held that, in comparison with command-and-control environmental regulations, market-based environmental regulation policies had the best environmental protection effect and were most widely used [44]. Market-based environmental regulations are believed to be superior in the reduction of production cost and the promotion of energy-saving technologies to command-and-control environmental regulations [45]. However, other studies concluded that command-and-control environmental regulations are irreplaceable, since the effective implementation of market-based environmental regulations depends on both a good institutional environment and the characteristics of pollutants [46].
To sum up, the existing literature has fully discussed the effects of environmental regulations from the perspective of energy consumption, technological innovation, and productivity. Although the effects of environmental regulations on environmental performance have been studied, there is still a lack of research on GHG emissions, except for research on the EKC curve. In particular, the differentiated impacts and indirect effects of command-and-control and market-based environmental regulations need to be further discussed. Moreover, the existing research usually uses a single indicator or multiple indicators to measure the stringency of environmental regulations. These indicators cannot comprehensively reflect the real level of environmental regulation policies. Therefore, this study measures command-and-control and market-based environmental regulations with the environmental policy stringency (EPS) index and tries to explore the impacts and indirect effects of each type of environmental regulation on GHG emissions using panel data from OECD countries.
3. Command-and-Control and Market-Based Environmental Regulations in OECD Countries
Based on the environmental policy stringency (EPS) index of OECD countries proposed by Botta and Kozluk [47], we measured the stringency of command-and-control and market-based environmental regulations respectively. The advantage of the EPS index is the integration of various policies into one index, which is comparable across years and countries. Compared to other available measures of different types of environmental regulations, the credibility of the EPS index of OECD countries’ command-and-control and market-based environmental regulation stringency has been confirmed [47,48].
The construction of the EPS index contains two main steps: (i) selection and scoring of single instruments and (ii) aggregation of the information. The instruments included in the analysis were selected to cover, as broadly as possible, both command-and-control and market-based environmental policies. The scoring procedure is based on the comparison of the stringency of each instrument against the distribution of values for the same type of instrument across countries and time. The aggregation procedure followed a two-step approach. First, the instrument-specific indicators (e.g., taxes on SOx, NOx, and CO2) were aggregated into mid-level indicators according to their type (e.g., environmental taxes). Second, the obtained mid-level indicators were grouped into the two broad categories of command-and-control and market-based instruments.
Specifically, 15 indicators of regulation policies were classified into command-and-control and market-based environmental regulations to score the stringency. Regulations directed at other pollutants were also included, due to the potential substitution effects on energy consumption and GHG abatement. Command-and-control environmental regulations incorporated emissions standards and government R&D expenditure on renewable energy. Market-based environmental regulations included four aspects: taxes, emissions trading schemes, feed-in tariffs, and deposit refund schemes. All the detailed indicators and their weights that form the composite index are shown in Table 1.
The data of specific regulation policies covered 28 OECD countries for the period 1990–2015. However, there are severe missing data in most countries after 2012 and the EPS index of Slovenia is missing from 1990 to 2007. In addition, as the Kyoto Protocol came into effect on 16 February 2005, we chose the year 2005 as the starting year of the sample. Therefore, referring to Wang et al. and Feng et al., this study used panel data from 27 OECD countries over the period 2005–2012, which is publicly available from OECD.Stat. The calculated EPS indexes of both types of environmental regulations ranged from 0 to 6, with higher numbers meaning more stringent environmental regulations [18,49].
Since the measurement of environmental regulations is comparable across countries, the trends of command-and-control and market-based environmental regulations in 2005 and 2012 are shown in Figure 1 and Figure 2 respectively. In terms of command-and-control environmental regulations, the average value of OECD countries in 2012 (3.81) was greater than that in 2005 (2.74), indicating that the level of command-and-control environmental regulations in OECD countries became more stringent. Most OECD countries developed more stringent regulations, of which the United States experienced the highest increase in command-and-control environmental regulations, from 0.93 in 2005 to 1.58 in 2012, while a few countries, including Spain and Greece, had less stringent command-and-control environmental regulations in 2012 than in 2005.
Similarly, the average value of the market-based environmental regulations of OECD countries in 2012 (1.85) was greater than that in 2005 (1.63). The maximum value was 2.79 (Portugal and Spain) and the minimum value was 0.08 (Mexico) in 2005, whereas the maximum value reached 3.33 (United Kingdom) and the minimum value became 0 (Mexico) in 2012. Countries including the United Kingdom, Australia, Canada, and Japan experienced a huge increase, while an apparent reduction can be seen in countries including Spain, Austria, Korea, Germany, and Portugal, which reflects a significant policy preference in OECD countries.
Comparison of the two types of environmental regulations in each country in 2012 is shown in Figure 3. The average value of command-and-control environmental regulation EPS (3.81) was higher than that of market-based environmental regulation EPS (1.85). Both types of environmental regulations were more stringent than the average level in the countries of Denmark, Netherlands, Australia, Japan, France, Switzerland, etc. All these countries run relatively stronger welfare programs compared to the other OECD members. By comparison, both of the two types of environmental regulations were less stringent than the average level in countries including Belgium, Ireland, Portugal, Spain, and Turkey. It is worth noting that the market-based EPS index was lower than the command-and-control EPS index in every OECD country from 2005 to 2012.
4. Data and Methodology
4.1. Data and Sample Selection
We used panel data from 27 OECD countries over the period of 2005–2012 obtained from OECD.Stat, omitting Chile, Estonia, Iceland, Ireland, Israel, Latvia, Luxembourg, New Zealand, and Slovenia due to data unavailability. There are two reasons for choosing the OECD countries as the study sample. On one hand, OECD countries are globally representative since these countries make up a large part of the world economy. On the other hand, OECD countries have played an important role in accelerating sustainable development over the last 20 years, particularly in making efforts towards GHG abatement. Exploring the different types of environmental regulations on GHG emissions of OECD countries provides important evidence and references for other countries.
4.2. Methodology
4.2.1. Benchmark Regression Model
First, the effects of command-and-control and market-based environmental regulations on GHG emissions () were estimated separately. The empirical regression models were as follows:
Considering the influence of lagged GHG emissions, the lagged dependent variable is included as an independent variable. As GHG emissions behaviors lag behind the implementation of environmental regulations, the environmental regulation variable is the exogenous variable [24]. In order to reflect the lag effect, the lagged EPS index is treated as the independent variable. and represent command-and-control and market-based EPS index of OECD country i in time t − 1. In addition, the lagging treatment of environmental regulations can eliminate the simultaneity bias between GHG emissions and environmental regulations, which may be caused by the existence of a bidirectional causality relationship. is a vector of the control variables. and are the disturbance terms. The disturbance terms are assumed to be independently identically distributed.
4.2.2. Intermediary Effect Test
Subsequently, we investigated the indirect effects of environmental regulations on GHG emissions through intermediary effects. Environmental regulations mainly influence environmental performance through technological progress and the improvement of energy consumption structure [50]. As the main source of GHG emissions is fossil fuel consumption (mainly coal, oil, and natural gas), we used energy efficiency and the share of renewable energy consumption to represent technological progress and improvement of the energy consumption structure respectively [51].
On the basis of the model proposed by [52], we constructed the intermediary effect model as follows:
where represents the mediating variables. , , and are the disturbance terms. The disturbance terms are assumed to be independently identically distributed. Similarly, we used the dynamic panel regression method.
Combined with Equations (1) and (2), the mediating effect model could test whether different types of environmental regulation can affect GHG emissions reduction through mediating variables Wi,t [53]. For example, for the command-and-control environmental regulations, the process consists of four steps: Firstly, examine the significance of the coefficient . If the estimated coefficient is significant, an intermediary effect may exist, and continue the process. Secondly, examine the significance of the coefficient and . If both of the estimated coefficients are significant, an intermediary effect exists; continue the process. If there is at least one estimated coefficient that is not significant, then conduct the Sobel test in the fourth step. Thirdly, determine the type of intermediary effect. If the estimated coefficient is not significant, it indicates a complete intermediary effect; regulations can affect GHG emissions only through the mediating variable. If is significant, it reflects a partial intermediary effect; regulations can affect GHG emissions partly through the mediating variable. Fourthly, conduct the Sobel test. The Sobel test is a method to verify whether an intermediary effect is significant [54]. The statistical value of the test is
where and are the standard deviations of and respectively. If the statistical value is significant, the intermediary effect exists. Otherwise, the intermediary effect does not exist. Based on the existing literature, 0.97 was treated as the critical value of the Sobel test [55].
4.3. Variables
The dependent variable () is GHG emissions (metric tons) per capita of each OECD country, which was obtained from OECD.Stat.
The independent variables are the stringency level of command-and-control environmental regulations () and market-based environmental regulations (), which were measured by the EPS index.
The mediating variables contain energy efficiency and renewable energy consumption. (1) Energy efficiency (): We used the economic output of per unit energy consumption, in constant 2000 USD, to measure energy efficiency as the level of technological progress. (2) Renewable energy consumption (): We used the proportion of renewable energy in the total final energy consumption to present the energy consumption structure. The data of renewable energy consumption and % of total final energy consumption were obtained from the World Bank. The indirect effects of the two mediating variables were examined separately.
Referring to Yin et al. and Wang et al., we added several control variables including GDP per capita, industry share, and export share (see Table 2), which are all main factors influencing changes in GHG emissions [24,56]. Specifically, GDP is the real gross domestic product per capita (constant 2000 USD), IS is the industrial value added (% of GDP), and ES is the exports of goods and services (% of GDP). Table 3 summarizes the descriptive statistics of the variables used in the regression.
5. Empirical Results
5.1. The Impacts of Command-and-Control and Market-Based Environmental Regulations
The system GMM method was applied to estimate the dynamic panel model of Equations (1) and (2), which can solve the endogeneity problem effectively by involving lagged terms of regressors as instrument variables. For each regression, we examined the specification of the equation with the Arellano–Bond test for first and second order autocorrelations and verified that there was no second order autocorrelation in the residuals of the specification. Moreover, the Hansen test of over-identifying restrictions provided no evidence to reject the validity of the instruments (p value > 0.05). The estimated results of the influence of the command-and-control and market-based environmental regulations are listed in Table 4 and Table 5 respectively. As expected, the estimated coefficients of lagged GHG were significantly positive.
In models 1 and 2, the estimated coefficients of command-and-control environmental regulations were significantly negative, implying that command-and-control environmental regulations reduce GHG emissions. Command-and-control environmental regulations force the polluting enterprises to reduce GHG emissions by setting a series of emissions standards with severe penalties for violations. Thus, the emissions cost brought by the command-and-control environmental regulations is higher than the emissions abatement cost for enterprises. Enterprises consequently take actions to reduce GHG emissions in production. In addition, government expenditure on R&D activities of renewable energy is beneficial for clean energy consumption and carbon abatement. To examine the non-linear relationship between command-and-control environmental regulations and GHG emissions, an additional square of the command-and-control regulation EPS is included in models 3 and 4. The impact of command-and-control environmental regulations presented an inverted U-shape, reflecting that only when the stringency of environmental regulations exceeds a certain level would command-and-control regulations take effect on GHG abatement. When the stringency of command-and-control environmental regulations is above a certain level, the compliance cost becomes higher to stimulate emissions control measures.
In model 5 and 6, the estimated coefficients of market-based environmental regulations were significantly negative, implying that market-based environmental regulations also effectively promote GHG abatement. Paying environmental taxes for GHG discharge or trading with emissions rights brings in compliance costs and financial incentives for polluting enterprises. Consequently, enterprises have motivations to reduce GHG emissions voluntarily, to pay less for discharge, or to sell the emissions rights for cost compensation. Furthermore, a square of the market-based regulation EPS is included in models 7 and 8. The market-based regulations had a U-shaped impact on GHG emissions, indicating that mild market-based regulations can promote GHG abatement. Compared to command-and-control environmental regulations, stringent market-based environmental regulations require a perfect market environment, and the regulatory way leads to the relative mildness of market-based regulations. Therefore, the estimated results of non-linear impacts imply that stringent command-and-control and mild market-based environmental regulations are preferred. This is possibly the reason why the command-and-control EPS index was greater than the market-based EPS index in every OECD country.
Regarding the control variables, the coefficients of GDP were significantly negative, which means that countries with high levels of economic development have realized industrialization with fewer GHG emissions. The estimated coefficient of IS was significantly positive, implying that countries with heavy industry have a more serious problem of GHG emissions in the industrialization process, while ES was negatively associated with GHG emissions, meaning that exports do not lead to massive GHG emissions.
5.2. The Indirect Effects of Command-and-Control Environmental Regulations
To investigate the indirect effects of command-and-control environmental regulations, Equations (3) and (5) were estimated by the system GMM method. The estimation results are shown in Table 6. Models 9 and 10 are the results of the intermediary effects of energy efficiency. The estimated coefficient of in model 9 was significantly positive, and the estimated coefficient of EE in model 10 was significantly negative. This means that command-and-control environmental regulations can reduce GHG emissions by promoting energy efficiency. The innovation offset effect stimulated by command-and-control environmental regulations was stronger than the compliance cost effect, thereby improving the technological level. Polluting enterprises were forced to improve production technology by the administrative controls, to reduce GHG emissions through less energy consumption [7,57].
Models 11 and 12 are the results of the intermediary effects of renewable energy consumption. Both the estimated coefficients of in model 11 and REC in model 12 were significantly negative, meaning that the implementation of command-and-control environmental regulations promoted a proportion of fossil fuels consumption, rather than renewable energy, which was not conducive to GHG abatement. There appear to be two main reasons for that. On one hand, the technological progress brought by command-and-control environmental regulations aims at improving production efficiency, instead of the production process. The adjustment of the energy structure and production process implies additional costs for enterprises. On the other hand, the “Green Paradox” explains that against the background of promoting renewable energy development by governments, fossil fuel suppliers will increase output and correspondingly decrease energy price with the expectation of a future energy market. Consequently, industrial enterprises are more likely to increase their consumption ratio of fossil fuels.
Hence, the implementation of command-and-control environmental regulations in OECD countries showed effects on GHG abatement directly and had positive effects with a relatively stringent level. Indirectly, command-and-control environmental regulations reduced GHG emissions by improving energy efficiency. For OECD countries, the relatively stringent command-and-control regulations stimulated technological progress in industrial production but were not effective in energy replacement. The impacts and indirect effects of command-and-control environmental regulations are displayed in Figure 4.
5.3. The Indirect Effects of Market-Based Environmental Regulations
Similarly, Equations (4) and (6) were estimated and the estimation results of the indirect effects of market-based environmental regulations are presented in Table 7. Models 13 and 14 are the results of the intermediary effects of energy efficiency. The estimated coefficient of in model 13 was significantly positive, while the estimated coefficient of EE in model 14 was not significant. Since only one of the two coefficients was significant, the Sobel test was conducted. The absolute value of Z-statistics in the Sobel test (−1.0) was higher than the critical value (), indicating that intermediary effects exist. Market-based environmental regulations could effectively reduce GHG emissions through increased energy efficiency and technological progress in industrial production, which was caused by the innovation offset effect stimulated by market-based regulations. Enterprises were inspired to invest in technological innovation by the financial incentives of market-based environmental regulations, such as emissions trading schemes and environmental taxes.
Models 15 and 16 show the results of the intermediary effects of renewable energy consumption. The estimated coefficient of in model 15 was significantly positive and the estimated coefficient of REC in model 16 was significantly negative, which indicates that the market-based environmental regulations could promote GHG abatement by increasing the consumption of renewable energy. Motivated by the financial benefits from GHG abatement, the polluting enterprises reduced emissions by all means. Along with technological progress, the improvement of the energy consumption structure through increasing renewable energy consumption could also achieve the goal of GHG abatement in industrial production.
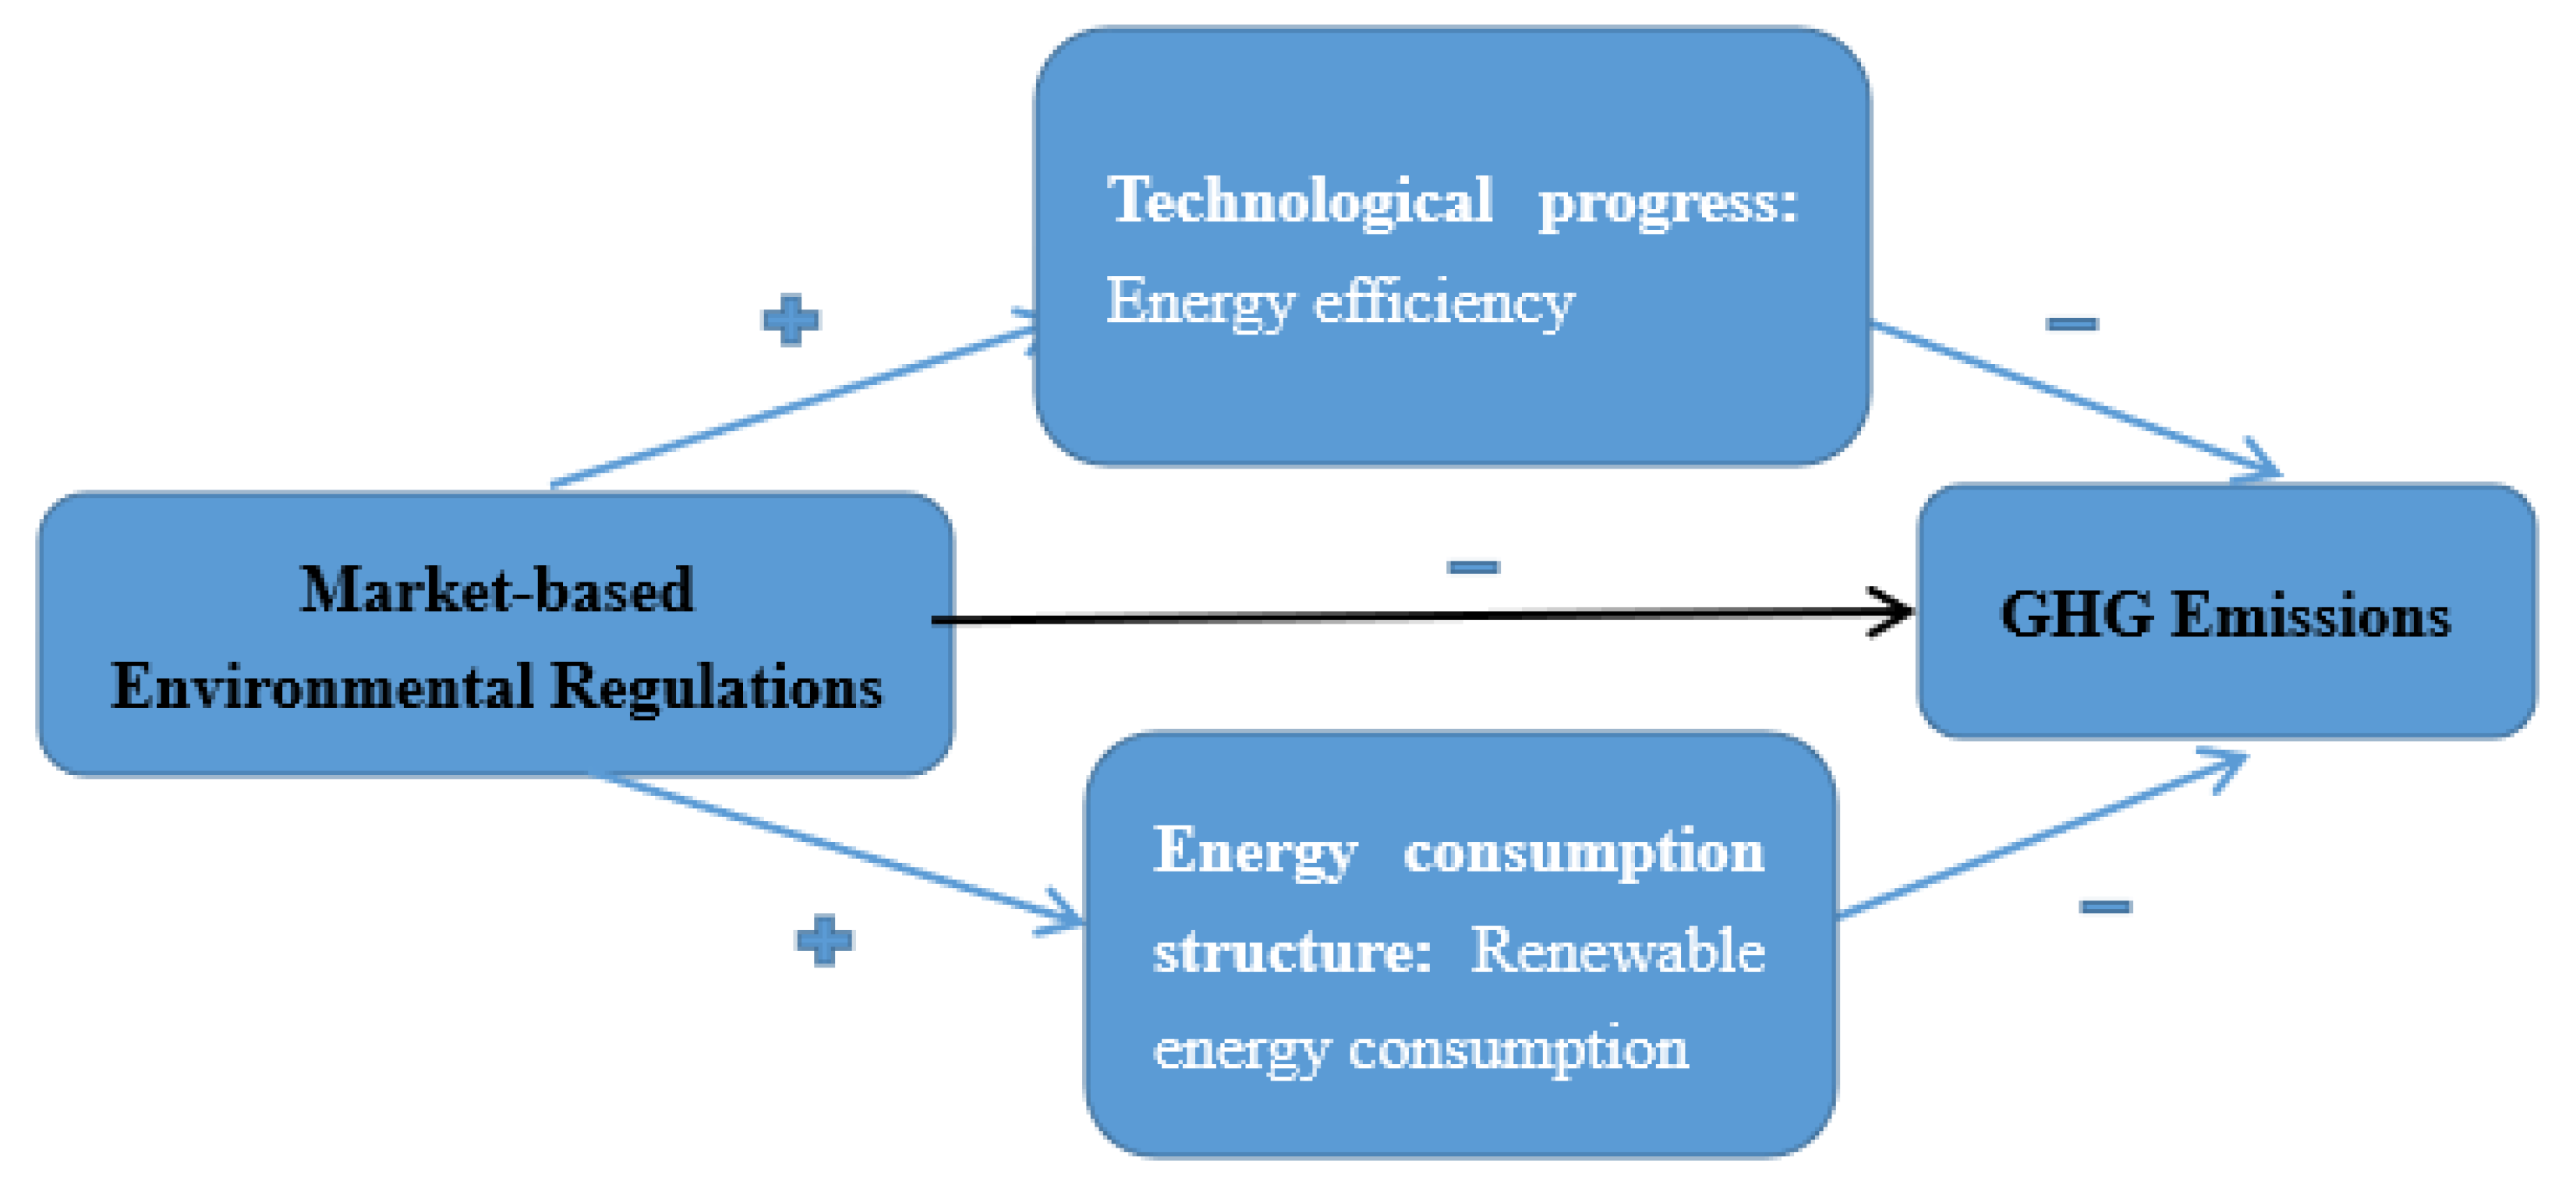
Therefore, the implementation of mild market-based environmental regulations in OECD countries not only reduced GHG emissions directly but also had indirect impacts through both the mechanisms of energy efficiency and renewable energy consumption (See Figure 5). Compared to command-and-control regulations, market-based regulations were relatively mild in OECD countries and more flexible with financial incentives. Consequently, polluting enterprises were inspired to reduce GHG emissions by all means, despite the additional cost of technological innovation and energy substitution in industrial production.
6. Conclusions and Implications
Under the threat of climate change, a series of environmental regulation policies have been implemented to reduce GHG emissions. Existing studies have discussed the effects of environmental regulations on economic and environmental performance. As one of the most influential organizations all around the world, OECD countries have played a key role in green growth over the past few decades. However, research is still insufficient on the impacts and specific mechanism of environmental regulations on GHG emissions in OECD countries, especially considering the differentiated impacts between command-and-control regulations and market-based regulations.
Employing panel data from 27 OECD countries over the period of 2005–2012, this study investigated the differentiated impacts of environmental regulations on GHG emissions and explored the intermediary effects of technological progress and energy consumption structure. Specifically, we divided environmental regulations into command-and-control and market-based environmental regulations and measured the stringency indices of each type of regulation, based on Botta’s and Kozluk’s approach [47]. With an increasing trend of environmental regulation levels in OECD countries, the command-and-control EPS index was greater than the market-based EPS index in each country. Based on the system GMM method, the direct impacts and indirect effects of command-and-control and market-based environmental regulations were investigated in empirical research. The main findings and conclusions are as follows:
First, both the command-and-control and market-based environmental regulations showed effects on GHG abatement in OECD countries, and there existed a non-linear relationship between environmental regulations and GHG emissions, in which stringent command-and-control and mild market-based environmental regulations were preferred. Second, command-and-control environmental regulations promoted GHG abatement through improving technological progress, rather than the energy consumption structure. Command-and-control regulations adopt mandatory measures and stimulate the innovation offset effect, which eliminates the compliance cost effect and promotes technological progress. Third, the implementation of market-based environmental regulations reduced GHG emissions through both the intermediary effects of technological progress and the energy consumption structure. Motivated by the financial incentives of market-based environmental regulations, not only technological progress in improving energy efficiency but also structural change in increasing renewable energy consumption was achieved in industrial production.
These findings suggest that market-based environmental regulations can be considered a Pareto improvement over command-and-control environmental regulations. Command-and-control environmental regulations can make rapid and measurable improvements in environmental performance, but they have higher requirements for government supervision and higher cost of implementation. In contrast, market-based environmental regulations give firms many options, inspiring polluters to reduce emissions levels. However, there are also some limitations to market-based environmental regulations. When the market system is imperfect, the market-based environmental regulations are unable to work effectively. In addition, there is a time lag in the response of regulated firms to market-based environmental regulations, and it takes time for market-based environmental regulations to take effect.
On account of the results of this study, relevant policy recommendations for OECD countries are proposed. Firstly, various environmental regulation policies of one country need to be well-designed and combined to achieve GHG emissions reduction. Both command-and-control and market-based environmental regulations should be promoted, since both types of environmental regulations are effective means to reduce GHG emissions. A reasonable stringency level of the command-and-control and market-based environmental regulations is required. Comparatively, it is preferred to implement more stringent command-and-control regulations and milder market-based regulations. Secondly, some supporting measures to stimulate renewable energy consumption in industrial enterprises are necessary. Although both types of environmental regulations can stimulate the innovation offset effects, command-and-control environmental regulations increase fossil fuel consumption rather than renewable energy consumption due to the “Green Paradox”. To optimize the energy consumption structure of the industrial sector, energy policies on renewable energy industry development and fossil fuel restriction should be further advocated.
Author Contributions
Conceptualization, X.G.; Data curation, L.F. and X.S.; Formal analysis, L.F. and X.S.; Investigation, L.F. and X.S.; Project administration, X.G.; Resources, X.G.; Supervision, X.G.; Writing—original draft, L.F. and X.S.; Writing—review & editing, X.G. All authors have read and agreed to the published version of the manuscript.
Funding
Humanities and Social Science Fund of Ministry of Education of China (Grant No.20YJC790037); National Natural Science Foundation of China (Grant No.72003018); Fundamental Research Funds for the Central Universities (Grant No.3132021251); China Postdoctoral Science Foundation (Grant No.2021M690505).
Data Availability Statement
Not applicable.
Conflicts of Interest
The authors declare no conflict of interest.
References
- Hammitt, J.K. Economic implications of hormesis. Hum. Exp. Toxicol. 2016, 23, 267–278. [Google Scholar] [CrossRef] [PubMed]
- Blackman, A.; Li, Z.; Liu, A.A. Efficacy of command-and-control and market-based environmental regulation in developing countries. Annu. Rev. Resour. Econ. 2018, 10, 381–404. [Google Scholar] [CrossRef] [Green Version]
- Zhang, N.; Jiang, X.F. The effect of environmental policy on Chinese firm’s green productivity and shadow price: A metafrontier input distance function approach. Technol. Forecast. Soc. Chang. 2019, 144, 129–136. [Google Scholar] [CrossRef]
- Li, H.-L.; Zhu, X.-H.; Chen, J.-Y.; Jiang, F.-T. Environmental regulations, environmental governance efficiency and the green transformation of China’s iron and steel enterprises. Ecol. Econ. 2019, 165, 106397. [Google Scholar] [CrossRef]
- Huang, B.; Mauerhofer, V.; Geng, Y. Analysis of existing building energy saving policies in Japan and China. J. Clean. Prod. 2016, 112, 1510–1518. [Google Scholar] [CrossRef]
- Ren, S.; Li, X.; Yuan, B.; Li, D.; Chen, X. The effects of three types of environmental regulation on eco-efficiency: A cross-region analysis in China. J. Clean. Prod. 2018, 173, 245–255. [Google Scholar] [CrossRef]
- Pan, X.; Ai, B.; Li, C.; Pan, X.; Yan, Y. Dynamic relationship among environmental regulation, technological innovation and energy efficiency based on large scale provincial panel data in China. Technol. Forecast. Soc. Chang. 2019, 144, 428–435. [Google Scholar] [CrossRef]
- Berck, P. The Theory and Practice of Command and Control in Environmental Policy; Routledge: London, UK, 2018. [Google Scholar]
- Xie, R.-H.; Yuan, Y.-J.; Huang, J.-J. Different Types of Environmental Regulations and Heterogeneous Influence on “Green” Productivity: Evidence from China. Ecol. Econ. 2017, 132, 104–112. [Google Scholar] [CrossRef]
- Cheng, Z.; Li, L.; Liu, J. The emissions reduction effect and technical progress effect of environmental regulation policy tools. J. Clean. Prod. 2017, 149, 191–205. [Google Scholar] [CrossRef]
- Tang, M.; Li, X.; Zhang, Y.; Wu, Y.; Wu, B. From command-and-control to market-based environmental policies: Optimal transition timing and China’s heterogeneous environmental effectiveness. Econ. Model. 2020, 90, 1–10. [Google Scholar] [CrossRef]
- Zhao, X.; Yin, H.; Zhao, Y. Impact of environmental regulations on the efficiency and CO2 emissions of power plants in China. Appl. Energy 2015, 149, 238–247. [Google Scholar] [CrossRef]
- Albrizio, S.; Kozluk, T.; Zipperer, V. Environmental policies and productivity growth: Evidence across industries and firms. J. Environ. Econ. Manag. 2017, 81, 209–226. [Google Scholar] [CrossRef]
- Zhang, Y.; Wang, J.; Xue, Y.; Yang, J. Impact of environmental regulations on green technological innovative behavior: An empirical study in China. J. Clean. Prod. 2018, 188, 763–773. [Google Scholar] [CrossRef]
- Greenstone, M.; List, J.A.; Syverson, C. The Effects of Environmental Regulation on the Competitiveness of US Manu-Facturing (No. w18392); National Bureau of Economic Research: Cambridge, MA, USA, 2012. [Google Scholar]
- Grover, D. Declining pollution abatement R&D in the United States: Theory and evidence. Ind. Corp. Chang. 2016, 26, 845–863. [Google Scholar]
- Yang, C.; Tseng, Y.; Chen, C. Environmental regulations, induced R&D, and productivity: Evidence from Taiwan’s manufacturing industries. Resour. Energy Econ. 2012, 34, 514–532. [Google Scholar]
- Wang, X.; Shao, Q. Non-linear effects of heterogeneous environmental regulations on green growth in G20 countries: Evidence from panel threshold regression. Sci. Total. Environ. 2019, 660, 1346–1354. [Google Scholar] [CrossRef]
- Liu, Y.; Li, Z.; Yin, X. The effects of three types of environmental regulation on energy consumption—Evidence from China. Environ. Sci. Pollut. Res. 2018, 25, 27334–27351. [Google Scholar] [CrossRef]
- Sinclair, P. High does nothing and rising is worse: Carbon taxes should keep declining to cut harmful emissions. Manch. Sch. 1992, 60, 41–52. [Google Scholar] [CrossRef]
- Zhang, K.; Zhang, Z.-Y.; Liang, Q.-M. An empirical analysis of the green paradox in China: From the perspective of fiscal decentralization. Energy Policy 2017, 103, 203–211. [Google Scholar] [CrossRef]
- Porter, M. America’s green strategy. Sci. Am. 1991, 264, 168. [Google Scholar] [CrossRef]
- Porter, M.E.; Van der Linde, C. Toward a new conception of the environment competitiveness relationship. J. Econ. Perspect. 1995, 9, 97–118. [Google Scholar] [CrossRef]
- Wang, Y.; Sun, X.; Guo, X. Environmental regulation and green productivity growth: Empirical evidence on the Porter Hypothesis from OECD industrial sectors. Energy Policy 2019, 132, 611–619. [Google Scholar] [CrossRef]
- Xing, X.; Liu, T.; Shen, L.; Wang, J. Linking Environmental Regulation and Financial Performance: The Mediating Role of Green Dynamic Capability and Sustainable Innovation. Sustainability 2020, 12, 1007. [Google Scholar] [CrossRef] [Green Version]
- Li, B.; Wu, S. Effects of local and civil environmental regulation on green total factor productivity in China: A spatial Durbin econometric analysis. J. Clean. Prod. 2017, 153, 342–353. [Google Scholar] [CrossRef]
- Yuan, B.; Xiang, Q. Environmental regulation, industrial innovation and green development of Chinese manufacturing: Based on an extended CDM model. J. Clean. Prod. 2018, 176, 895–908. [Google Scholar] [CrossRef]
- Chan, L.S. Investigating the environmental effectiveness of Overall Thermal Transfer Value code and its implication to energy regulation development. Energy Policy 2019, 130, 172–180. [Google Scholar] [CrossRef]
- Dirckinck-Holmfeld, K. The options of local authorities for addressing climate change and energy efficiency through environmental regulation of companies. J. Clean. Prod. 2015, 98, 175–184. [Google Scholar] [CrossRef]
- Rezza, A.A. FDI and pollution havens: Evidence from the Norwegian manufacturing sector. Ecol. Econ. 2013, 90, 140–149. [Google Scholar] [CrossRef]
- Bokpin, G.A. Foreign direct investment and environmental sustainability in Africa: The role of institutions and governance. Res. Int. Bus. Financ. 2017, 39, 239–247. [Google Scholar] [CrossRef]
- Rudolph, A.; Figge, L. Determinants of Ecological Footprints: What is the role of globalization? Ecol. Indic. 2017, 81, 348–361. [Google Scholar] [CrossRef]
- Atici, C. Carbon emissions, trade liberalization, and the Japan–ASEAN interaction: A group-wise examination. J. Jpn. Int. Econ. 2012, 26, 167–178. [Google Scholar] [CrossRef]
- Repkine, A.; Min, D. Foreign-Funded Enterprises and Pollution Halo Hypothesis: A Spatial Econometric Analysis of Thirty Chinese Regions. Sustainability 2020, 12, 5048. [Google Scholar] [CrossRef]
- Jin, W.; Zhang, H.; Liu, S.; Zhang, H. Technological innovation, environmental regulation, and green total factor effi-ciency of industrial water resources. J. Clean. Prod. 2019, 211, 61–69. [Google Scholar] [CrossRef]
- Calel, R.; Dechezleprêtre, A. Environmental Policy and Directed Technological Change: Evidence from the European Carbon Market. Rev. Econ. Stat. 2016, 98, 173–191. [Google Scholar] [CrossRef] [Green Version]
- Zhao, X.; Ma, Q.; Yang, R. Factors influencing CO2 emissions in China’s power industry: Co-integration analysis. Energy Policy 2013, 57, 89–98. [Google Scholar] [CrossRef]
- Guo, W.; Chen, Y. Assessing the efficiency of China’s environmental regulation on carbon emissions based on Tapio decoupling models and GMM models. Energy Rep. 2018, 4, 713–723. [Google Scholar]
- Stavins, R.N. Correlated Uncertainty and Policy Instrument Choice. J. Environ. Econ. Manag. 1996, 30, 218–232. [Google Scholar] [CrossRef] [Green Version]
- Du, S.; Hu, L.; Song, M. Production optimization considering environmental performance and preference in the cap-and-trade system. J. Clean. Prod. 2016, 112, 1600–1607. [Google Scholar] [CrossRef]
- Du, S.; Tang, W.; Song, M. Low-carbon production with low-carbon premium in cap-and-trade regulation. J. Clean. Prod. 2016, 134, 652–662. [Google Scholar] [CrossRef]
- Cui, L.-B.; Fan, Y.; Zhu, L.; Bi, Q.-H. How will the emissions trading scheme save cost for achieving China’s 2020 carbon intensity reduction target? Appl. Energy 2014, 136, 1043–1052. [Google Scholar] [CrossRef]
- Zhao, X.; Zhao, Y.; Zeng, S.; Zhang, S. Corporate behavior and competitiveness: Impact of environmental regulation on Chinese firms. J. Clean. Prod. 2015, 86, 311–322. [Google Scholar] [CrossRef]
- Lade, G.E.; Lawell, C.C.L.; Smith, A. Designing Climate Policy: Lessons from the Renewable Fuel Standard and the Blend Wall. Am. J. Agric. Econ. 2018, 100, 585–599. [Google Scholar] [CrossRef]
- Alesina, A.; Passarelli, F. Regulation versus taxation. J. Public Econ. 2014, 110, 147–156. [Google Scholar] [CrossRef] [Green Version]
- Montero, J.-P. Permits, Standards, and Technology Innovation. J. Environ. Econ. Manag. 2002, 44, 23–44. [Google Scholar] [CrossRef] [Green Version]
- Botta, E.; Koźluk, T. Measuring Environmental Policy Stringency in OECD Countries-A Composite Index Approach; OECD Economics Department Working Paper No.1177; OECD Publishing: Washington, DC, USA, 2014. [Google Scholar]
- Brunel, C.; Levinson, A. Measuring the Stringency of Environmental Regulations. Rev. Environ. Econ. Policy 2016, 10, 47–67. [Google Scholar] [CrossRef]
- Feng, G.; McLaren, K.R.; Yang, O.; Zhang, X.; Zhao, X. The impact of environmental policy stringency on industrial productivity growth: A semi-parametric study of OECD countries. Energy Econ. 2021, 100, 105320. [Google Scholar] [CrossRef]
- Ari, I. Voluntary emission trading potential of Turkey. Energy Policy 2013, 62, 910–919. [Google Scholar] [CrossRef]
- Luu, Q.L.; Nguyen, N.H.; Halog, A.; Bui, H.V. GHG emission reduction in energy sector and its abatement cost: Case study of five provinces in Mekong delta region, Vietnam. Int. J. Green Energy 2018, 15, 715–723. [Google Scholar] [CrossRef]
- Baron, R.M.; Kenny, D.A. The moderator–mediator variable distinction in social psychological research: Conceptual, strategic, and statistical considerations. J. Pers. Soc. Psychol. 1986, 51, 1173–1182. [Google Scholar] [CrossRef]
- Freedman, L.S.; Schatzkin, A. Sample size for studying intermediate endpoints within intervention trials or observa-tional studies. Am. J. Epidemiol. 1992, 136, 1148–1159. [Google Scholar] [CrossRef]
- Sobel, M.E. Asymptotic Confidence Intervals for Indirect Effects in Structural Equation Models. Sociol. Methodol. 1982, 13, 290. [Google Scholar] [CrossRef]
- MacKinnon, D.P.; Lockwood, C.M.; Hoffman, J.M.; West, S.G.; Sheets, V. A comparison of methods to test me-diation and other intervening variable effects. Psychol. Methods 2002, 7, 83–104. [Google Scholar] [CrossRef] [PubMed]
- Yin, J.; Zheng, M.; Chen, J. The effects of environmental regulation and technical progress on CO2 Kuznets curve: An evidence from China. Energy Policy 2015, 77, 97–108. [Google Scholar] [CrossRef]
- Huang, J.; Du, D.; Hao, Y. The driving forces of the change in China’s energy intensity: An empirical research using DEA-Malmquist and spatial panel estimations. Econ. Model. 2017, 65, 41–50. [Google Scholar] [CrossRef]
Figure 1.
Stringency of command-and-control environmental regulations in 2005 and 2012. Source: organized by authors.
Figure 1.
Stringency of command-and-control environmental regulations in 2005 and 2012. Source: organized by authors.
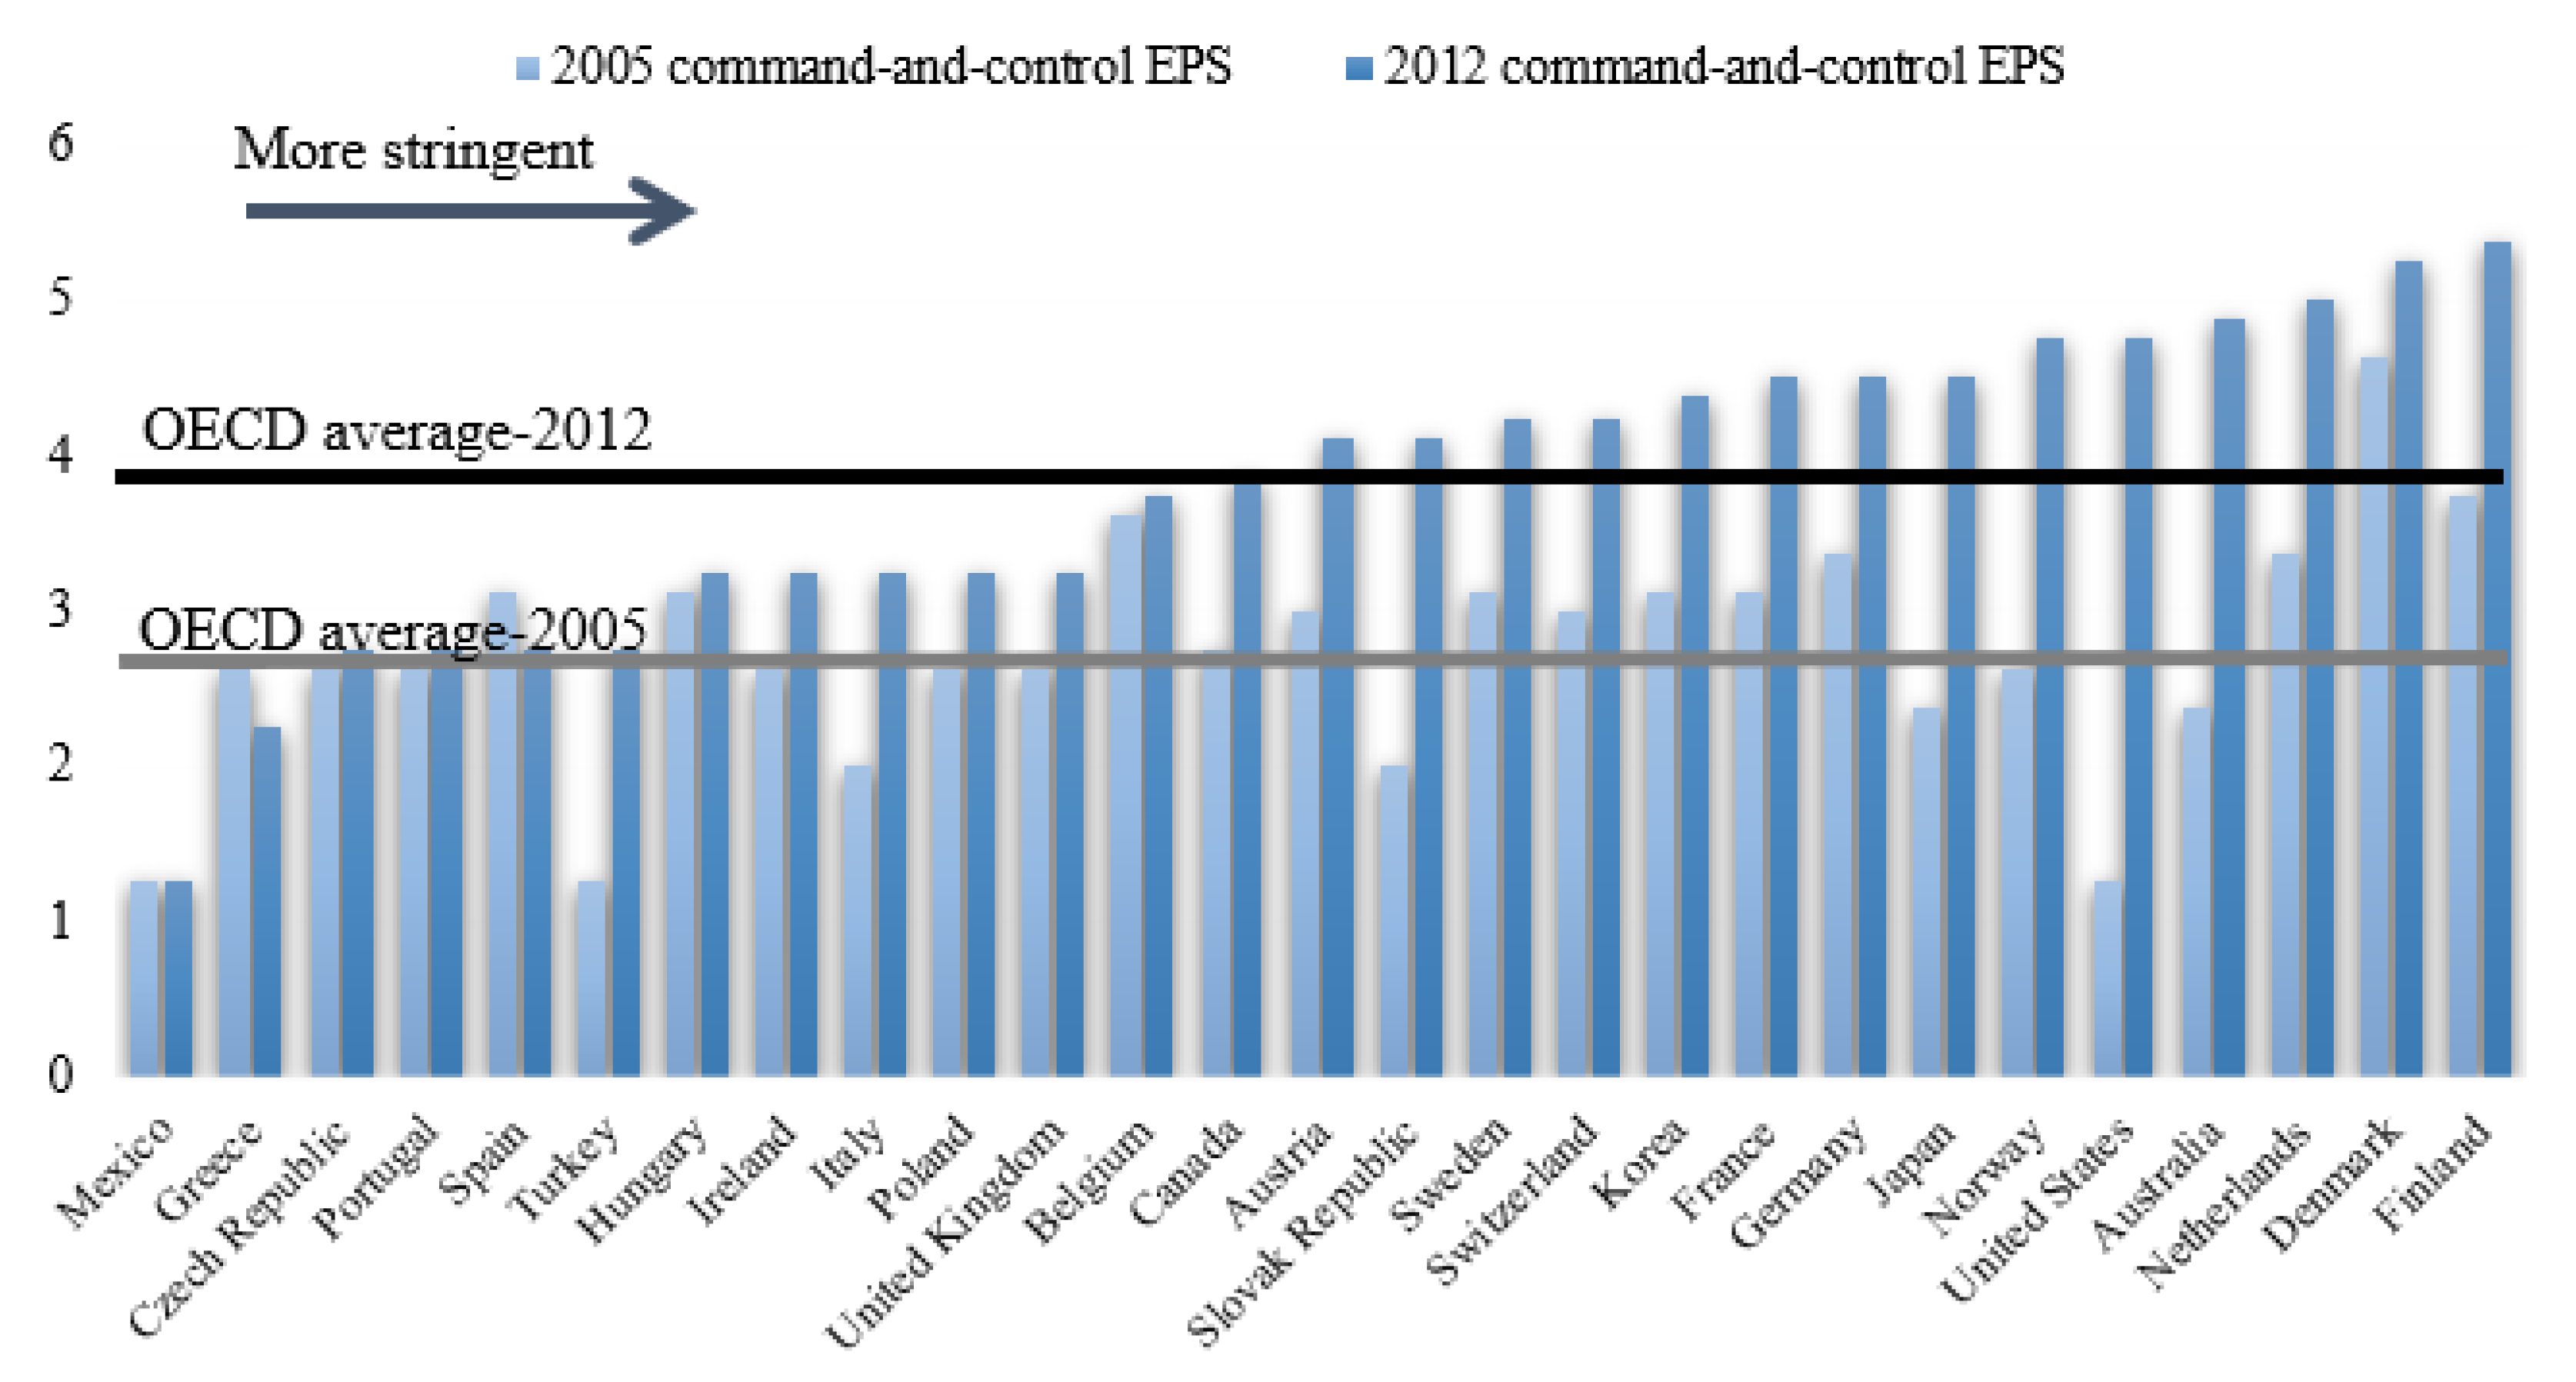
Figure 2.
Stringency of market-based environmental regulations in 2005 and 2012. Source: organized by authors.
Figure 2.
Stringency of market-based environmental regulations in 2005 and 2012. Source: organized by authors.
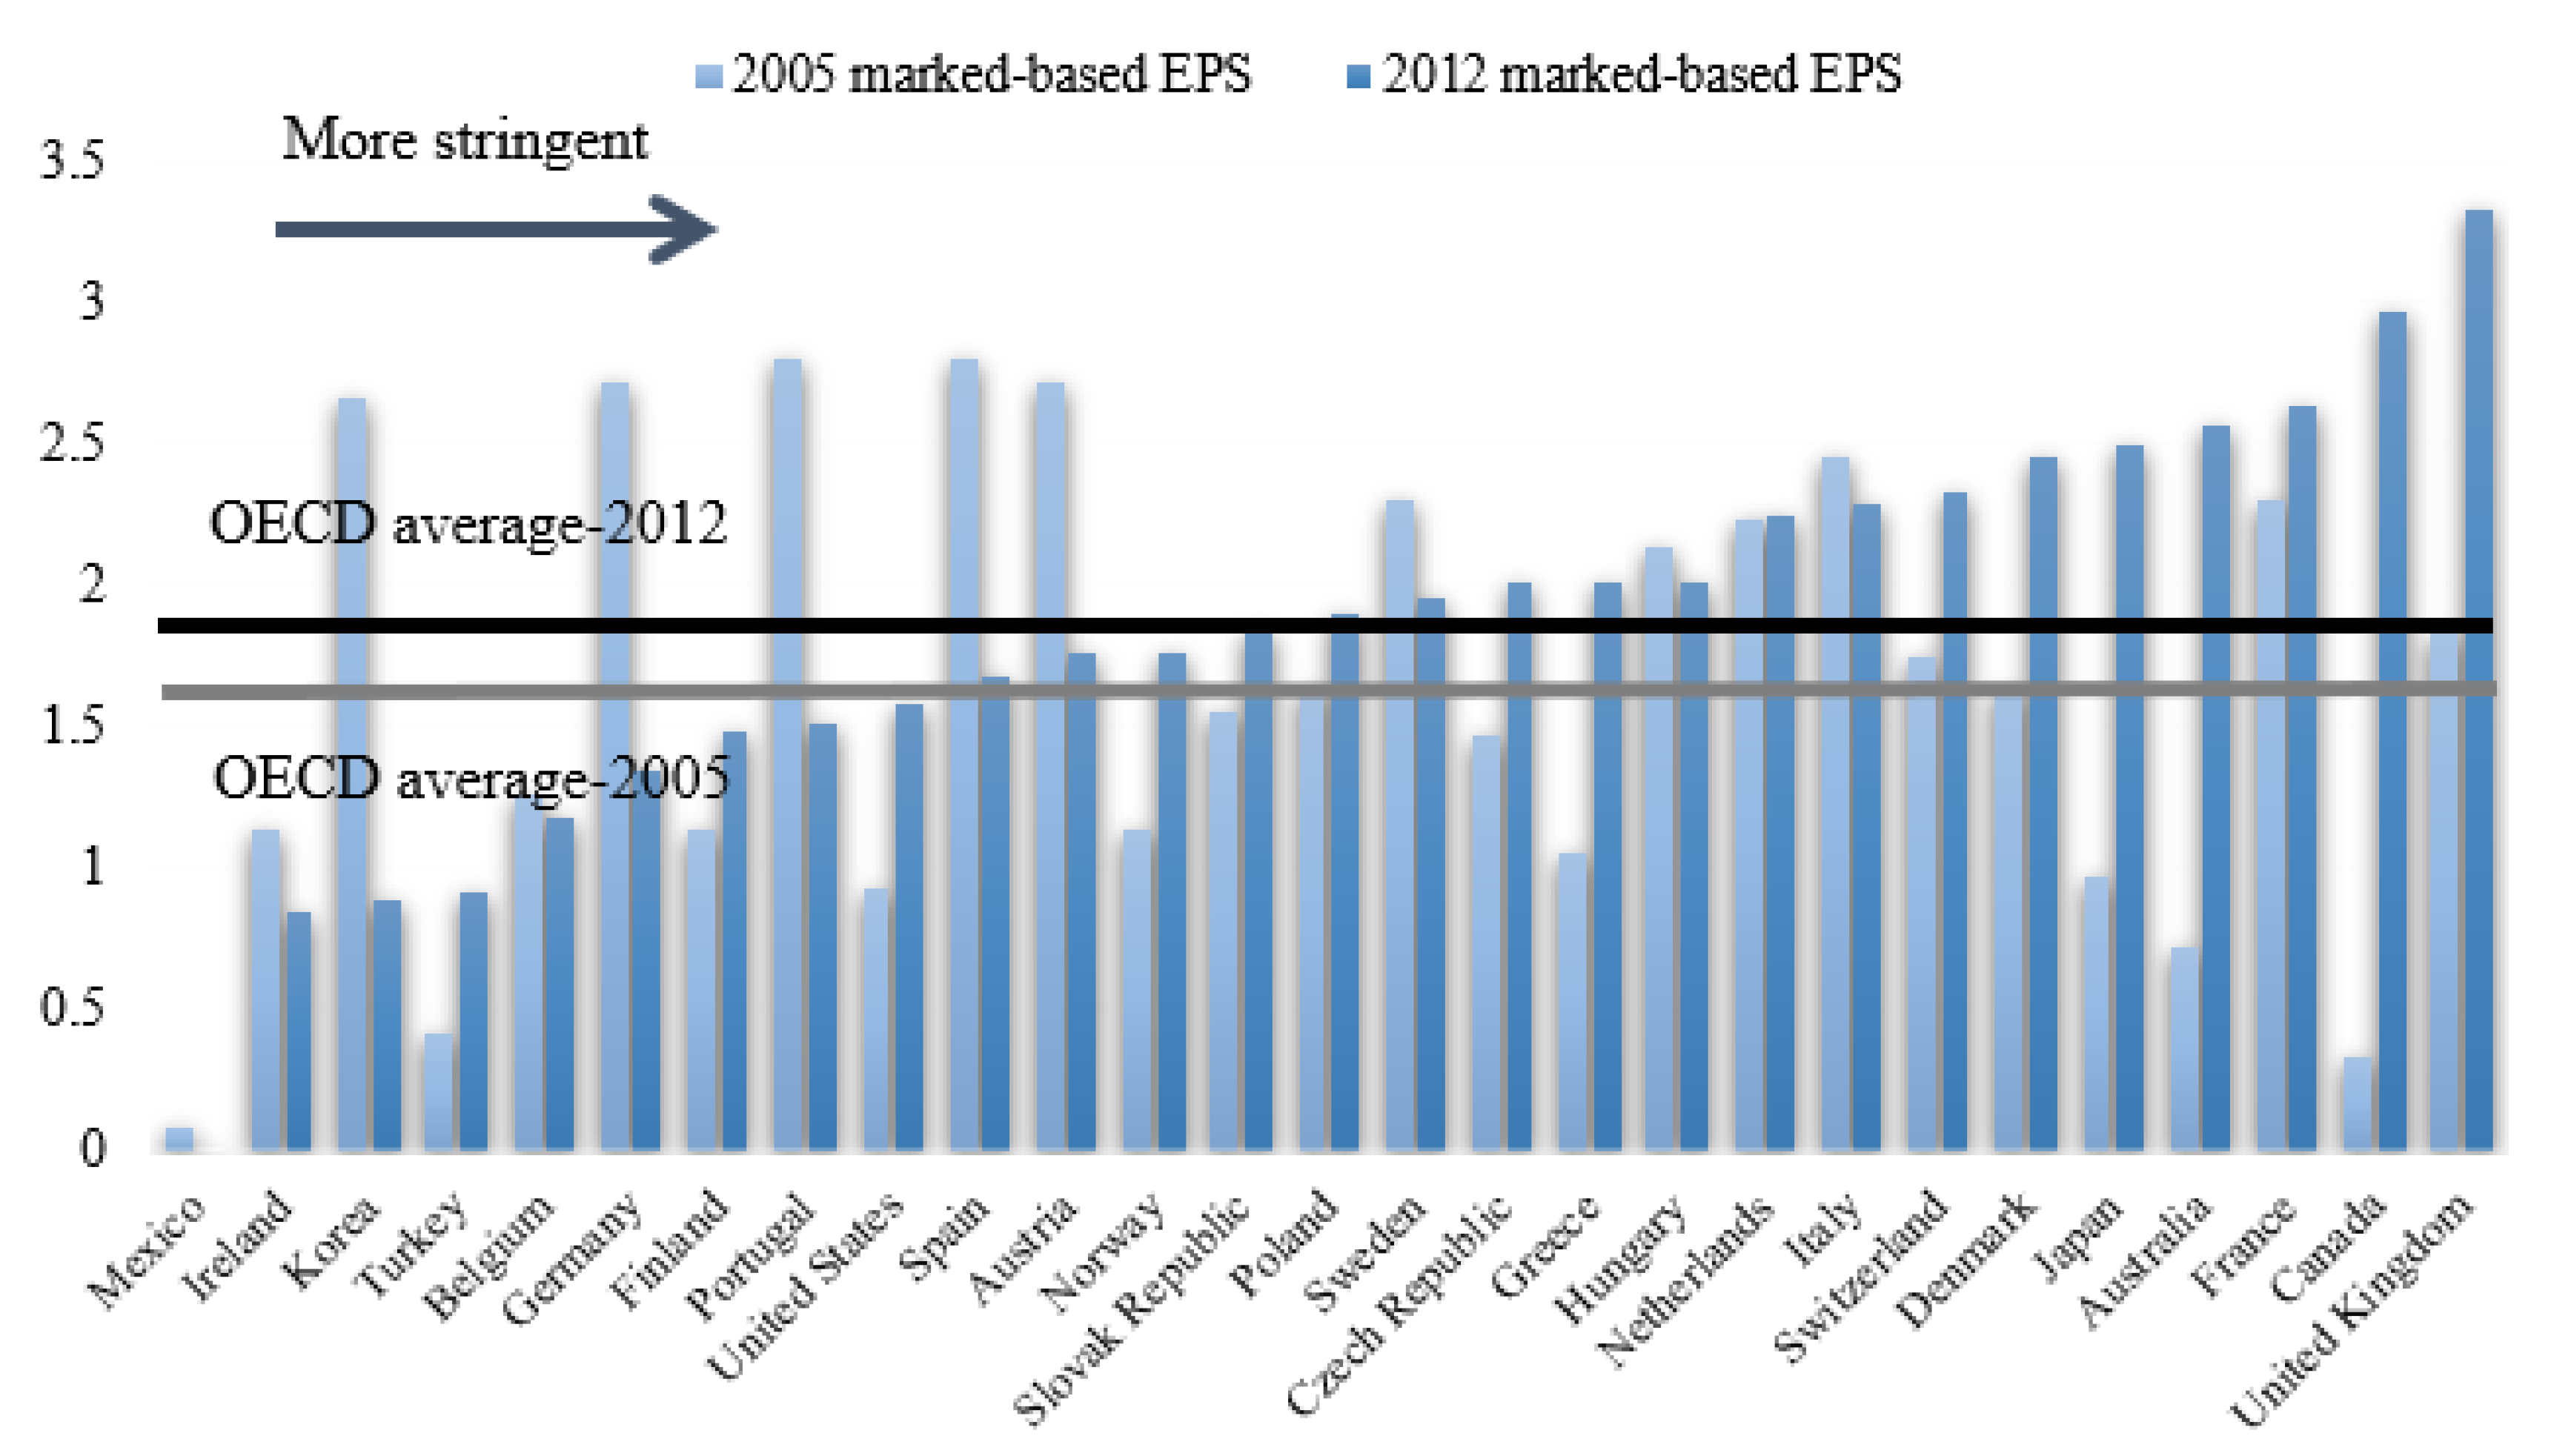
Figure 3.
Comparison of two types of environmental regulations in 2012. Source: organized by authors.
Figure 3.
Comparison of two types of environmental regulations in 2012. Source: organized by authors.
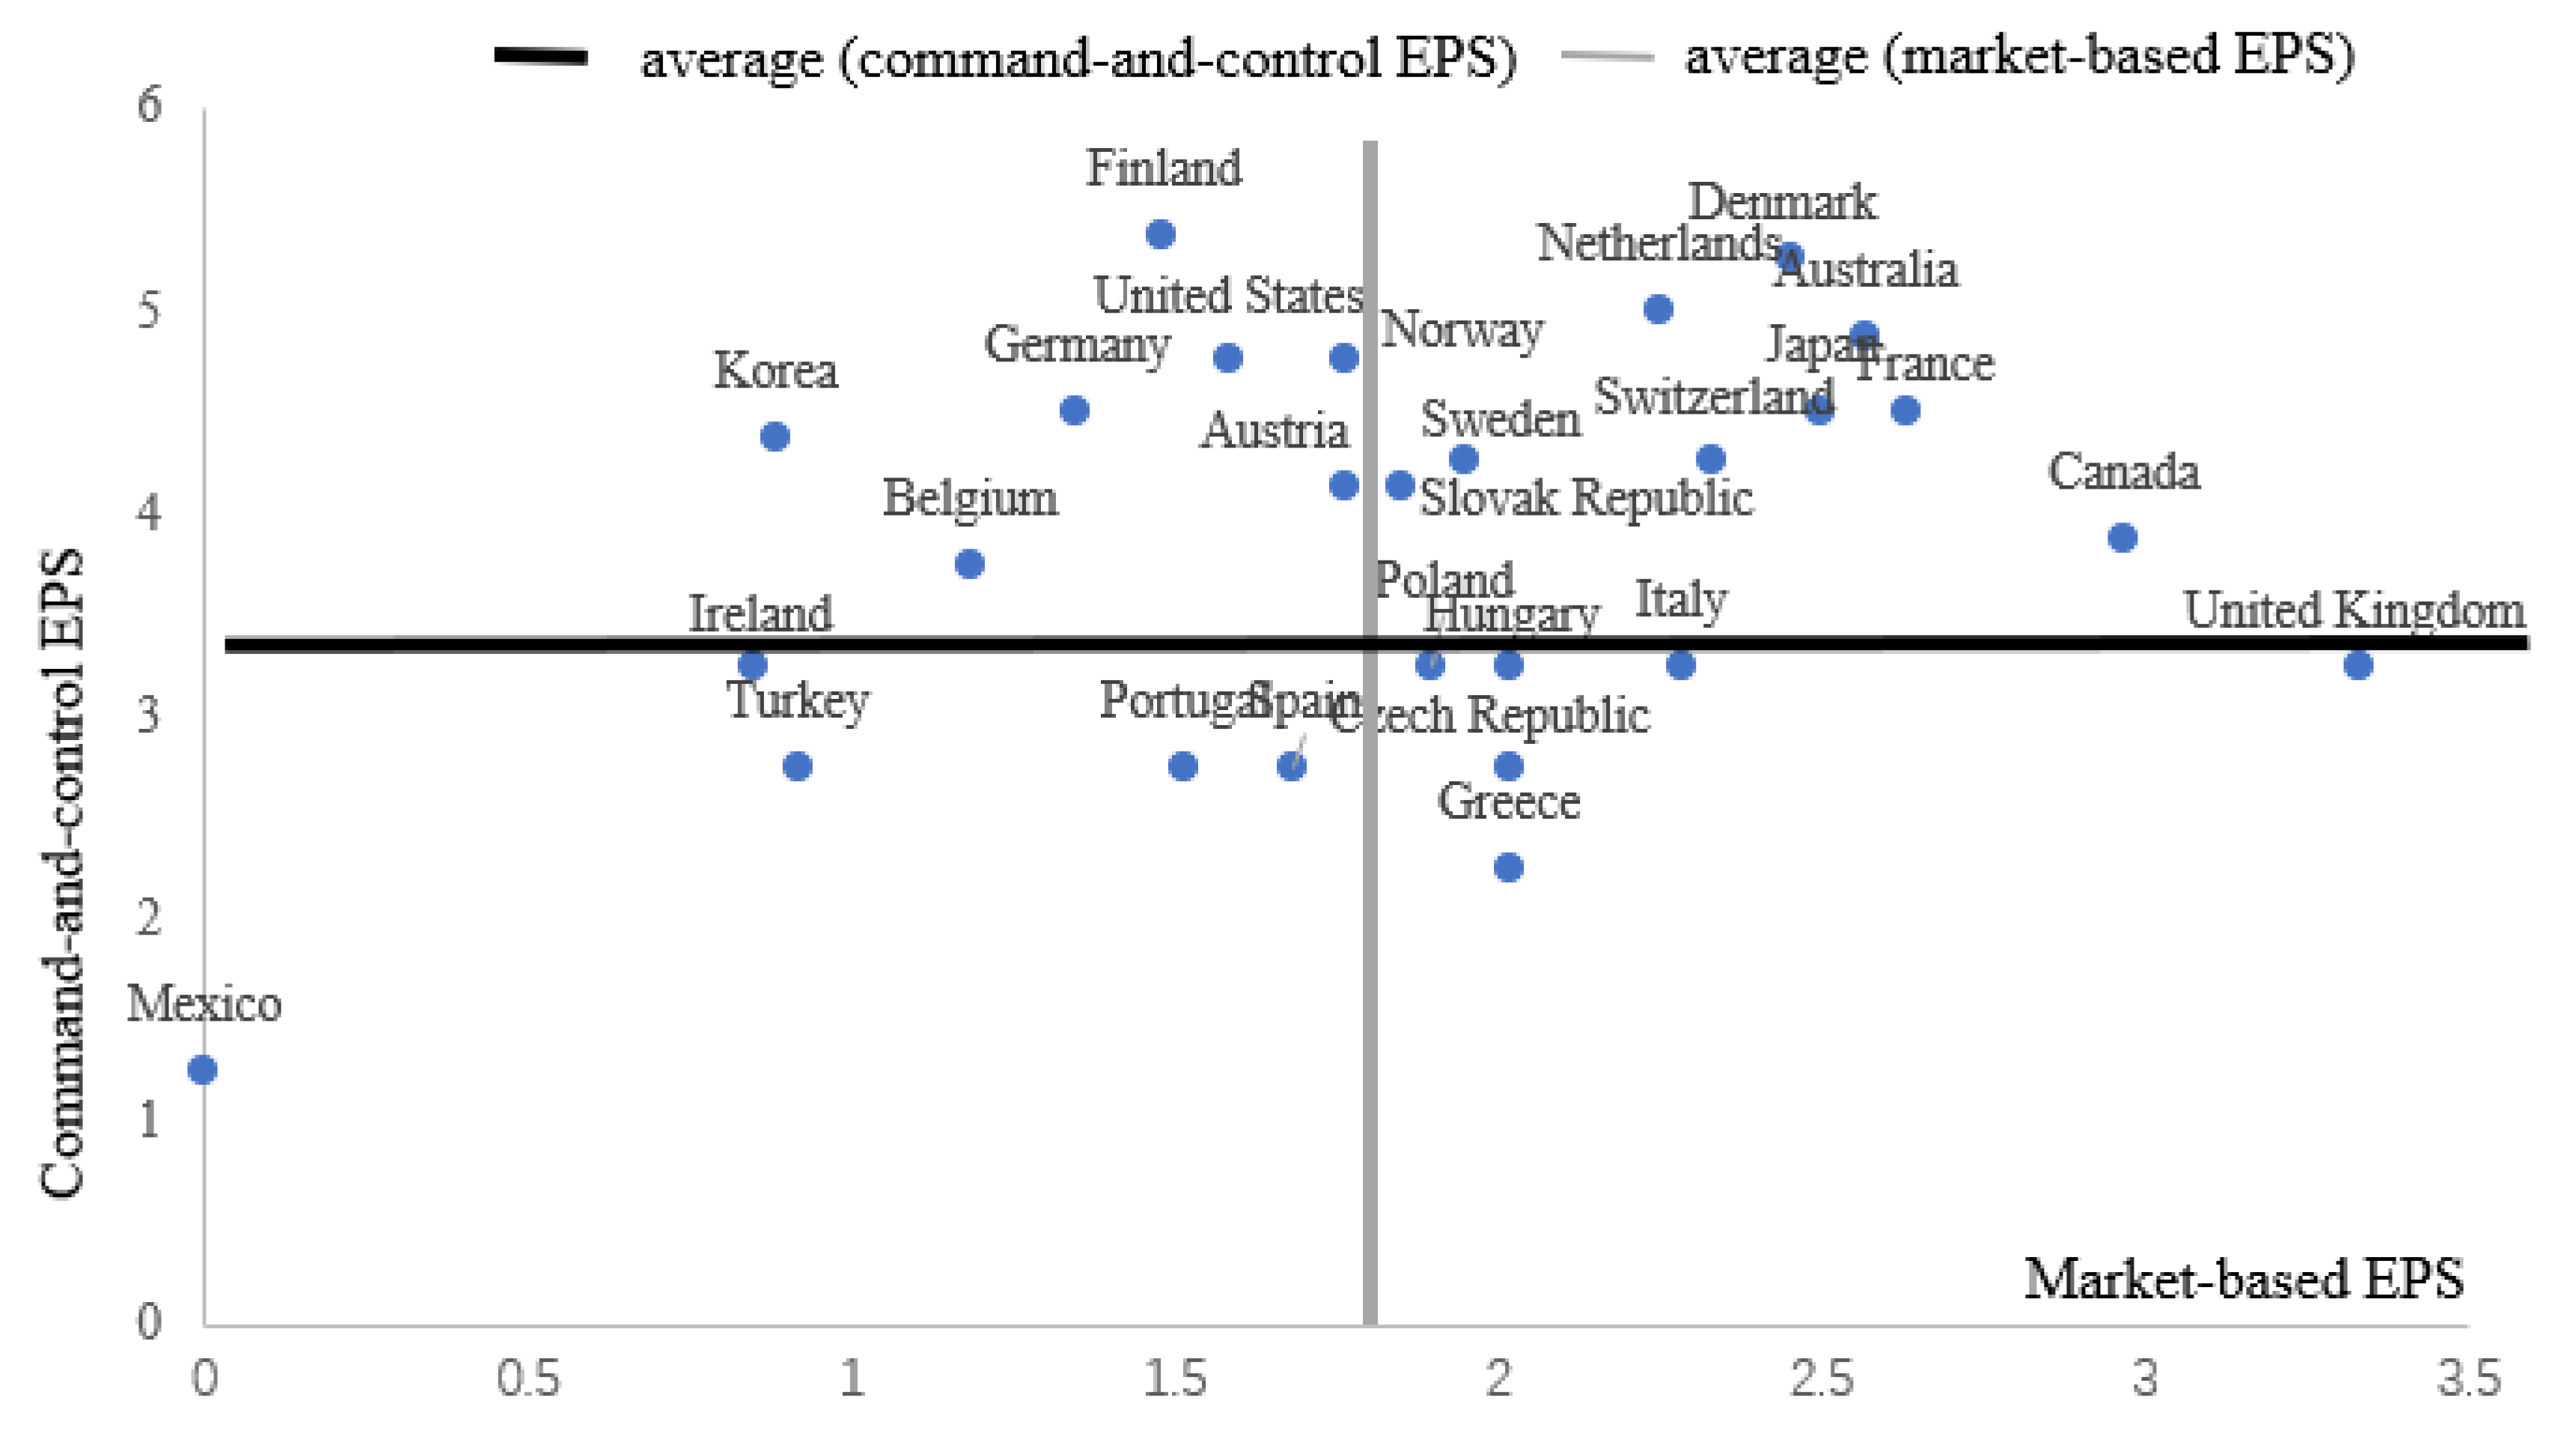
Figure 4.
The impacts and indirect effects of command-and-control regulations.

Figure 5.
The impacts and indirect effects of market-based regulations.

Table 1.
The indicators used in the composite index.
| Command-and-Control Environmental Regulations | Market-Based Environmental Regulations | |||||
|---|---|---|---|---|---|---|
| Instruments | Standards (0.5) | R&D (0.5) | Taxes (0.25) | Emissions trading schemes (0.25) | Feed-in Tariffs (0.25) | DRS (0.25) |
| Indicators | Emissions Limit: Nox SOx PMx Sulfur content Limit (Diesel) | Government R&D expenditure on renewable energy | CO2 NOx SOx Diesel | CO2 certificate Green (renewable energy) certificate White (Energy efficiency) certificate | Solar Wind | Deposit & Refund Scheme: waste |
Patent reflects t. Note: The numbers in parentheses represent the weights.
Table 2.
Variables’ definitions and specifications.
| Type | Variable | Notation | Specification |
|---|---|---|---|
| Dependent variable | GHG emissions | GHG | GHG emissions (metric tons) per capita |
| Independent variables | Command-and-control environmental regulations | CEPS | The command-and-control environmental policy stringency index |
| Market-based environmental regulations | MEPS | The market-based environmental policy stringency index | |
| Mediating variables | Technological progress: Energy efficiency | EE | The economic output of per unit energy consumption, in constant 2000 US$ |
| Energy consumption structure: Renewable energy consumption | REC | The proportion of renewable energy in total final energy consumption | |
| Control variables | Economic development | GDP | The real gross domestic product per capita, in constant 2000 US$ |
| Industrial value added | IS | The industrial value added (% of GDP) | |
| Export scale | ES | The exports of goods and services (% of GDP) |
Table 3.
Descriptive statistics of the variables.
| Variable | Unit | Mean | Min | Max | Std.dev |
|---|---|---|---|---|---|
| GHG | in metric tons per capita | 11.463 | 4.9 | 25.86 | 4.846 |
| CEPS | - | 3.277 | 1.25 | 5.5 | 0.981 |
| MEPS | - | 1.841 | 0 | 3.983 | 0.760 |
| EE | US dollar per 000 tons of oil equivalent | 24.534 | 6.911 | 223.032 | 38.764 |
| REC | % | 14.796 | 0.873 | 58.592 | 13.266 |
| GDP | 10,000 US dollar per capita | 3.945 | 1.627 | 6.304 | 1.174 |
| IS | % | 25.860 | 13.682 | 40.268 | 5.374 |
| ES | % | 99.928 | 1.748 | 765.691 | 154.864 |
Table 4.
The estimated results of command-and-control environmental regulations.
| Variables | Model 1 | Model 2 | Model 3 | Model 4 | ||||
|---|---|---|---|---|---|---|---|---|
| GHGt − 1 | 0.9203 *** (0.0111) | 0.9226 *** (0.0096) | 0.9103 *** (.0051) | 0.9208 *** (0.0188) | ||||
| CEPSt − 1 | −0.0533 *** (0.0184) | −0.0228 * (0.0127) | 0.2726 *** (0.0594) | 2.0995 *** (0.3741) | ||||
| CEPSt − 12 | −0.0446 *** (0.0081) | −0.2938 *** (0.0456) | ||||||
| GDP | 0.0047 (0.0491) | −0.1932 * (0.1076) | ||||||
| IS | 0.0389 *** (0.0065) | 0.0860 *** (0.0104) | ||||||
| ES | −0.0002 *** (0.0001) | 0.0002 (0.0002) | ||||||
| Constant | 0.8735 *** (0.1867) | −0.2538 (0.2129) | 0.4409 *** (0.1172) | −4.2521 *** (0.6313) | ||||
| Diagnostic tests | Statistic | p | Statistic | p | Statistic | p | Statistic | p |
| AR(1)test | −3.64 | 0.000 | −3.60 | 0.000 | −3.65 | 0.000 | −3.46 | 0.001 |
| AR(2)test | −0.24 | 0.811 | −0.29 | 0.770 | −0.21 | 0.835 | −0.11 | 0.913 |
| Hasen test | 26.50 | 0.741 | 21.69 | 0.865 | 26.31 | 0.391 | 23.93 | 0.732 |
Note: *, **, and *** denote that the coefficients are significant at the 10%, 5%, and 1% levels, separately. Standard errors are presented in parentheses.
Table 5.
The estimated results of market-based environmental regulations.
| Variables | Model 5 | Model 6 | Model 7 | Model 8 | ||||
|---|---|---|---|---|---|---|---|---|
| GHGt − 1 | 0.9515 *** (0.0027) | 0.9853 *** (0.0030) | 0.9604 *** (0.0015) | 0.9920 *** (0.0093) | ||||
| MEPSt − 1 | −0.0566 *** (0.0042) | −0.0219 ** (0.0091) | −1.1903 *** (0.1535) | −0.7042 *** (0.2254) | ||||
| MEPSt − 12 | 0.3437 *** (0.0457) | 0.2091 *** (0.0638) | ||||||
| GDP | −0.1053 *** (0.0216) | −0.1040 *** (0.0307) | ||||||
| IS | 0.0162 *** (0.0022) | 0.0175 *** (0.0038) | ||||||
| ES | −0.0011 *** (0.0001) | −0.0009 *** (0.0002) | ||||||
| Constant | 0.4487 *** (0.0343) | 0.1048 (0.1527) | 1.0728 *** (0.1153) | 0.4000 (0.3361) | ||||
| Diagnostic tests | Statistic | p | Statistic | p | Statistic | p | Statistic | p |
| AR(1)test | −3.64 | 0.000 | −3.66 | 0.000 | −3.48 | 0.001 | −3.61 | 0.000 |
| AR(2)test | −0.36 | 0.717 | −0.20 | 0.843 | −0.35 | 0.725 | −0.19 | 0.846 |
| Hasen test | 26.60 | 0.323 | 22.26 | 0.445 | 24.64 | 0.369 | 23.95 | 0.295 |
Note: *, **, and *** denote that the coefficients are significant at the 10%, 5%, and 1% levels, separately. Standard errors are presented in parentheses.
Table 6.
The indirect effects of command-and-control regulations.
| Variables | Model 9 | Model 10 | Model 11 | Model 12 | ||||
|---|---|---|---|---|---|---|---|---|
| EE | GHG | REC | GHG | |||||
| GHGt − 1 | 0.9639 *** (0.0057) | 0.9687 *** (0.0053) | ||||||
| CEPSt − 1 | 1.3121 *** (0.0458) | −0.0852 *** (0.0205) | −0.1286 ** (0.0634) | −0.0878 *** (0.0165) | ||||
| EEt − 1 | 1.0224 *** (0.0014) | |||||||
| EE | −0.0024 *** (0.0009) | |||||||
| RECt − 1 | 0.9044 *** (0.0140) | |||||||
| REC | −0.0034 ** (0.0014) | |||||||
| GDPpc | −1.1172 *** (0.0899) | −0.0255 (0.0610) | −1.2417 *** (0.1697) | −0.0065 (0.0203) | ||||
| IS | 0.1249 *** (0.0148) | −0.0114 (0.0101) | −0.3844 *** (0.0320) | 0.0178 *** (0.0017) | ||||
| ES | −0.0150 *** (0.0005) | −0.0003 ** (0.0001) | 0.0104 *** (0.0026) | −0.0002 *** (0.0001) | ||||
| Constant | −1.9584 *** (0.2619) | 0.9562 *** (0.2590) | 16.3247 *** (1.3331) | 0.0684 (0.1305) | ||||
| Diagnostic tests | Statistic | p | Statistic | p | Statistic | p | Statistic | p |
| AR(1)test | −3.62 | 0.000 | −3.64 | 0.000 | −2.73 | 0.006 | −3.66 | 0.000 |
| AR(2)test | −0.50 | 0.615 | −0.21 | 0.835 | −1.27 | 0.203 | −0.25 | 0.805 |
| Hasen test | 24.91 | 0.683 | 22.63 | 0.996 | 21.18 | 0.853 | 24.73 | 0.310 |
Note: *, **, and *** denote that the coefficients are significant at the 10%, 5%, and 1% levels, separately. Standard errors are presented in parentheses.
Table 7.
The indirect effects of market-based regulations.
| Variables | Model 13 | Model 14 | Model 15 | Model 16 | ||||
|---|---|---|---|---|---|---|---|---|
| EE | GHG | REC | GHG | |||||
| GHGt − 1 | 0.9690 *** (0.0032) | 0.9696 *** (0.0033) | ||||||
| MEPSt − 1 | 0.9221 *** (0.0865) | −0.0906 *** (0.0144) | 0.5643 *** (0.0676) | −0.0775 *** (0.0140) | ||||
| EEt−1 | 1.0115 *** (0.0007) | |||||||
| EE | −0.0005 (0.0004) | |||||||
| RECt−1 | 0.8953 *** (0.0202) | |||||||
| REC | −0.0033 ** (0.0015) | |||||||
| GDP | −0.5797 *** (0.0841) | −0.0207 ** (0.0103) | −1.4789 *** (0.1654) | −0.0371 *** (0.0132) | ||||
| IS | 0.0339 *** (0.0099) | 0.0112 *** (0.0018) | −0.3605 *** (0.0513) | 0.0147 *** (0.0010) | ||||
| ES | −0.0122 *** (0.0003) | −0.0004 *** (0.00003) | 0.0073 ** (0.0033) | −0.0004 *** (0.00002) | ||||
| Constant | 0.9009 *** (0.2825) | 0.1465 ** (0.0700) | 15.4325 *** (1.9817) | 0.1245 (0.0825) | ||||
| Diagnostic tests | Statistic | p | Statistic | p | Statistic | p | Statistic | p |
| AR(1)test | −3.64 | 0.000 | −3.65 | 0.000 | −2.82 | 0.005 | −3.65 | 0.000 |
| AR(2)test | −0.51 | 0.613 | −0.43 | 0.667 | −1.36 | 0.175 | −0.39 | 0.693 |
| Hasen test | 25.25 | 0.665 | 21.56 | 0.486 | 19.68 | 0.903 | 21.88 | 0.467 |
Note: *, **, and *** denote that the coefficients are significant at the 10%, 5%, and 1% levels, separately. Standard errors are presented in parentheses.
Publisher’s Note: MDPI stays neutral with regard to jurisdictional claims in published maps and institutional affiliations. |
© 2021 by the authors. Licensee MDPI, Basel, Switzerland. This article is an open access article distributed under the terms and conditions of the Creative Commons Attribution (CC BY) license (https://creativecommons.org/licenses/by/4.0/).
Share and Cite
MDPI and ACS Style
Guo, X.; Fu, L.; Sun, X. Can Environmental Regulations Promote Greenhouse Gas Abatement in OECD Countries? Command-and-Control vs. Market-Based Policies. Sustainability 2021, 13, 6913. https://doi.org/10.3390/su13126913
AMA Style
Guo X, Fu L, Sun X. Can Environmental Regulations Promote Greenhouse Gas Abatement in OECD Countries? Command-and-Control vs. Market-Based Policies. Sustainability. 2021; 13(12):6913. https://doi.org/10.3390/su13126913
Chicago/Turabian StyleGuo, Xu, Lin Fu, and Xiaohua Sun. 2021. "Can Environmental Regulations Promote Greenhouse Gas Abatement in OECD Countries? Command-and-Control vs. Market-Based Policies" Sustainability 13, no. 12: 6913. https://doi.org/10.3390/su13126913
Note that from the first issue of 2016, this journal uses article numbers instead of page numbers. See further details here.