Sustainability Assessment of Electricity Generation in Niger Using a Weighted Multi-Criteria Decision Approach


1
Institute for Technology and Resources Management in the Tropics and Subtropics, TH Köln, University of Applied Sciences, Betzdorfer Strasse 2, 50679 Cologne, Germany
2
Director Master Research Program Climate Change and Energy/WASCAL, Abdou Moumouni University of Niamey, Niamey BP 237/10896, Niger
*
Author to whom correspondence should be addressed.
Sustainability 2021, 13(1), 385; https://doi.org/10.3390/su13010385
Submission received: 9 November 2020
/
Revised: 28 December 2020
/
Accepted: 30 December 2020
/
Published: 4 January 2021
(This article belongs to the Special Issue Sustainable Development of Energy, Water and Environment Systems (SDEWES))
Abstract
:The majority of Niger’s population faces a widespread lack of access to electricity. Although the country lies in the Sahara belt, exploitation of solar energy is so far minimal. Due to ongoing fossil fuel exploration in the country, this fuel might dominate the future electricity supply. Today, Niger imports the most of its electricity from Nigeria. There is a need to expand electricity generation and supply infrastructures in Niger. When doing so, it is important to choose a proper set of electricity generation resource/technology that fulfils sustainability criteria. Thus, the objective of this work is to analyze a methodology in order to assess different energy technologies for Niger. A multi-criteria decision approach was selected to assess the most accessible energy system for the country. For this purpose, indicators were developed and weighted for ranking electricity generation options. Altogether 40 indicators are selected under six dimensions (availability, risk, technology, economics, environment and social) to assess eight different alternatives, considering the aggregated results and corresponding scores under each dimension. A merit list of technology and resources for electricity generation presented in this work could support the stakeholders in their decision-making for further projects implementation in the country.
1. Introduction
Nowadays energy sufficiency can be considered as a driver that promotes the development of a country. Energy supply has influence on the economic and social aspects as well as it influences positively or negatively the environment depending on the energy source and the efficiency of its life-cycle processes. It is known that energy is necessary to enhance human life quality. It is useful for multiple purposes like automation of processes or day to day activities [1] becoming an essential part of humans’ life. Energy poverty is considered as the lack of electric lightning to perform household activities after sunset [2], situation faced by the population of some developing countries with undeveloped and inadequate energy supply infrastructures.
Improvement of energy supply systems became a major concern to governments and decision makers in order to increase people’s life quality and enhance the development of their countries. In order to analyze alternatives to improve the energy supply, several sustainability-measuring methodologies analyzing the economic, environmental or social factors have been established. Those assessments are guided by short-term economic gains or long-term environmental and social effects [3]. In both cases they provide decision makers an overview of the different electricity generation technologies available for the country [4] with the common goal to reduce risks of inadequate investments. Since conventional sustainability dimensions (economic, environmental and social) are interlinked with cultural, political and/or technological factors, new multi-dimensional studies [5] were developed to include those factors as dimensions within the sustainability assessments. One of the most known methodologies for multi-dimensional assessment in the energy sector is the Multi Criteria Decision Analysis (MCDA), widely utilized in a range of applications such as combined cooling, heating and power systems [6], solar projects [7] and national scale application for the selection of the most suitable renewable energy system [8,9,10] for their energy supply market.
The scope and boundaries of MCDA studies are mainly based on dimensions and indicators, which could vary depending on the specificity of the study or the intended outcome. Some authors like Afgan and Carvalho [11] and Troldborg et al. [12] analyzed different energy systems using less than ten sustainable indicators based on qualitative data, which according to the authors, raised some uncertainties while analyzing the results. They recommended further specific analyses on specific topics to increase the reliability of the studies. Based on similar outcomes, Dorini et al. [13] directed its investigation on managing the uncertainty generated by the MCDA methodologies, recommending the increase of indicators under the different dimensions to obtain more reliable results. Finally as concluded by Singh et al. [14] the proper selection and classification of indicators within the MCDA methodology could ensure optimized and effective steps towards sustainability assessment. The specificity of the study could be based not only on the selected indicators, but also on the adequation of the assessment to the study area needs as shown by Štreimikiene et al. [8], who classified a total of 19 indicators divided among five different dimensions, selecting those by prioritizing study area needs to assess power generation technologies.
It is well known that case-specific parameters can influence the result while executing such analysis. In some MCDA studies, different weights are assigned to each analyzed dimension considering decision maker’s or stakeholder’s opinions [15]. Their decisions are based on the relevance of the dimension for the study area. There are different methodologies used for weighting of the required variables [16]. Some authors may use the indicators and weightage factors for the technologies [9], but in most of the cases authors weighted the dimensions [10] or more specifically the indicators [17]. In order to give a more specific approach of the methodology to the case study site requirements, the most commonly used methodology is the Analytical Hierarchy Process (AHP), considered as a structured technique dealing with complex decisions [18]. The comparison of different factors assigning statistically proven weights to the analyzed variables, reduce the uncertainties in the study. One of the main challenges while performing an MCDA study is to avoid personal judgment and biases of authors to decide for a specific technology. The inputs of independent professionals and/or experts [19] needs to be considered to increase the reliability of the results and avoid biases.
Nowadays more than 510 million inhabitants in the sub-Saharan African region face energy poverty, having no access to electricity and clean cooking energy sources, with an increasing tendency in the coming years [20]. This situation is also reflected in Niger, a country which has one of the highest annual population growth rates in the world at 3.8% (today’s population is approximately 24 million) [21]. This rapid population growth represents an increase in the energy demand not only to cover the residential requirements but also the industrialization of the country to ensure economic development. Currently the main drivers of Niger’s economy are the agricultural activities, representing 40% of the country’s gross domestic product (GDP) [22]. Despite having an economic growth of 6.3% in 2019, a significant percentage of the country’s population (41.4%) remains under extreme poverty [23], from which 83.5% live in rural areas. Furthermore, other challenges faced by the country are frequent droughts that affect agricultural production. Another major challenge in Niger is the access to clean and modern energy sources for heat or electricity supply. This situation could be noticed at the country’s high dependency on biomass (mainly for cooking), which represents more than the 77% of the country’s energy demand. This is followed by oil (for electricity and transportation) at 22% and coal at 3%, which is used mostly for electricity generation. By 2018 Niger had an installed capacity of 284 MW, mostly diesel generators (from NIGELEC) and coal-fired power plants (from SONICHAR) [24]. Since the electricity generated is lower than the current demand, Niger imports more than 70% of its electricity from Nigeria, representing a very high dependency from the neighboring country. Due to its limited electricity distribution system, which covers only 54.3% in urban areas and 5.4% in rural areas [25], and with the most of the population living in rural areas, it can be implied that around 70% of the population has no access to electricity in the country. These problems need to be solved with future massive electrification projects, by developing both power plants and grid infrastructure.
The main objective of this study is to support in decision making by selecting the best suitable electricity generation technologies among the different available options in Niger using the MCDA methodology. This study’s scope is limited to an assessment of the country’s energy situation, more specifically electricity supply. Due to the complex interlinkage with the current electricity generation technologies, other relevant aspects in a sustainability analysis that are necessary for the country’s overall development, such as water and food security, are excluded from the assessment. This water-energy-food supply nexus research shall be a separate analysis on its own, rather than a sub-theme within this paper’s scope.
In order to develop the sustainability rank of electricity generation technologies, a specific set of indicators has been selected based on pre-defined dimensions. Those indicators are assessed, scored, normalized and weighted based on relevance criteria, considering inputs from independent experts and stakeholders in an attempt to reduce the author’s or respondent’s bias in the analysis. Using the outcomes of reviewed studies as a basis, an appropriate methodology is adapted for Niger’s situation.
2. Materials and Methods
The MCDA methodology was selected based on literature review related to energy planning system analytical tools, which offers investigators the possibility to systematically categorize and rank available alternatives considering the best suitable criteria for a specific place [26] based on indicator analysis. It is considered as a simple tool that provides solutions to problems involving conflicting and multiple objectives [27] by categorizing and obtaining a final quantitative index for each alternative analyzed [28]. Within the energy management studies, MCDA has been widely used to perform analysis of electricity supply or power generation, proving its versatility by providing different assessment alternatives [29] adjusted to authors’ expected results. Singh et al. [14], Shaaban et al. [30], Stamford and Azapagic [31] and Stein [10] utilized the MCDA methodology to develop an analysis of different energy sources available on their case study’s locations considering renewable and conventional sources.
In this work, an individual generation technology approach was conducted based on the inherent economic, social, environmental and technical performance of each technology. In addition, the potential risks caused by/to local specific situation, the overall availability of the technology including its resources and energy access, national policies were considered to identify the best suitable alternative among non-renewable and renewable energy technologies for the expansion of Niger’s electricity supply sector.
A set of 40 indicators was selected and distributed among six unequally weighted dimensions. Those indicators were used to analyze the performance of eight different electricity generation technologies, which are coal (lignite and hard coal), natural gas and oil power plants, solar photovoltaic system, wind turbines and hydropower plants (run-of-river and dam).
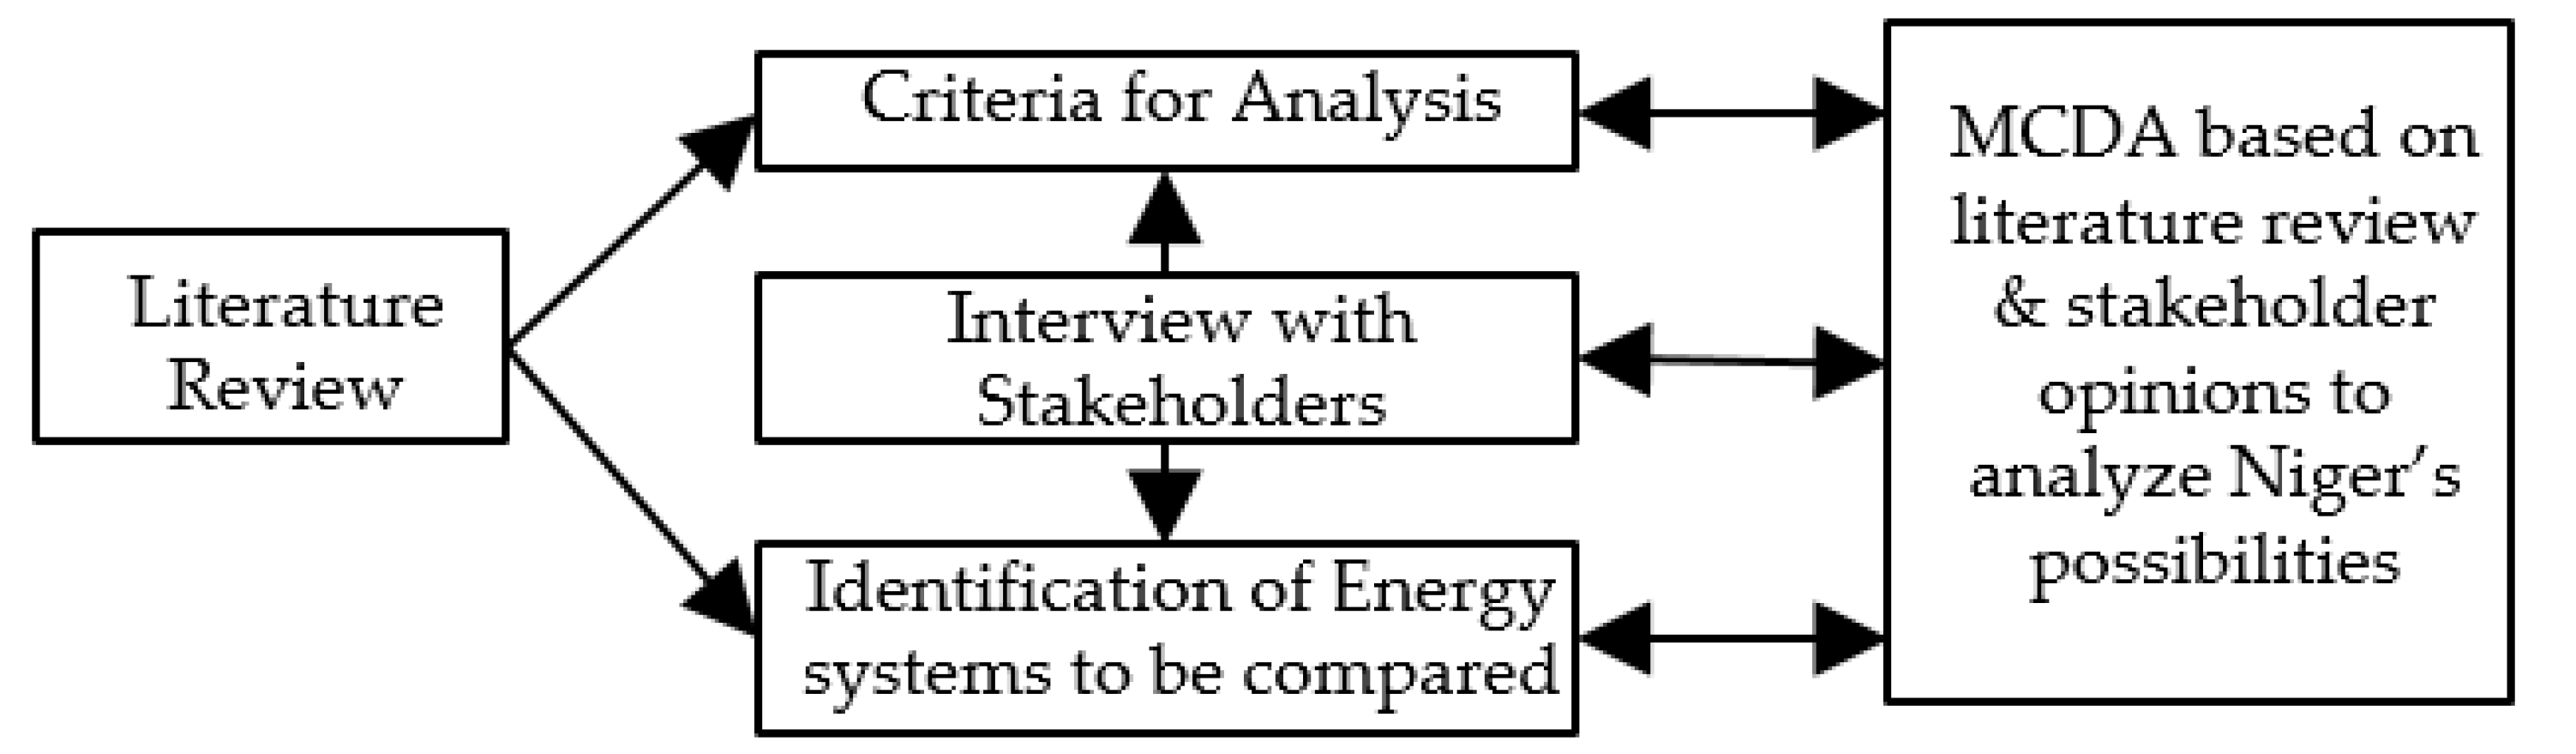
In brief, three steps (Figure 1) were followed to fulfill the objectives of this study. First, based on a resource availability, a quick overview of the abovementioned electricity generation technologies that can be potentially implemented in Niger was made. Second, site visit to Niger was carried out and interviews with experts and stakeholders were conducted in order to determine the best suitable set of indicators, to analyze the selected technologies and to adapt the analyzed dimensions to Niger’s reality. Third, through an analytical hierarchy process, each dimension and indicator received a specific weight to calculate the overall final score.
2.1. Data Gathering: Identification of Available Resources and Interviews
The first step was to compile a resource assessment study on the available energy sources based on literature information, field data observation and expert interviews in Niger. Furthermore, some indicators required empirical experience due to their complexity and specificity. The authors conducted interviews with stakeholders with experience not only on Niger’s energy sector, but also in other fields such as local infrastructure, social and environmental issues, energy market, etc. through a questionnaire divided in two parts. On its first part, the stakeholders’ perception on the performance of specific indicators related to social, institutional and educational aspects was requested in order to gather site specific data. The second part was related to the country sustainability performance and study’s dimensions to avoid author’s bias during weighting processes.
Furthermore, to define the final set of indicators for this study a three-step procedure was followed. Firstly, it started with compiling a raw list of indicators obtained from literature review, which was filtered based on the criteria that indicators should be objective and there are no duplications. Secondly, a multi-stakeholder assessment was made with professionals selected from different fields of expertise to develop an assessment of the pre-filtered list in order to obtain the most suitable set for this study, which was helpful to reduce the bias.
2.2. Selection of Technologies to be Assessed
Before making the selection of electricity generation technologies, a theoretical resource assessment based on literature review and stakeholders’ interviews was conducted, in which the authors identified the resources available on site (Table 1).
As shown in Table 1, at least one electricity generation technology was selected for each of the resources available in Niger. Furthermore, in order to narrow the scope of the assessment, a preliminary analysis based on literature review and stakeholders’ inputs was conducted in order to decide which technologies to include for further analysis. Considering factors such as technology maturity, cost of electricity generation, policy framework, a deeper resource assessment and site available facilities for the development and use of the energy source, only eight out of 11 identified technologies were considered in further analysis. Those are—LG: lignite, HC: hard coal, HO: mineral oil, NG: natural gas, PV: photovoltaics, HD: dam hydro, HR: run of river hydro, WE: wind energy.
Nuclear power plant is excluded as an alternative during the assessment of electricity generation technologies. This decision was based on the conclusions of the report on integrated nuclear infrastructure review (INIR) in Niger [39] developed by the International Atomic Energy Agency (IAEA), in which the agency mentions a list of barriers and limitations faced by the country. Among those factors; policy framework, implementation cost and skilled human resource were considered as the most challenging ones for the development of nuclear power plants in Niger. Also, the nuclear safety issue is a big concern.
Based on the outcomes of the studies carried out in other developing countries like Nigeria [40], Pakistan [41], Lebanon [42] and deeper analysis in the Middle East and North Africa (MENA) region [43], concentrating solar power (CSP) systems were not selected for further analysis due to its high levelized cost of electricity (LCOE) at 0.15 €/kWh compared to solar PV systems at 0.057 €/kWh [44]. Although it offers some advantages (e.g., large scale storage possibilities) over solar PV systems, its current global market is not encouraging, and it presents future price risks for the implementation of this alternative in Niger.
Also, biogas plant for electricity generation was not further considered within the analysis because the waste obtained from agricultural activities in the country is not sufficient for biogas production for electricity. Although domestic size biogas plants could prove promising for cooking energy supply, commercial plants for electricity generation are quite expensive for the small sizes plants [44]. For the cost competitiveness reason, organic waste to biogas option is also excluded. The waste collection system of the country in major cities (e.g., Niamey) is not efficient, only less than 30% of the waste is collected there. Such collection systems in rural areas are almost not existing [45]. A simplified process of the selected electricity generation technologies is shown in Figure 2.
2.3. Definition of Indicators and Dimensions
Since the study seeks to identify the best suitable technology considering the country’s current situation, including the reduction of potential negative impacts on society and environment, six different unequally weighted dimensions were selected (Figure 3). Among those dimensions three (Economic, Environmental and Social) were based on the sustainability pillars, one (Technical) was selected to evaluate the technological performance of the alternatives to be assessed and two (Availability and Risk) were selected to consider historical and future challenges regarding the development of the technologies. Each dimension received a different weight based on the local site-specific situation and considering stakeholders inputs.
In order to conduct the analysis a set of indicators were developed and organized among the chosen dimensions. Establishing a useful set of indicators depends mainly on the intended objective and should be highly related to the specific field of interest. Furthermore, since there is no objective methodology to define a specific set of indicators for similar studies, they are selected subjective.
2.3.1. Weighting of Dimensions and Indicators
Widely utilized as a method in different studies for evaluating complex multi-criteria decision-making problems, the analytical hierarchy process allows the user to analyze different criteria to decide the adequate weight of importance [10] for each of the analyzed alternatives. To conduct the analytical hierarchy process (AHP), a three steps approach needs to be followed considering the problem decomposition, pair-wise comparison and synthesizing the result [30]. Problem decomposition was considered as simply the energy situation in Niger (Figure 3), as described in the previous section.
Step 1. Completion of the pairwise comparison matrix: During this step, the pairwise comparisons need to be organized into an n x n matrix:
where Cxz is the pairwise comparison rating for the Xth and Pth criteria. In order to create the matrix, the values of the compared criteria need to be entered line by line in a square matrix, in which the diagonal of the matrix contains only values of one.
The criterion of the column needs to be compared with its pairwise in the different rows [30], in which if the value obtained from the comparison AB is equal to n, the pairwise comparison BA should be equal to 1/n as shown in matrix 2.
Once the criteria are filled into the matrix, the next step is to conduct the pair-wise comparison, using a nine-point evaluation scale [10], in which the values from 1 to 9 (Table 2) are considered to compare the importance of one criterion relative to its pairwise.
Step 2. Calculating the individual criteria weights. The next step is to calculate the individual criteria weights, firstly by normalizing n x n comparison matrix (Cnorm = ) where each value Cxz in the matrix C is divided by the sum of its Xth column as expressed in Equation (3):
so, the Xth criterion weight will be calculated as stated in Equation (4):
Once each of the criterion weights are calculated, the largest eigenvalue of C (Equation (5)) needs to be calculated in order to have all the required input calculations for starting the validation process:
where λmax is the largest eigenvalue of C and W is a vector of criterion weights.
Step 3. Validation process. To ensure the statistical consistency of the pairwise comparison, the consistency ratio needs to be calculated, in which the value should be less than 0.10 in order to show a statistical consistency [46]. The consistency ratio can be defined by Equation (6) as follows:
where CI is the consistency index, expressed by the following Equation (7):
and RI is Random Index, which is the consistency index of a randomly generated pairwise comparison matrix, depending on the number of criteria (Table 3) being compared.
2.3.2. Indicators Criteria and Normalization
The main objective of sustainability indicators, as mentioned by Liu [16], is “to provide a comprehensive and highly scalable information-driven architecture of sustainable assessment” in order to facilitate the accomplishment of the study. Indicators should be selected considering the following criteria [48]: Simple to understand and apply, transparent and intersubjective, robust, comprehensive and fair.
The analysis of sustainable indicators becomes more challenging while covering various dimensions [14] due to the fact that each dimension or indicator within the dimension is followed by data which is generated or obtained in certain format, making it difficult for the aggregation into a single score. Nevertheless, the min–max normalization (Equations (8) and (9)) methodology was applied to the obtained result of quantitative indicators, to facilitate its aggregation, within the dimension and to have comparable results.
The normalization process converts the raw indicator data into a common unit [49] in order to make them comparable and addable. For indicators where the benefit criteria [50] or the higher value represent a more favorable result, the normalization equation would be as following:
where, Min(x) and Max(x) are respectively the lowest and highest value obtained in the selected quantitative indicator, in which the greater benefit is represented by the highest value, e. g. efficiency, load factor, lifetime, capacity factor.
On the other hand, if the cost of the indicator was represented by the highest value [50], the normalization equation takes the following form:
The results of indicators that were obtained through a qualitative analysis will receive a score from 0.2–1.0, which will linearly increase or decrease (1.0–0.2), considering the cost or benefits of the indicators. For cases in which the desired information could not be gathered, due to lack of information, a value of zero “0” was assigned to the corresponding indicator, not considering this value in the calculation of the score, to avoid losing consistency during the assessment.
Once normalized, the previously obtained indicator weight (Table 4) is used in order to adapt it to the case study reality and situation. Indicators are aggregated within the dimensions and once the score of the dimension is obtained, a final weighting is applied.
3. Results and Discussions
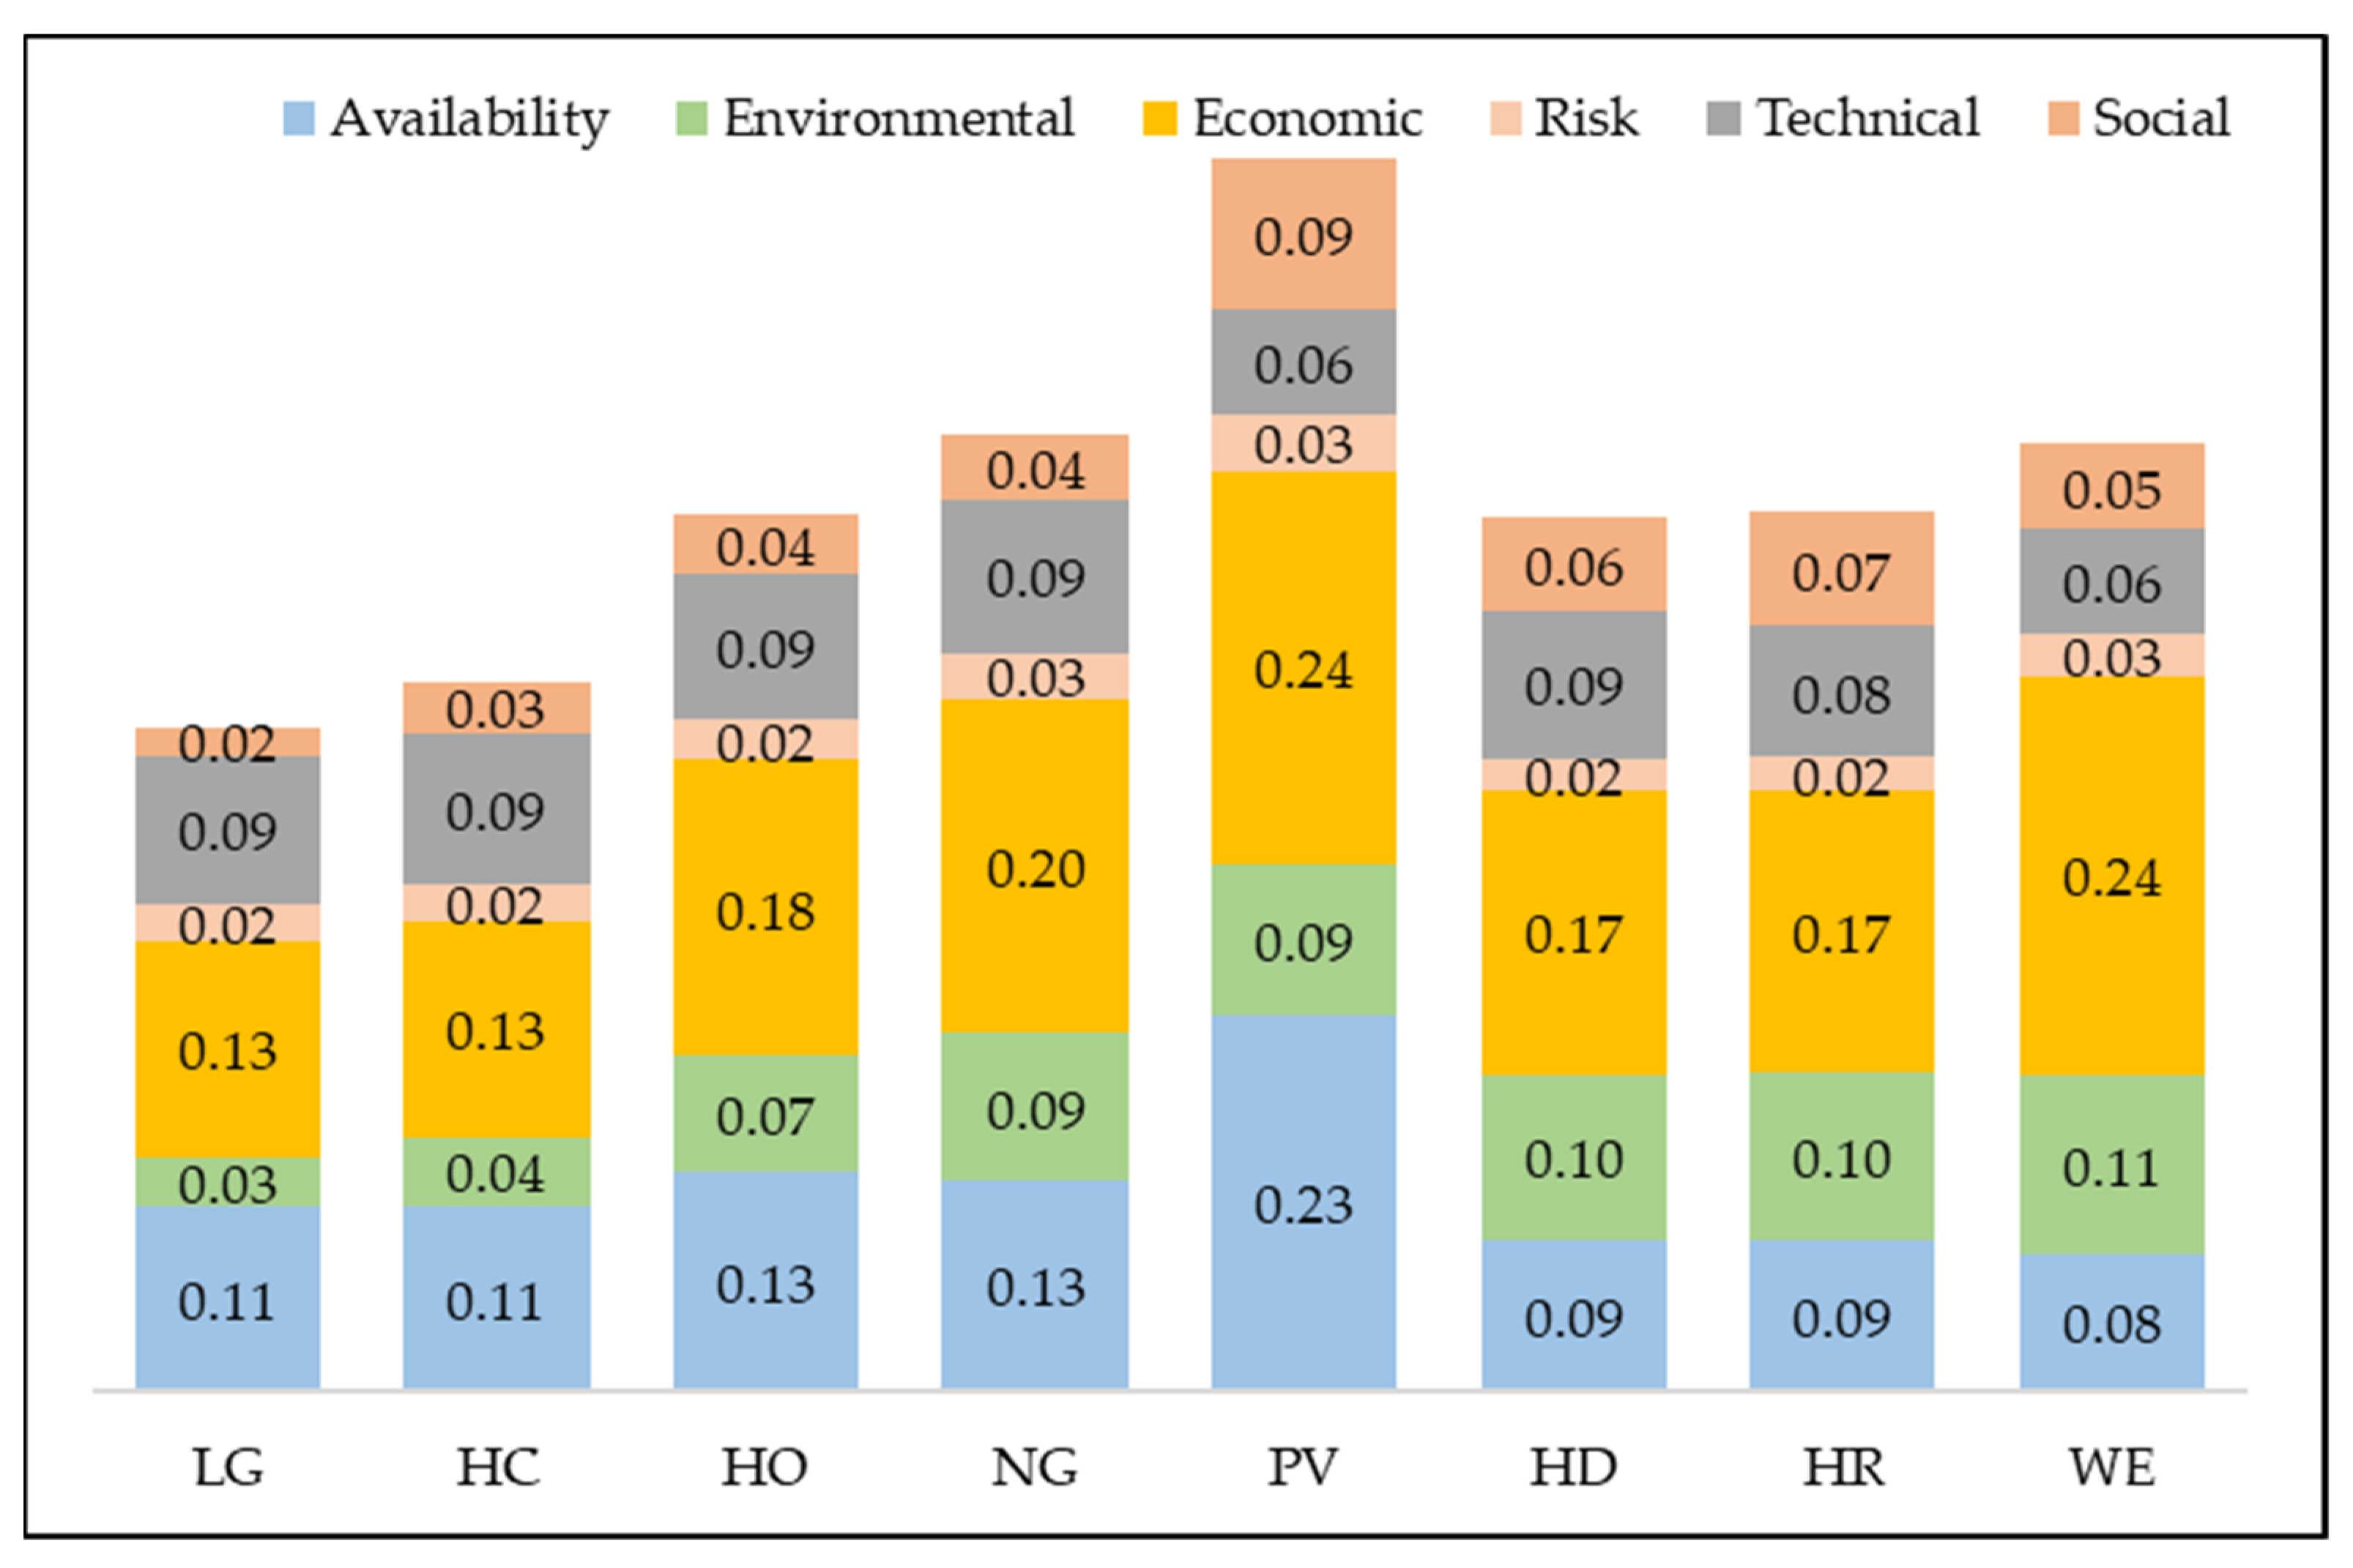
Once the indicators were selected (Appendix A), data was gathered (Table 5) and analyzed, the next step was to normalize its values and proceed with the weighting of those, considering the assigned value (Table 4) and finally apply the dimension weights on the assessment. Figure 4 shows the compiled results as a whole summary. In the following sections, individual dimensions are presented.
3.1. Availability Dimension
Based on its national scale availability, and in comparison, to other renewable and non-renewable energy systems, utility scale photovoltaics (PV) obtained by far the highest score (Figure 5) within this dimension. In second place are oil (HO) and natural gas power plants (NG). The country’s political lobbies are already working on the development and use of those sources for commercial and energy supply purposes, showing a preference on those sources. Wind energy was the alternative, which presented disadvantages for its development while assessing this dimension, the major contributors being the lack of countrywide resource [48] and social and institutional barriers. Technologies like LG, HC, HD and HR obtained average scores based on the political willingness to invest on any source that could improve the current Niger’s energy situation.
Niger could be considered as a resource rich country, which possess not only an abundance of mineral and fossils energy resources like coal, uranium and oil and gas [32,33,34,37], but also other minerals like silica, base metals and magnesium, among others [52] which could be used as raw materials for the fabrication and manufacturing of components for building energy facilities. Furthermore, as a sub-Saharan country, solar radiation [34,36,37] is a very promising energy source in almost the full extension of the country. Other renewable resources like wind and hydropower [34,36] do not have similar presence as solar radiation, but still could be used as alternatives for decentralized energy systems if technologies are developed in isolated areas. Hydropower potential could only be exploited in the south-west region of the country, where the Niger River is located. However, the water flow data for this river shows that the river could even dry up in some sections in the dry season. Therefore, it is not a reliable energy production option there. Furthermore, building larger dams to collect the water would affect the downstream ecosystem in the river. Due to climate change effects, more droughts and even greater flow reductions are expected in the future.
Regarding oil and gas as available resources, currently the country is producing 20,000 bbl/d of refined gasoline, from which 1/3 covers the local demand and the rest is exported to neighboring countries. The country also produces about 44,000 t/y of LPG, which is dedicated to the local consumption [54]. Both resources have the potential to increase the production based on local reserves and political decisions made by the local government in the past years. This could increase the attractiveness of those resources for electricity generation.
Niger’s marginal economy, heavily affected by international prices, is one of the major issues that hinders the industrialization of the country. Moreover, since poverty margins in Niger are around 43% (including energy poverty) political barriers or social disconformity with the development of alternatives are factors that ease the access of new investments or technologies in order to accelerate the country’s development. Based on the previous analysis and the importance of an integral availability locally, this dimension (AVI) together with Economic (ECO), represented more than the 50% of the assessment weight. The technologies’ social acceptance (AVI6) varied depending on how familiarized the society was with the technology and the population’s environmental conscience [55], not only guided by belief in some cases but also by knowledge. Since solar PV has presence in Niger since late 90s and it is considered as an excellent alternative to supply electricity even at small-scale systems for households, this technology achieved the highest acceptance (Figure 6).
3.2. Economic Dimension
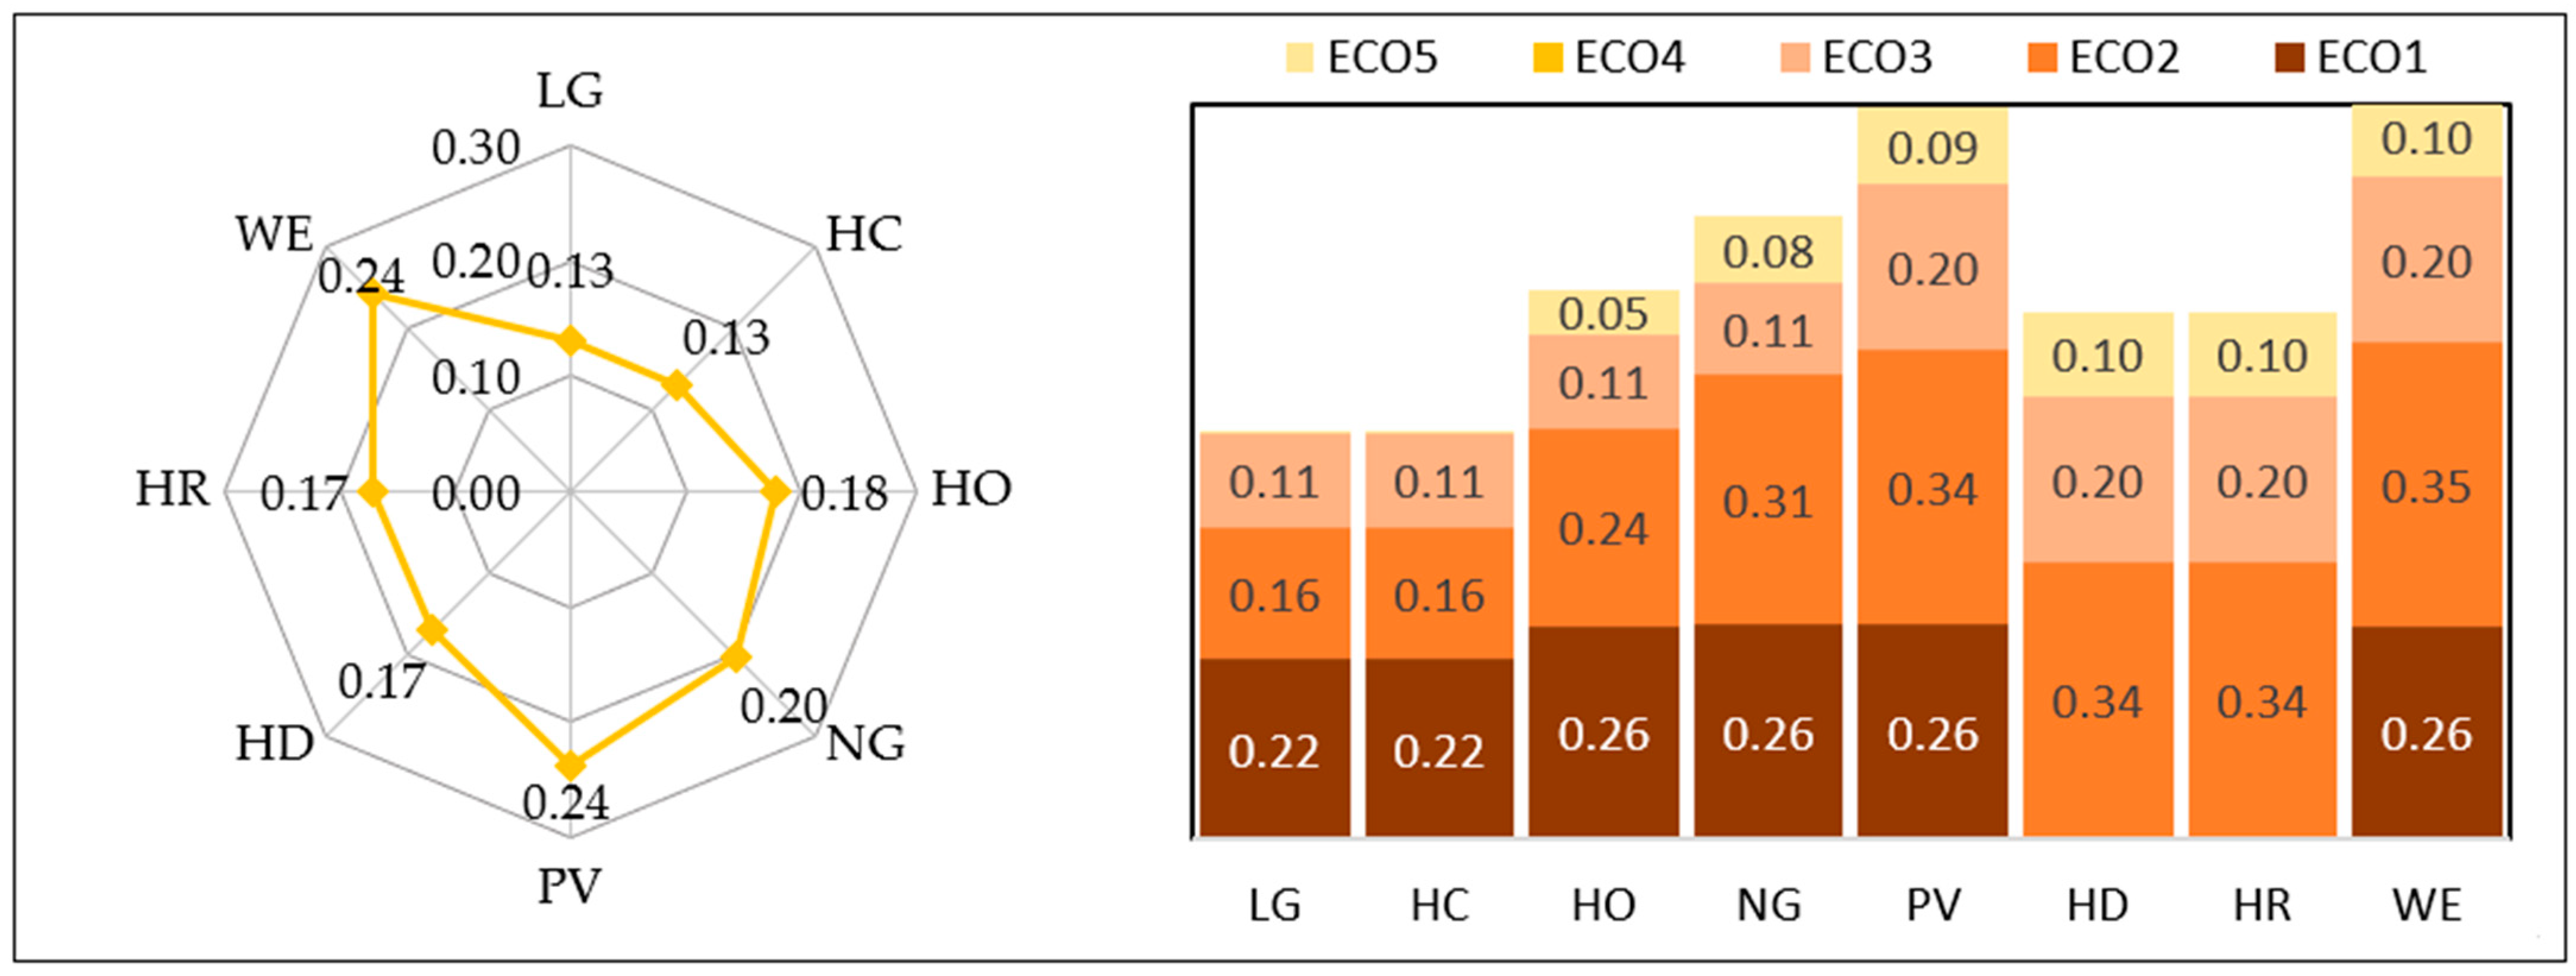
Non-conventional electricity generation technologies like utility scale PV and wind turbines (WE) are considered not only worldwide [53], but also in African countries like Madagascar [56] and Nigeria [57] as the most economically affordable technologies for electricity generation (Figure 6). Its low LCOE (ECO2) as well as its investment (ECO1) and O&M (ECO3) costs are factors that promote the constant increase of its presence worldwide [58] as power sources, having also the advantage of reduced impacts to human health (ECO5). Due to the maturity of the technology and affordable investment costs, natural gas power plant (NG) and mineral oil power plants (HO) scored as third and fourth economical alternatives. The major advantage of those fossil fuels over renewables are reliability of energy supply, but at a very high O&M costs (ECO3) [59], situation which could jeopardize the economic development of the country if economic difficulties are faced. High investment (ECO1) costs left hydropower technologies in the fifth place of the assessment, and also in countries with scarce water resources as Niger, hydropower is not a suitable alternative [3,30], due to the competition of this technology with other water usage purposes. Other conventional electricity generation technologies like coal power plants (LG & HC) obtained the second lowest and the lowest scores, due to the high LCOE (ECO2), investment (ECO1), O&M (ECO3) and social (ECO5) costs [30], representing non-suitable alternatives that are reducing its presence worldwide [58] and not considered as viable alternatives for developing countries.
Like most of the developing countries [60], Niger’s biggest challenge is how to drive economic growth and cover essential services of its inhabitants considering its developing and challenging economic situation. Moreover, regarding to the three sustainability pillars, economic dimension is the major challenge that developing countries faces in the path of sustainable development [61], mostly related to the elevated costs of clean technologies, which could be considered as alternatives that promotes sustainability. Several studies have been conducted on sustainable assessment of energy systems in developing countries, from which, a vast majority prioritized the economic factor, over the social or environmental. In studies conducted in countries like Nigeria [57] or Cuba [62], the authors remarked the positive impacts of energy development through a progress in local GDP. Based on this statement, which was also supported by stakeholders and energy experts in Niger, economic dimension needs to be considered as a major driver to improve the electricity market in the country.
Levelized cost of electricity (ECO2), obtained the highest score on the economic dimension weighting process of indicators, based on the fact that providing electricity at acceptable generation costs could be translated in affordable prices for the population [57]. Moreover, in some countries [3], LCOE is understood as a crucial aspect which could curb or promote local economy, considering the fact that high electricity generation costs for countries with high poverty rate, could be translated in subsiding electricity costs covered by local governments to reach affordable prices to society jeopardizing the country’s development. Due to the previously mentioned high availability of solar resources in Niger, coupled with the maturity of the electricity generation technology in global market [56,57], utility scale solar PV obtained the best LCOE (ECO1) score.
Natural gas power plants (NG) are mature fossil fuel driven technologies with the lowest social costs, while compared to the other fossil fuels driven power plants. Moreover, its tolerable impacts on human health (ECO5) and acceptable environmental costs [63], placed this energy system on the highest position. Since its expansion translates into higher overall costs [55], the share of electricity generated by this source should be measured according to the availability of resources in the country, to avoid imports and future supply complications.
Due to its decent performance on ECO1–ECO3 indicators and very high performance on ECO5, reducing social costs almost at the minimum, WE could be considered in Niger as decentralized systems only for some regions with promising wind speeds [36], in order to reduce potential increase of initial costs generated by the expansion of the country’s transmission grid coverage.
3.3. Technical Dimension
As expected, and commonly assessed in other studies [3,30], fossil fuels driven power plants like coal (LG & HC), oil (HO) and natural gas (NG) together with hydropower dams (HD) scored better results under this dimension (Figure 7), showing the stability, reliability and maturity of those technologies. Low energy generation stability and high dependency on weather conditions [64] were the main drivers that placed renewable energy systems like solar PV and wind turbines (WE) at the bottom.
Niger’s electricity generation infrastructure is underdeveloped and has not only reliability but also high losses issues. It is internationally known that a mature technology could represent, in most cases, a better cost-efficiency option [65]. Based on other studies’ perception (e.g., [30]) and experts’ inputs, technology dimension was scored with a higher preference over environmental dimension. A total of 10 indicators were selected for this dimension, from which three subgroups were created, clustering the indicators in high (>0.18), medium (0.10–0.11) and low (<0.05) importance (Table 4). As in other studies [30,31], reliability of energy supply (TECH4), capacity factor (TECH3) and full load hours (TECH7) were considered as the most significant indicators.
Considered as medium impact indicators, energy efficiency of energy source (TECH1), time to plant start-up from start of construction (TECH6) and potential for upgrading/expansion (TECH8) represents desirable factors that the energy systems should possess in order to promptly increase the electricity generation share produced locally in the country. Vulnerability of system efficiency (TECH9), level of energy service (TECH10) and lifetime of electricity production facility (TECH2) were considered as future potential factors to analyze once the electricity market is already stable and further benefits or alternatives are considered.
Considered as the most important indicator within TECH dimension, the reliability of energy supply (TECH4) provides information on how reliable the energy source could be once the operations starts. As internationally and historically recognized [3,30], non-renewable energy systems showed higher reliability in comparison to renewable sources, representing those alternatives a more suitable option if only technology aspects were considered.
3.4. Social Dimension
Since the analysis of the social dimension is mostly based on benefits related to economic and energy access issues, solar PV obtained the highest score in all the indicators (Figure 8). This is not only considered as the most socially acceptable technology in the present study, but also by similar studies on developing and developed countries [31,48,63], where the assessment of energy systems, was created with similar scopes. Reaching the second and third highest scores hydropower and wind turbines also could be considered as socially well accepted. Fossil fuel-based electricity systems [31,63], achieved the lowest scores within this dimension mostly caused by their high impacts on society’s health, representing a reduced contribution to sustainable development.
Social dimension was considered with the third lowest score (Table 4) in the dimensions’ weighting, as supported by experts and stakeholders according to the interviews’ results. It was based on the facts that to improve the life quality of the inhabitants, electricity access should be prioritized and by increasing local electricity generation more job sources could also be created, as in many developing and developed countries [66], causing a positive impact in the economy as well.
Furthermore, Niger faces two major challenges related to poverty and energy poverty, for instance, two of the most influencing indicators were contribution to local economy by jobs creation (SOC5) and economic advancement through energy generation (SOC3). In order to look as well for potential economic benefits for the inhabitants, the indicator SOC3 was considered as a driver to benefit the society with the energy access. Nevertheless, since Niger allows grid connection of small-scale energy systems, this indicator considers future benefits to the population, through own electricity generation.
Since Solar PV is a technology already available in Niger’s market for a couple of years, inhabitant’s expertise is considered as adequate to develop the technology according to experts and stakeholders. Due to the affordable international prices, easiness of installation and high flexibility [58,67] at small and bigger scales, PV achieved a very high score within the SOC3 indicator. People displacement (SOC1) and human health damage (SOC4) are interlinked indicators. Most of the technologies that drive to social displacement are mostly related to human health and well-being factors, fossil fuel based (coal, oil and gas) electricity generation technologies [63] and hydropower dams [68] represent the highest impacts to society due to the harms and side effects that those plants could cause.
3.5. Environmental Dimension
Since the information gathered for this dimension was based mostly on literature review of international environmental performance for the different alternatives, adjusted through indicators’ weight, renewable energy technologies showed the best performance (Figure 9), matching to studies with similar scopes [30,69]. Fossil fuels power plant like coal (HC & LG) and oil (HO) obtained the lowest scores considering the major drawback as GHG emissions (ENV1) and water depletion (ENV6) [26,70]. On the other hand, natural gas power plant (NG) showed an outstanding performance among the fossil fuels mostly related to its reduced water consumption (ENV6) and less emissions (ENV1).
Niger’s highest environmental impacts are related to deforestation, soil erosion and water depletion caused by inefficient resource management practices like extension of agricultural land use and use of wood as fuel for heat production. By developing electricity generation technologies more efficient practices could be implemented and if necessary, the use of electricity for cooking could be an alternative to firewood. The environmental dimension was placed with the second lowest score, close to social, based on the argument that Niger needs to strength firstly its economy and increase the life quality of its inhabitants. Furthermore, Niger’s installed capacity is mostly powered by coal-fired (lignite and hard coal) and diesel power plants [11,34,36], meaning that any new technology implemented in the country could improve their environmental performance in electricity generation, as the country is currently using the alternatives that pollute the most.
Studies on developing countries [26], which considered water depletion (ENV6) as an indicator, showed a strong influence of this indicator within its weighting assessment. Since one of the biggest environmental and social issues for Niger is the lack of fresh water, the conservation and protection of this resource should be considered as a priority while assessing the electricity generation systems. Regarding GHG emissions (ENV1), the country signed the Kyoto Protocol in 1998 and the Paris Agreement in 2016, making emissions reduction one of the most important environmental indicators to consider [26,71,72]. Since Niger is a large country, with more than the 60% of its surface covered by deserts, land occupation and rate of deforestation over its lifetime (ENV2) was not a priority during the assessment. Finally, potential impact to ecosystems (ENV7) and acidification potential (ENV3) of the technologies were included into the assessment in order to analyze potential impacts of the technologies in every environmental factor in order to conduct an integral environmental assessment of the alternatives.
Among the fossil fuels, natural gas (NG), obtained the highest score (Figure 5) on the environmental dimension, similar to Shaaban et al. [30], considered as a viable alternative to strength and secure the energy supply system [59] and become a cleaner driver to a transition towards renewables.
As expected, renewable electricity generation technologies showed a better environmental performance in comparison to technologies powered by conventional energy sources (coal, oil and gas) led by wind energy, which not only was considered as the cleanest technology among the analyzed ones (Figure 9), but also in other studies which compared renewables [17] followed by PV systems.
3.6. Risk Dimension
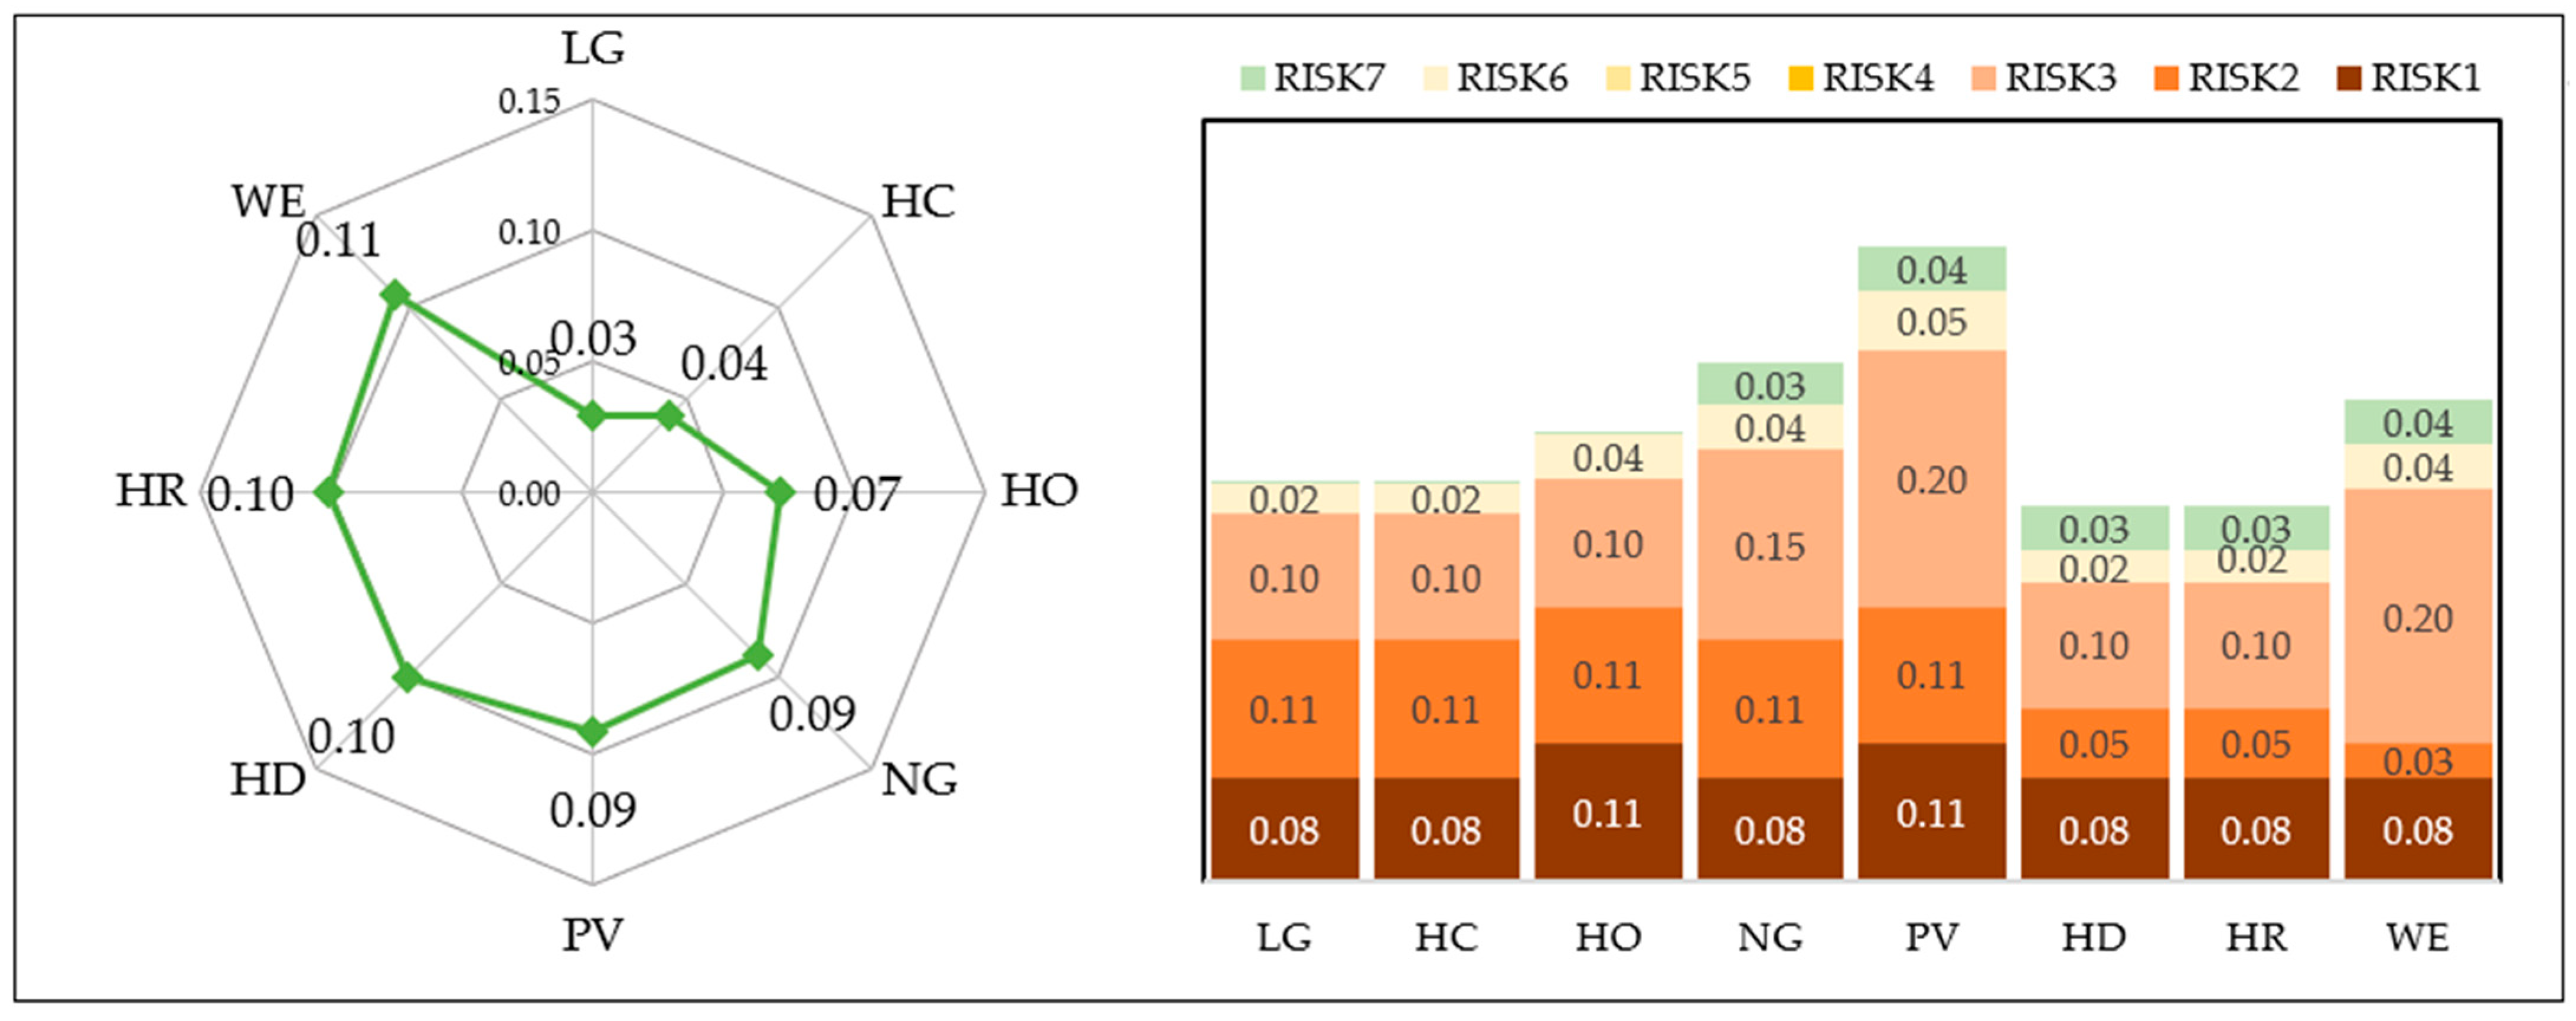
Since two out of the seven indicators did not have data available and were considered sensible topics for the experts and stakeholders, the analysis of this dimension was not 100% accurate and potentially needs further discussion and studies among local stakeholders. Having said that and by analyzing other factors, clear preference for technologies that have easiness of transportation like natural gas (as the best scored fossil fuel) through pipelines, or the others that do not require transportation at all like solar and wind, scored the highest results among this assessment (Figure 10). Also, as concluded by Santoyo-Castelazo and Azapagic [55], the variety of supply, specially integrating renewables, would represent less risk to the operation of power plants. On the other hand, the rest of fossil fuel based technologies (oil and coal power plants) received the lowest scores, due to the difficulties of transportation, and had higher impacts to the society if potential incidents may happen [26], also stated by Roth et al. [63], who developed a study based on health and safety risks of the electricity generation technologies.
Risk dimension (RISK) was included into the assessment to consider any future barriers or challenges that the planning, construction or operation and maintenance of the electricity generation technologies could face in a short or long-term future. Within this dimension, factors like governmental stability, political framework and inhabitants’ exposition to potential risks were analyzed.
Seven indicators of this dimension were clustered in 3 subgroups, based on the impacts (high, medium, low) of the indicators on the energy assessment. Firstly, and as an only indicator with a strong weight government transparency (RISK1) was considered as a major risk for the development of the technologies, considering factors like fair assignation of economic resources and considering tendering processes in a transparent manner, in order to avoid any delay in the planning and execution phases of the projects. At a second place, since some electricity generation technologies, requires the transportation of raw materials from a different source, and based on Roth et al. [63] study developed in Mexico, the potential external supply risks (RISK3) were included in the assessment to be aware of externalities that could jeopardize the electricity generation process. Based on literature review of developing countries like Nigeria [73] and the MENA region [74], political stability (RISK1) and historical political stability (RISK2) were considered as medium impact indicators. This was also in line with Mangla et al. [69], who considered the stability of a government and the execution of the projects as one of the main indicators that affects the selection and execution of energy projects based on political differences among political parties. Considered as an independent indicator, risk of human intended breakdown or shortage on primary energy supply (RISK4) was included to consider any type of potential terrorist attack that could disrupt the primary energy source provision or shutdown the electricity supply source, also considered by Frischknecht and Steiner [71].
While conducting the assessment, it was noted that RISK3 and RISK6 were indicators that showed high dependency not only on populations’ behavior but also on easiness of primary energy transportation or storage, as reported also by Santoyo-Castelazo and Azapagic [55]. Technologies with less complex transportation techniques like NG or the ones that does not require any transportation like WE and PV for the present study, obtained the highest score on the raking.
4. Conclusions
According to the results obtained from the analysis, solar photovoltaic system scored the highest among the selected technologies (0.74/1.00). It achieved the best results on economic and availability dimensions, therefore it could be concluded that this technology could be considered as an option to improve the country’s electricity supply. On the other hand, due to its low performance in the technology dimension, mostly affected by the reliability of the resource (intermittent solar radiation), it must be coupled with a technology which has a more stable and reliable electricity generation.
Among the fossil fuel-based power plants, natural gas power plant showed the highest performance (0.58/1.00). It showed a strong performance on the economic and availability dimensions. Furthermore, technical performance of this technology was one of the highest within the alternatives and showed the best environmental performance among the fossil fuel-based power plants. This option could be considered as an attractive alternative in the country from supply reliability aspect. However, for more comprehensive results, the political factors and transmission lines expansion feasibility need to be studied in detail, also a deep research on institutional barriers needs to be further conducted.
It can be concluded that one of the most suitable options for the development of Niger’s electricity supply system could be a hybrid system, i.e., natural gas power plants for a more reliable electricity supply coupled with solar PV systems. Solar PV can be installed and operated in less time than gas power plants with the potential to cover the demand in a short term, meanwhile parallel works for gas power plants and transportation systems can be carried out. Nowadays, PV systems have limited presence in Niger’s energy market. Its affordable installation and low operational costs combined with a very high resource availability in the country are characteristics that could boost its presence as a main source of energy in a long run, if coupled with a storage system, which can guarantee the reliable supply until other alternatives are connected in the country’s electricity infrastructure.
Further specific assessment should be conducted for concentrating solar power systems. Based on the insolation hours and direct solar radiation that the country receives, it could be a very promising source of energy once the international market prices of this technology are more stable to secure a more reliable investment. In the case of biomass, more studies should be conducted considering the municipal solid waste once the waste management and collection systems in the country are improved.
Finally, further specific analysis on energy-food-water nexus of the country in needed in order to provide decision makers a more holistic approach, in which decision makers will be able to select the best path to promote the sustainable development of the country.
Due to the subjective nature of the indicators’ selection and information gathered for some indicators, stakeholders and experts from different field of expertise related to the sustainable assessment were considered in order to reduce potential bias of the authors to select one technology. However, as it still depends on human behavior and knowledge, more studies covering larger stakeholder size could be conducted for the technologies which ranked the best scores in order to objectively select the best alternative for improving the electricity infrastructure of the country.
Author Contributions
R.B. proposed the concept and research design and acquired the research fund. B.E.A. collected most of the data on site, where V.S. collected the literature data. R.A. supported the field data collection and analysis. Data and results analyses were done jointly by all authors. Same is true for the article writing part. All authors have read and agreed to the published version of the manuscript.
Funding
Funding was provided by the German Federal Ministry of Education and Research (BMBF).
Institutional Review Board Statement
Not applicable.
Informed Consent Statement
Informed consent was obtained from all subjects involved in the study.
Data Availability Statement
The data presented in this study are available on request from the corresponding author. The data are not publicly available due to privacy reasons (respondents’ answers might lead their tracing back).
Acknowledgments
Authors would like to acknowledge the financial support from German Federal Ministry of Education and Research through its Project Management Agency DLR under the framework of WESA-ITT project.
Conflicts of Interest
The authors declare no conflict of interest.
Appendix A

Table A1.
Indicators description.
| Code | Indicator | Description |
|---|---|---|
| Availability dimension | ||
| AVI1 | Resource availability (extraction equivalent (toe) | Refers to the availability of the local resources, measured as the potential resource production on site. For renewable sources, the production is taken only on useful area (e.g., the solar area was considered only when a certain percentage of population was within the area with potential solar radiation). |
| AVI2 | Technology availability (qualitative): | Based on literature review regarding local knowledge on technologies in the study area and experts inputs, in this indicator the future capacity of the scenarios to make use of local resources (raw material, human resource, facilities, among others) is measured, in order to have the feeling if the country will be able to develop the technology (power plants or energy facilities) without depending from third countries |
| AVI3 | Material availability (qualitative): | Measures the future availability of raw materials to produce or develop the desired technology, more related to mineral resources that could be found in the country in order to produce components to assemble and build the desired power plant or energy facility |
| AVI4 | Economic availability (qualitative) | Refers to the country’s economic solvency regarding the purchase of the technology and facilities or investment in the power plant construction and operation without resorting to foreign investments or loans, which could increase the country’s external debts |
| AVI5 | Institutional barriers and regulatory framework (qualitative) | The country’s regulatory framework and political decisions related to the development of the selected energy system are considered. The different electricity generation technologies will be qualified according to prohibitions, limitations or promotion of the energy technologies development |
| AVI6 | Social acceptance (availability) (qualitative) | Public perception and acceptance of the technology regarding to impacts that could cause to the environment or communities, which is measured by the inhabitants’ perception and concerns related to side effects that could be generated during the implementation, maintenance and operation of the energy system |
| Risk dimension | ||
| RISK1 | Political stability (qualitative): | Considers the current and future political stability of the country, which means the continuity of developed polices, focused on the development of the energy sector, even whit a change of political actors. A stable political system can lead policy makers in meeting energy requirements |
| RISK2 | Historical political stability (qualitative) | Considers the historical political stability of the country, reflecting changes on governments, projects related to energy systems and the times that those were changed for political issues or changes of governments, who brought new guidelines and own projects, discontinuing previous projects of other political parties. |
| RISK3 | External supply risks (qualitative) | The uncertainty of delivering resources during implementation, operation or maintenance phases of the technology will be assessed, mostly focused on risks related to social conflicts, site local difficulties (e.g., road access, riots, political instability) or transit issues |
| RISK4 | Risk of man produced breakdown or shortage on primary energy supply (qualitative) | The potential for a successful terrorist attack on the energy system or its source of primary energy will be measured, based on resource vulnerability, risks related to proximity to armed groups, alternative illegal uses or attractiveness on other markets (illegal trading) |
| RISK5 | Government transparency (qualitative) | It refers to the legitimacy of a government investments according to what stipulated in laws and terms of trade while fairly assigning economic resources in the desired technology, showing that government operates in a transparent manner |
| RISK6 | Share of staff and management with appropriate education (qualitative) | Considering the knowledge available locally related to the construction, operation and maintenance of the electricity system, this indicator measures the capacity of locals to perform proper maintenance and operation of the power plant to avoid potential breakdowns or unplanned shortages |
| RISK7 | Health and safety–risk on public health risks (deaths/TWh) | The worst-case incidents scenarios and risks on human health and safety that the technology could generate in and out of the facility. Safety risks are mostly related to occupational accidents and public hazards (e.g., injuries and fatalities) and accident risks along the life cycle (e.g., explosions, spills, etc.) |
| Environmental dimension | ||
| ENV1 | GHG emissions and global warming potential (gCO2e/kWh) | GHG emissions, expressed in g of CO2-equivalence per kWh generated, during the entire supply chain of the energy systems, including processes before electricity generation, e.g., mining, plant construction, transportation among other activities that are considered within the scope of electricity generation. The CO2 and CH4 emissions of each technology was considered using its CO2 conversion factor. |
| ENV2 | Land occupation and rate of deforestation over lifetime (m2/MWh) | The area occupied by the energy system during its lifetime, comparing the number of square meters needed to produce one MWh of electricity, where processes like extraction, processing, delivery, construction, operation and decommissioning of the system are included in the assessment. |
| ENV3 | Acidification potential (kgSO2e/kWh) | Refers to the chemical compounds that are precursors to acid rain like sulfur dioxide (SO2), nitrogen oxides (NOx), nitrogen monoxide (NO), nitrogen dioxide (N2O), among others, measured in SO2-equivalence, those emissions are usually released into the atmosphere during fuel combustion processes. For the assessment, the entire process line of the electricity generation technologies. |
| ENV4 | Waste generation (g/kWh) | As known, during the construction, operation, maintenance, transportation among other processes the energy system generates certain amount of solid waste, for instance this indicator will measure the volume of Solid waste generated by the technology per each kWh produced. |
| ENV5 | Eutrophication potential (kgPO4e/kWh) | It refers to the pollution of aquatic ecosystems in which the over-fertilization of water and soil has turned into an increased growth of biomass, that over-fertilization could be generated by water disposal of technologies or other type of waste which ends into the water. |
| ENV6 | Water depletion (m3/MWh) | Considered to quantify the volume of water consumed by the technology to produce a single MW of electricity during its entire production chain, considering side processes, as cooling and usage of water for building the components. |
| ENV7 | Potential impacts to ecosystems (qualitative) | Potential negative impacts caused to the ecosystem, including loss of biodiversity (flora & fauna) and landscape due to activities related to the energy system caused by the use of land in order to assemble components of the power plant for electricity generation. |
| Social dimension | ||
| SOC1 | People displacement (qualitative) | Relates to side effects caused by the construction and operation of the power plant on surrounding communities, considering relocation of inhabitants, due to factors related to risks, proximity to resource source area or power plant. |
| SOC2 | Democratic governance and legitimacy (qualitative) | A high democratic governance and legitimacy is considered when a government rules according to what stipulated in laws and its actions are revealed to the inhabitants of the mentioned country, showing that government operates in a transparent manner. |
| SOC3 | Social benefit, advancement through (own) energy production (qualitative) | Number of households / total number of inhabitants which will have access to electricity produced by a small-scale decentralized plant, not considering the ones that are going to be beneficiated with a grid connected power plant. |
| SOC4 | Human health damage (nanoDALY/kWh) | Measures the impact of the technologies on human “healthy” life (DALY) per kWh of energy produced, the emissions that were considered for this factor are particulate matter formation, ozone layer depletion, human toxicity, ionizing radiation and photochemical oxidation. |
| SOC5 | Contribution to local economy (job creation) (Jobs/MW): | This indicator measures the quantity of direct and indirect jobs generated during the startup, operation and maintenance per each MW installed of the power plants or energy systems, considering the induced future on job opportunities. |
| Technological dimension | ||
| TECH1 | Energy efficiency of energy source (%) | Energy efficiency implies, the efficient use of energy, i.e., using a lower amount of energy to achieve the same level of energy service. It can be achieved by improved behavior or by more efficient technology. |
| TECH2 | Lifetime of electricity production facility (y) | Determines the expected period in which the energy system is able to produce energy at a high level of efficiency in comparison to its first-year installation, after the amount of time, its efficiency will reduce, and the system will probably need to be decommissioned. |
| TECH3 | Capacity factor (%): | Indicates the ratio of the current output of the energy system over a defined time period in comparison of its potential to production of energy at its optimal capacity (power output as percentage of the maximum possible output). |
| TECH4 | Reliability of energy supply regarding energy source (qualitative) | Shows the ability of power plants to perform its intended function, which will be translated into the reduction of dependency from other sources needed to compensate for the inoperable unit(s). |
| TECH5 | Operational flexibility (qualitative) | Indicates the electricity’s system capacity to react rapidly in energy generation and flexibly to adapt to changes in the electricity demand. |
| TECH6 | Time to plant start-up from start of construction (y) | This indicator is defined as the overall time taken from start of construction to start-up of the energy system, period in which potentially there would be a gap in the electricity supply. |
| TECH7 | Full load hours (h/y) | Refer to the number of hours per year that a power plant would need to run at its rated power in order to produce the same amount of energy that it actually produces during a year (during which it does not always run at full load). |
| TECH8 | Potential for upgrading/expansion (qualitative) | Measures the complexity of power system expansion planning, which is the process of analyzing, evaluating and recommending what new facilities and equipment must be added to the power system in order to replace worn-out facilities and equipment and to meet changing demand for electricity, regarding Niger’s limitations and strengths. |
| TECH9 | Vulnerability of system efficiency towards external influences (qualitative) | As known, some power plants or electricity systems depends on external factors and resources, e.g., usage of water for cooling systems, this indicator measures the dependency of those processes on those resources and its constant availability. |
| TECH10 | Level of energy service (heat, electricity, transportation) | This indicator measures the amount and quality of services provided by the energy source, meaning that if it is possible to obtain more than one benefit out of the energy source (electricity, heat, transportation.) In this case the “side” production will be considered as an addition for the analyzed energy systems. |
| Economic dimension | ||
| ECO1 | Investment cost (€/kW) | It compares the costs related to construction and installation of the energy facilities, including any cost, which will arise before the operation of the system. |
| ECO2 | Levelized cost of electricity (LCOE) (€/MWh) | It measures the average cost of producing electricity over the supply chain of the system. This indicator was calculated with local data and using the LCOE formula and information regarding to O&M, investment cost and energy production through lifetime |
| ECO3 | Maintenance, operations and Fuel cost (€/y) | Related to costs factors including employee’s salaries, fuel costs, engineering and consultation services. The scope of this indicator also covers the economic resources spent on the maintenance activities of the system including purchasing items to prolong the energy system life and avoid system failures or interruptions. |
| ECO4 | Emission taxes (€/MWh) | Measures the benefits that achieve the technology in savings through its low emissions generation, reducing the cost of implementation of equipment that will reduce the CO2 emissions in the future. |
| ECO5 | Direct costs for health impacts caused by power production (€/GDP) | Measures the potential economic impacts that the technology’s entire process, considering primary energy source extraction, transportation and electricity generation due to power plants operation, could cause to human health by environmental pollution. |
References
- Bridge, B.A.; Adhikari, D.; Fontenla, M. Electricity, income, and quality of life. Soc. Sci. J. 2016, 53, 33–39. [Google Scholar] [CrossRef]
- United Nations UNIDO Supports Ghana to Develop Standards for Fruits, Fish, Cocoa and Wood Industries to Facilitate Imports and Exports. Available online: http://gh.one.un.org/content/unct/ghana/en/home/media-centre/news-and-press-releases/unido-supports-ghana-to-develop-standards-for-fruits--fish--coco.html (accessed on 27 August 2019).
- Maxim, A. Sustainability assessment of electricity generation technologies using weighted multi-criteria decision analysis. Energy Policy 2014, 65, 284–297. [Google Scholar] [CrossRef]
- Nsafon, B.E.K.; Butu, H.M.; Owolabi, A.B.; Roh, J.W.; Suh, D.; Huh, J.S. Integrating multi-criteria analysis with PDCA cycle for sustainable energy planning in Africa: Application to hybrid mini-grid system in Cameroon. Sustain. Energy Technol. Assess. 2020, 37, 100628. [Google Scholar] [CrossRef]
- Gallego Carrera, D.; Mack, A. Sustainability assessment of energy technologies via social indicators: Results of a survey among European energy experts. Energy Policy 2010, 38, 1030–1039. [Google Scholar] [CrossRef]
- Jing, Y.Y.; Bai, H.; Wang, J.J. A fuzzy multi-criteria decision-making model for CCHP systems driven by different energy sources. Energy Policy 2012, 42, 286–296. [Google Scholar] [CrossRef]
- Vafaeipour, M.; Hashemkhani Zolfani, S.; Morshed Varzandeh, M.H.; Derakhti, A.; Keshavarz Eshkalag, M. Assessment of regions priority for implementation of solar projects in Iran: New application of a hybrid multi-criteria decision making approach. Energy Convers. Manag. 2014, 86, 653–663. [Google Scholar] [CrossRef]
- Štreimikiene, D.; Šliogeriene, J.; Turskis, Z. Multi-criteria analysis of electricity generation technologies in Lithuania. Renew. Energy 2016, 85, 148–156. [Google Scholar] [CrossRef]
- Amer, M.; Daim, T.U. Selection of renewable energy technologies for a developing county: A case of Pakistan. Energy Sustain. Dev. 2011, 15, 420–435. [Google Scholar] [CrossRef]
- Stein, E.W. A comprehensive multi-criteria model to rank electric energy production technologies. Renew. Sustain. Energy Rev. 2013, 22, 640–654. [Google Scholar] [CrossRef]
- Afgan, N.H.; Carvalho, M.G. Multi-criteria assessment of new and renewable energy power plants. Energy 2002, 27, 739–755. [Google Scholar] [CrossRef]
- Troldborg, M.; Heslop, S.; Hough, R.L. Assessing the sustainability of renewable energy technologies using multi-criteria analysis: Suitability of approach for national-scale assessments and associated uncertainties. Renew. Sustain. Energy Rev. 2014, 39, 1173–1184. [Google Scholar] [CrossRef]
- Dorini, G.; Kapelan, Z.; Azapagic, A. Managing uncertainty in multiple-criteria decision making related to sustainability assessment. Clean Technol. Environ. Policy 2011, 13, 133–139. [Google Scholar] [CrossRef]
- Singh, R.K.; Murty, H.R.; Gupta, S.K.; Dikshit, A.K. An overview of sustainability assessment methodologies. Ecol. Indic. 2009, 9, 189–212. [Google Scholar] [CrossRef]
- Kaya, T.; Kahraman, C. Multicriteria renewable energy planning using an integrated fuzzy VIKOR & AHP methodology: The case of Istanbul. Energy 2010, 35, 2517–2527. [Google Scholar]
- Liu, G. Development of a general sustainability indicator for renewable energy systems: A review. Renew. Sustain. Energy Rev. 2014, 31, 611–621. [Google Scholar] [CrossRef]
- Tasri, A.; Susilawati, A. Selection among renewable energy alternatives based on a fuzzy analytic hierarchy process in Indonesia. Sustain. Energy Technol. Assess. 2014, 7, 34–44. [Google Scholar] [CrossRef]
- Erol, Ö.; Kilkiş, B. An energy source policy assessment using analytical hierarchy process. Energy Convers. Manag. 2012, 63, 245–252. [Google Scholar] [CrossRef]
- Ribeiro, F.; Ferreira, P.; Araújo, M. Evaluating future scenarios for the power generation sector using a Multi-Criteria Decision Analysis (MCDA) tool: The Portuguese case. Energy 2013, 52, 126–136. [Google Scholar] [CrossRef] [Green Version]
- International Energy Agency (IEA). IEA Africa Energy Outlook; IEA: Paris, France, 2018. [Google Scholar] [CrossRef] [Green Version]
- May, J. Niger Has the World’s Highest Birth Rate—And That May Be a Recipe for Unrest. Available online: https://theconversation.com/niger-has-the-worlds-highest-birth-rate-and-that-may-be-a-recipe-for-unrest-108654 (accessed on 11 October 2019).
- The World Bank Country Data “Niger”. World Bank Country Indicators. Available online: https://data.worldbank.org/country/niger (accessed on 27 November 2020).
- The World Bank The World Bank in Niger. Country Profile. 2020. Available online: https://www.worldbank.org/en/country/niger/overview (accessed on 27 November 2020).
- Guay, J.-H. Perspective Monde Outil Pedagogique des Grandes Tendances Mondiales Depuis 1945. Available online: http://perspective.usherbrooke.ca/bilan/servlet/BMTendanceStatPays?codePays=NER&codeStat=EG.USE.ELEC.KH.PC&codeTheme=6&langue=fr (accessed on 21 January 2020).
- USAID. Niger—Energy Sector Overview. 2019. Available online: https://www.usaid.gov/powerafrica/niger (accessed on 16 June 2020).
- Zelt, O.; Krüger, C.; Blohm, M.; Bohm, S.; Far, S. Long-term electricity scenarios for the MENA region: Assessing the preferences of local stakeholders using multi-criteria analyses. Energies 2019, 12, 3046. [Google Scholar] [CrossRef] [Green Version]
- Pohekar, S.D.; Ramachandran, M. Application of multi-criteria decision making to sustainable energy planning—A review. Renew. Sustain. Energy Rev. 2004, 8, 365–381. [Google Scholar] [CrossRef]
- Runsten, S.; Fuso Nerini, F.; Tait, L. Energy provision in South African informal urban Settlements—A multi-criteria sustainability analysis. Energy Strat. Rev. 2018, 19, 76–84. [Google Scholar] [CrossRef]
- Brand, B.; Missaoui, R. Multi-criteria analysis of electricity generation mix scenarios in Tunisia. Renew. Sustain. Energy Rev. 2014, 39, 251–261. [Google Scholar] [CrossRef] [Green Version]
- Shaaban, M.; Scheffran, J.; Böhner, J.; Elsobki, M.S. Sustainability assessment of electricity generation technologies in Egypt using multi-criteria decision analysis. Energies 2018, 11, 1117. [Google Scholar] [CrossRef] [Green Version]
- Stamford, L.; Azapagic, A. Sustainability indicators for the assessment of nuclear power. Energy 2011, 36, 6037–6057. [Google Scholar] [CrossRef]
- Fahad, A. Energy Scenario Analysis of Niger: A LEAP Based Approach. Master’s Thesis, TH Köln (University of Applied Sciences), Cologne, Germany, 2017; pp. 1–11. [Google Scholar]
- Gado, S. The Energy Sector of Niger: Perspectives and Opportunities. Brussels. 2015. Available online: https://energycharter.org/fileadmin/DocumentsMedia/Occasional/Niger_Energy_Sector.pdf (accessed on 5 June 2020).
- Direction Générale de l’Energie (DGE); Centre National d’Energie Solaire (CNES). Inventaire National des Installations à Energies Renouvelables (INIER—2014); DGE: Niamey, Niger, 2016; Available online: https://www.se4all-africa.org/fileadmin/uploads/se4all/Documents/Country_PANER/CO%CC%82TE_D%E2%80%99IVOIRE_Plan_d_Actions_National_pour_les_Energies_Renouvelables.pdf (accessed on 3 April 2020).
- Ministere des Mines et de L’Energie. Annuaire Statistique du Niger 2007–2011; Ministere des Mines et de L’Energie: Niamey, Niger, 2012. Available online: http://www.stat-niger.org/statistique/file/Annuaires_Statistiques/INS_2012/AS2007-2011INDUSTRIEEXT.pdf (accessed on 3 June 2020).
- International Renewable Energy Agency (IRENA). Renewables Readiness Assessment; IRENA: Abu Dhabi, UAE, 2013. [Google Scholar]
- Economic Community of West African States (ECOWAS); United Nations Development Programme (PNUD). Rapport Final Pays: Niger Evaluation et Analyse des Gaps; ECOWAS: Niamey, Niger, 2014. [Google Scholar]
- Autorité du Bassin du Niger (ABN). Annuaire Statistique du Niger 2009—2017; ABN: Niamey, Niger, 2017. [Google Scholar]
- International Atomic Energy Agency (IAEA). The Integrated Nuclear Infrastructure Review (INIR); IAEA Counterpart—Niger High Authority for Atomic Energy (HANEA): Niamey, Niger, 2018; Volume 2. [Google Scholar]
- Mohammed, Y.S.; Kiray, V.; Saka, B.; Aja, E.A.; Dalhatu, I.I. Application of Solar Energy Technologies in Nigeria: Synopsis of Significant Issues and Challenges. In Proceedings of the 2020 IEEE PES/IAS PowerAfrica, Nairobi, Kenya, 25–28 August 2020. [Google Scholar]
- Soomro, M.I.; Mengal, A.; Memon, Y.A.; Khan, M.W.A.; Shafiq, Q.N.; Mirjat, N.H. Performance and economic analysis of concentrated solar power generation for Pakistan. Processes 2019, 7, 575. [Google Scholar] [CrossRef] [Green Version]
- El-Bayeh, C.Z.; Alzaareer, K.; Laraki, M.H.; Brahmi, B.; Kaymanesh, A.; Far, S.R.; Mougharbel, I.; Eicker, U. Installation of 100 MW concentrated solar power plant in Lebanon: A comparative study between linear fresnel and dish-stirling. In Proceedings of the 2020 5th International Conference on Renewable Energies for Developing Countries (REDEC), Marrakech, Morocco, 29–30 June 2020; Volume 5, pp. 1–6. [Google Scholar]
- Azouzoute, A.; Alami Merrouni, A.; Touili, S. Overview of the integration of CSP as an alternative energy source in the MENA region. Energy Strat. Rev. 2020, 29, 100493. [Google Scholar] [CrossRef]
- International Renewable Energy Agency (IRENA). Renewable Power Generation Costs in 2019; International Renewable Energy Agency: Abu Dhabi, UAE, 2020. [Google Scholar]
- Wei, J.; Liang, G.; Alex, J.; Zhang, T.; Ma, C. Research progress of energy utilization of agricultural waste in China: Bibliometric analysis by citespace. Sustainability 2020, 12, 812. [Google Scholar] [CrossRef] [Green Version]
- Elmahmoudi, F.; Abra, O.E.; Serrar, O.; Raihani, A.; Bahatti, L.; Rafik, M. GIS Based Multi-Criteria Decision Analysis for Renewable Energy Sites Selection: Comparative Study. In Proceedings of the 2018 6th International Renewable and Sustainable Energy Conference (IRSEC), Rabat, Morocco, 5–8 December 2018. [Google Scholar]
- Alonso, J.A.; Lamata, M.T. Consistency in the analytic hierarchy process: A new approach. Int. J. Uncertain. Fuzziness Knowl. Based Syst. 2006, 14, 445–459. [Google Scholar] [CrossRef] [Green Version]
- Ilskog, E. Indicators for assessment of rural electrification-An approach for the comparison of apples and pears. Energy Policy 2008, 36, 2665–2673. [Google Scholar] [CrossRef]
- IUCN. The Environment and Gender Index (EGI) 2013 Pilot; IUCN: Washington, DC, USA, 2013; pp. 1–153. [Google Scholar]
- Vafaei, N.; Ribeiro, R.; Camarinha-matos, L.; Vafaei, N.; Ribeiro, R.; Normalization, L.C.; Vafaei, N.; Ribeiro, R.A.; Camarinha-matos, L.M. Normalization Techniques for Multi-Criteria Decision Making: Analytical Hierarchy Process Case Study. In Proceedings of the 7th IFIP WG 5.5/SOCOLNET Advanced Doctoral Conference on Computing, Electrical and Industrial Systems (DoCEIS 2016), Costa de Caparica, Portugal, 11–13 April 2016; pp. 261–269. [Google Scholar]
- San Cristóbal, J.R. Multi-criteria decision-making in the selection of a renewable energy project in spain: The Vikor method. Renew. Energy 2011, 36, 498–502. [Google Scholar] [CrossRef]
- OXFAM. Etat des Lieux sur la Retrocession des 15% des Redevances Minierres et Petrolieres de l’etat vers les Communes des Regions Concernees. Niamey. 2019. Available online: https://eiti.org/files/documents/fr_status_subnational_transfers_royalties.pdf (accessed on 14 June 2020).
- Akan, M.Ö.A.; Selam, A.A.; Firat, S.Ü.O.; Er Kara, M.; Özel, S. A comparative analysis of renewable energy use and policies: Global and turkish perspectives. Sustainnability 2015, 7, 16379–16407. [Google Scholar] [CrossRef] [Green Version]
- Ögütcü, C.; Gado, S. Le Secteur de L’Energie du Niger: Perspectives et Opportunites dans le cadre de l’acces a l’energoe et aux Investissements. Brussels. 2016. Available online: https://www.energycharter.org/fileadmin/DocumentsMedia/Occasional/Niger_Energy_Sector_FR.pdf (accessed on 15 June 2020).
- Santoyo-Castelazo, E.; Azapagic, A. Sustainability assessment of energy systems: Integrating environmental, economic and social aspects. J. Clean. Prod. 2014, 80, 119–138. [Google Scholar] [CrossRef]
- Uduma, K.; Arciszewski, T. Sustainable energy development: The key to a stable Nigeria. Sustainability 2010, 2, 1558–1570. [Google Scholar] [CrossRef] [Green Version]
- Brunet, C.; Savadogo, O.; Baptiste, P.; Bouchard, M.A.; Rakotoary, J.C.; Ravoninjatovo, A.; Cholez, C.; Gendron, C.; Merveille, N. Impacts generated by a large-scale solar photovoltaic power plant can lead to conflicts between sustainable development goals: A review of key lessons learned in Madagascar. Sustainability 2020, 12, 7471. [Google Scholar] [CrossRef]
- International Renewable Energy Agency (IRENA). Renewable Capacity Statistics; IRENA: Abu Dhabi, UAE, 2020. [Google Scholar]
- Yilan, G.; Kadirgan, M.A.N.; Çiftçioğlu, G.A. Analysis of electricity generation options for sustainable energy decision making: The case of Turkey. Renew. Energy 2020, 146, 519–529. [Google Scholar] [CrossRef]
- Kaygusuz, K. Energy for sustainable development: A case of developing countries. Renew. Sustain. Energy Rev. 2012, 16, 1116–1126. [Google Scholar] [CrossRef]
- Latief, R.; Lefen, L. Foreign direct investment in the power and energy sector, energy consumption, and economic growth: Empirical evidence from Pakistan. Sustainability 2019, 11, 192. [Google Scholar] [CrossRef] [Green Version]
- Lorente, Á.G.; López, M.H.; Álvarez, F.J.M.; Jiménez, J.M. Differences in electricity generation from renewable sources from similar environmental conditions: The cases of Spain and Cuba. Sustainability 2020, 12, 5190. [Google Scholar] [CrossRef]
- Roth, S.; Hirschberg, S.; Bauer, C.; Burgherr, P.; Dones, R.; Heck, T.; Schenler, W. Sustainability of electricity supply technology portfolio. Ann. Nucl. Energy 2009, 36, 409–416. [Google Scholar] [CrossRef]
- Sterl, S.; Liersch, S.; Koch, H.; Lipzig, N.P.M.V.; Thiery, W. A new approach for assessing synergies of solar and wind power: Implications for West Africa. Environ. Res. Lett. 2018, 13. [Google Scholar] [CrossRef]
- Pennock, M.; Rouse, B. The Costs and Risks of Maturing Technologies, Traditionally vs. Evolutionary Approaches. In Proceedings of the 5th Annual Acquisition Research Symposium: Creating Synergery for Informed Change, Monterey, CA, USA, 14–15 May 2008; pp. 106–125. [Google Scholar]
- Bilan, Y.; Streimikiene, D.; Vasylieva, T.; Lyulyov, O.; Pimonenko, T.; Pavlyk, A. Linking between renewable energy, CO2 emissions, and economic growth: Challenges for candidates and potential candidates for the EU membership. Sustainability. 2019, 11, 1528. [Google Scholar] [CrossRef] [Green Version]
- Lofthouse, J.; Policy, S.; Simmons, R.T.; Yonk, R.M. Reliability of Renewable Energy: Geothermal; Institute of Political Economy; Utah State University: Logan, UT, USA, 2015; pp. 1–7. Available online: https://www.strata.org/wp-content/uploads/2015/11/Reliability-Geothermal-Condensed.pdf (accessed on 3 January 2021).
- Boulay, A.M.; Bulle, C.; Bayart, J.B.; Deschênes, L.; Margni, M. Regional characterization of freshwater use in LCA: Modeling direct impacts on human health. Environ. Sci. Technol. 2011, 45, 8948–8957. [Google Scholar] [CrossRef]
- Mangla, S.K.; Luthra, S.; Jakhar, S.; Gandhi, S.; Muduli, K.; Kumar, A. A step to clean energy—Sustainability in energy system management in an emerging economy context. J. Clean. Prod. 2020, 242, 118462. [Google Scholar] [CrossRef]
- Roinioti, A.; Koroneos, C. Integrated life cycle sustainability assessment of the Greek interconnected electricity system. Sustain. Energy Technol. Assess. 2019, 32, 29–46. [Google Scholar] [CrossRef]
- Frischknecht, R.; Steiner, R.; Braunschweig, A.; Egli, N.; Hildesheimer, G. Swiss Ecological Scarcity Method: The New Version 2006; ESU Services: Schaffhausen, Switzerland, 2006; pp. 1–4. Available online: http://esu-services.ch/fileadmin/download/Frischknecht-2006-EcologicalScarcity-Paper.pdf (accessed on 3 January 2021).
- Mattiussi, A.; Rosano, M.; Simeoni, P. A decision support system for sustainable energy supply combining multi-objective and multi-attribute analysis: An Australian case study. Decis. Support Syst. 2014, 57, 150–159. [Google Scholar] [CrossRef]
- Sule, A.H. Major Factors affecting electricity generation, transmission, and distribution in Nigeria. Int. J. Eng. Math. Intell. 2010, 1, 159–164. [Google Scholar]
- Al-Mulali, U.; Ozturk, I. The effect of energy consumption, urbanization, trade openness, industrial output, and the political stability on the environmental degradation in the MENA (Middle East and North African) region. Energy 2015, 84, 382–389. [Google Scholar] [CrossRef]
Figure 1.
Methodology schematic illustration.

Figure 2.
Electricity generation technologies process line.

Figure 3.
Dimensions and indicator numbers.

Figure 4.
Compiled results of the study (LG: lignite, HC: hard coal, HO: mineral oil, NG: natural gas, PV: photovoltaics, HD: dam hydro, HR: run of river hydro, WE: wind energy). 1.0 would be the ideal case, while 0 would be absolutely not sustainable.
Figure 4.
Compiled results of the study (LG: lignite, HC: hard coal, HO: mineral oil, NG: natural gas, PV: photovoltaics, HD: dam hydro, HR: run of river hydro, WE: wind energy). 1.0 would be the ideal case, while 0 would be absolutely not sustainable.

Figure 5.
Availability dimension results.

Figure 6.
Economic dimension results.

Figure 7.
Technical dimension results.

Figure 8.
Social dimension results.

Figure 9.
Environmental dimension results.

Figure 10.
Risk dimension results.

Table 1.
Resource Availability in Niger.
| Resource | Potential | Technology | Source |
|---|---|---|---|
| Oil | 300 Mbbl of crude oil (Production: 20,000 bbl/d) | Oil-based power plant | [32,33] |
| Gas | 18.6 bcm of natural gas (Production: 44,000 t/y) | Gas driven power plant | [32,33] |
| Coal | Over 90 Mt | Coal-fired power plant | [33,34,35] |
| Hydro | Potential of 400 MW–Niger River | Hydropower dam Run-of-river | [34,36] |
| Solar | Insolation of 8–9 h/d, average radiation of 5–6 kWh/m² | Solar photovoltaic system Concentrated solar power system | [34,36] |
| Nuclear | About 450,000 t of Uranium | Nuclear power plant | [32,37] |
| Wind | Average wind speed 2–6 m/s at 10 m, increase 20–100% by 50 m | Wind turbine | [36] |
| Biomass | Agricultural residue: 2960 t/y | Biogas plant | [38] |
Table 2.
Nine-point evaluation scale.
| Scale | Degree of Preference |
|---|---|
| 1 | No preference |
| 3 | Weak preference |
| 5 | Strong preference |
| 7 | Very strong preference |
| 9 | Extreme strong preference |
| 2, 4, 6, 8 | Intermediate values |
Table 3.
Consistency indices for randomly generated matrix [47].
Table 3.
Consistency indices for randomly generated matrix [47].
| Nr | 3 | 4 | 5 | 6 | 7 | 8 | 9 | 10 |
| RI | 0.52 | 0.88 | 1.11 | 1.25 | 1.35 | 1.40 | 1.45 | 1.49 |
Table 4.
Final weights of dimensions and indicators.
| Dimension | Code | Weight | Indicator Number and Weight | |||||||||
|---|---|---|---|---|---|---|---|---|---|---|---|---|
| 1 | 2 | 3 | 4 | 5 | 6 | 7 | 8 | 9 | 10 | |||
| Availability | AVI | 0.26 | 0.32 | 0.13 | 0.09 | 0.19 | 0.19 | 0.09 | NA | NA | NA | NA |
| Economical | ECO | 0.26 | 0.26 | 0.35 | 0.20 | 0.08 | 0.11 | NA | NA | NA | NA | NA |
| Technical | TECH | 0.18 | 0.11 | 0.02 | 0.18 | 0.19 | 0.05 | 0.11 | 0.18 | 0.10 | 0.04 | 0.03 |
| Social | SOC | 0.12 | 0.08 | 0.11 | 0.31 | 0.19 | 0.31 | NA | NA | NA | NA | NA |
| Environmental | ENV | 0.11 | 0.25 | 0.12 | 0.05 | 0.19 | 0.06 | 0.26 | 0.08 | NA | NA | NA |
| Risk | RISK | 0.07 | 0.14 | 0.14 | 0.25 | 0.07 | 0.32 | 0.06 | 0.04 | NA | NA | NA |
Table 5.
Information about the indicators under each technology [13,21,27,28,29,30,33,34,36,37,46,47,48,51,52,53].
| CODE | Indicator/Technology | LG | HC | HO | NG | PV | HD | HR | WE | Units |
|---|---|---|---|---|---|---|---|---|---|---|
| AVI1 | Resource availability | 242 | 468 | 1983 | 723 | 424,036 | 0 | 0 | 17,752 | toe |
| AVI2 | Technology availability | I | I | I | I | I | L | L | VL | Qualitative |
| AVI3 | Material availability | I | I | I | I | I | I | I | L | Qualitative |
| AVI4 | Economic availability | I | I | I | I | VH | L | L | I | Qualitative |
| AVI5 | Institutional barriers | I | I | L | L | L | I | I | H | Qualitative |
| AVI6 | Social acceptance (availability) | H | H | H | I | H | I | I | I | Qualitative |
| ECO1 | Investment cost | 5700 | 5700 | 1200 | 1000 | 1100 | 29,900 | 29,900 | 1350 | €/kW |
| ECO2 | Levelized cost of electricity | 115 | 115 | 85 | 62 | 50 | 50 | 50 | 46 | €/MWh |
| ECO3 | Maintenance, operations and fuel cost | 95M | 95M | 95M | 95M | 0.53 | 30,660 | 30,660 | 4.80 | €/y |
| ECO4 | Emission taxes | 0 | 0 | 0 | 0 | 0 | 0 | 0 | 0 | €/kW |
| ECO5 | Direct costs for health impacts | 1.35 | 1.35 | 0.67 | 0.34 | 0.19 | 0.05 | 0.05 | 0.09 | €/GDP |
| ENV1 | GHG emissions and GWP | 1192 | 823 | 782 | 420 | 50 | 30 | 14 | 9 | gCO2e/kWh |
| ENV2 | Land use and rate of deforestation | 0.018 | 0.018 | <0.001 | <0.001 | 0.05 | <0.001 | <0.001 | 0.002 | m2/MWh |
| ENV3 | Acidification potential | 0.002 | 0.001 | <0.001 | <0.001 | <0.001 | <0.001 | <0.001 | <0.001 | kgSO2e/kWh |
| ENV4 | Waste generation | 3172 | 3084 | 0.8 | 4.7 | 0.02 | 310 | 310 | 0.05 | g/kWh |
| ENV5 | Eutrophication potential | <0.001 | <0.001 | <0.001 | 4.3 × 10⁻⁶ | 6.3 × 10⁻⁶ | 1.5 × 10⁻⁶ | 1.5 × 10⁻⁶ | 1.4 × 10⁻⁵ | kgPO4e/kWh |
| ENV6 | Water depletion | 0.003 | 0.003 | 0.002 | 0.001 | <0.001 | 8.9 × 10⁻⁶ | 8.9 × 10⁻⁶ | 5.4 × 10⁻⁵ | m3 |
| ENV7 | Potential impacts to ecosystems | VH | VH | VH | H | L | I | I | VL | Qualitative |
| RISK1 | Political stability | I | I | H | I | H | I | I | I | Qualitative |
| RISK2 | Historical political stability | H | H | H | H | H | L | L | VL | Qualitative |
| RISK3 | External supply risks | I | I | I | L | VL | I | I | VL | Qualitative |
| RISK4 | Risk of man produced breakdown | 0 | 0 | 0 | 0 | 0 | 0 | 0 | 0 | Qualitative |
| RISK5 | Government transparency | 0 | 0 | 0 | 0 | 0 | 0 | 0 | 0 | Qualitative |
| RISK6 | Staff with appropriate education | L | L | I | I | H | L | L | I | Qualitative |
| RISK7 | Risk on public health | 129 | 129 | 133 | 13 | 0.44 | 0.84 | 0.84 | 0.15 | Deaths/TWh |
| SOC1 | People displacement | I | I | I | I | VL | H | I | L | Qualitative |
| SOC2 | Democratic governance and legitimacy | 0 | 0 | 0 | 0 | 0 | 0 | 0 | 0 | Qualitative |
| SOC3 | Advantage through energy production | VL | VL | VL | VL | I | VL | L | L | Qualitative |
| SOC4 | Human health damage | 1000 | 390 | 150 | 30 | 0 | 10 | 10 | 40 | nanoDALY/kWh |
| SOC5 | Contribution to local economy | 2 | 2 | 1.7 | 1.7 | 13 | 5.5 | 5.5 | 3 | Jobs/MW |
| TECH1 | Energy efficiency of energy source | 36.0 | 39.6 | 38.7 | 51.0 | 25.0 | 89.0 | 89.0 | 40.0 | % |
| TECH2 | Lifetime of the facility | 50 | 50 | 50 | 45 | 30 | 150 | 80 | 20 | y |
| TECH3 | Capacity factor | 85 | 85 | 85 | 85 | 20 | 50 | 35 | 25 | % |
| TECH4 | Reliability of energy supply | H | H | H | H | M | H | H | M | Qualitative |
| TECH5 | Operational flexibility | L | L | L | L | H | H | H | H | Qualitative |
| TECH6 | Time to plant start-up | 4.00 | 4.00 | 5.00 | 5.00 | 1.50 | 4.00 | 4.00 | 1.50 | y |
| TECH7 | Full load hours | 3550 | 3550 | 3150 | 3150 | 1700 | 4500 | 4500 | 3000 | h/y |
| TECH8 | Potential for upgrading/expansion | I | I | H | VH | VH | L | I | L | Qualitative |
| TECH9 | Vulnerability towards external influences | 0 | 0 | 0 | 0 | 0 | 0 | 0 | 0 | Qualitative |
| TECH10 | Level of energy Service | 2 | 2 | 3 | 3 | 1 | 1 | 1 | 1 | H, E, T |
Qualitative: VH: very high, H: high, I: intermediate, L: low, VL: very low.
Publisher’s Note: MDPI stays neutral with regard to jurisdictional claims in published maps and institutional affiliations. |
© 2021 by the authors. Licensee MDPI, Basel, Switzerland. This article is an open access article distributed under the terms and conditions of the Creative Commons Attribution (CC BY) license (http://creativecommons.org/licenses/by/4.0/).
Share and Cite
MDPI and ACS Style
Bhandari, R.; Arce, B.E.; Sessa, V.; Adamou, R. Sustainability Assessment of Electricity Generation in Niger Using a Weighted Multi-Criteria Decision Approach. Sustainability 2021, 13, 385. https://doi.org/10.3390/su13010385
AMA Style
Bhandari R, Arce BE, Sessa V, Adamou R. Sustainability Assessment of Electricity Generation in Niger Using a Weighted Multi-Criteria Decision Approach. Sustainability. 2021; 13(1):385. https://doi.org/10.3390/su13010385
Chicago/Turabian StyleBhandari, Ramchandra, Benjamin Eduardo Arce, Vittorio Sessa, and Rabani Adamou. 2021. "Sustainability Assessment of Electricity Generation in Niger Using a Weighted Multi-Criteria Decision Approach" Sustainability 13, no. 1: 385. https://doi.org/10.3390/su13010385
Note that from the first issue of 2016, this journal uses article numbers instead of page numbers. See further details here.