Article

Effects of γ-C2S on the Properties of Ground Granulated Blast-Furnace Slag Mortar in Natural and Accelerated Carbonation Curing

1
Department of Architectural Engineering, Hanyang University, 1271 Sa 3-dong, Sangnok-gu, Ansan 15588, Korea
2
Department of Architectural Engineering, Innovative Durable Building and Infrastructure Research Center, Hanyang University, 1271 Sa-3-dong, Sangnok-gu, Ansan 15588, Korea
*
Authors to whom correspondence should be addressed.
Sustainability 2021, 13(1), 357; https://doi.org/10.3390/su13010357
Submission received: 24 November 2020 / Revised: 22 December 2020 / Accepted: 23 December 2020 / Published: 2 January 2021
(This article belongs to the Special Issue Low CO2 Concrete)

Abstract

:
γ-Dicalcium silicate (γ-C2S) is known for its strong carbonation reactivity by which it can capture atmospheric carbon dioxide (CO2), thus, it can be used in construction industries. This paper aims to study the effects of γ-C2S on the properties of ground granulated blast-furnace slag (GGBFS) containing cement mortar and paste in natural and accelerated carbonation curing. The compressive strength of 5% γ-C2S (G5) added to GGBFS cement mortar is higher compared with the control one in natural carbonation (NC) and accelerated carbonation (AC) up to 14 days of curing, but once the curing duration is increased, there is no significant improvement with the compressive strength observed. The compressive strength of AC-cured mortar samples is higher than that of NC. The scanning electron microscopy (SEM) images show that the AC samples exhibited compact, uniform, and regular morphology with less in porosity than the NC samples. X-ray diffraction (XRD) and Fourier transform infra-red (FT-IR) results confirmed the formation of calcium carbonate (calcite: CC) as carbonated products in paste samples, which make the surface dense and a defect-free matrix result in the highest compressive strength. The decomposition of AC samples around 650–750 °C revealed the well-documented and stable crystalline CC peaks, as observed by thermogravimetry analysis (TGA). This study suggests that γ-C2S added to concrete can capture atmospheric CO2 (mostly generated from cement and metallurgy industries), and make the concrete dense and compact, resulting in improved compressive strength.

1. Introduction

Portland cement is the most prevalent form of cement used as an essential ingredient in construction industries worldwide. However, the production of Portland cement requires a huge amount of energy and produces large amounts of greenhouse gases [1,2]. The cement industry has generated a major contribution to emissions of CO2, which is an alarming issue for the world. According to 2017 statistical data, it is estimated that the production of Portland cement accounts for 4% of global CO2 emissions [3,4]. Significant efforts have been made to reduce CO2 emissions, as well as calcium oxide content, in Portland cement.
Since the 2000s, controlling the emissions of CO2 from cementitious supplementary materials is required [5]. The accelerated carbonation of cement-based materials exhibited beneficial effects on the properties of cement paste [3]. The carbonation of ordinary Portland cement occurs via diffusion of CO2 into the pore matrix from the atmosphere, which reacts with calcium silicate hydrate (C-S-H) and calcium hydroxide (Ca(OH)2) to form calcium carbonate polymorphs and silica gel [6,7]. The formation of calcium carbonate (CaCO3) is described in Equations (1)–(3) [5,7,8].
CO2 + H2O → CO32− + 2H+
Ca(OH)2 → Ca2+ + 2OH
Ca2+ + 2CO32− → CaCO3
The accelerated carbonation of the concrete occurs during the curing in CO2, where it reacts with anhydrous minerals of cement and forms solid CaCO3 [9]. The hardening of the concrete process is therefore expedited, which enhances its durability [9]. The diffusion of CO2 in hardened cement paste is affected by the types and amount of cement, porosity, types and quantities of supplementary cementitious materials, and curing conditions (i.e., temperature, humidity, time, and CO2 concentration).
Nowadays, researchers worldwide are looking for various methods to reduce CO2 emissions in the atmosphere. One of the methods includes the use of γ-C2S in concrete mixtures, which is able to uptake CO2 from the atmosphere. γ-C2S is the most stable crystal among five dicalcium silicate polymorphs (β-C2S, γ-C2S, α-C2S, α’L-C2S, and α’H-C2S) with negligible ambient temperature hydraulic activity [10,11]. γ-C2S is known as calico-olivine and is considered to be an ideal solution for low CO2 building materials because it has good CO2 absorption abilities and is environmentally friendly [12,13]. Numerous new eco-type γ-C2S-based cementitious systems have been explored to reap the benefits of its high carbonation reactivity [10]. Higuchi et al. have found a zero CO2 emission concrete (i.e., CO2-SUICOM), which mainly contains γ-C2S and fly ash, and exhibits greater mechanical properties compared with ordinary concrete [14]. Nonetheless, decarburized slag is rich in γ-C2S and has the potential ability to produce concrete without cement [15]. On the other hand, ground granulated blast-furnace slag (GGBFS) is also one of the key by-products of the steel sector, which can substitute cement in concrete mixtures due to its possible hydraulicity [16]. GGBFS influences the long-term strength and decreases the hydration heat attributed to its pozzolanic activity [16,17]. GGBFS can also produce green and sustainable concrete [18].
As aforementioned, GGBFS has been used as a partial replacement to cement in concrete as sustainable development [16]. Moreover, γ-C2S has the ability to uptake CO2 from the atmosphere, and thus, it can be used in concrete mixtures to partially replace GGBFS content. Numerous studies have exclusively researched the impacts of carbonation on cement paste [19,20], supplementary cementitious materials [21,22], and γ-C2S-based cement [1,10,23]. It can be noted that there is no study on the simultaneous effect of GGBFS and γ-C2S under accelerated carbonation conditions. Therefore, the effects of γ-C2S on the compressive strength of GGBFS mortar cured in natural and accelerated carbonations have been investigated in the present study. A detailed mechanism for the improvement of compressive strength of γ-C2S added to GGBFS mortar and hydration products of paste in natural and accelerated conditions are thoroughly discussed, and the results have been corroborated with a scanning electron microscopy (SEM), X-ray diffraction (XRD), Fourier transform-infra red (FT-IR), and thermal stability by thermogravimetry analysis (TGA).

2. Materials and Methods
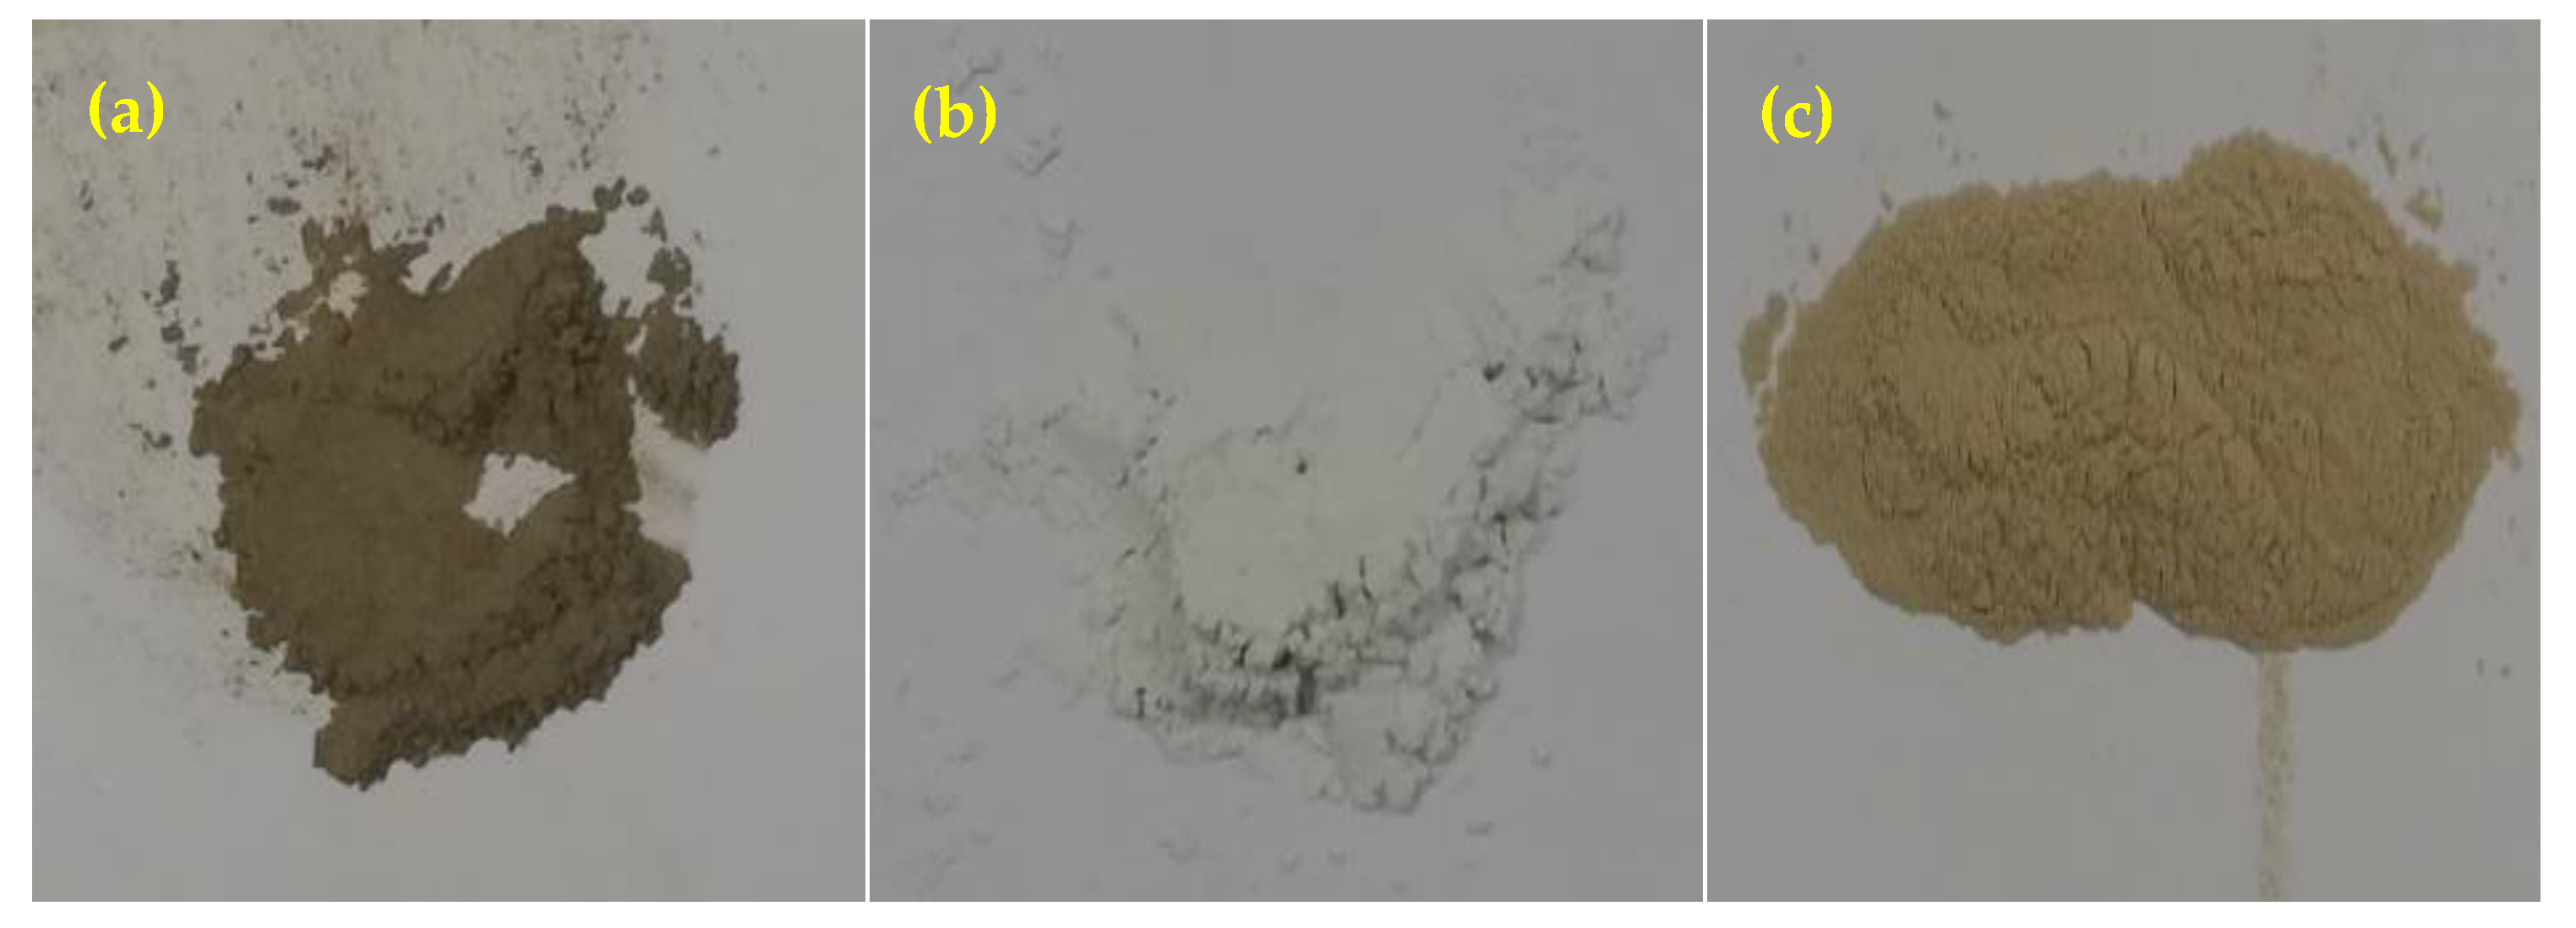
2.1. Materials

2.1.1. Synthesis of γ-Dicalcium Silicate (γ-C2S)

Analytical grade CaCO3 and SiO2 powder were taken for the synthesis of γ-C2S. The ratio of Ca/Si was fixed at 2:1 for blending. Thereafter, they were kept for calcination in a muffle furnace. The synthesis was carried out in three steps: heating, sintering, and cooling. The heating was carried out up to 1450 °C at 10 °C/min and held at this temperature for 2 h (sintering) [24,25]. Finally, the cooling of the samples was carried out at room temperature. In this process, a series of calcium silicates were formed at different temperatures, which decompose from β-C2S to γ-C2S spontaneously upon cooling.

2.1.2. Mixture Proportions for the Preparation of Samples

Ordinary Portland cement (OPC), ground granulated blast-furnace slag (GGBFS), and γ-C2S were used as binders. The OPC was Type-I grade, having a density of 3.15 g/cm3. The densities of the GGBFS and γ-C2S were found to be 2.92 and 2.99 g/cm3, respectively. The appearance of the binders is shown in Figure 1. The OPC was gray in color (Figure 1a), owing to the presence of some unburnt carbon. The GGBFS showed white in color (Figure 1b), possibly due to the presence of a high content of alumina, which could be confirmed by chemical analysis. γ-C2S looked light brown in color (Figure 1c). The synthesized γ-C2S and GGBFS was milled and sieved through 150 µm before mixing in the mortar and paste.
Two sets of experiments were performed to investigate the effects of γ-C2S on the properties of GGBFS incorporated with mortar and paste. The first set of experiments was the preparation of mortar for compressive strength measurements, while the second was testing the paste for characterization (i.e., X-ray diffraction (XRD), Fourier transform-infra red (FT-IR), scanning electron microscopy (SEM), and thermogravimetric analysis (TGA)) after carbonation. The fine aggregate was sand, having a 2.65 g/cm3 density, and it was properly washed with distilled water to remove soluble impurities, and then dried prior to mixing into the mortars.
In the present study, three binders (OPC, GGBFS, and γ-C2S) were used. The mixture proportion of mortar and paste samples are shown in Table 1 and Table 2, respectively. We took a 0.55 ratio of water/binder (W/B) for the preparation of mortar and paste. The W/B was kept higher to facilitate the carbonation process easily [26]. From these tables, it can be seen that the OPC took 40% in all compositions, but the GGBFS and γ-C2S were varied. The amount of γ-C2S was set to be fixed to 0% (G0), 5% (G5), and 10% (G10), corresponding to the change in the amounts of GGBFS of 60%, 55%, and 50%, respectively.

2.1.3. Sample Preparation

Cubic molds, measuring 50 × 50 × 50 mm, of mortar samples were prepared for the compressive strength measurement, and of paste samples for characterization. The mixing process for the paste and mortar preparation was carried out according to ASTM C305 [27].

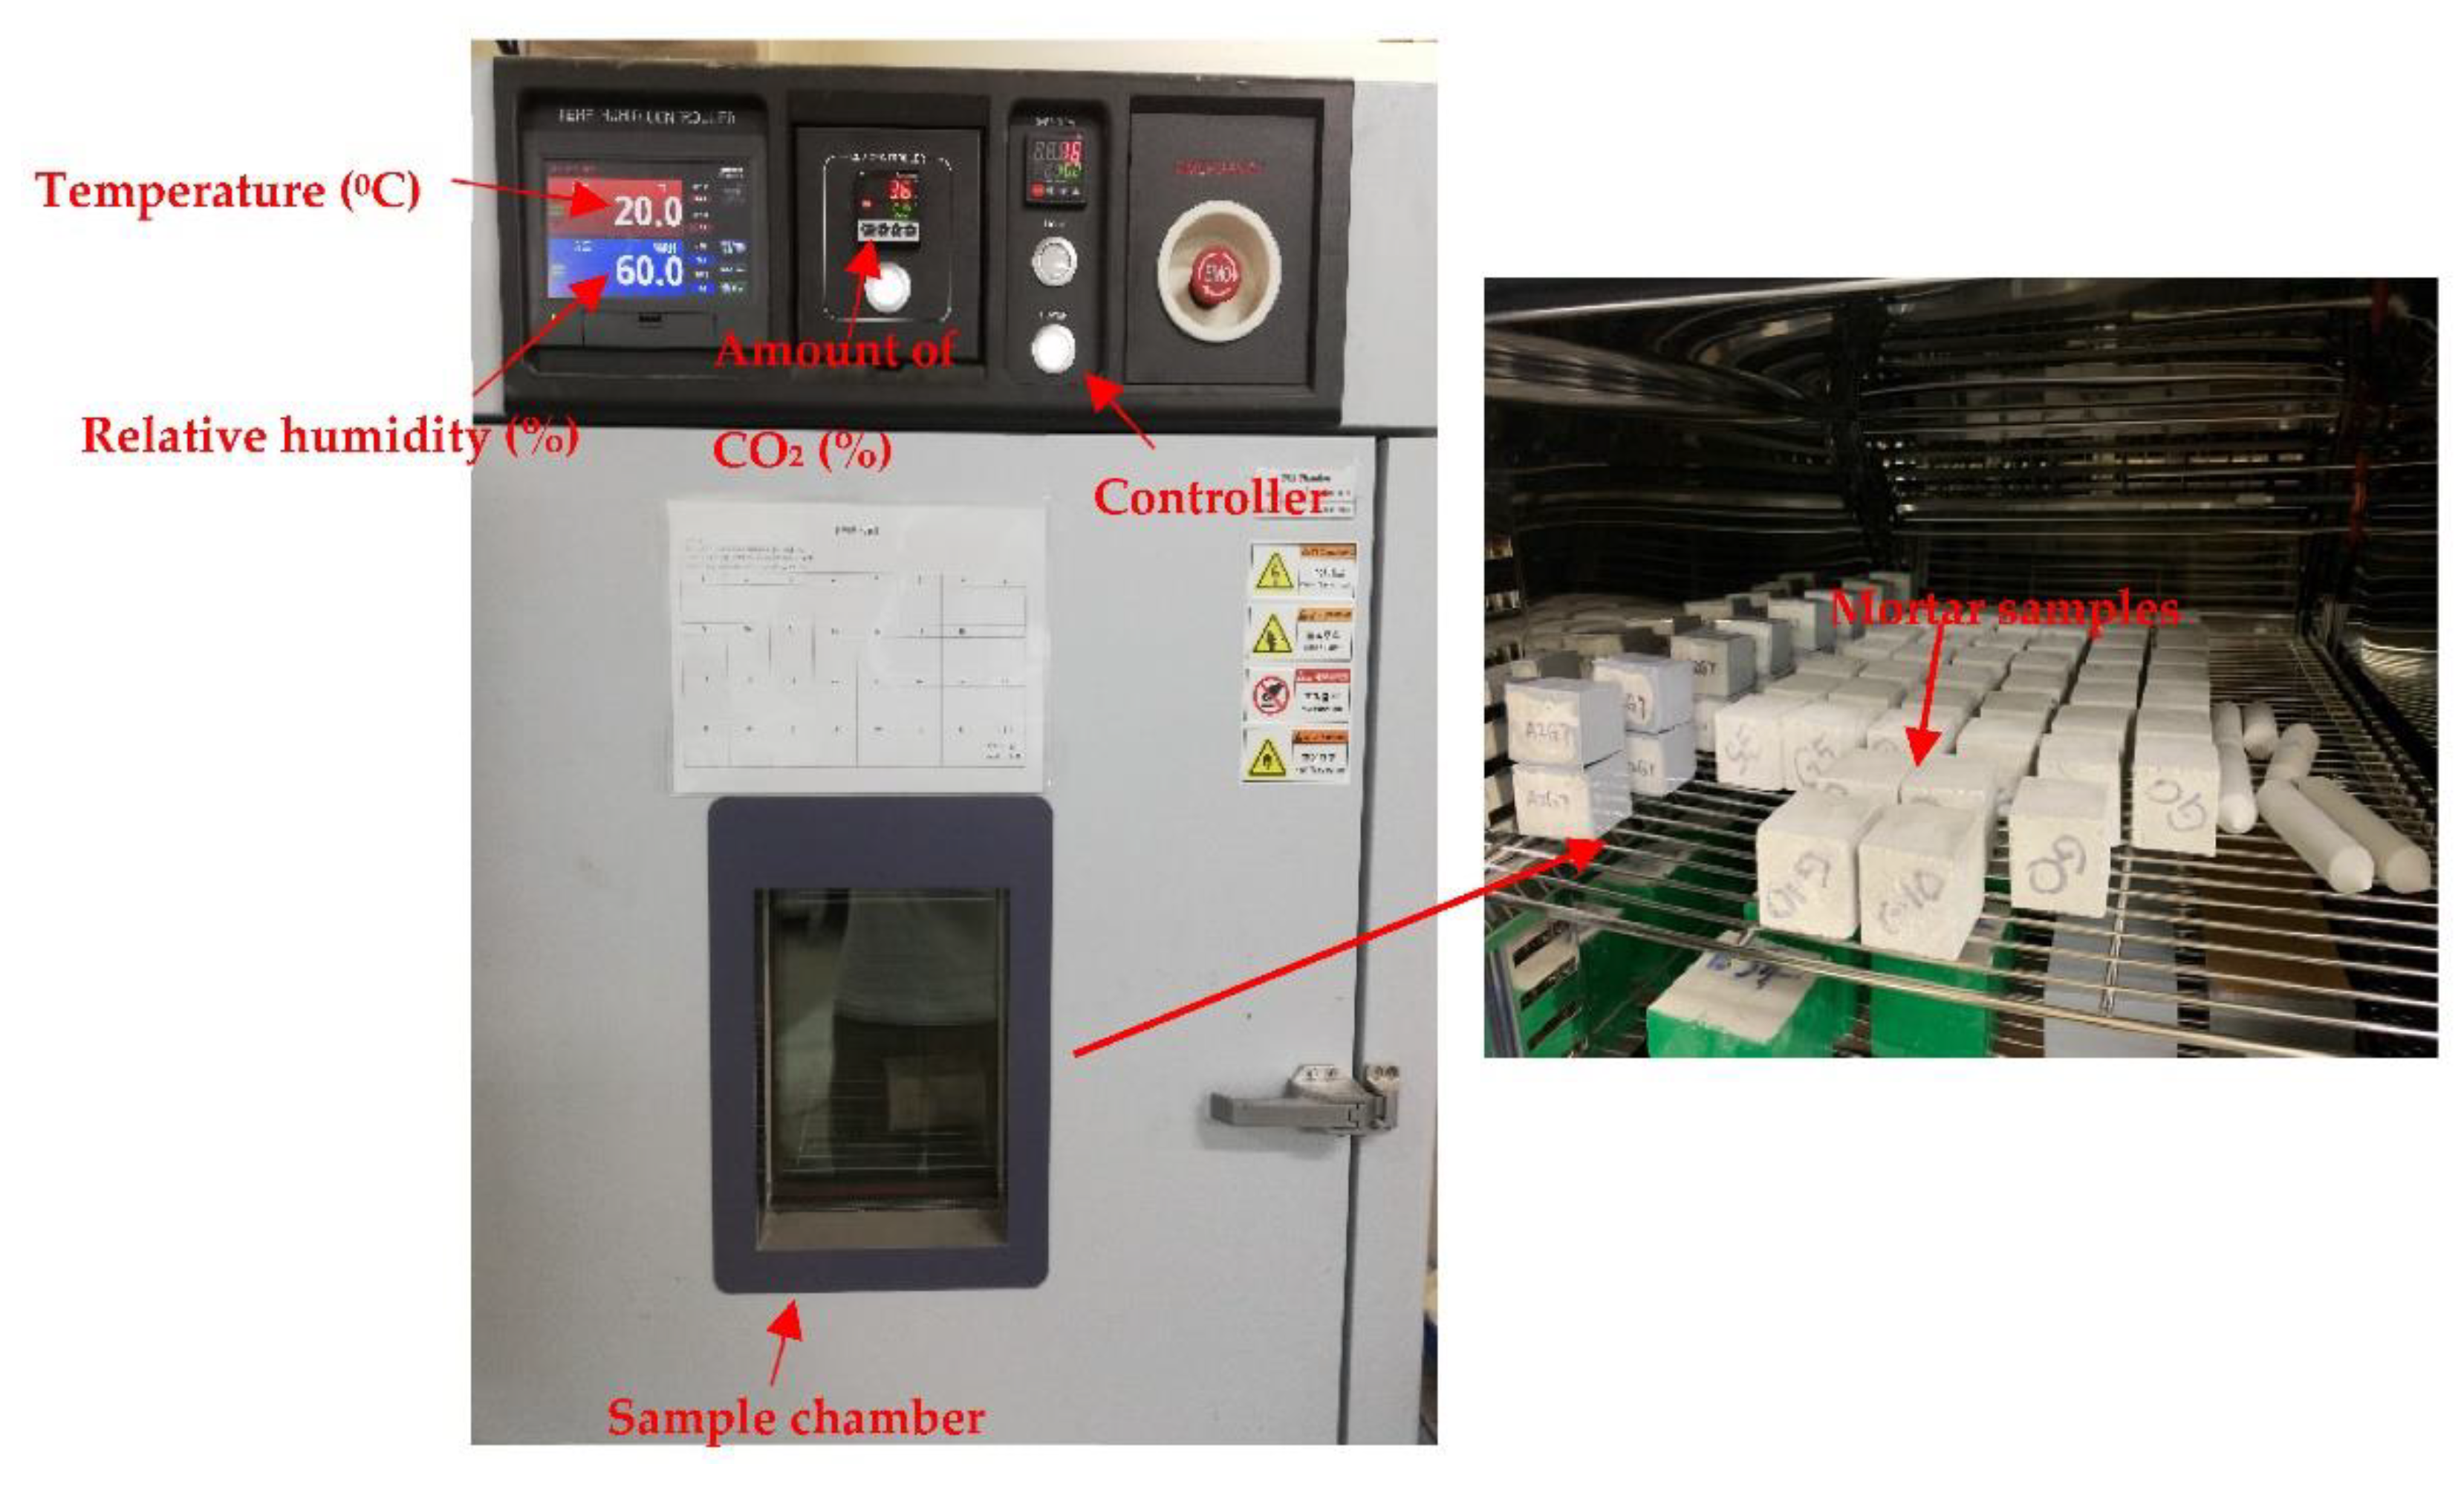
2.1.4. Accelerated Carbonation and Curing

Two types of curing (natural carbonation (NC) and accelerated carbonation (AC) curing) for mortar, as well as paste samples, were carried out. The NC curing was performed by keeping the mortar and paste samples in laboratory conditions; the temperature was 20 (±2) °C and the relative humidity was 60 (±5%) where there was approximately 0.03% CO2 present [28,29]. The accelerated curing happened in a carbonation chamber (Chom Dan Scientific Ind. Co., Seoul, Korea) for up to 28 days. The paste and mortar samples were kept in a carbonation chamber, as shown in Figure 2. The AC was performed by keeping the samples in 5% CO2 at 20 °C and 60% relative humidity, according to KS F2584 [30]. The details of the curing process and characterizations of the samples are illustrated in Table 3.

2.2. Sample Characterization

2.2.1. Compressive Strength

The compressive strength of 50 × 50 × 50 mm mortar samples was measured according to ASTM C109/C109M [31] by the 30 t class universal testing machine. An average loading rate of 80 kN/min was applied to determine the compressive strength of three consecutive samples after 14 and 28 days in different curing conditions, and the average was taken as the result.

2.2.2. Chemical Analysis of Binders

The oxide composition of all binders was performed by X-ray fluorescence (XRF: Axios, PANalytical, Almelo, The Netherlands).

2.2.3. X-ray Diffraction (XRD)

The mineralogical characterization of synthesized γ-C2S, GGBFS powder, and carbonated paste was carried out by XRD (Rigaku D/MAX-2500, Tokyo, Japan) using Cu Kα radiation (λ = 1.54059 Å), generated at 40 kV and 100 mA. The scan was carried out from 2θ = 10°–70° with a 0.0167° step size and 30 s per step. The volume fraction (%) of each was determined by JADE2016 software.

2.2.4. Fourier Transform Infrared Spectroscopy (FT-IR)

The FT-IR (PerkinElmer Spectrum, L160000A, Waltham, USA) was used to quantify the carbonated paste samples after 28 days of curing. The scan range was 4000 cm−1 to 400 cm−1 with a 4 cm−1 resolution.

2.2.5. Scanning Electron Microscope (SEM)

Surface morphology of the paste matrix after 28 days of NC and AC curing was performed by scanning electron microscope (SEM, MIRA3, TESCAN, Brno, Czech Republic), operated at 20 kV.

2.2.6. Thermogravimetric Analysis (TGA)

The weight loss of the carbonated paste sample was measured by TGA (DTG-60, Shimadzu, Japan). The temperature range was from room temperature to 1000 °C in an N2 atmosphere (20 mL/min) at a 10 °C/min constant heating rate.

3. Results and Discussion

3.1. Chemical Composition of Binders by XRF
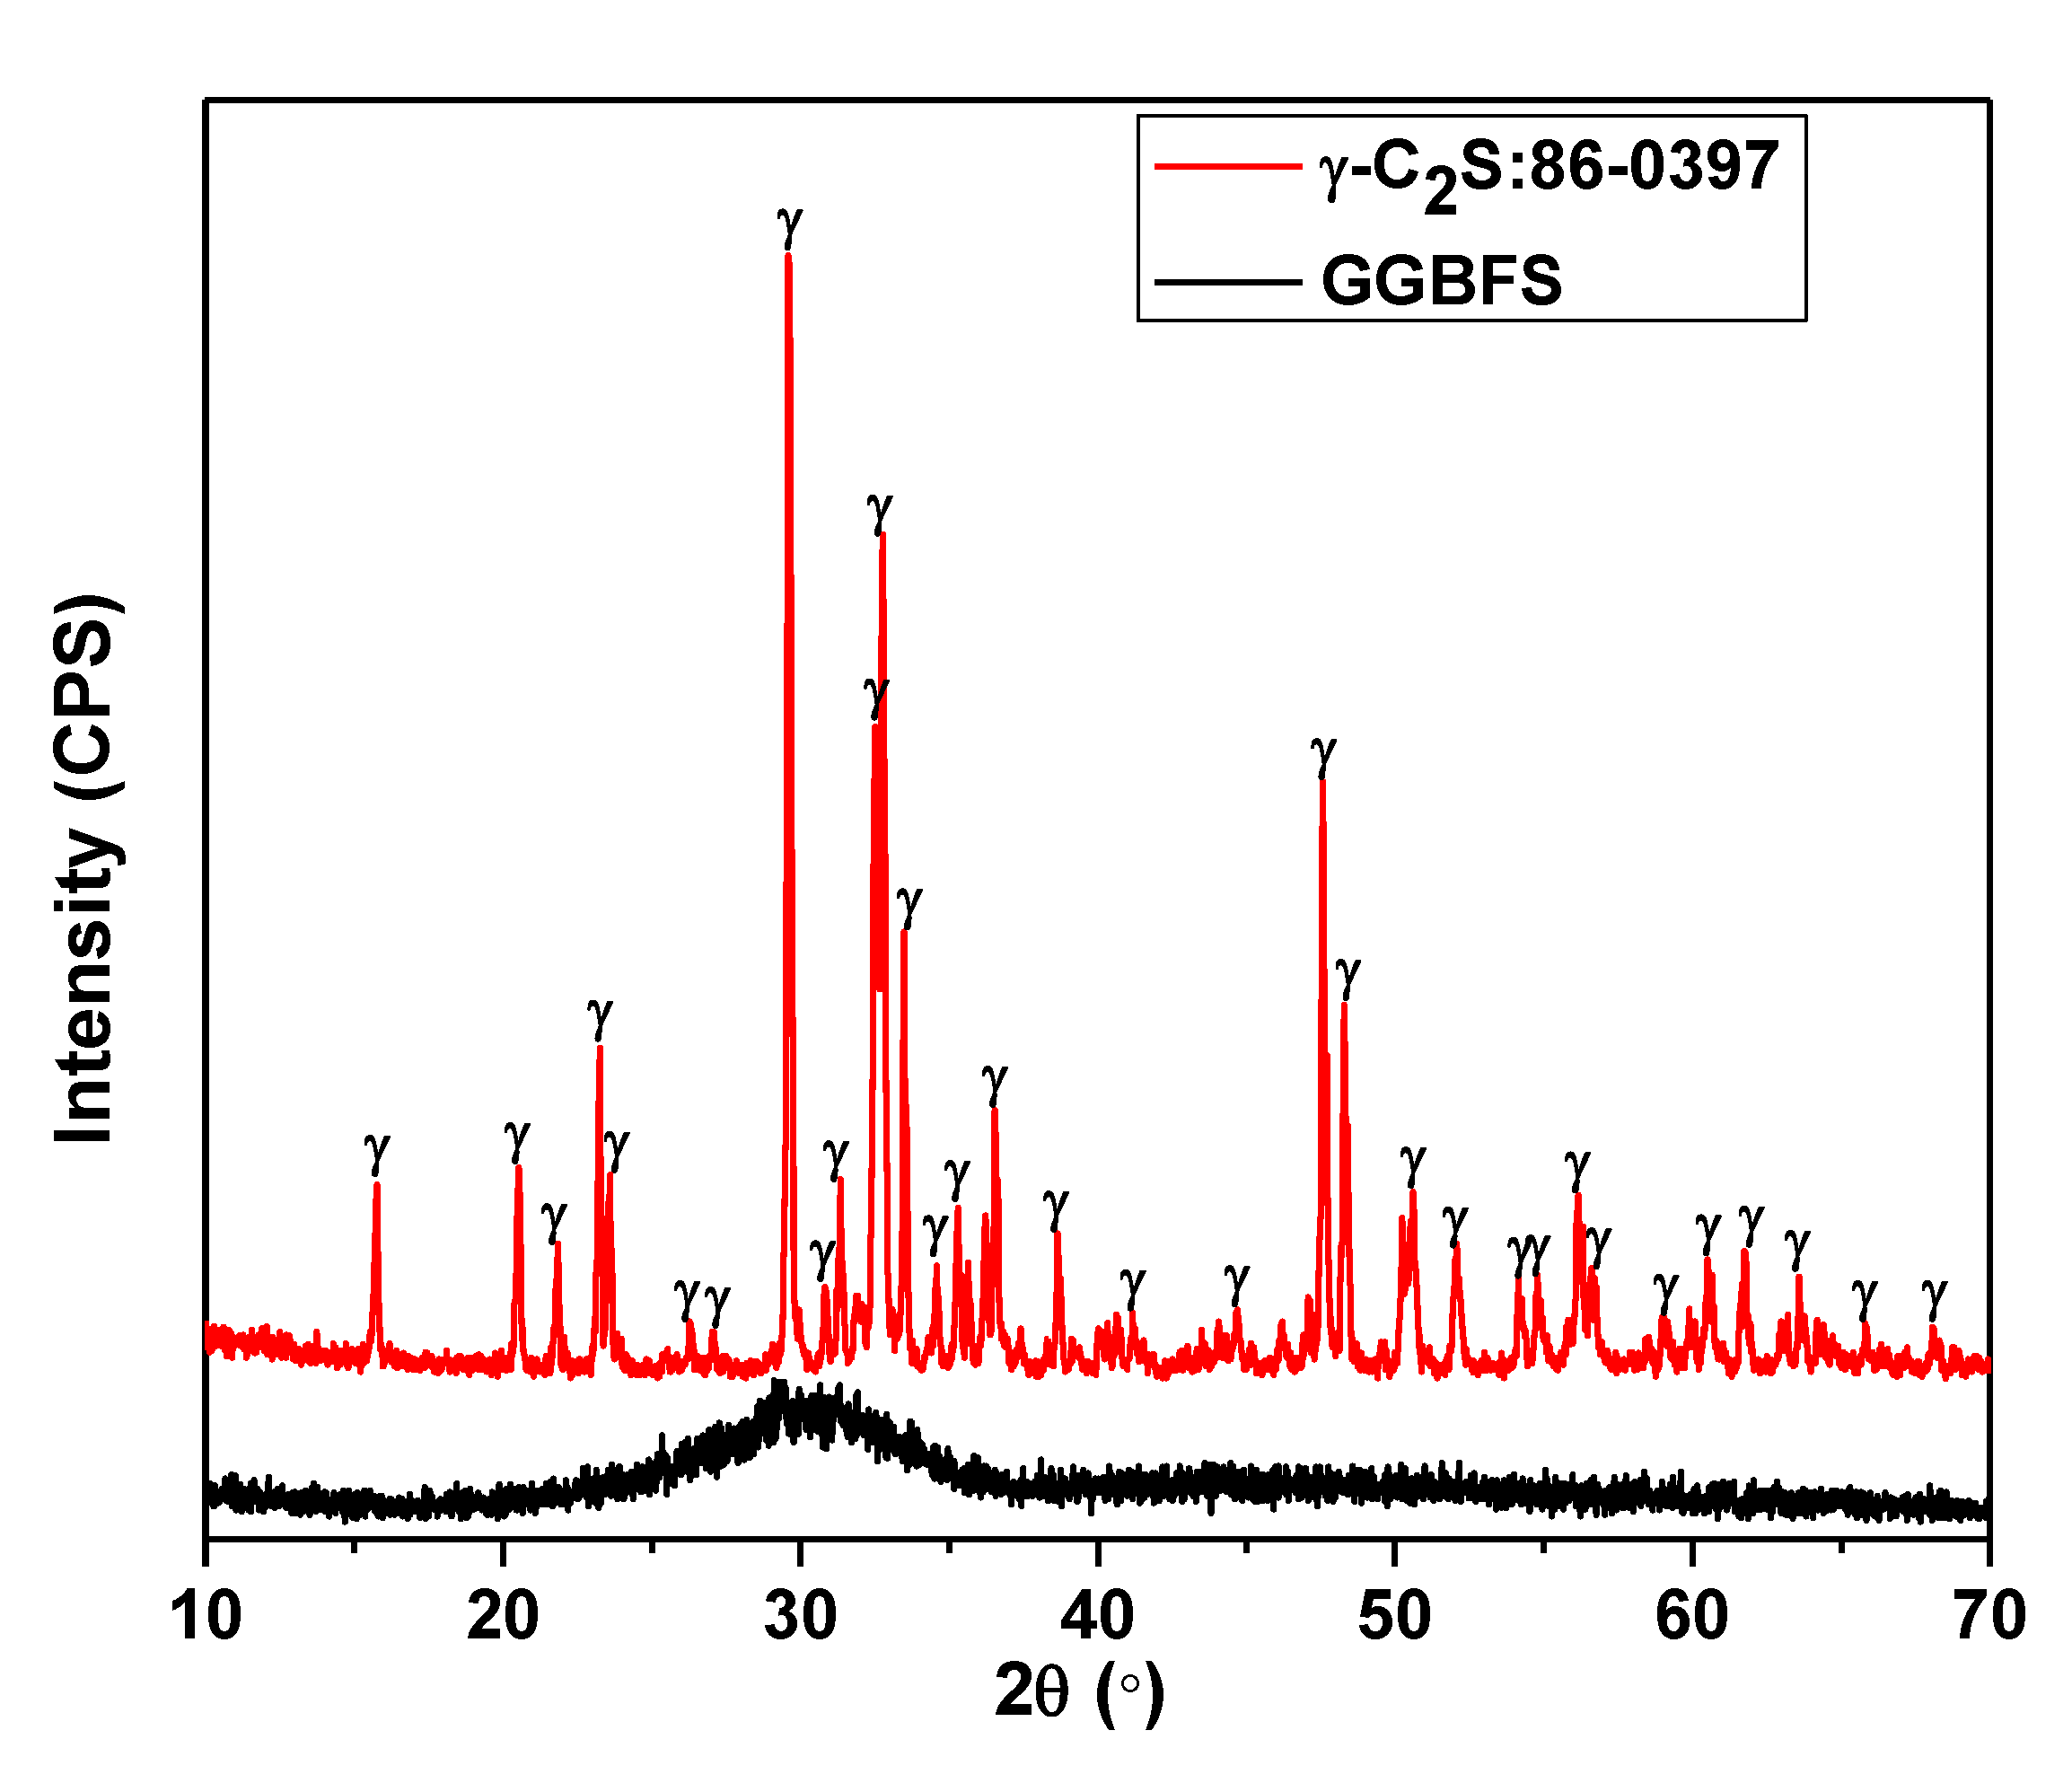
The chemical analysis of binders is shown in Table 4. From this table, it can be seen that the γ-C2S mostly contained CaO and SiO2 (94.73%), whereas the GGBFS and OPC exhibited 80.18% and 83.16%, respectively. However, the GGBFS contained a high amount of Al2O3 impurities (13.32%), due to the by-products of steel industries. The loss of ignition (LOI) in γ-C2S and GGBFS was much less, owing to the heating. The γ-C2S was produced by calcination up to 1450 °C, while the GGBFS was produced from the blast furnace, where the temperature was around 1300 °C, and thus, most of the carbon was burned. The OPC exhibited a 3.53% LOI, attributed to the presence of unburned carbon.

3.2. XRD of Binders

The XRF results (Table 4) show that the synthesized γ-C2S mostly contained CaO (68.92wt.%) and SiO2 (25.81wt.%). Therefore, it was required to confirm the mineralogical composition by XRD. Figure 3 shows the mineralogical composition of the γ-C2S and GGBFS. The XRD results confirmed the formation of γ-C2S (JCPDS: 86–0397) [32], whereas the GGBFS showed amorphous silica [6,33]. It was earlier reported by Mu et al. that if the Ca/Si ratio was 2:1 and treated at 1400 °C, then pure γ-C2S formed [10]. However, the synthesis of γ-C2S depends on different parameters, such as the types of CaCO3 [34] and heating temperatures. The γ-C2S formed from the transformation of β-C2S. It was observed that, up to 1300 °C, some amount of β-C2S still remained, but once the temperature increased up to 1400 °C, it was completely transformed into γ-C2S [34]. In the present study, we sintered it up to 1450 °C for 2 h, which lead to forming pure γ-C2S. Thus, we can say that our findings are in good agreement with Mu et al.’s work [10]. On the basis of the XRD results, it was important to determine the exact amount (%) of each of the phases present in the γ-C2S and GGBFS, using JADE software. It was calculated and found that synthesized γ-C2S showed 100%, while in the case of the GGBFS only amorphous silica was present.

3.3. Compressive Strength of Mortar

The compressive strength of the mortar samples is shown in Figure 4 at different curing conditions and durations. It can be seen from this figure that the NC mortar samples exhibited a lower compressive strength compared with the AC samples in all curing durations. In NC, there was no effect of carbonation rather than hydration. In this case, the mechanical properties were controlled by the hydration reaction rather than carbonation because the CO2 content was negligible in the open atmosphere. Moreover, once the 5% γ-C2S (G5) was added to the mortar, the compressive strength increased with curing duration in NC and AC conditions. However, it decreased in 10% γ-C2S (G10) compared with G0 in NC at 14 days and 28 days of curing. The decrease in compressive strength of 10% γ-C2S mixed mortar samples might be attributed either to unreactive CaO in the γ-C2S [34] or a higher porosity in the mortar matrix [13]. However, there was no appreciable improvement in the compressive strength after the addition of 5% γ-C2S in NC compared with G0, owing to the hydration reaction, rather than carbonation [35]. The concentration of CO2 was negligible in NC, which was not able to react with the γ-C2S and form CaCO3. In this case, the pozzolanic or hydration reaction was dominant, and thus, almost identical compressive strength was obtained by the G0 and G5 samples for all curing durations. However, once the mortar was cured in the carbonation chamber (AC), the compressive strength increased (Figure 4). The obtained compressive strength values of mortar samples cured in AC and NC were greater than those in Higuch et al. [14] and Yang et al. [17] works. After 14 days of AC curing, the compressive strength increased by 13.5% (G5) and 25.7% (G10), compared with 28 days of NC, owing to the formation of CaCO3, which reduced the pore size [35]. The formed calcium carbonate crystals were inclined to fill the pores of the cementitious matrix. In particular, the G5 samples achieved the highest value of compressive strength after AC, which might be owing to the lowest pore volume. Moreover, γ-C2S-incorporated mortar samples (G5 and G10) exhibited higher compressive strength compared with G0 in AC for all curing durations. Nevertheless, as the curing duration extended up to 28 days, there was no significant improvement in compressive strength compared with 14 days. This result suggests that the compressive strength of γ-C2S-incorporated mortar exhibit early improvement owing to the reaction of γ-C2S with CO2, resulting in the formation of CaCO3, while a longer duration of curing was dominated by the hydration reaction [35]. It was reported that γ-C2S-incorporated samples usually require 10 days to get their final strength [36,37]. Thus, with a longer duration of curing, there was no significant improvement in compressive strength. The hydration reaction occurred via the formation of calcium-silicate-hydrate (C-S-H) gel, while the γ-C2S could not react with water, and leaching of Ca2+ ions was less at a low temperature (i.e., 20 °C), and thus, CaCO3 was generated [38]. The γ-C2S reacted with CO2 and formed CaCO3, which filled the pores of the mortar matrix and increased the compressive strength at an early age of curing [35].

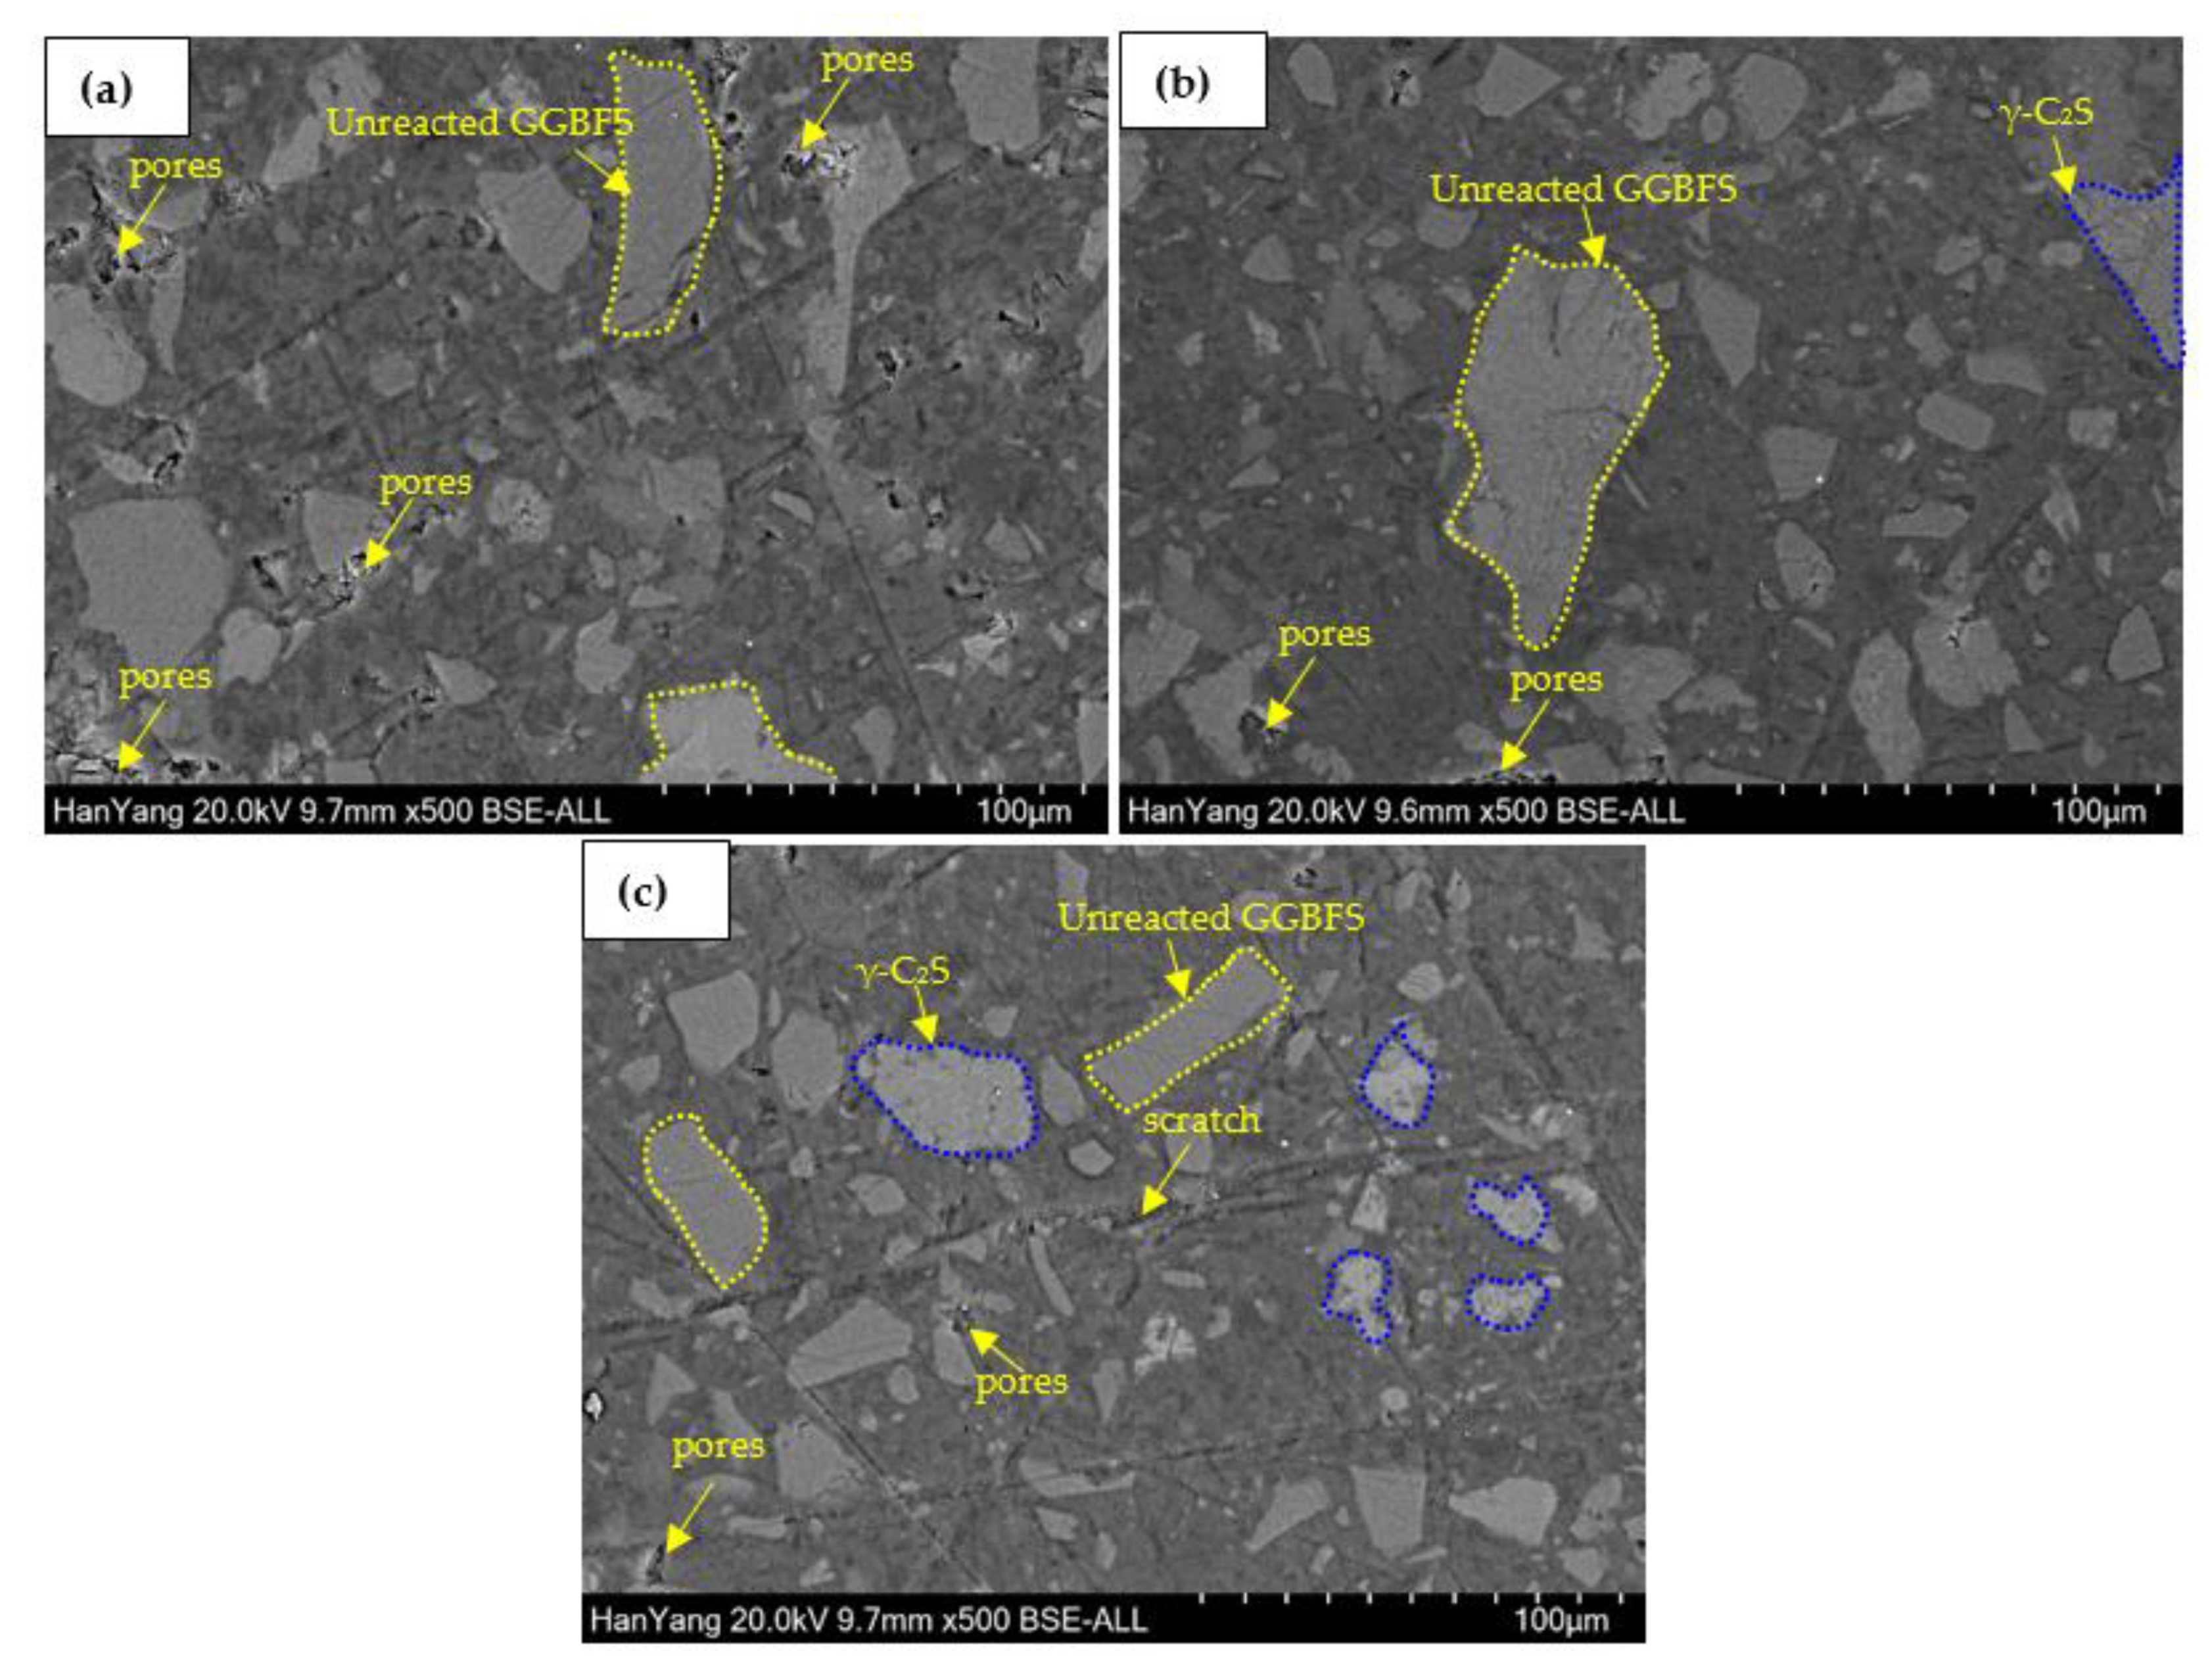
3.4. SEM of Paste after Carbonation

On the basis of compressive strength, it was required to analyze the morphology of the polished paste samples. The polishing of the paste samples was carried out by emery paper up to a 1200 µm size. The back-scattered electron (BSE) SEM images of NC and AC paste samples after 28 days of curing are shown in Figure 5 and Figure 6, respectively. It can be seen from Figure 5a that there were many pores, along with unreacted GGBFS, in white color. Some scratch marks were present on the surfaces, owing to the polishing of paste samples. The size of unreacted GGBFS in G0 (Figure 5a) was different. However, once the 5% and 10% γ-C2S was added, the number of pores decreased significantly. The porosity was calculated by ImageJ software and was found to be 4.24%, 0.83%, and 1.76% for G0, G5, and G10, respectively. Once the amount of γ-C2S increased from 5% to 10%, the unreacted γ-C2S led to retain porosity. The porosity was significantly reduced in G5 samples owing to the reaction of γ-C2S with CO2, and led to forming the CaCO3, which filled the porosity. From Figure 5 and Figure 6, it can be illustrated that different color zones were observed. The white areas are mostly unreacted GGBFS, which correlates with Figure 1b, where the GGBFS particles are white in color. The unreacted GGBFS was found to be in all samples of NC (Figure 5) and AC (Figure 6). The gray area represents the unreacted γ-C2S in G5 (Figure 5b) and G10 (Figure 5c). The amount of unreacted γ-C2S in G10 (Figure 5c) was higher compared with G5 (Figure 5b), owing to the higher added amount. Consequently, it can be seen that the amount of CO2 in NC was negligible, and thus, the γ-C2S remained in an unreacted state, attributed to less solubility in water than in CO2 in the atmosphere [38]. Thus, the compressive strength of G0 and G5 after 28 days of NC curing was identical, whereas once the amount of γ-C2S increased more than 5%, the compressive strength decreased (Figure 4), which was attributed to the unreacted γ-C2S in the matrix of the mortar [34]. The medium gray color in Figure 5 is attributed to the presence of carbonated products [10]. The visual observations in the G5 samples (Figure 5b) reveal the greater area of carbonated products compared with others.
A noticeable difference is observed in the SEM images of the AC samples (Figure 6) compared with NC after 28 days of curing. Figure 6a shows the SEM image of G0, where unreacted GGBFS particles were smaller compared with NC, owing to the dissolution in accelerated conditions (CO2 curing). Due to the dissolution of GGBFS, the porosity was found to be 2.07%, which was reduced by more than two times compared with NC. The medium gray color reveals the carbonated area in all samples [10]. From Figure 6b, it can be seen that the unreacted γ-C2S was extremely low, which confirms that most of the γ-C2S reacted and formed CaCO3, and thus, compact and negligible porosity (0.14%) were observed, which confers the enhancement of compressive strength of mortar after 28 days of AC curing. Due to the high amount of unreacted γ-C2S in G10, the porosity slightly increased to 0.49% compared with G5, which led to forming pores in the samples, and thus, the reduction in compressive strength was observed (Figure 4). It is observed from Figure 5 and Figure 6 that if the γ-C2S amount increased more than 5%, the unreacted γ-C2S remained in the samples and formed the cracks and pores which led to reducing the compressive strength of NC, as well as AC, after 28 days of curing. It can be seen from Figure 6c that unreacted γ-C2S was covered by SiO2 gel and the pores were filled with CaCO3 [1,2].

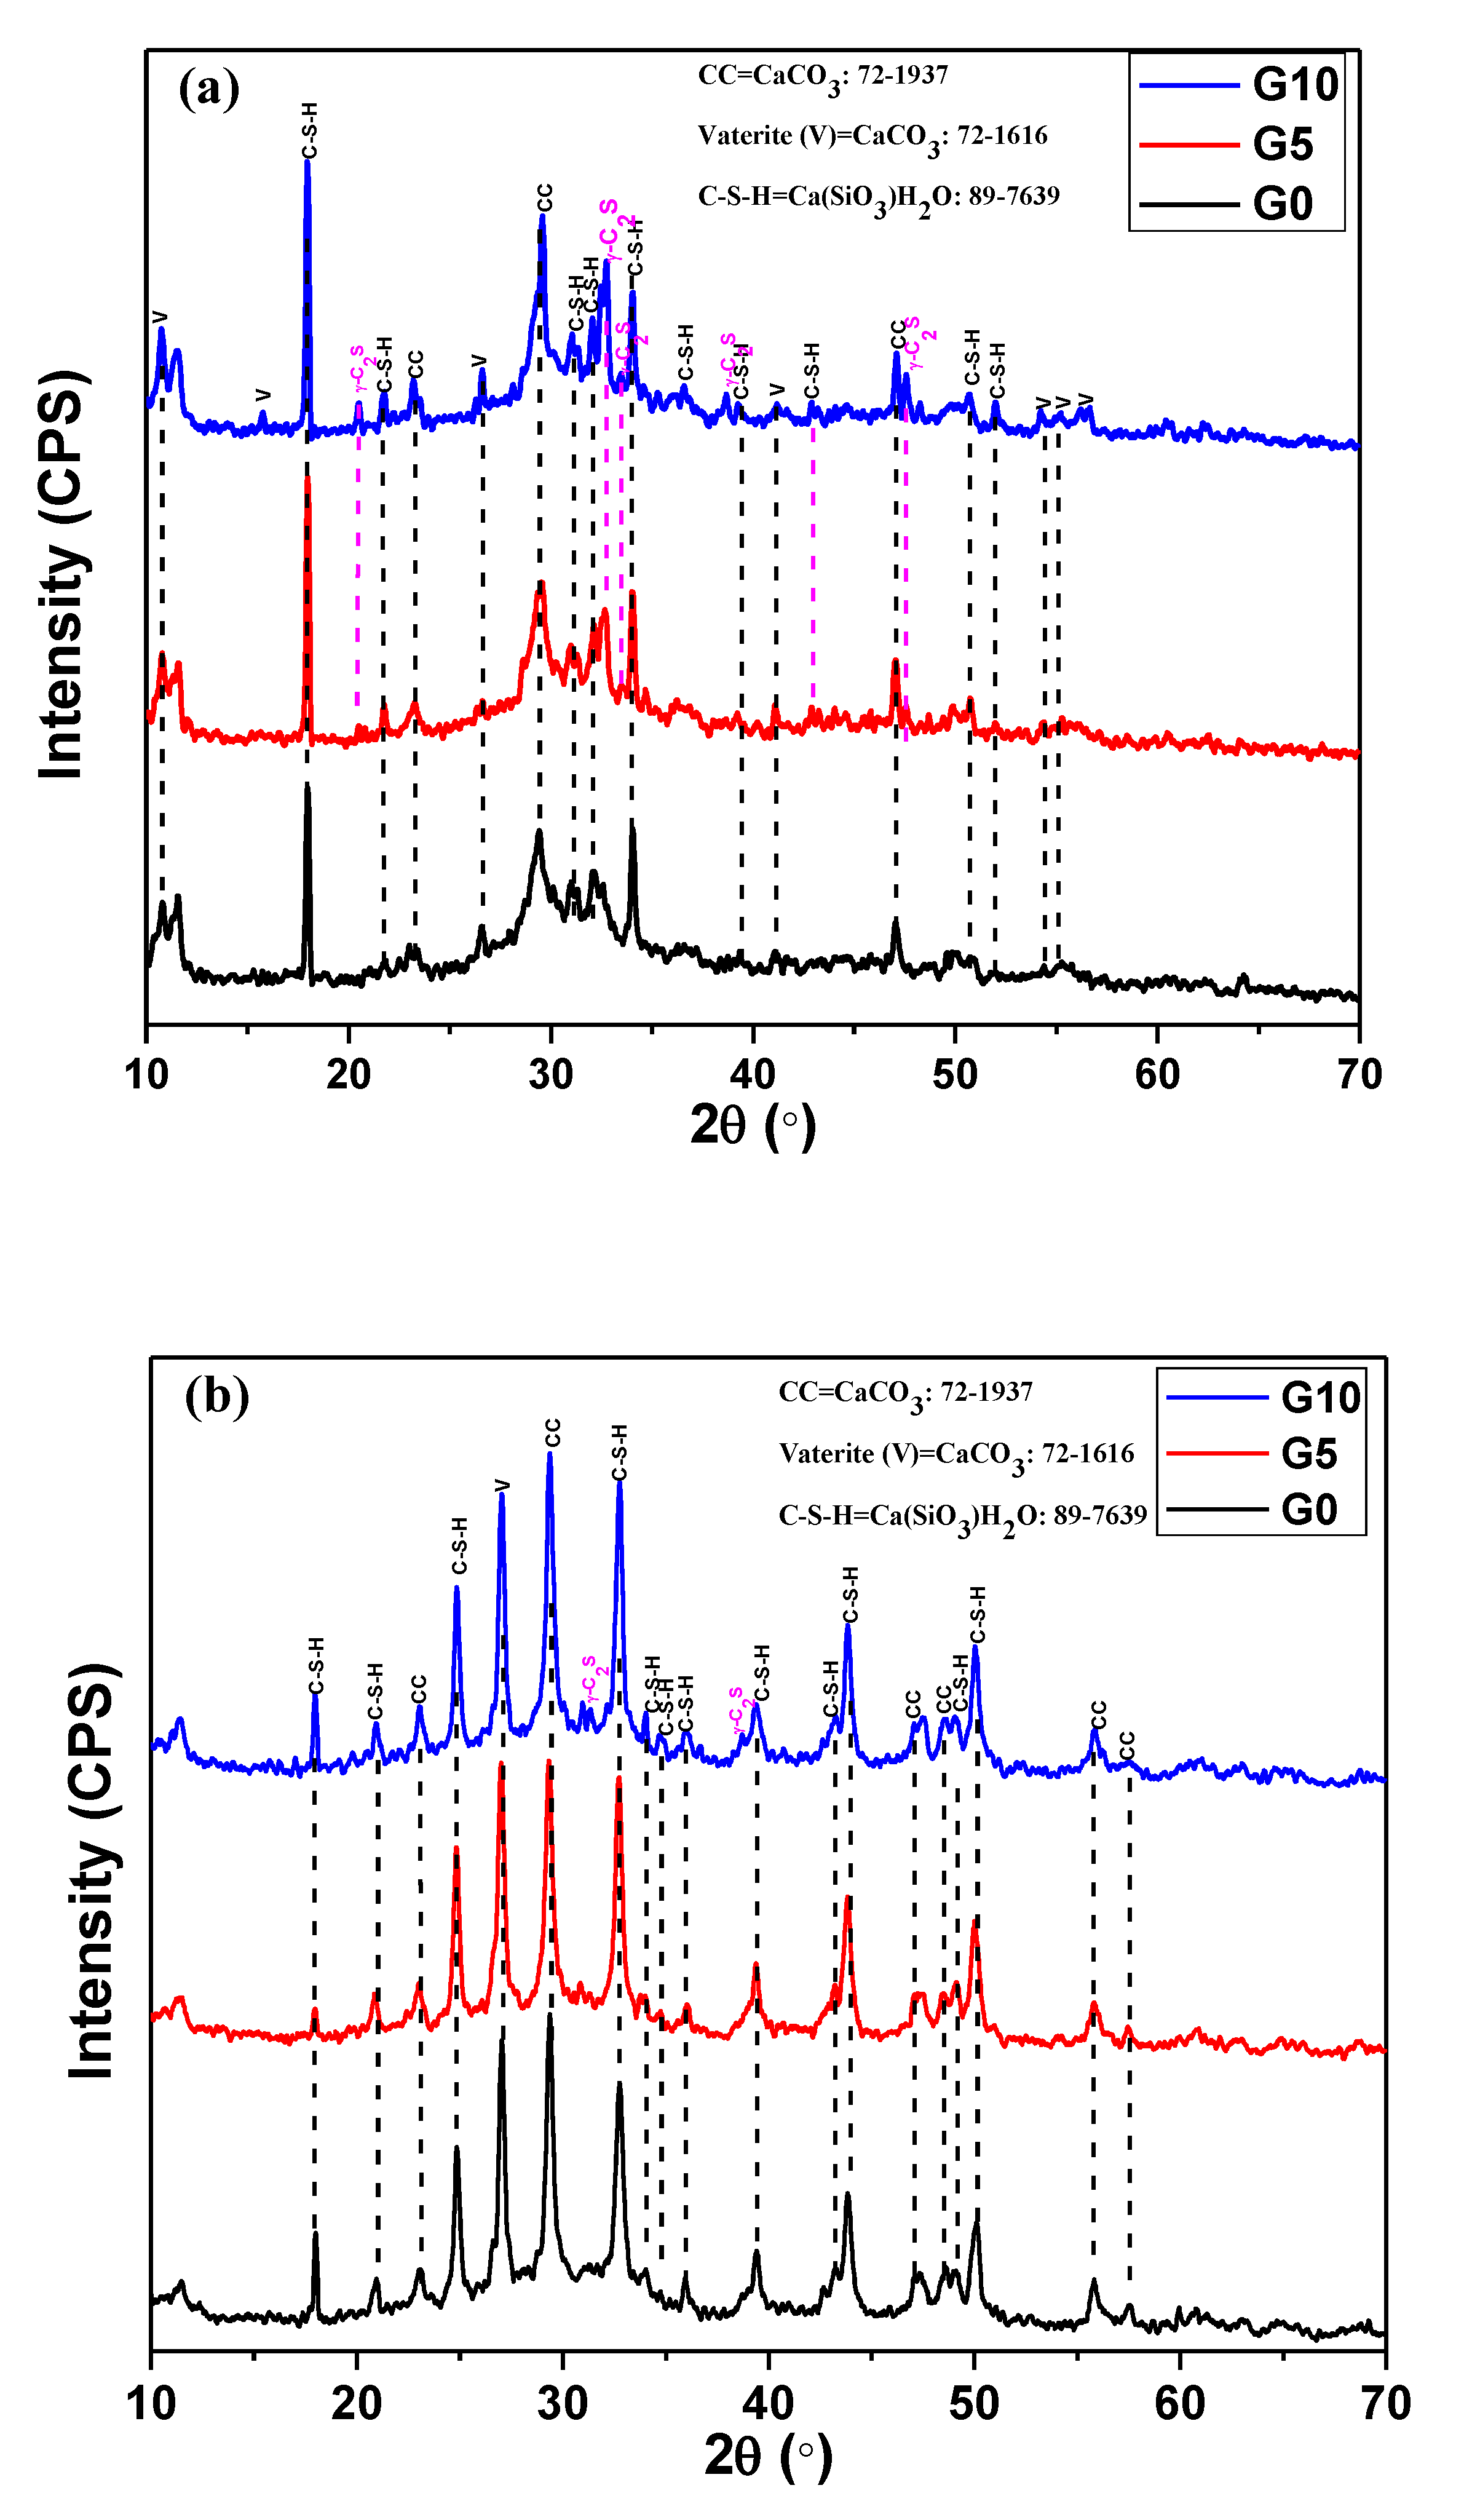
3.5. XRD of Paste after Carbonation

XRD of the hydration products after 28 days of NC and AC curing are shown in Figure 7a and Figure 7b, respectively. It can be seen from Figure 7a that G0, G5, and G10 exhibited a presence of calcium-silicate-hydrate (C-S-H: JCPDF: 89–7639), as well as two types of carbonate: stable calcite/calcium carbonate (CC: CaCO3, JCPDF: 72–1937) and metastable Vaterite (V: CaCO3, JCPDF: 72–1616) [39,40]. An amorphous peak was observed in G0 samples cured in NC (Figure 6a) and AC (Figure 6b) around 2θ = 27–33°, attributed to the presence of unreacted GGBFS. This result corroborates the XRD of bulk GGBFS, as shown in Figure 3. The samples cured in NC conditions exhibited the presence of γ-C2S in G5 and G10 samples, owing to the presence of unreacted parts, which are also observed in the SEM images of Figure 5b and Figure 5c, respectively. However, the intensity and number of γ-C2S peaks in G5 were lower than in G10 (Figure 7a). From Figure 7a, it can be seen that the relative intensity ratio (RIR) of C-S-H was the highest, and dominated compared with CC and V in the G0 sample, attributed to the proper hydration (slag hydration reaction and pozzolanic reaction) where plenty of amorphous silica was present. Moreover, when comparing the RIR of V with CC, it is greater than CC. However, in the samples prepared with 5% γ-C2S (G5), the RIR of CC was greater, meaning it dominated over V, owing to the consumption of γ-C2S in the formation of CC [41]. Therefore, the XRD results of the G5 samples cured in NC exhibited greater RIR of CC compared with V. Once the amount of γ-C2S increased up to 10% (G10), the unreacted amount of γ-C2S remained higher in samples compared with G5, attributed to less availability of CO2 to react in NC curing, which can be easily seen in the SEM image (Figure 5c). Some studies have reported that γ-C2S requires an alkali environment for its activation process, whereas the GGBFS in the G5 samples partly met the activator demand, which contributed to the mechanical properties [42,43]. Thus, the compressive strength of the mortar decreased (Figure 4).
The XRD pattern of G0, G5, and G10 samples cured in AC are shown in Figure 7b. It can be seen from this figure that the main phases (C-S-H, CC, and V) remained the same, as observed in NC conditions. It can be seen from this figure that the G5 sample did not exhibit any unreacted γ-C2S, which infers that during carbonation in AC conditions, almost all γ-C2S reacted and formed CC and V. However, it can be seen from the SEM (Figure 6b) that a much less amount of γ-C2S was present in the matrix, which cannot be detected by XRD. The RIR of C-S-H in the G0 sample decreased once cured in AC, compared with NC, owing to the formation of CC and V, which participated in overall RIR. This result suggests that in AC conditions, hydration and carbonation reactions occur simultaneously. Thus, the compressive strength of AC samples was greater than NC in the G0 sample (Figure 4), which made the compact matrix of mortar and reduced the porosity. The RIR of CC and V increased in all composition mixtures of samples cured in AC conditions, owing to a greater amount of CO2. Therefore, the compressive strength of G5 and G10 in AC was greater than G0 after 28 days of curing (Figure 4). Due to the addition of a higher amount (10% γ-C2S; G10 samples), some unreacted parts remained, as observed in XRD (Figure 7b), which caused the interference in compressive strength. Thus, a lower value was observed compared with G5. This result suggests that anything greater than 5% γ-C2S is not able to completely react until 28 days of curing. It is suggested to either increase the concentration of CO2 or curing duration. However, it was earlier observed that 10 days is the optimum curing duration, where a maximum amount of γ-C2S reacts with CO2 and forms CC or V [36,37]. There is a possibility that if the concentration of CO2 is increased then the maximum amount of γ-C2S reacts and forms CC or V, which fills the pores of concrete or mortar matrix, resulting in higher compressive strength.
The quantitative evaluations of each phase were determined by JADE software, and the results are shown in Table 5. Of the samples cured in NC condition, the C-S-H was found to be the maximum in G0, compared with G5 and G10, owing to the existence of a higher amount of GGBFS, which mostly contained amorphous silica and influenced the pozzolanic activity. The presence of amorphous silica led to the enhancement of the hydration reaction, resulting in a higher amount of hydration products (i.e., C-S-H), rather than carbonation products. However, some CC and V peaks were also found, owing to the atmospheric carbonation, which cannot be neglected during natural curing. It can be seen that once the γ-C2S was added, the amount of C-S-H decreased and unreacted γ-C2S increased in NC conditions. The CC was found to be the maximum in G5, and thus, the highest compressive strength was observed in this sample, as shown in Figure 4. The unreacted γ-C2S found to be remaining in G5 and G10, owing to less availability of CO2 in NC conditions. The γ-C2S was only reactive in the presence of CO2 rather than water [38]. On the contrary, it can be seen that once the sample cured in AC conditions, the CC volume faction increased up to 50.75% in G5, which suggests that the maximum amount of γ-C2S reacted with CO2 and formed CC. The absence of γ-C2S in the G5 sample indicates that all the γ-C2S reacted and formed the CC and V, which significantly filled the matrix of mortar, resulting in a reduction of porosity and increased the compressive strength. The G0 sample showed a reduction in C-S-H and an increase in CC and V amounts, compared with NC conditions, attributed to the hydration and carbonation reactions, simultaneously. Once the amount of γ-C2S increased up to 10%, the unreacted part remained in cement paste. Therefore, a lower CC amount was obtained compared with G5, but the V was greater than with G5. However, V is metastable and can be transformed into CC, which is very stable if the curing duration is increased [13,44].

3.6. FT-IR of Paste After Carbonation

The mineralogical analysis of the paste samples after 28 days of NC and AC curing by FT-IR in the range of 4000–400 cm−1 are shown in Figure 8a and Figure 8b, respectively. It can be seen from Figure 8 that the weak absorption peak at around 3380 cm−1 represents the vibrational bending band of O-H in H2O molecules [26]. The peaks around 874 cm−1 and 1400 cm−1 correspond to the C-O bending and stretching vibration of carbonated phases [45,46,47]. However, it can be seen from Figure 8a that the shifts are found to be at 870 cm−1 and 1380 cm−1, attributed to the lower carbonation activity in NC, while in the case of AC curing, it is shifted towards a higher wave number (875 cm−1 and 1420 cm−1) (Figure 8b), owing to the formation of CC, which is in agreement with Lee et al.’s work [26]. Moreover, can clearly be observed that the CO32− peak shifts in AC samples were intense compared with NC, especially the G5 samples, attributed to the complete carbonation. This observation corroborates the SEM (Figure 6) and XRD (Figure 7b) results, where the surface was compact with the least porosity and intense CC peaks, respectively. This result confirms that 5% γ-C2S is the optimum amount, where complete carbonation occurred after 28 days of AC curing and formed CC. It was reported that the band at approximately 950 cm−1 was assigned to Si–O, stretching the vibration of the Q2 tetrahedron and indicating the silicate vibration regions of C-S-H [47,48,49]. The NC curing samples exhibited C-S-H peaks at 1645 cm−1 (Figure 8a), whereas this peak is absent in AC. In NC curing, both hydration and slightly carbonation (due to atmospheric CO2) participated, while in the case of AC only, the carbonation reaction dominated. Thus, the strongest peak of CO32− was observed in AC conditions. There was a peak shift in Si-O from 955 cm−1 (Figure 8a) to 1012 cm−1 (Figure 8b) after AC curing, being ascribed to the decalcification of C-S-H caused by the difference in the Ca:Si ratio, leading to the higher wave number shift [11].

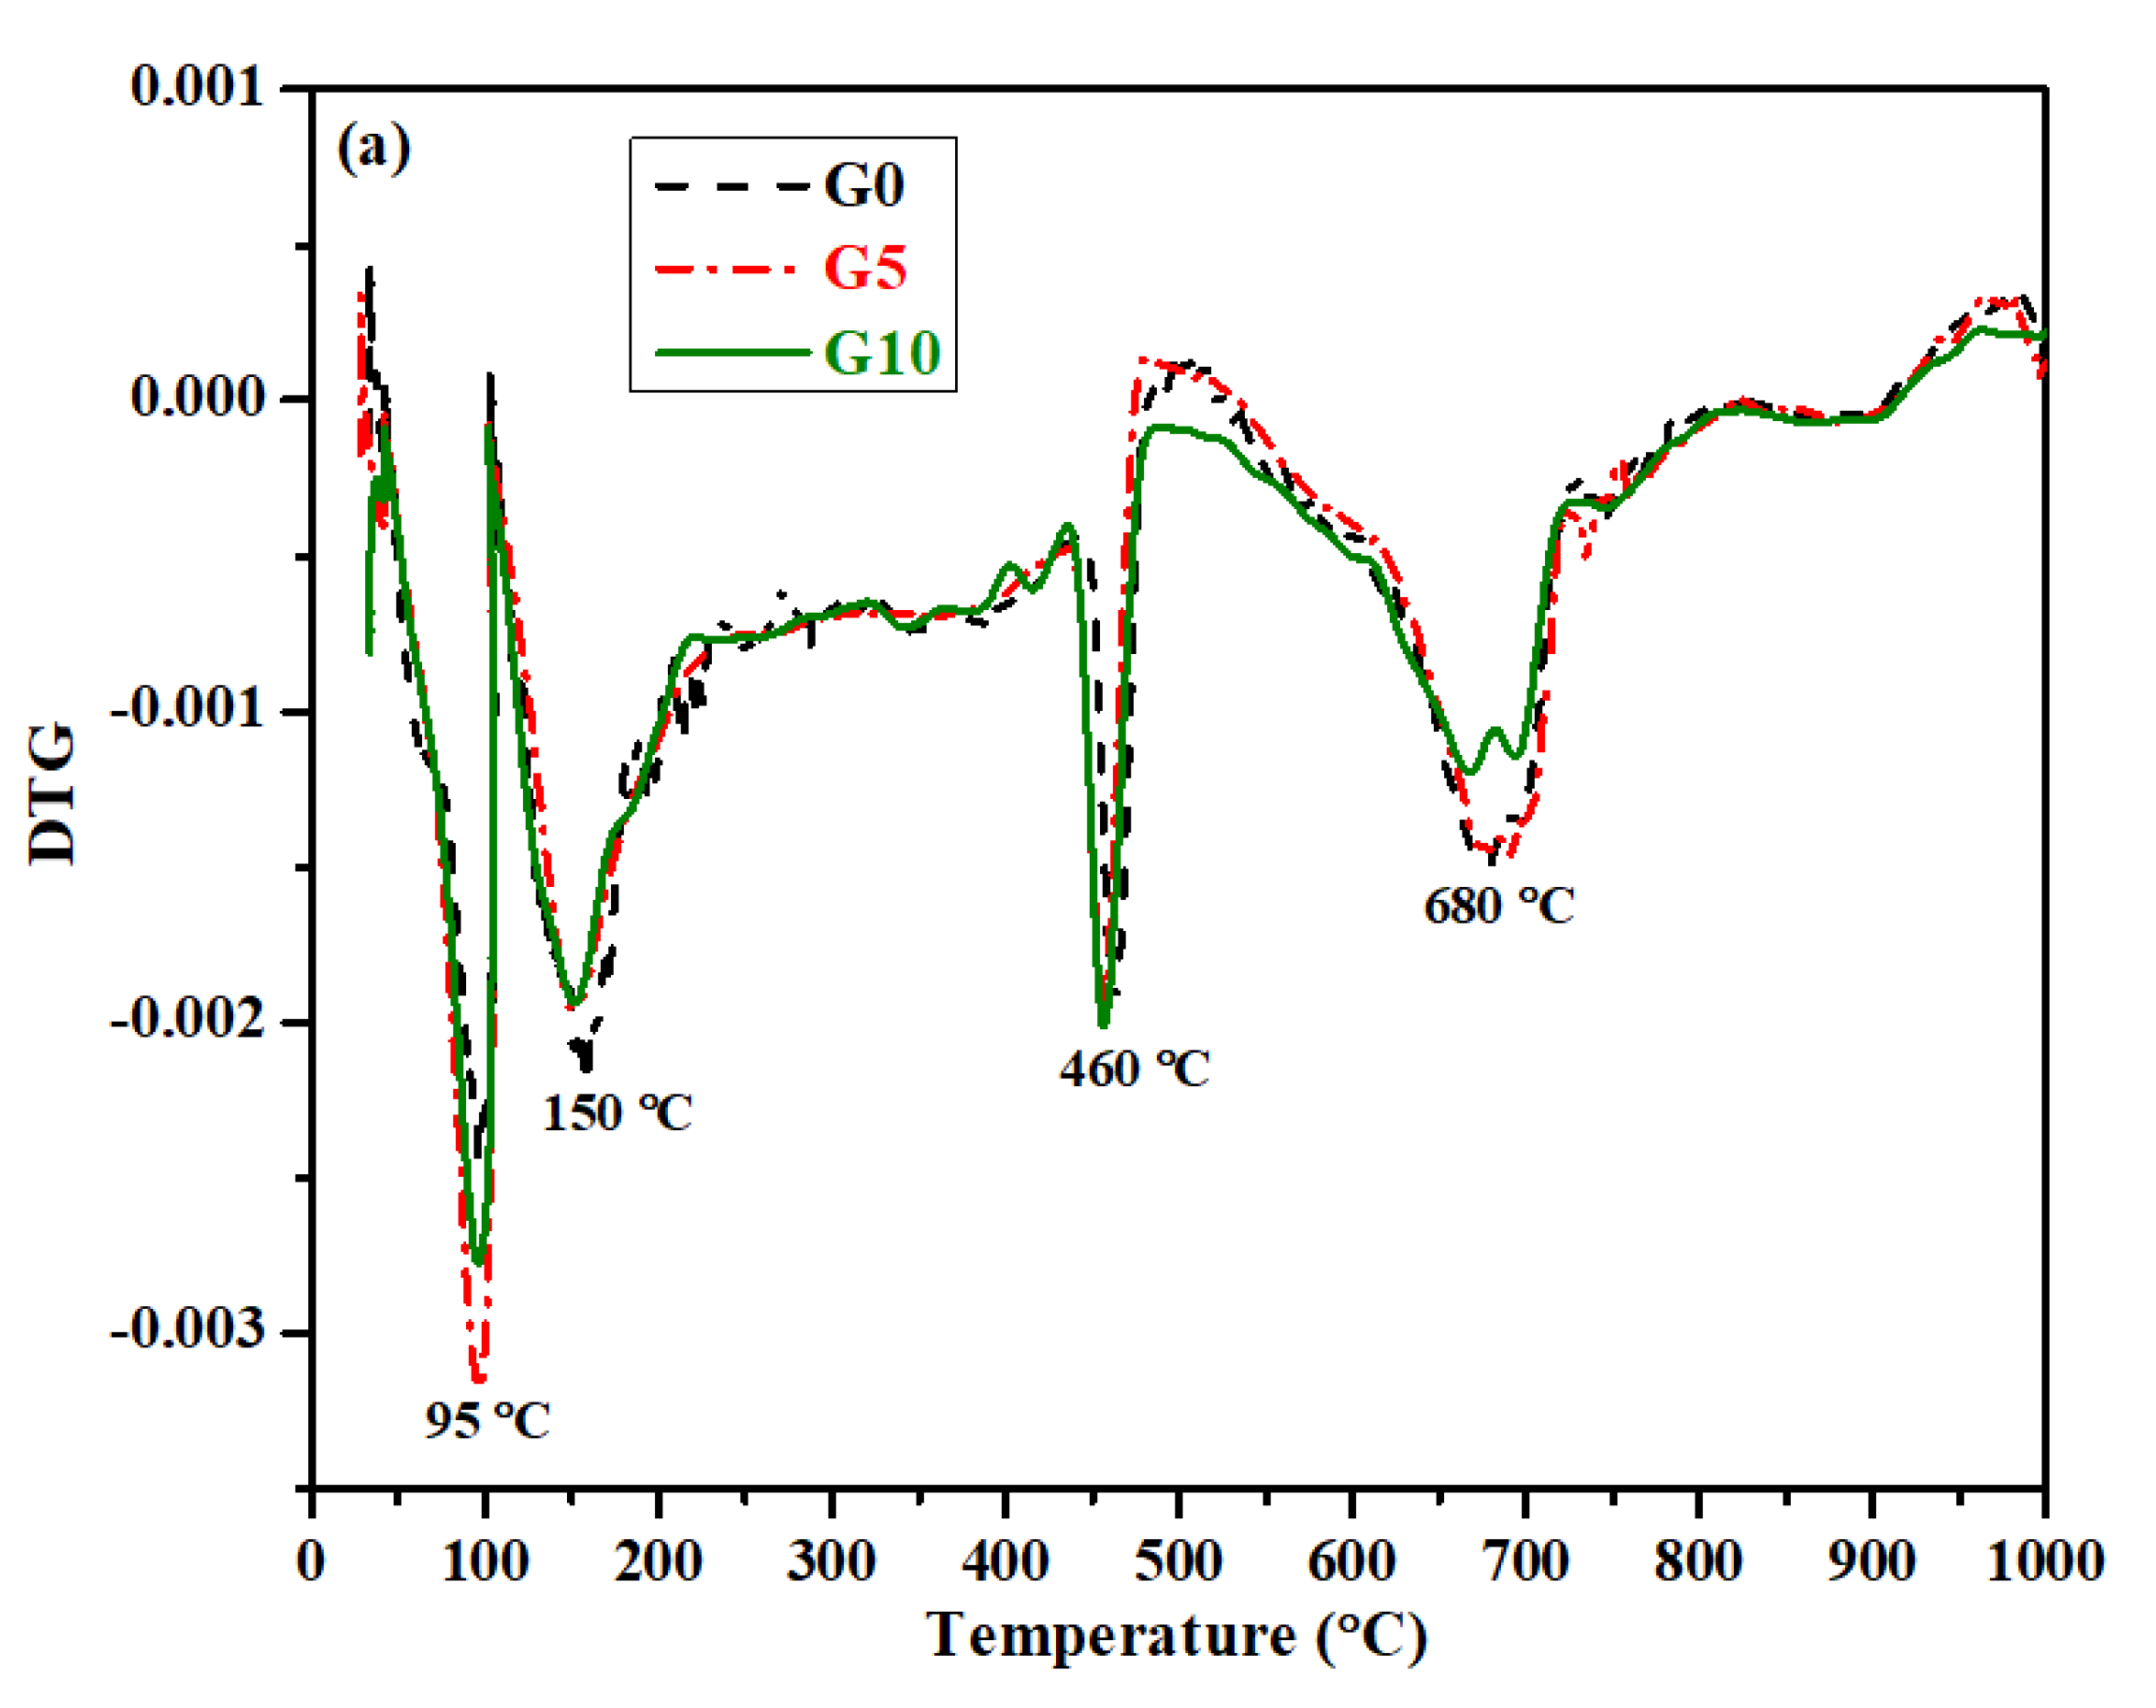
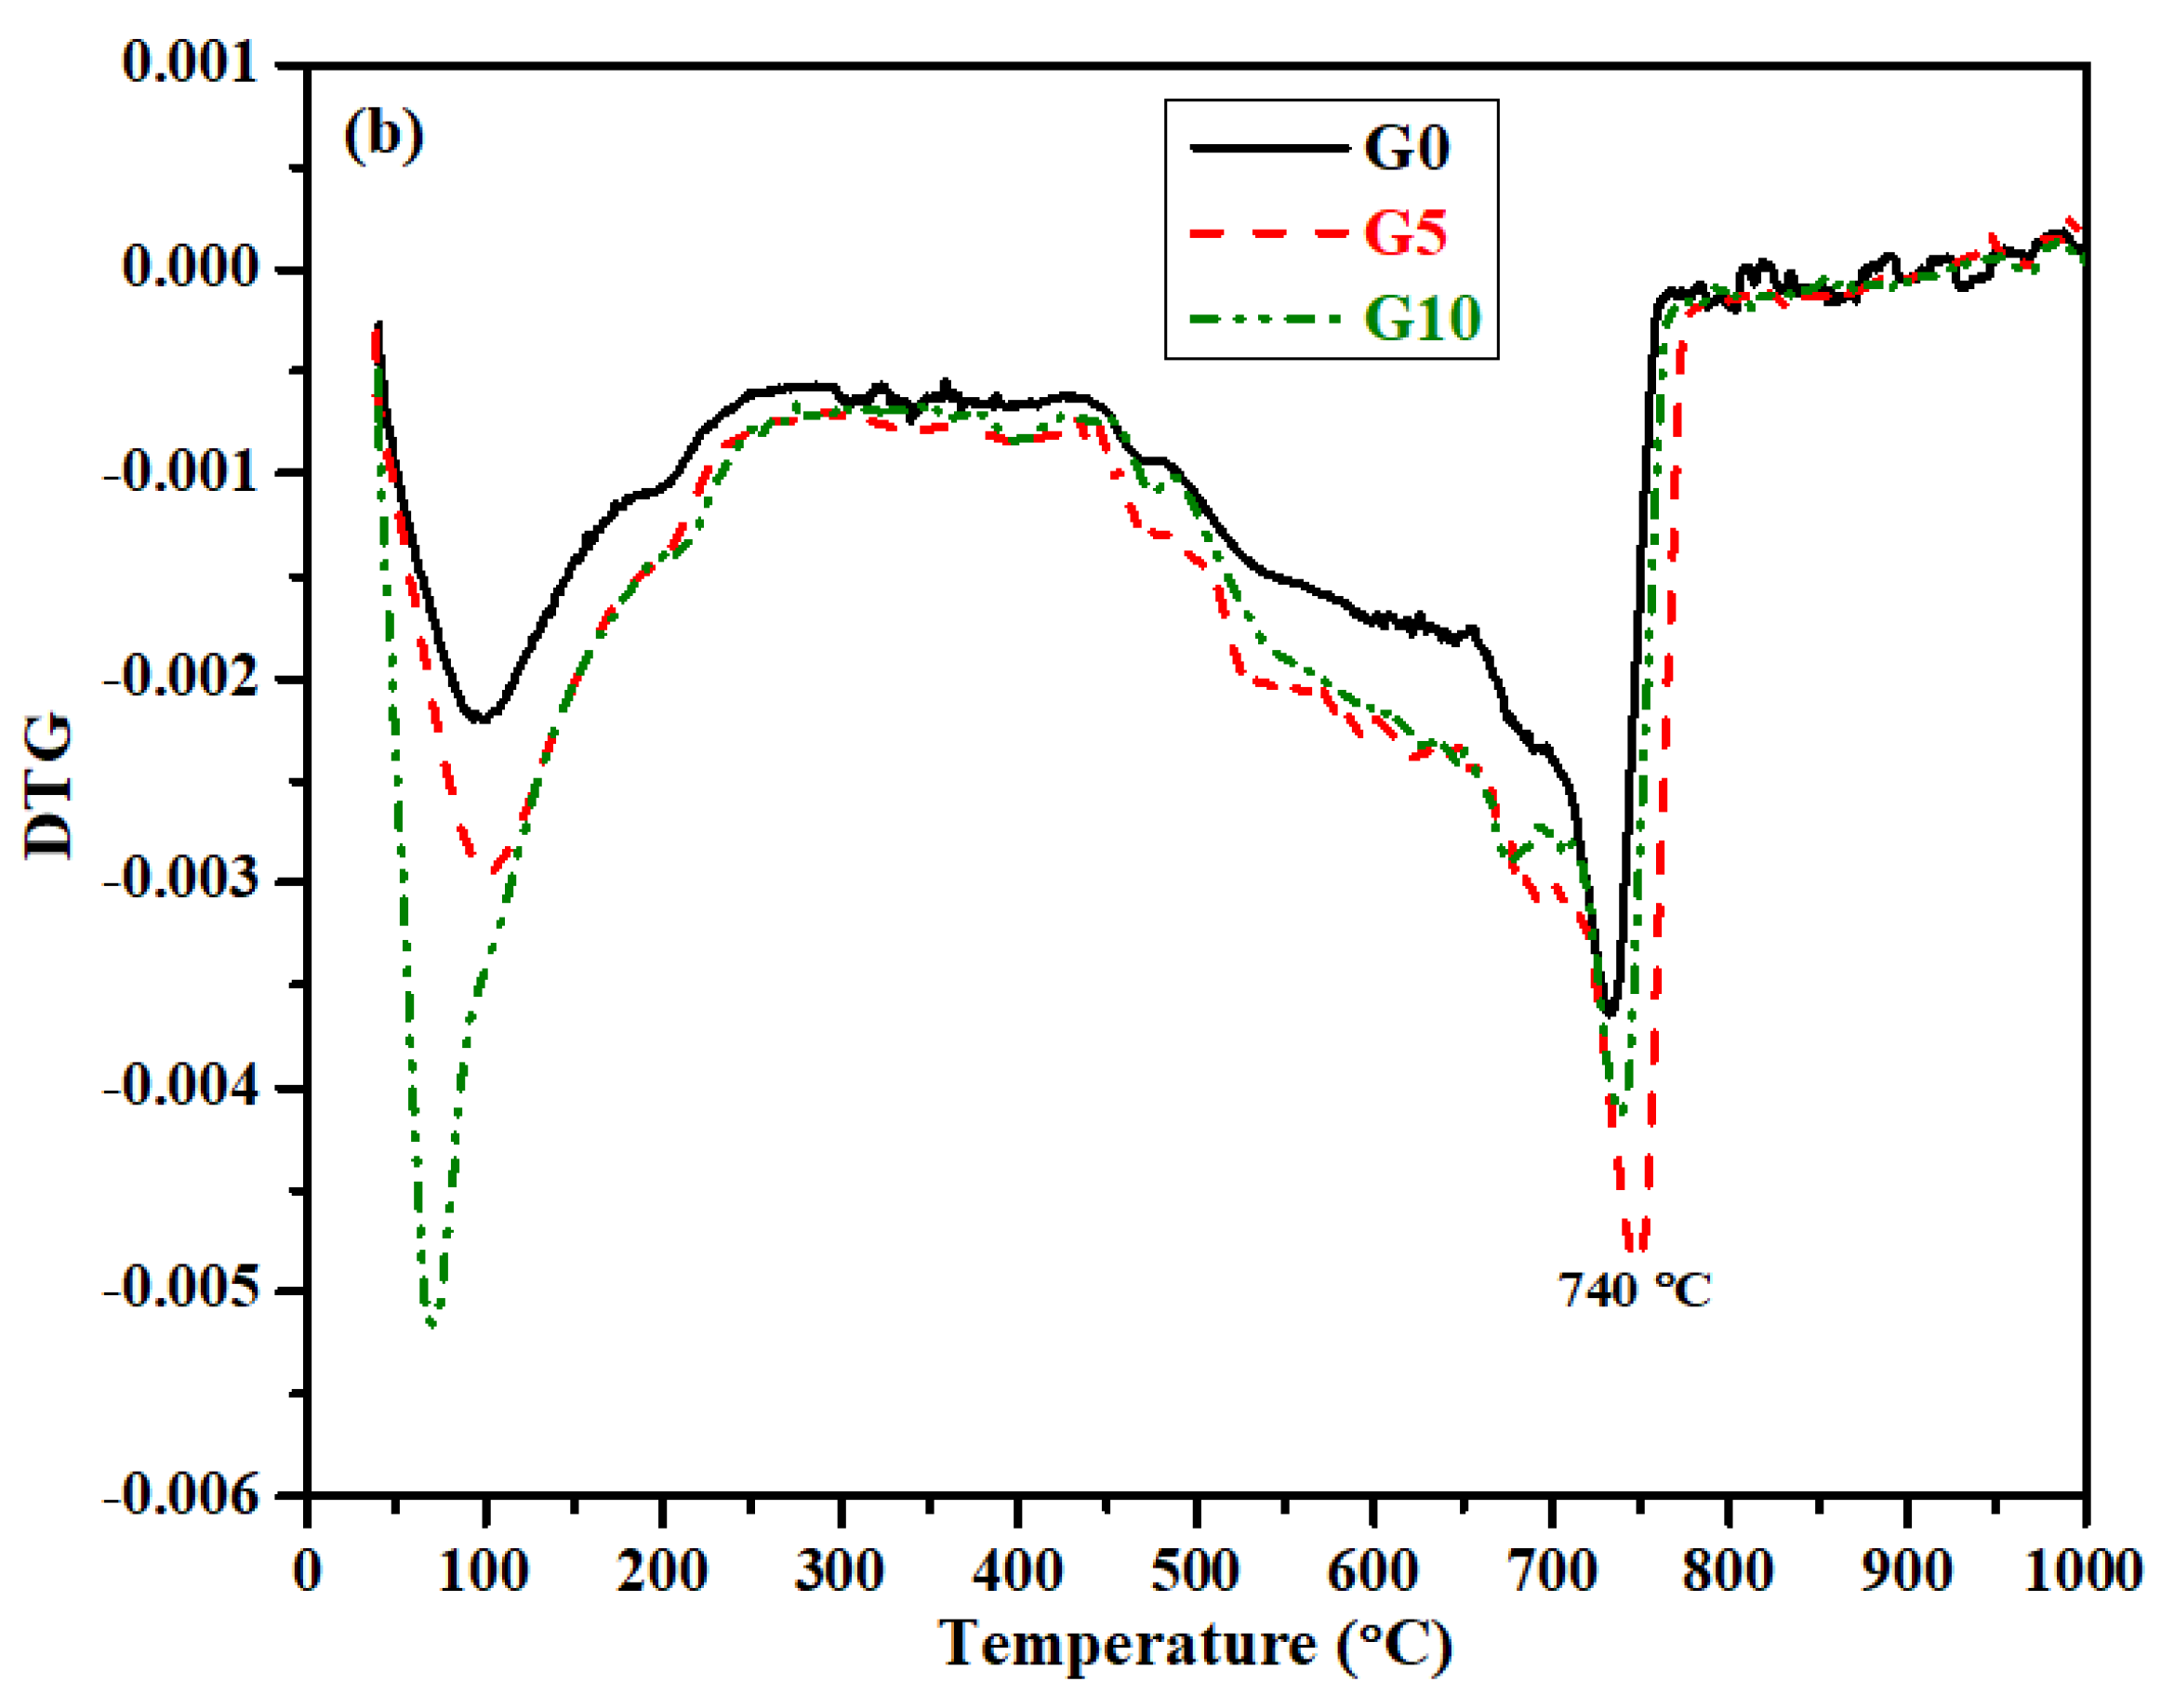
3.7. TGA of Paste After Carbonation

The stability of the hydration and the carbonated products could be accessed by TGA, where mass loss occurred at a particular temperature range. The TGA results of the paste samples are shown in Figure 9. The peak between 50 °C and 200 °C can be ascribed to the evaporation of water and dehydration of the C-S-H, whereas, a range of 400 °C–500 °C for the decomposition of portlandite (Ca(OH)2) and the peak between 600 °C–800 °C has a relation to the decarbonization of poorly-crystallized and well-crystallized CaCO3 [50]. Figure 9a and Figure 9b show the derivative thermogravimetric (DTG) curves of NC and AC samples after 28 days of curing, respectively. An interesting observation was found in NC (Figure 9a), where a mass loss peak at 460 °C attributed to the hydration reaction products of cement (i.e., portlandite), whereas this peak was absent in AC (Figure 9b). This result suggests that the NC sample was dominated by the hydration reaction, where the possibility of forming portlandite was significant. Alternatively, as the temperature increased, there was one peak observed from 650 °C to 750 °C in both conditions (i.e., NC and AC). However, the samples cured in AC, especially G5, exhibited a strong and sharp peak (Figure 9b), owing to the well-documented and stable crystalline CC [10].

4. Conclusions

In spite of the relatively low hydraulic properties of γ-C2S and a high CO2 uptake, it is expected to utilize CO2 in advanced construction materials. Cement production could be minimized by partial substitution with GGBFS and the addition of γ-C2S, which enhances the compressive strength. The mortar samples cured in AC condition with γ-C2S exhibited higher compressive strength compared with NC, attributed to the reaction of γ-C2S with CO2 and the formation CaCO3, which fill the pores of the mortar matrix. The SEM results show that the addition of 5% γ-C2S filled out the pores of the paste matrix, and that most of the γ-C2S reacted and formed CC in AC conditions. However, the unreacted GGBFS and γ-C2S were observed in NC and AC conditions after 28 days of curing by SEM. The unreacted GGBFS led to forming pores, resulting in lower compressive strength. The XRD results confirmed the formation of C-S-H, CC, and V in NC and AC curing. The G0 sample cured in NC mostly contained C-S-H, owing to the hydration reaction, whereas G5 and G10 contained CC and V, along with unreacted γ-C2S. However, once the samples were cured in AC conditions, the amount of CC and V increased in all samples, leading to high compressive strength. The intense peaks of CO32− in FT-IR revealed the carbonation reaction of AC-cured paste samples. The γ-C2S-incorporated samples cured in AC exhibited higher compressive strength, compact morphology with lower porosity, and intense CC peaks.

Author Contributions

Data curation, D.T.T.; Formal analysis, D.T.T. and J.K.S.; Funding acquisition, H.S.L.; Investigation, D.T.T., Y.L., H.S.L., H.-M.Y. and J.K.S.; Methodology, D.T.T. and Y.L.; Supervision, H.-M.Y. and J.K.S.; Writing—original draft, D.T.T., Y.L., H.S.L., H.-M.Y. and J.K.S.; Writing—review & editing, D.T.T., Y.L., H.S.L., H.-M.Y. and J.K.S. All authors have read and agreed to the published version of the manuscript.

Funding

There is no external funding.

Institutional Review Board Statement

Not applicable.

Informed Consent Statement

Not applicable.

Data Availability Statement

Data can be provided upon request from the corresponding authors.

Acknowledgments

This research was supported by the National Research Foundation of Korea (NRF) grant funded by the Korea government (MSIT) (No. 2015R1A5A1037548).

Conflicts of Interest

The authors declare no conflict of interest.

References

  1. Guan, X.; Liu, S.; Feng, C.; Qiu, M. The hardening behavior of γ-C2S binder using accelerated carbonation. Constr. Build. Mater. 2016, 114, 204–207. [Google Scholar] [CrossRef]
  2. Liu, S.; Guan, X.; Zhang, H.; Wang, Y.; Gou, M. Revealing the Microstructure Evolution and Carbonation Hardening Mechanism of β-C2S Pastes by Backscattered Electron Images. Materials 2019, 12, 1561. [Google Scholar] [CrossRef] [PubMed] [Green Version]
  3. Jun, Y.; Han, S.H.; Shin, T.Y.; Kim, J.H. Effects of CO2 Curing on Alkali-Activated Slag Paste Cured in Different Curing Conditions. Materials 2019, 12, 3513. [Google Scholar] [CrossRef] [PubMed] [Green Version]
  4. Olivier, J.G.J.; Schure, K.M.; Peters, J.A.H.W. Trends in global CO2 and total greenhouse gas emissions. 2017. Available online: https://www.pbl.nl/sites/default/files/downloads/pbl-2017-trends-in-global-co2-and-total-greenhouse-gas-emissons-2017-report_2674_0.pdf (accessed on 4 November 2020).
  5. Zhang, D.; Ghouleh, Z.; Shao, Y. Review on carbonation curing of cement-based materials. J. CO2 Util. 2017, 21, 119–131. [Google Scholar] [CrossRef]
  6. Li, N.; Farzadnia, N.; Shi, C. Microstructural changes in alkali-activated slag mortars induced by accelerated carbonation. Cem. Concr. Res. 2017, 100, 214–226. [Google Scholar] [CrossRef]
  7. Johannesson, B.; Utgenannt, P. Microstructural changes caused by carbonation of cement mortar. Cem. Concr. Res. 2001, 31, 925–931. [Google Scholar] [CrossRef]
  8. Borges, P.H.; Costa, J.O.; Milestone, N.B.; Lynsdale, C.J.; Streatfield, R.E. Carbonation of CH and C–S–H in composite cement pastes containing high amounts of BFS. Cem. Concr. Res. 2010, 40, 284–292. [Google Scholar] [CrossRef]
  9. Li, Z.; He, Z.; Chen, X. The Performance of Carbonation-Cured Concrete. Materials 2019, 12, 3729. [Google Scholar] [CrossRef] [Green Version]
  10. Mu, Y.; Liu, Z.; Wang, F.; Huang, X. Carbonation characteristics of γ-dicalcium silicate for low-carbon building material. Constr. Build. Mater. 2018, 177, 322–331. [Google Scholar] [CrossRef]
  11. Wesselsky, A.; Jensen, O.M. Synthesis of pure Portland cement phases. Cem. Concr. Res. 2009, 39, 973–980. [Google Scholar] [CrossRef]
  12. Goto, S. Harding of Calcium Silicate Compounds by Carbonation. J. Soc. Inorg. Mater. JPN 1998, 5, 22–27. [Google Scholar]
  13. Chang, J.; Fang, Y.; Shang, X. The role of β-C2S and γ-C2S in carbon capture and strength development. Mater. Struct. 2016, 49, 4417–4424. [Google Scholar] [CrossRef]
  14. Higuchi, T.; Morioka, M.; Yoshioka, I.; Yokozeki, K. Development of a new ecological concrete with CO2 emissions below zero. Constr. Build. Mater. 2014, 67, 338–343. [Google Scholar] [CrossRef]
  15. Salman, M.; Cizer, Ö.; Pontikes, Y.; Santos, R.M.; Snellings, R.; Vandewalle, L.; Blanpain, B.; Van Balen, K. Effect of accelerated carbonation on AOD stainless steel slag for its valorisation as a CO2-sequestering construction material. Chem. Eng. J. 2014, 246, 39–52. [Google Scholar] [CrossRef] [Green Version]
  16. Lee, J.-Y.; Choi, J.-S.; Yuan, T.-F.; Yoon, Y.-S.; Mitchell, D. Comparing Properties of Concrete Containing Electric Arc Furnace Slag and Granulated Blast Furnace Slag. Materials 2019, 12, 1371. [Google Scholar] [CrossRef] [Green Version]
  17. Yang, H.-M.; Kwon, S.-J.; Myung, N.V.; Singh, J.K.; Lee, H.-S.; Mandal, S. Evaluation of Strength Development in Concrete with Ground Granulated Blast Furnace Slag Using Apparent Activation Energy. Materials 2020, 13, 442. [Google Scholar] [CrossRef] [Green Version]
  18. Ye, H.; Cai, R.; Tian, Z. Natural carbonation-induced phase and molecular evolution of alkali-activated slag: Effect of activator composition and curing temperature. Constr. Build. Mater. 2020, 248, 118726. [Google Scholar] [CrossRef]
  19. Chen, Z.; Lee, Y.; Cho, H.; Lee, H.; Lim, S. Improvement in Carbonation Resistance of Portland Cement Mortar Incorporating γ-Dicalcium Silicate. Adv. Mater. Sci. Eng. 2019, 30, 04018217. [Google Scholar] [CrossRef] [Green Version]
  20. Ghouleh, Z.; Celikin, M.; Guthrie, R.I.; Shao, Y. Microstructure of Carbonation-Activated Steel Slag Binder. J. Mater. Civ. Eng. 2018, 30, 04018217. [Google Scholar] [CrossRef]
  21. Zhu, C.; Fang, Y.; Wei, H. Carbonation-cementation of recycled hardened cement paste powder. Constr. Build. Mater. 2018, 192, 224–232. [Google Scholar] [CrossRef]
  22. Atiş, C.D. Accelerated carbonation and testing of concrete made with fly ash. Constr. Build. Mater. 2003, 17, 147–152. [Google Scholar] [CrossRef]
  23. Mabudo, G.M.; Lee, S.; Kang, S.; Song, M. Physical properties and carbon dioxide capture of synthetic gamma-C2S cement composites in the early days of curing. Mag. Concr. Res. 2016, 68, 1079–1084. [Google Scholar] [CrossRef]
  24. Morioka, M.; Yamamoto, K.; Torichigai, T.; Yokozeki, K. Manufacturing of c-C2S used by industrial raw material and its evaluation of CO2 emission. Cem. Sci. Concr. Technol. 2010, 64, 29–34. [Google Scholar] [CrossRef] [Green Version]
  25. Na, S.; Kang, S.; Lee, S.; Song, M. Gamma-C2S synthesis from fly ash of fluidize-bed boiler for CO2 capture. In Proceedings of the 4th International Congress APMAS, Fethiye, Turkey, 24–27 April 2014; pp. 1282–1285. [Google Scholar]
  26. Lee, H.J.; Kim, D.G.; Lee, J.H.; Cho, M.S. A study for carbonation degree on Concrete using a phenolphthalein indicator and fourier-transform infrared spectroscopy. Int. J. Civ. Environ. Eng. 2012, 34, 184–190. [Google Scholar]
  27. International, A. C305–14, Standard Practice for Mechanical Mixing of Hydraulic Cement Pastes and Mortars of Plastic Consistency. In Annual Book of ASTM Standards; ASTM international: West Conshohocken, PA, USA, 2014. [Google Scholar]
  28. De Ceukelaire, L.; Van Nieuwenburg, D. Accelerated carbonation of a blast-furnace cement concrete. Cem. Concr. Res. 1993, 23, 442–452. [Google Scholar] [CrossRef]
  29. Bertos, M.F.; Simons, S.; Hills, C.; Carey, P. A review of accelerated carbonation technology in the treatment of cement-based materials and sequestration of CO2. J. Hazard. Mater. 2004, 112, 193–205. [Google Scholar]
  30. KS F 2584-2010: Standard Test Method for Accelerated Carbonation of Concrete; Korean Standards & Certification Information Center: Seoul, Korea, 2010.
  31. International, A. C109–20a, Standard Test Method for Compressive Strength of Hydraulic Cement Mortars (Using 2-in. or [50-mm] Cube Specimens). In Annual Book of ASTM Standards; ASTM international: West Conshohocken, PA, USA, 2020. [Google Scholar]
  32. Zhao, S.; Liu, Z.; Wang, F. Carbonation reactivity enhancement of γ-C2S through biomineralization. J. CO2 Util. 2020, 39, 101183. [Google Scholar] [CrossRef]
  33. Yoon, S.; Park, H.; Yum, W.S.; Suh, J.-I.; Oh, J.E. Influence of Calcium Sulfate Type on Evolution of Reaction Products and Strength in NaOH-and CaO-Activated Ground Granulated Blast-Furnace Slag. Appl. Sci. 2018, 8, 2500. [Google Scholar] [CrossRef] [Green Version]
  34. Lee, S.-H.; Kim, K.; Song, M.-S.; Lee, S.-H.; Kim, K.; Song, M.-S. Physical and Chemical Properties of Cement Mortar with Gamma-C2S. J. Korean Ceram. Soc. 2016, 53, 194–199. [Google Scholar] [CrossRef] [Green Version]
  35. Watanabe, K.; Yokozeki, K.; Ashizawa, R.; Sakata, N.; Morioka, M.; Sakai, E.; Daimon, M. High durability cementitious material with mineral admixtures and carbonation curing. Waste Manag. 2006, 26, 752–757. [Google Scholar] [CrossRef]
  36. Powers, T.C. Structure and physical properties of hardened Portland cement paste. J. Am. Ceram. Soc. 1958, 41, 1–6. [Google Scholar] [CrossRef]
  37. Bentz, D.P. A review of early-age properties of cement-based materials. Cem. Concr. Res. 2008, 38, 196–204. [Google Scholar] [CrossRef]
  38. Saito, T.; Sakai, E.; Morioka, M.; Otsuki, N. Carbonation of γ-Ca2SiO4 and the Mechanism of Vaterite Formation. J. Adv. Concr. Technol. 2010, 8, 273–280. [Google Scholar] [CrossRef] [Green Version]
  39. Bukowski, J.; Berger, R.L. Reactivity and strength development of CO2 activated non-hydraulic calcium silicates. Cem. Concr. Res. 1979, 9, 57–68. [Google Scholar] [CrossRef]
  40. Goto, S.; Suenaga, K.; Kado, T.; Fukuhara, M. Calcium silicate carbonation products. J. Am. Ceram. Soc. 1995, 78, 2867–2872. [Google Scholar] [CrossRef]
  41. Zhou, X.; Mu, Y.; Liu, Z.; Wang, F. Fabrication and characterization of a novel carbonated 0–3 piezoelectric γ-C2S composite. Ceram. Int. 2018, 44, 13426–13429. [Google Scholar] [CrossRef]
  42. Shi, C. Characteristics and cementitious properties of ladle slag fines from steel production. Cem. Concr. Res. 2002, 32, 459–462. [Google Scholar] [CrossRef]
  43. Shi, C.; Hu, S. Cementitious properties of ladle slag fines under autoclave curing conditions. Cem. Concr. Res. 2003, 33, 1851–1856. [Google Scholar] [CrossRef]
  44. Spanos, N.; Koutsoukos, P.G. The transformation of vaterite to calcite: Effect of the conditions of the solutions in contact with the mineral phase. J. Cryst. Growth 1998, 191, 783–790. [Google Scholar] [CrossRef]
  45. Hidalgo, A.; Domingo, C.; Garcia, C.; Petit, S.; Andrade, C.; Alonso, C. Microstructural changes induced in Portland cement-based materials due to natural and supercritical carbonation. J. Mater. Sci. 2008, 43, 3101–3111. [Google Scholar] [CrossRef]
  46. Gadsden, J.A. Infrared Spectra of Minerals and Related Inorganic C Ompounds; Butterworths: New York, NY, USA, 1975. [Google Scholar]
  47. Lodeiro, I.G.; Macphee, D.E.; Palomo, A.; Fernández-Jiménez, A. Effect of alkalis on fresh C–S–H gels. FTIR analysis. Cem. Concr. Res. 2009, 39, 147–153. [Google Scholar] [CrossRef]
  48. Yu, P.; Kirkpatrick, R.J.; Poe, B.; McMillan, P.F.; Cong, X. Structure of calcium silicate hydrate (C-S-H): Near-, mid-, and far-infrared spectroscopy. J. Am. Ceram. Soc. 1999, 82, 742–748. [Google Scholar] [CrossRef]
  49. Lodeiro, I.G.; Fernández-Jiménez, A.; Palomo, A.; Macphee, D.E. Effect on fresh C-S-H gels of the simultaneous addition of alkali and aluminium. Cem. Concr. Res. 2010, 40, 27–32. [Google Scholar] [CrossRef]
  50. Villain, G.; Thiery, M.; Platret, G. Measurement methods of carbonation profiles in concrete: Thermogravimetry, chemical analysis and gammadensimetry. Cem. Concr. Res. 2007, 37, 1182–1192. [Google Scholar] [CrossRef]
Figure 1. Appearance of binders: (a) ordinary Portland cement (OPC), (b) ground granulated blast-furnace slag (GGBFS), and (c) γ-C2S.
Sustainability 13 00357 g001
Figure 2. Set up of carbonation chamber for accelerated curing of samples.
Sustainability 13 00357 g002
Figure 3. XRD pattern of synthesized γ-C2S and GGBFS powder.
Sustainability 13 00357 g003
Figure 4. Compressive strength values of mortar samples.
Sustainability 13 00357 g004
Figure 5. Back-scattered electron (BSE) SEM images of (a) G0, (b) G5, and (c) G10 paste samples after 28 d of NC curing.
Sustainability 13 00357 g005
Figure 6. BSE SEM images of (a) G0, (b) G5 and, (c) G10 paste samples after 28 d of AC curing.
Sustainability 13 00357 g006
Figure 7. XRD of (a) NC, and (b) AC paste samples after 28-days of curing.
Sustainability 13 00357 g007
Figure 8. FT-IR of (a) NC, and (b) AC paste samples after 28-days of curing.
Sustainability 13 00357 g008aSustainability 13 00357 g008b
Figure 9. Derivative thermogravimetric (DTG) curves of (a) NC and (b) AC, after 28 days of curing.
Sustainability 13 00357 g009aSustainability 13 00357 g009b
Table 1. Mixture composition of mortar samples.
Sample IDW/BMixture Composition (kg/m3)
OPCγ-C2SGGBFSWaterSand
G00.5517802672451350
G517822.25244.752451350
G1017844.5222.52451350
Table 2. Mixture composition of paste samples.
Sample IDW/BMixture Composition (kg/m3)
OPCγ-C2SGGBFSWater
G00.552340351322
G523429.25321.75322
G1023458.5292.50322
Table 3. Details of the curing process and characterization.
TypeSamplesNCACCharacterizations
MortarG014 and 28 days
(air curing)
14 and 28 days
(5% CO2 chamber)
Compressive strength
G5
G10
PasteG028 days
(air curing)
28 days
(5%CO2 chamber)
TGA, XRD, FT-IR, and SEM
G5
G10
Table 4. Chemical composition of binder (wt.%).
Sample IDCaOSiO2Al2O3MgOSO3Fe2O3LOI
γ-C2S68.9225.813.000.840.021.300.11
GGBFS51.4728.7113.323.452.340.610.10
OPC65.1418.023.042.954.243.083.53
Table 5. Volume fraction (%) of phases present in paste after 28 days of NC and AC curing.
Curing ConditionSample IDVolume Fraction (%) of Phases
C-S-HCaCO3Vateriteγ-C2S
NCG072.3912.8914.720
G525.3334.5823.8416.25
G1023.2312.3325.8938.55
ACG058.9118.2122.880
G530.9350.7518.320
G1030.3634.9127.647.09
Publisher’s Note: MDPI stays neutral with regard to jurisdictional claims in published maps and institutional affiliations.

