Solid Waste Characterization and Recycling Potential for a University Campus in China


1
College of Information and Management Science, Henan Agricultural University, 15 Longzi Lake Campus, Zhengzhou East New District, Zhengzhou, Henan 450046, China
2
Centre for Environment and Sustainability, University of Surrey, Guildford, Surrey GU2 7XH, UK
*
Author to whom correspondence should be addressed.
Sustainability 2020, 12(8), 3086; https://doi.org/10.3390/su12083086
Submission received: 12 March 2020
/
Revised: 7 April 2020
/
Accepted: 9 April 2020
/
Published: 12 April 2020
Abstract
:Waste characterization is the first step to a successful waste management system. This paper explores the trend of solid waste generated on a university campus (Longzi Lake Campus of Henan Agricultural University) in China and the factors that influence the potential for recycling of the waste. Face-to-face interviews were carried out for 12 consecutive months on a campus in central China, and 416 interviewees were questioned. It was found that 7.32 tonnes of solid waste were generated on the campus each day, of which 79.31% were recyclable. The characterization of major waste streams are discussed, and the results are compared with comparable data from five universities in a range of other countries (Mexico, Canada, Malaysia, Nigeria, and Ethiopia). The annual growth of GDP per capita in China over the past five years before the research appeared to play an important role in the increasing of food waste on university campus, and the proportion of food waste is found to have a positive influence on recycling potential.
1. Introduction
With China becoming the largest municipal solid waste generator in the world [1], solid waste management (SWM) in the country has attracted special attention in recent years. Statistics show that solid waste generation in China has increased by about 10 billion tonnes per year, and the total historical stocks have reached 60–70 billion tonnes, and the figure is still increasing [2]. How to deal with the increasing volume of solid waste is an important issue within sustainable development and has become a tremendous challenge for the Chinese government.
The increasing level of solid waste has been a serious problem in China for decades. The Law of the People’s Republic of China on the Prevention and Control of Environmental Pollution by Solid Waste (hereinafter referred to as the ‘Solid Waste Law’) was first introduced in 1996, and it was amended five times between then and June 2019, when the latest draft revision was passed. The first major revision was made in 2004, and highlighted the importance of considering the entire life cycle of a product by extending the producer’s responsibility to include the consumption and disposal of goods, while the original version specified only the producer’s responsibility in the production process [1]. The 2019 revision is the second major revision of the Solid Waste Law and includes six chapters and 102 articles, of which 50 have been amended, 14 new articles were added, and four articles were deleted. A waste classification system has been added and the main responsibilities of solid waste producers have been reinforced. In addition, penalties for illegal acts have been increased, and the maximum fine for a number of illegal acts has been raised to one million Yuan. In December 2018, the ‘No-Waste City’ Pilot Program was passed by the central government of China. It is a city development model embracing concepts of innovation, coordination, greenness, openness, and sharing, and the intention is that it will promote resource utilization and reduction of solid waste at source by forming a green development mode and lifestyle, thereby minimizing the volume of landfill and the environmental impact of solid waste [3]. Local government has responded positively to this program. For example, Shanghai has implemented the Shanghai Household Waste Management Regulation (hereon referred to as the ‘Regulation’) since July 1, 2019. According to the Regulation, domestic waste in Shanghai is classified into four types—recyclables, hazardous waste, wet waste, and dry waste—and a specific definition of each type is provided. Refusing to sort waste in accordance with the Regulation will result in a fine of 5000–50,000 Yuan (about US$730–7300) for entities and a fine of 50–200 Yuan (about US$7.30–30) for individuals [4]. Subsequently, Beijing, Chongqing, Zhengzhou and other regional governments have also drafted waste classification management regulations. Furthermore, the Chinese government plans to build a waste classification system in 46 key cities by the end of 2020 [5].
Clearly, SWM has been high on the agenda of the Chinese government, and there is an urgent need for and practical significance of SWM at all scales in the country, including universities. The importance of universities in terms of SWM is twofold. Firstly, the number of students enrolled in higher education institutions has been increasing, especially in big cities such as Shanghai, Beijing, and Xi’an, where college students have accounted for more than 10% of the local population in recent years [6]. As ‘small cities’ with wide geographical coverage and diverse human activities, universities in China have various degrees of impacts on the environment and the wider society [7], and one of them is solid waste. SWM in higher education institutions is thus crucial for advancing the sustainability of a university campus [8] and the community it is located in. Secondly, universities can provide examples of ‘best practice’ and thereby provide beacons which others can learn from and follow. While this may be the case in many countries, universities that expose to the unique cultural and political environment in China provide a special context for such development and illustration of ‘best practice.’
Waste characterization has been identified as the first step to any successful SWM [9,10,11]. Since the composition of waste generated varies depending on the seasonality, differences in lifestyle, demographic information of the students, location of the university, and related local regulations, a one-size-fits-all solution would be ineffective [1,10]. SWM based on the knowledge of the waste characterization and on the condition of the market for recyclables in China would work better than ambitious programs copied from somewhere else in the world [9,10,11].
Given the potential of universities to act as role models and also the fact that many of them occupy a defined unit of space comprising teaching, research, offices, and student/staff accommodation blocks, it is unsurprising that much empirical work has been done to try to explore waste characterization and recycling potential on university campuses. De Vega et al. [9] looked at the Campus Mexicali I of the Autonomous University of Baja California in Mexico during the period of 14 consecutive days. He employed ASTM d5231-92 methods to sample the waste generated on campus, and concluded that one tonne of solid waste was produced on this campus per day, of which 53.1% was from buildings, 28.3% from gardens, 4.9% from the community centre, and more than 65% of which were recyclable or potentially recyclable. Smyth et al. [8] reported the results of a waste characterization study conducted at the Prince George Campus of the University of Northern British Columbia in Canada, and determined that 1.2 to 2.2 tonnes of waste were generated per week on that campus during the 2007–2008 academic year, of which 29.1% was cardboard and paper, 21.6% was organic waste, 8.1% was plastic waste, and 1.0% was glass. Of all the waste generated, more than 70% could have been diverted through waste reduction, recycling, and composting activities. Painter et al. [12] estimated food waste quantities generated in the dining hall of Rhodes University in South Africa by weighing food waste at roughly the same time after each meal for three nonconsecutive weeks. He found that daily food waste generation was about 555 g per student in that university. Adeniran et al. [13] determined daily waste generation on the Akoka Campus of the University of Lagos in Nigeria by measuring the dimension of each waste truck. He found that the waste generation on this campus was 32.7 tonnes per day, of which 39% was plastic waste, 15% was organic waste, 15% was paper, 8% was soil and stone, 7% was sanitary waste, and 75% of the waste was recyclable. Gebreeyessus et al. [14] looked at the Kotebe Metropolitan University in Ethiopia. They applied a range of equipment, such as labelled baskets, weighing scales, and transfer carts, to determine the composition and generation rate of solid waste. They concluded that the major components of the waste at the university were food (84.4%), other organics (9.0%), paper (3.7%), plastic (1.8%), and the rest accounted for 1.1%, and 93% of the waste was compostable.
Clearly, waste characterization varies between universities/countries, and, in turn, this may influence the potential for recycling. The University of Northern British Columbia in Canada has more paper waste than other Universities, and the Kotebe Metropolitan University in Ethiopia is lower in plastic waste. Nonetheless, despite the differences in waste characterization, the recycling potentials of university campus waste are high (> 60%) in all universities studied, whether they are in Mexico, Canada, South Africa, Ethiopia, or Nigeria, comparing to the global solid waste recycling rate of 19% in 2016 [15] and China’s policy target of 35% recycling rate for household waste by 2020 [16]. However, and perhaps surprisingly given the points made earlier, no study in this field has been done for any university in China. Considering China’s increasing economic and political influences in the world in recent years, its growing investment in higher education, and its expanding population of college students [17], it would be helpful for China’s, and global long-term, sustainability, to understand the waste characterizations for Chinese university campuses and their recycling potential.
To fill the gap, this paper looks at the Longzi Lake Campus of Henan Agricultural University located in central China, and the aim is to investigate the waste characterization and the recycling potential of the solid waste generated on this campus and what factors may be at play in influencing them. Following the introduction, the paper will introduce the methodology employed in this research in Section 2. Section 3 will present results including total waste generation, waste characterization, and recycling potential, and will include a discussion. The conclusion will be included in Section 4.
2. Methodology
2.1. Site Description
Henan Agricultural University (HAU) is a prestigious university in central China. As of 2019, the school area was approximately 281 hectares, and 32,500 students and more than 2000 staff were studying and working there. It has three campuses—Longzi Lake Campus, Wenhua Road Campus, and Xuchang Campus—with Longzi Lake Campus and Wenhua Road Campus being located in Zhengzhou City, Henan Province and Xuchang Campus in a neighboring city. This research was carried out on the Longzi Lake (LL) Campus. The LL Campus has a total land area of nearly 130 hectares, accommodating 12 colleges, and 15,000 students (6500 male and 8500 female). The LL Campus is relatively new, being established in 2012. At the time of the fieldwork, the LL Campus was hosting 16 dormitory buildings (seven male and nine female, there is no mixed accommodation on the campus), two cafeterias, one laboratory building, one administrative building, one computer building, and three teaching buildings. The laboratory building is the home of two biggest colleges on campus, i.e., the College of Agriculture and the College of Animal Husbandry and Engineering, and around 150 laboratories where students and academic staff from these two colleges can do their laboratory work. Faculty and staff offices for the other 10 colleges, conference rooms, and a reading room, are located in the administrative building. A Network Engineering Laboratory, An Enterprise Resource Planning Laboratory and an Agricultural Big Data Entrepreneurial Centre are located in the computer building, which also has a Simultaneous Interpretation Laboratory. Three teaching buildings contain 179 classrooms where daily undergraduate and postgraduate teaching activities take place. The classrooms are open for all students when there is no teaching going on.
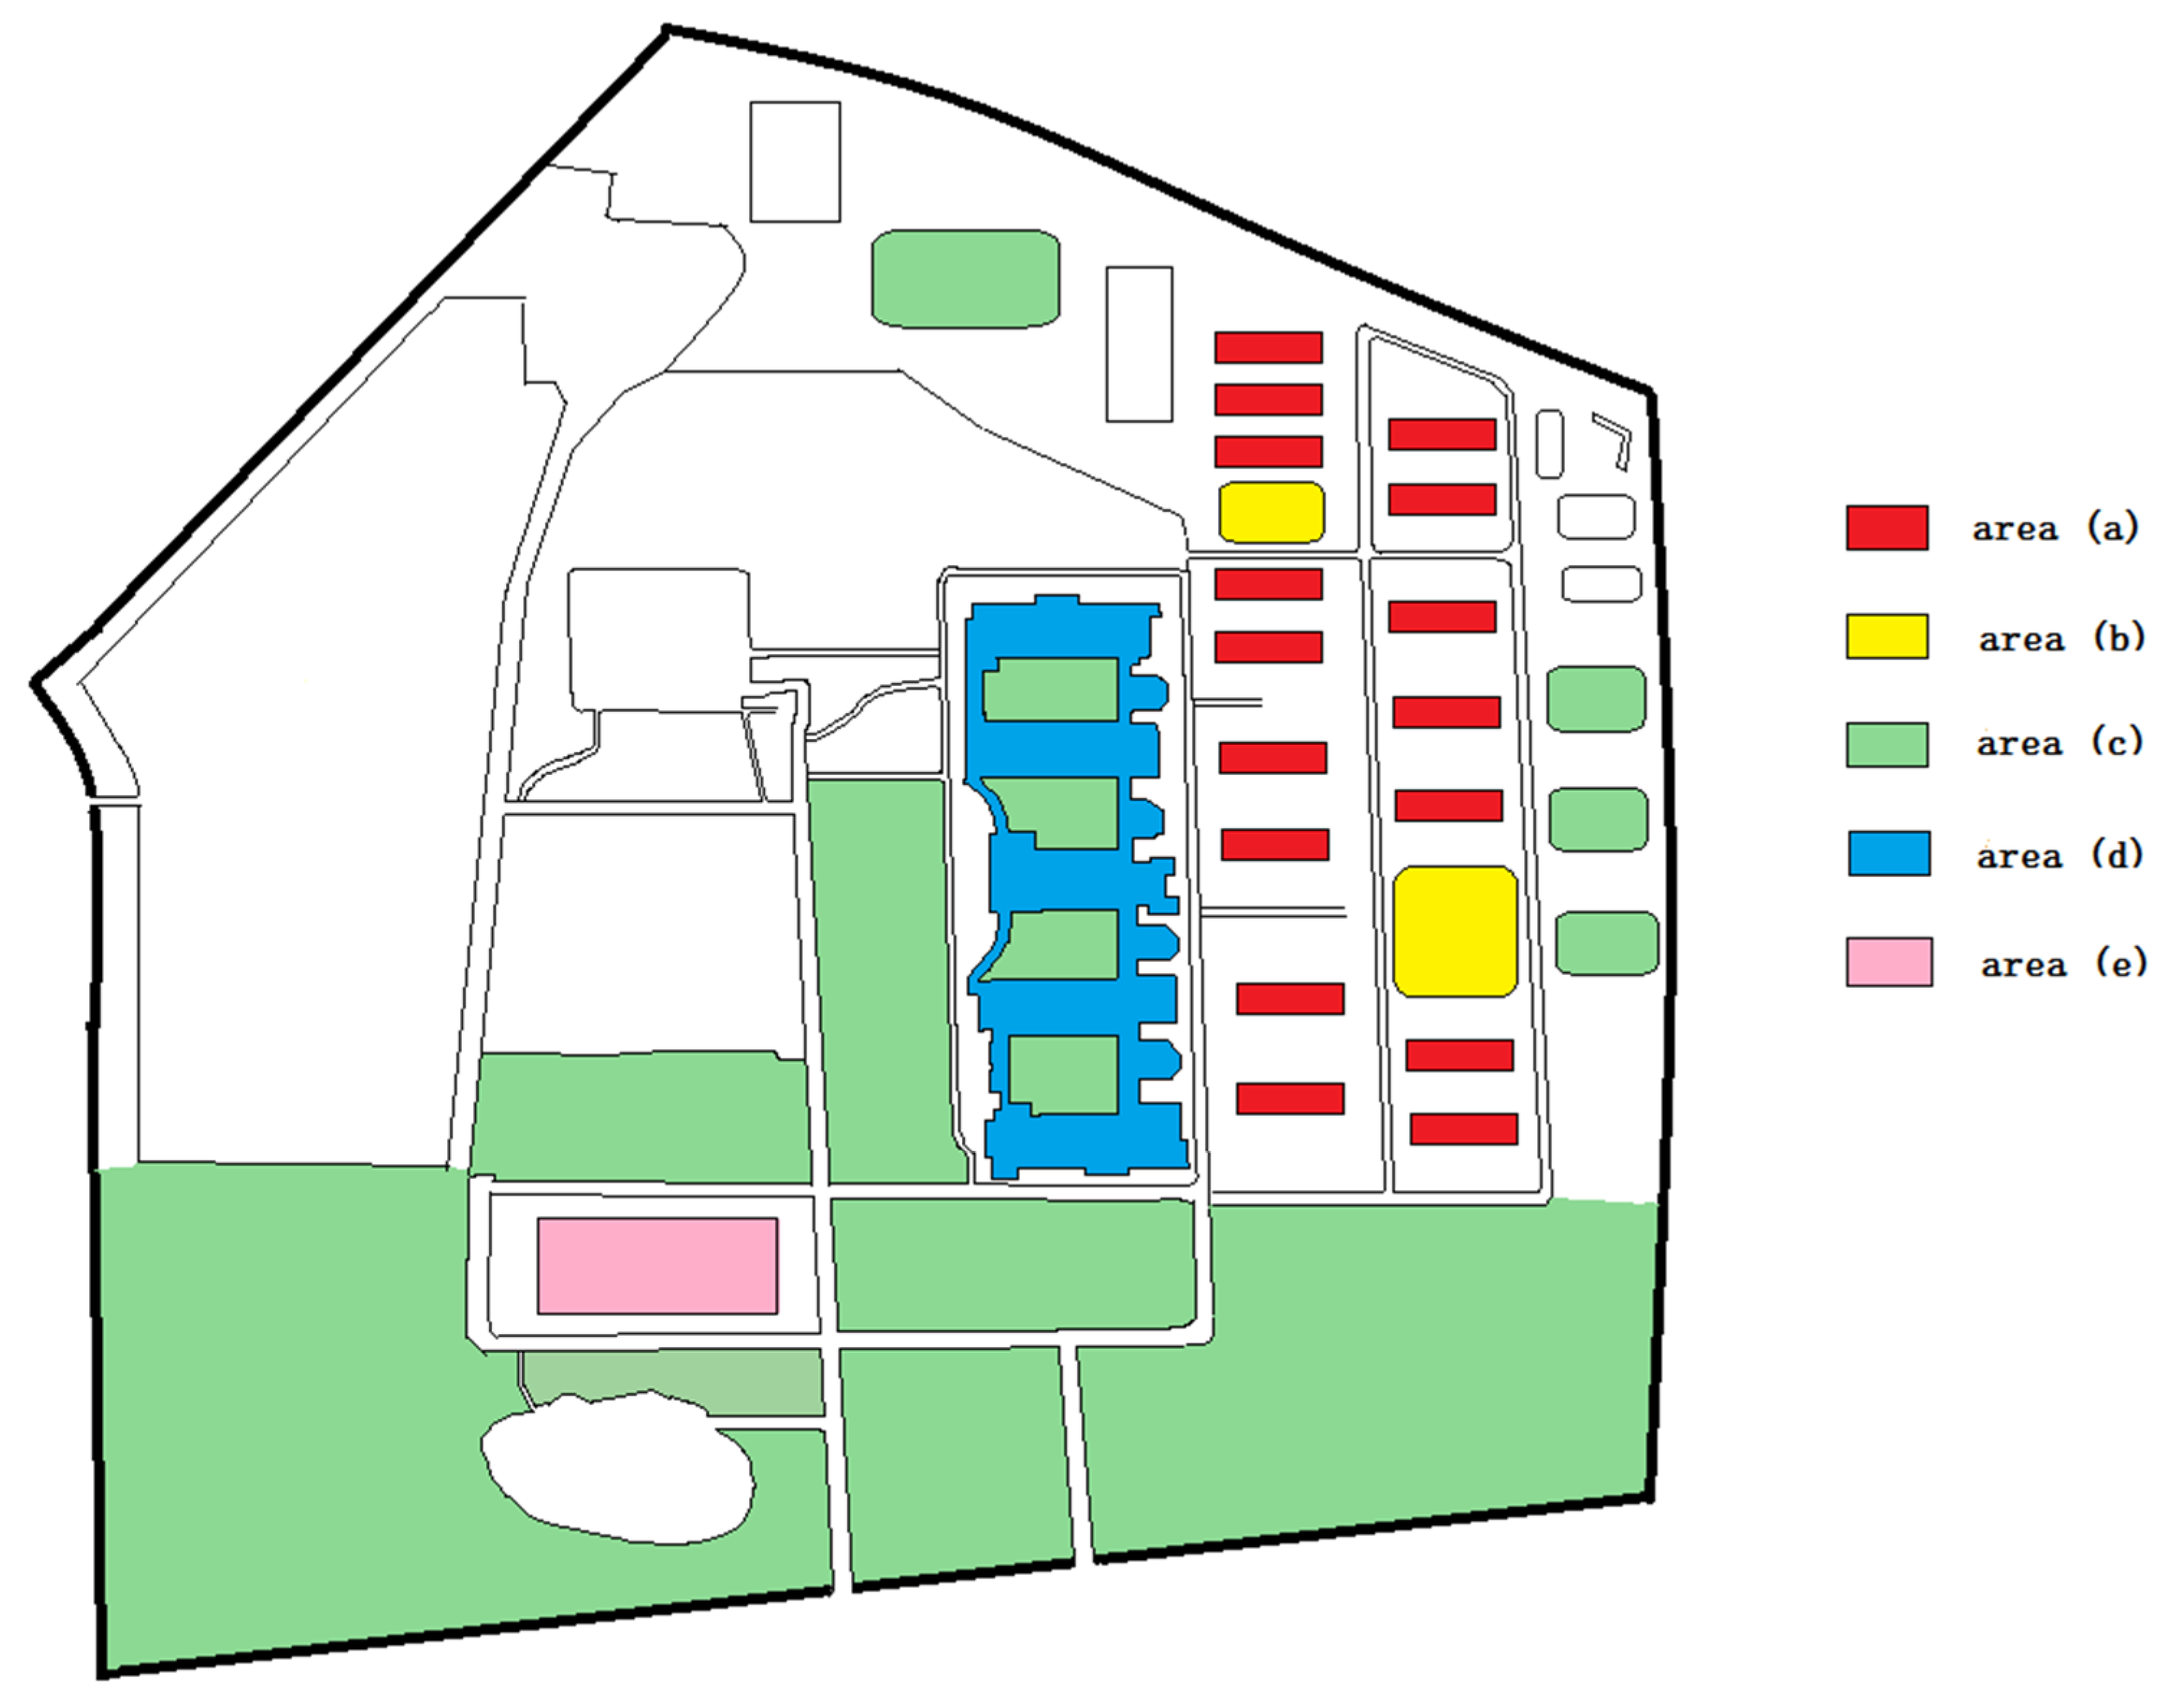
For the convenience of data collection, the LL Campus was divided into five areas: (a) dormitory buildings, (b) cafeteria, (c) gardens, playgrounds and roads, (d) academic area including the teaching building, the administrative building and the computer building, and (e) the laboratory building, as seen in Figure 1.
2.2. Waste Collection System on the LL Campus
In Zhengzhou, the local government does not provide solid waste collection services for university campuses, and most universities contract out this service to private companies. Solid waste collection services for the LL Campus are provided by three private companies: a Realty Management Company, a Waste Transport Company, and a Recyclable Waste Collect Company. Cleaners are hired by the Realty Management Company to clean the five areas, and the number of cleaners in each area varies depending on the size of the area (as shown in Table 1). Every one or two days, the food waste generated in two cafeterias is transported by the Waste Transport Company to farms nearby and is used to feed the livestock of local residents. The Waste Transport Company also transports other waste to the local landfills. A recyclable waste collector is sent by the Recyclable Waste Collect Company to the campus every day to collect recyclable waste, but he does not pick up the recyclable waste piece by piece with his own hand. Instead, he buys the recyclable waste from other people who have collected the waste already. Most of these people are cleaners who pick up recyclable waste in their spare time and exchange them for some extra cash. Some students do that too, but very rarely.
Rubbish bins are placed every 20–30 m around the academic and dormitory buildings on the LL Campus, and every 50 m for the rest of the campus. Each set has two attached bins labelled ‘recyclable’ and ‘nonrecyclable.’ These bins are emptied each day and cleaners pick out the recyclable waste and store it as their personal possession in a place they are entitled to use, i.e., a small room where their cleaning gear is kept. After a few day’s accumulation of waste, the cleaners would call the recyclable waste collector to come and get the recyclable waste. However, since anyone has access to rubbish bins within the public area, sometimes the recyclable waste in these bins is picked out before the end of the day by people who are in desperate need of extra cash.
After getting the recyclable waste from the cleaners, the recyclable waste collector sells the waste to the local recycling centre at a higher price. Because of this special recyclable waste collecting system on the LL Campus (in the whole of Zhengzhou City, actually), some recyclable waste with low economic value is often neglected and processed as nonrecyclable waste.
The jobs of the cleaners are to clean the areas (a–d) they are responsible for, i.e., the corridors, the steps, the classrooms, public toilets, etc., and collect waste from the dust bins in the responsible area and deliver them to the dumpster. However, the cleaners in area (e), the laboratory building, are only responsible for the corridors and the public toilets in the building, they are not allowed to get in the laboratories because they contain expensive experimental equipment and dangerous toxic reagents. Only members of the research groups are allowed to enter the labs. The (non-toxic) waste generated in the labs is placed into the dust bins in public toilets in the laboratory building by a laboratory technician, the cleaners then empty the bins and take the waste in batches to the dumpsters. There are no lab-specific dumpsters on campus. Toxic waste generated in the laboratories is mostly liquid and small in volume. The university has a special requirement for the disposal of such waste, but it is not included in this study.
2.3. Waste Categorization and Recycling Potential Rating
Based on the current trend of the local waste recycling market, solid waste generated on the LL Campus is categorized into five types: organic waste, plastics, cardboard and paper, sanitary waste, and others (including glass, metal, textile, etc.) (Table 2).
After interviewing four local recyclable waste collectors and taking references from de Vega et al. [9] and Adeniran et al. [13], the levels of recyclability of solid waste on the LL Campus was determined by whether or not there is a recycling market for the waste in question. If there is a local recycling market for one particular waste, it was considered to be locally recyclable, and the recyclability level of that waste would be 1. If there was no local recycling market for a particular waste but there was a recycling market somewhere else in China for it, it was considered to be potentially recyclable, and the recyclability level of that waste was given a value of 2. Hence anything that is marked with 1 and 2 in Table 2 is considered to be recyclable. Anything that does not fit into the first two categories would be marked 3, and these are nonrecyclable waste.
2.4. Sampling Frame
The convenience sampling method was employed, and the targeted respondents were the cleaners in the abovementioned five areas, laboratory technicians, waste transporters, local recycling centre employees, and recyclable waste collectors (Table 3). It was assumed that the cleaners have firsthand information regarding the amount and the type of the waste on campus, the laboratory technicians have a clearer understanding of the types and whereabouts of the laboratory waste, and recyclable waste collectors have the best knowledge of the amount of recyclable waste.
By adding up the information obtained from each cleaner, laboratory technician, and recyclable waste collector, and triangulating it with waste transporters, the total amount of solid waste on the LL Campus, the waste characteristics, and the recyclable potential could be estimated.
2.5. Scope of the Study and Data Collection
After a pilot study in October 2018, the questionnaire was finalized and comprised a mix of closed and open-ended questions aiming to find out the solid waste generation in the five areas of the LL Campus. The questionnaire consists of two parts. The first part explores the types of solid waste generated in the five area on the LL Campus. The second part aims to determine the volumes of the waste generated in each subcategory in the five areas. All interviews were carried out face-to-face. Each interview lasted between 10 and 20 min, and interviews were conducted at end of each month. Sometimes multiple mini-interviews were given in the same month when new information became available. The fieldwork was carried out from November 2018 to October 2019.
The information of the solid waste generated in areas (a), (b), (c), (d) was obtained by interviewing cleaners working in the respective areas. The questions included: What types of garbage do you collect? What is the weight of the garbage you cleaned each day? How do you separate waste? How often do you sell recyclable waste to the recyclable waste collector? How much money do you make from it? The information on waste generated in area (e), the laboratory building, was obtained by interviewing cleaners and laboratory technicians. The following questions were asked: How many types of garbage are generated during the experiment? What is the average amount of each type of garbage produced each day? How do you handle the garbage? Further questions were asked to gain as much detail as possible regarding the volume and type of solid waste generated in the lab building. Questions regarding recyclable waste were also asked.
It is assumed that if the frequency that the cleaners sell the recyclable waste to the collector, the amount of money they make from it, and the local price of recyclable waste were all known, then the daily generation of recyclable waste can be calculated.
There are a number of reasons why face-to-face interviews, rather than on-site sampling, were employed to collect data in this study. Firstly, while the on-site sampling might provide more accurate information of waste composition, it would be challenging to assess where the waste had come from, and the team regarded this as important as it provides an insight regarding how to reduce waste from the source. Second, on-site sampling would not provide accurate information of the total weight of the waste on campus as there is no infrastructure in place to weigh the waste before it is transported or after it reaches its destination (local farms for food waste and landfills for other waste). The authors found in the pilot study that the waste transporter’s guess is just as good as that of the cleaners about the total weight of waste. Third, as the cleaners handled the waste on a daily basis, they were not only very familiar with the type and volume of the waste but could also provide useful insight as to what is behind students’ wasting behavior. Furthermore, as interviews were carried out regularly each month, the cleaners could readily recall the weight and the type of the waste they handled within that month, especially as they keep some of the recyclable waste for sale. Actually, after a couple of months’ interviews, the team had built a good rapport with the cleaners, and some of them would record information in writing rather than rely on memory recall. Last but not the least, waste transporters were also interviewed, and the information gained was used to triangulate with the information gained from the cleaners and laboratory technicians.
2.6. Data Recording and Analysis
SPSS 21.0 was employed to store and analyze data. The recycling potential of the solid waste generated on the LL Campus is determined using the equation:
where RP is the recycling potential of the solid waste generated on the LL Campus, LRW is the local recyclable waste weight in kg, PRW is the potential recyclable waste weight in kg, and TW is the total weight of all solid waste in kg.
3. Results and Discussion
3.1. Daily Solid Waste Generation
The weights of the daily solid waste generated for each month and in each area of the LL Campus from November 2018 to October 2019, and their percentage contributions to the campus total, are shown in Table 4. Although the daily solid waste generation varies across the four seasons (higher in spring and autumn and lower in summer and winter), on average, 7.32 tonnes of solid waste were generated on the LL Campus each day, which equates to 487 g per student per day (Table 4).
Table 4 also indicates that the biggest solid waste generator was area (b), the cafeterias. It generated an average of 3.31 tonnes of solid waste per day over the period of 12 months, which accounted for 45.3% of daily waste generation of the whole campus. Area (a), the dormitories, was the second contributor to the campus waste generation (36.6%), while areas (c–e), the gardens, academic area, and the laboratory building, contributed less than 20% of the total waste.
Table 5 indicates that the daily waste generation on the LL Campus of HAU in China is relatively high compared to the results of previous studies (Column 5). It is 22.7% of Adeniran’s et al. [13] result of 32.20 tonnes for the Akoka Campus of University of Lagos (ACUL), Nigeria, but around seven times higher than campus Mexicali I of the Autonomous University of Baja California (AUBC) in Mexico (one tonne), 10 times higher than Universiti Teknologi Malaysia (UTM, 0.56 tonne), and 30 times higher than the Prince George Campus of the University of Northern British Columbia (UNBC) in Canada (0.24 tonne). If we even it out among students (Column 6 of Table 5), our result (487g) is still the second highest among all studies, only lower than the UTM (830 g), but 32% higher than ACUL, 4 times higher than KMU, and 29 times higher than UNBC. There obviously would be many reasons for this. Firstly, the ways of obtaining data in this study are different from previous studies. De Vega et al. [9], Smyth et al. [8], Adeniran et al. [13], and Gebreeyessus [14] collected sample wastes and analysed the waste composition and recycling potential. Zen et al. [18] gained data through student research, collaborative works with Unit of Sustainability and waste contractors, while this study employed face-to-face interviews with people who handle the solid waste (mainly cleaners) to acquire data. Some of the cleaners interviewed might exaggerate the amount of solid waste they take care of so as to appear to be hard workers. Second, most contemporary Chinese college students are from the one-child generation who may have been pampered by their parents and grandparents since early childhood and have developed a habit of not caring about anything, whether it is money, food, time, or even their own health, etc. [19,20], not to mention environmental protection. During the interview, one cleaner who is responsible for cleaning one of the dormitories and its surroundings said, “students often throw plastic waste or leftover food to the ground from the upstairs windows, and some students eat only a little of the takeaways they bought, and throw the rest out of the windows.” She said she often found raw barbecue chicken drumsticks on the ground which were obviously bought by the students for barbecues that never happened (possibly due to bad planning). When the cleaner posted a note to warn the residents not to dump rubbish on the ground, it was totally ignored. The third reason for higher solid waste generation on campus in this study is the cheap packaging and over-packaging in China. Most Chinese manufacturers pursue profit maximization and rarely consider the environmental impact of packaging material [21]. They either use cheap packaging or overpackage the product they sell. While cheap packaging saves production costs and increases profit margins, nicely overpackaged gifts save people’s “face,” a concept of social prestige in China [22], but they bring extra packaging waste.
3.2. The Recycling Potential
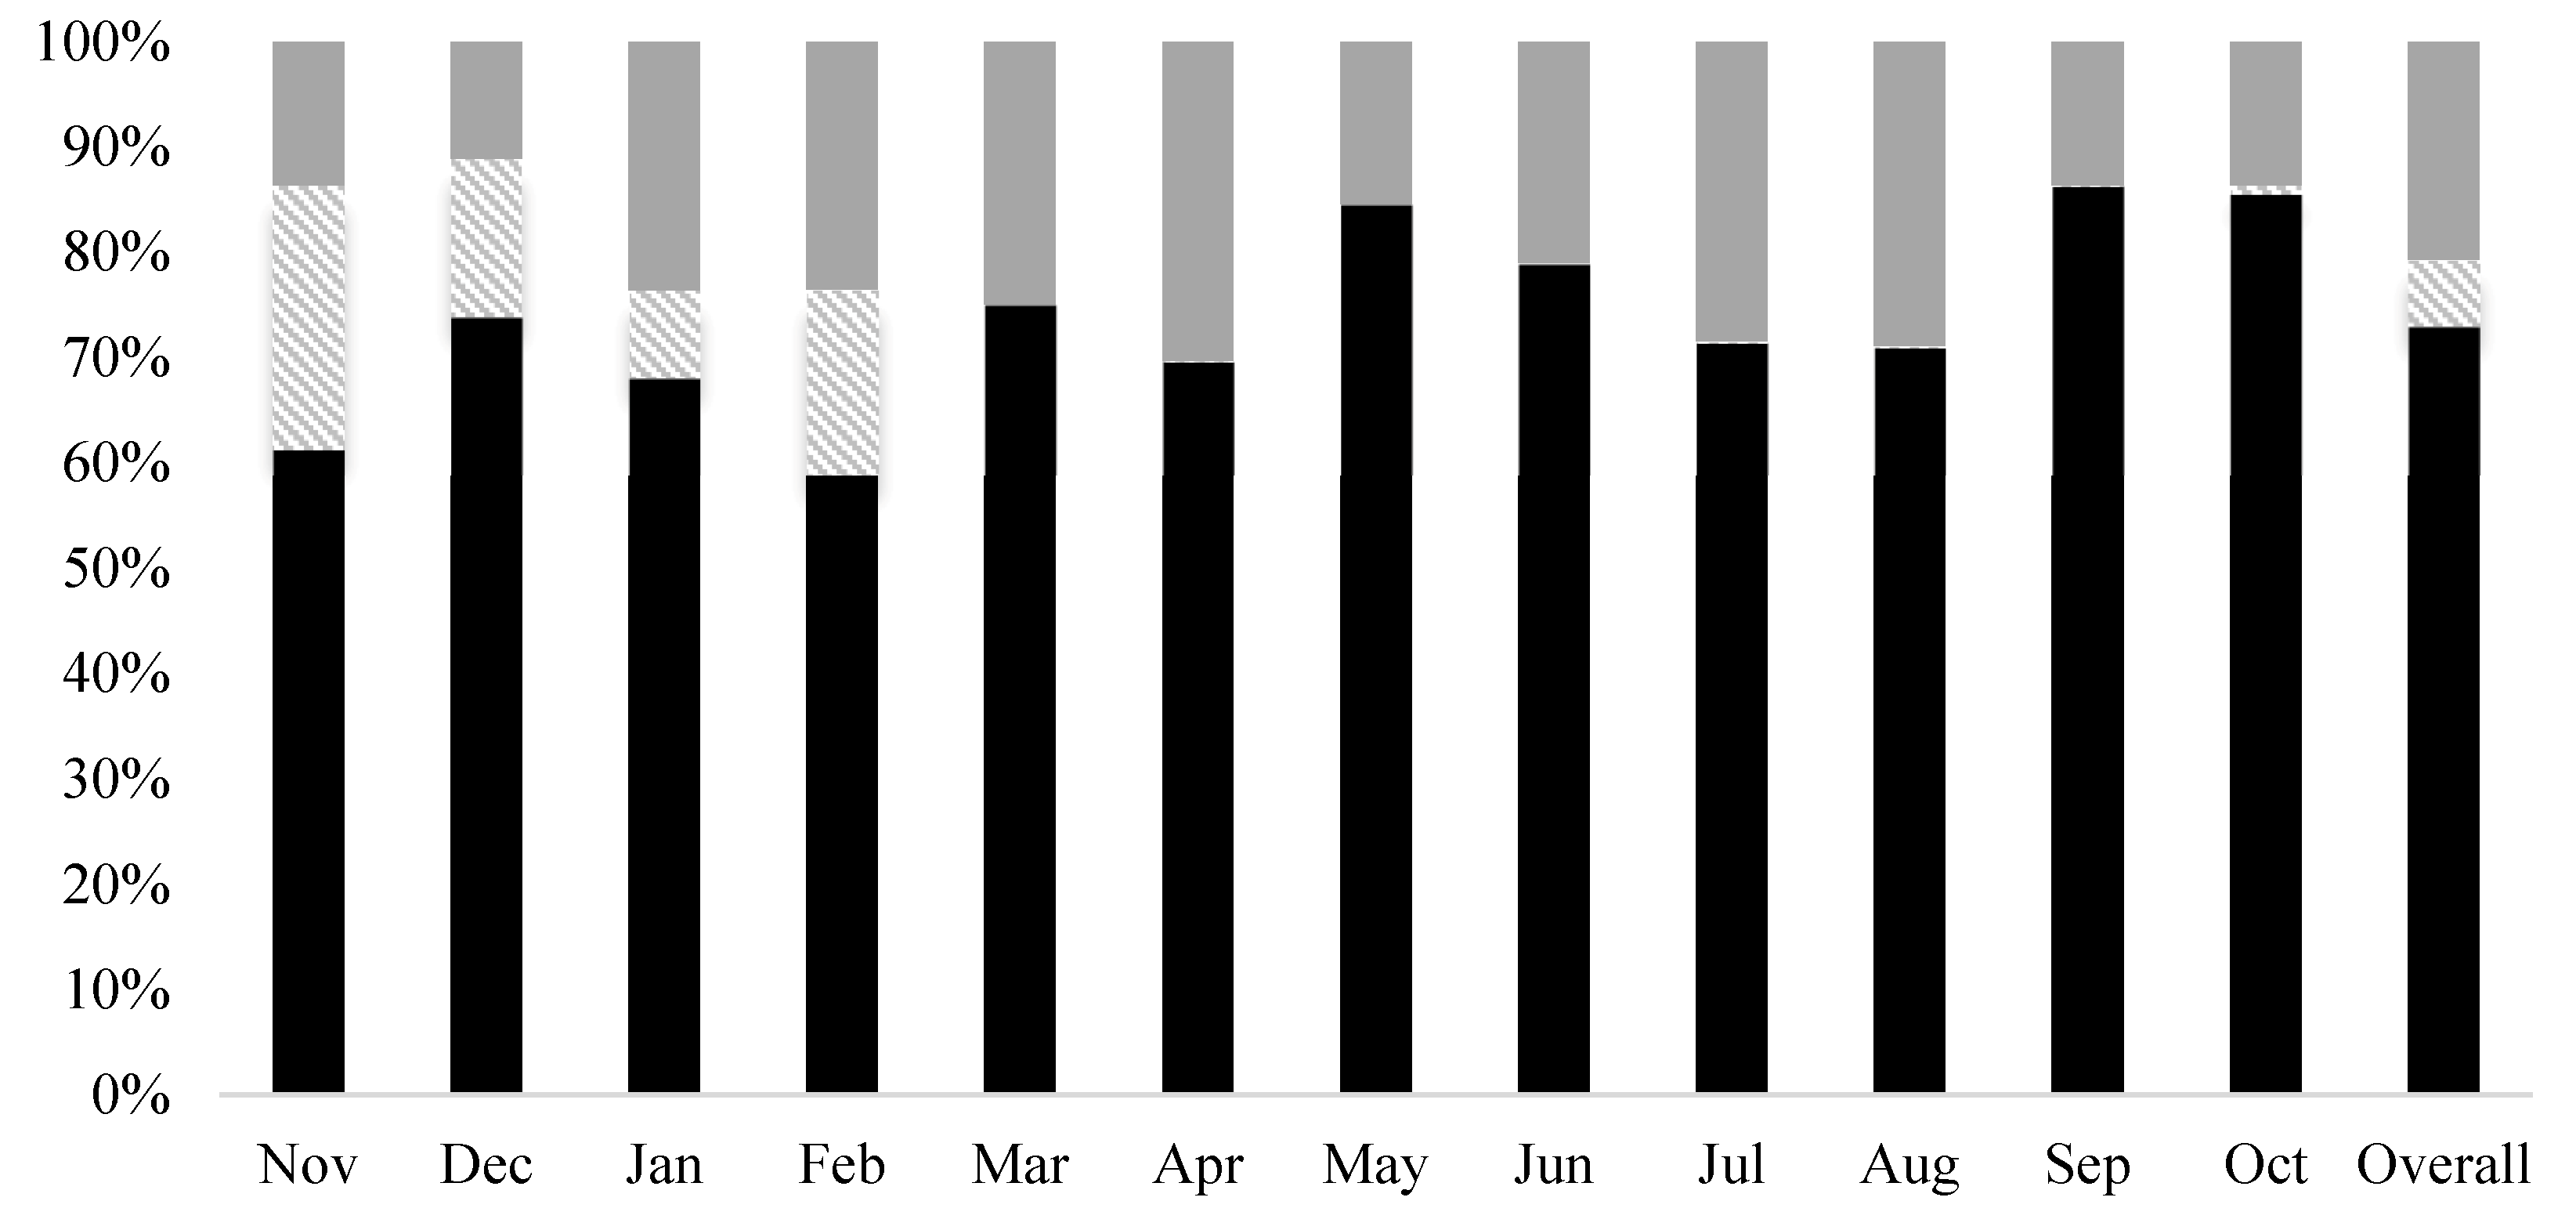
The monthly percentages of local recyclable, potential recyclable, and nonrecyclable waste are shown in Figure 2. With 72.96% of the solid waste being locally recyclable and 6.35% being potentially recyclable, the overall recycling potential of solid waste on the LL Campus of HAU in China is 79.31%. Monthly recycling potentials vary over the 12-month fieldwork period with the highest being in November (86.39%), followed by October (86.38%,) and September (86.34%), and the lowest being in April (69.66%). Figure 2 also indicates that the potentially recyclable solid waste is almost absent from March to September. The possible reason is that potentially recyclable waste (mainly leaves and branches) is rare in spring and summer and rich in autumn and winter.
Hence, the recycling potential of the solid waste generated on the LL Campus is 22% higher than AUBC in Mexico (65%) but 15% lower than KMU in Ethiopia (93%), and 1% lower than the average of all previous studies (Column 7 of Table 5).
However, the rate of potential recyclable waste (6.35%) in this study is the lowest in all studies that reported a similar statistic, notably 34% for de Vega et al. [9] and 41.7% for Adeniran et al. [13], while the rate of local recyclable waste in this study (72.96%) is the highest (32% for de Vega et al. [9] and 33.30% for Adeniran et al. [13]). There are various reasons for this, but the most obvious one is the different ways of categorizing waste. Food waste is regarded as potentially recyclable by de Vega et al. [9] and Adeniran et al. [13], because there is no local recycling market for food waste where their studies were carried out, while food waste is considered as locally recyclable in this study because there is a local food waste recycling market. The main component of potentially recyclable waste in this study is leaf litter, and its generation is seasonal and total amount is a lot less than food waste.
3.3. Waste Characterization
From high to low, the amount of solid waste generated on the LL Campus is food (60.83%), paper and cardboard (11.48%), plastic packaging bags (10.52%), sanitary waste (10.12%), leaves (6.28%), plastic bottles (0.61%), others (0.09%) including metal, glass, clothes, and sand, and animal carcasses (0.07%), in which food, leaves, and animal carcasses are organic waste, plastic packaging bags and plastic bottles are plastic waste (Table 6).
3.3.1. Organic Waste
Organic waste represents the largest stream of waste generated on the LL Campus, accounting for 67.18% (60.83% + 6.28% + 0.07%) of the total waste generated. Food waste is the biggest contributor to organic waste (91%), followed by leaves, branches, and very small amounts of animal carcass and corn cobs. Leaf litter and branches come from lawn cuttings in the garden, and it is seasonal. Corn cobs and animal carcasses are mainly generated during laboratory work in area (e), and this waste is irregular and small in volume.
Food waste is produced every day and is often wet and heavy. Dormitory buildings and cafeterias are the two areas with the largest amount of food waste, accounting for 20% and 64% of the total organic waste, respectively. Some students choose not to dine at the dining hall, but to take the food to the dormitory to eat. The leftovers are dumped in the trash can in the dormitory, which leads to the generation of organic waste in the dormitory buildings (there is no kitchen in the dormitory buildings in China). Although the food waste generated in cafeterias is transported to nearby farms as cattle feed, the food waste generated in the dormitory building is not reused. It is mixed with other waste and transported straight to landfill. On average, the entire campus generated 4441 kg of food waste every day, which is 296 g per student per day. This is 48 times higher than Nigerian college students (6 g per student per day) [13]. The main reason for the much higher food waste generation on a Chinese campus is, as a cleaner markedly put it, the students can afford to waste. Indeed, along with China’s extraordinary economic growth in recent years, Chinese parents’ income has increased greatly and so has the living standard of Chinese college students.
Painter et al. [12] identified factors that contribute to food waste on college campus, they include the distance to the dining hall, gender composition, meal times, meal options, and personal attribute. They suggested that campaigns be adopted within the university which convey the information of food waste generation on campus and economic and environmental benefits of food waste reduction, and education programmes should be designed to reflect differences in gender, age, academic programme, and level of study. Painter et al. [13] also suggested broader administrative measures, such as providing economic incentives to the cafeterias that do better in food waste reduction.
Westerman and Bicudo [23] also identified three different ways to reuse organic waste: compost production, energy generation, and for soil nutrient. Many universities reuse organic waste by making compost from them. Camosun College, located in Victoria, British Columbia, Canada, has successfully implemented a food waste composting program since 2003, which enables the recycling of 51 metric tonnes of food waste each year [8]. More sewage treatment facilities with excess digestion capacity have been used for the management of food waste in some municipalities in the U.S. The electricity generated by 100 tonnes of food waste per day could power about 1000 homes [13]. The evaluation report by Mason et al. [24] showed that the initial recovery rate of food waste was 25%, and the recovery rate increased to 88% when proper sorting was carried out on waste generated after training the cafeteria staff on the Turitea Campus Massey University, New Zealand, to do so.
3.3.2. Plastics
Plastic waste accounted for 11.13% of the total solid waste generation. The average daily generation of plastic waste was 0.82 tonnes. Area (a), the dormitory buildings, generated the largest amount of plastic waste on the LL Campus (63.37%), followed by the cafeterias (11.85%), the teaching building (10.36%), and the laboratory building (9.80%). Plastic waste includes polyethylene terephthalate (PET) bottles, disposable plastic bags, packaging bags, food bags, etc. PET bottles account for 4.04% and is the main recyclable plastic waste. Because of their higher economic value in the recycling market, PET bottles are always picked out by the cleaners who can easily exchange them for money. Disposable plastic bags often come from the packaging of online shopping, and they are not recyclable and pose a great risk to the environment. Some of the packaging bags and food bags are recyclable, but presumably because of the hassle of picking and cleaning, and maybe also because of their lower economic value, they are often mixed with the wet waste, dumped and end up in landfill.
Yildiz et al. [25] highlighted the challenges posed by plastic waste in developing countries, noting that most developing countries have large amounts of polyethylene bag waste with little recycling capacity, which has caused great environmental damage. It is necessary to effectively control the amount of plastic products used on university campuses and reduce plastic waste from the source. Convery et al. [26] reported that consumers are price-sensitive, so the use of plastic bags for an additional tax of 53 euro cents has reduced the use of plastic bags in Ireland. Hence, if an additional packing fee is added by the cafeterias on the LL Campus, students would be more likely to eat in the cafeterias, which would reduce the food and plastic waste in the dormitory buildings.
Apart from the effort from the university, central and local government in China should also put forward relevant policies to reduce/ban the use of plastic bags. China’s recent proposal for the banning of all single-use plastics across the country by 2025 is certainly encouraging news for the long-term campus sustainability.
3.3.3. Paper and Cardboard
With an average daily generation of 0.84 tonnes, paper and cardboard account for 11.48% of total solid waste and 14.48% of the recyclable solid waste generated on the LL Campus. The main component of this category is cardboard. Booming e-commerce in China has accelerated the development of the express delivery industry. Most of the cardboard comes from the package of the students’ online shopping. For the first week after the Double-Eleven Online Shopping Carnival each year, almost every cleaner in the dormitory building can earn about RMB 100 Yuan (about US$14) from selling cardboard waste. With the current local price of cardboard (0.5 Yuan/kg), the Double-Eleven Shopping Carnival can generate an estimated 1.4 tonnes of cardboard on the LL Campus, which is equal to 24 trees according to the estimate of the Environmental Protection Agency (EPA) in the U.S. Another interviewee said that the amount of cardboard generated in their dormitory building is sometimes larger, and sometimes smaller, but, in general, it varies with the festivals in China.
Although cardboard waste generated on the LL Campus is mostly recycled, the production of this waste has negative environmental impacts. To reduce the use of cardboard, Bird [27] suggested that the online retailer use plastic free boxes and reuse cardboard boxes they have in their inventory. For online food delivery, Bird [27] suggested the use of reusable containers, and for other products, he suggested that the packaging be returned rather than disposed of.
The amount of paper waste generation at the LL Campus is relatively low (12.3kg/day), and it comes mainly from used notebooks and printings. It is especially high during the exam season. Little paper waste is generated through teaching activities, thanks to the multimedia classroom policy. Leaflets from some private educational institutions that try to advertise for their training programmes contribute to the campus paper waste too, though the proportion is very small. Cleaners noted that they often saw them scattered in the teaching building, but because of the low economic value of advertising paper, cleaners are reluctant to collect and exchange them for money. It is taken as part of nonrecyclable waste to the landfill.
To reduce the amount of paper generation, a serious commitment to green office initiatives, such as paperless policies and double-sided printing, is important. The green office paper-saving initiative reduced the amount of paper used at UTM in Malaysia from 58% to 30% [18]. Some universities in the United States, in order to reduce paper waste generation, have used the unused side of paper to make rough copies or memos and reports [8]. If we place a paper waste recycling bin where a large amount of paper is generated, for instance, the print room, as a cleaner mentioned, it would separate paper from other waste and prevent paper from getting dirty, thus increase the recycling rate of the paper.
3.3.4. Other Types of Solid Waste
Because sanitary bins are not widely used in China, used sanitary towels are always dumped in the toilet bin along with the toilet paper, which is often not water soluble. Sanitary waste on the LL Campus includes a mix of toilet paper and used sanitary towels, and its daily generation is 0.74 tonnes, accounting for 10.12% of the total solid waste. Due to its nature, sanitary waste cannot be recycled or reused, and at present, the only ways to dispose of sanitary waste in China are incineration and sanitary landfill. Hence, if the generation of sanitary waste can be reduced, or if the existing products can be replaced by water-soluble products, the overall solid waste management on campus would be easier.
The amount of metal waste generated is extremely low, with an average daily generation of 2.2 kg, which is only 0.03% of the total solid waste.
A very small amount of glass waste is generated in the laboratory building, and none in other areas. The glass waste is formed of broken or unusable laboratory glassware, including Eppendorf Tubes, reagent bottles, and so on. As noted by one of the laboratory technicians, glass waste is not generated every day and only 100 glass bottles were disposed of in the previous semester. She also mentioned that there are a few other types of solid waste in the laboratory building, but the amount is very small. The factors that affect the amount of waste generated in the laboratory include the type of the lab work and materials used, along with the number of students involved in the specific lab work.
3.4. Influencing Factors of Waste Characterization and Recycling Potential
Table 5 indicates that the proportions of food waste generated on the LL Campus of HAU in China (60.83%) and KMU in Ethiopia (84.41%) are higher than others (Columns 8, 9, 10). AUBC in Mexico (2.68%), UNBC in Canada (21.64%), and ACUL in Nigeria (1.50%) have a relatively low rate of food waste, while the food waste of UTM in Malaysia is almost half of the total waste (46%). The huge differences among the proportions of food waste between universities is puzzling, although as noted above, the relative wealth of the students in China may be a factor in their wasteful behavior. More research in this field is required.
The proportion of plastic waste generation is less variable between the groups of universities, with the exception of the ACUL in Nigeria, which had a figure of 33%. The others were more uniform, with the lowest being KMU (1.83%), while UNBC in Canada (8.1%), the LL Campus of HAU in China (10.52%), and UTM in Malaysia (12.91%) are in the middle. Similarly, the percentage of paper and cardboard waste of all studies is concentrated within 30%, with the highest being 29.10% (UNBC in Canada) and the lowest being 3.65% (KMU in Ethiopia) and the rest being in the middle.
To assess the possible connection between income and the amount of waste, recycling potential and waste characterization, a correlation analysis was conducted between the national annual growth of GDP per capita in the five years before the research and the weight of the waste per day per student, recycling potential, and the main waste composition of all the studies (Table 7). It is assumed that GDP/capita is a proxy measure of income level within a country. While the dataset is limited in size (a total of six countries), it was found that the annual growth rate of per capita GDP in the five years before the research does appear to have a significant positive relationship with the proportion of food waste; the faster the per capita GDP grew in the five years before the research, the higher the percentage of food waste generated at the university. None of the other waste streams had such a statistically significant link to annual growth rate of GDP per capita. The link between economic growth and food waste was also identified by the Food and Agriculture Organization (FAO) of the United Nations, which conducted research in 2011 on global food waste and concluded that a country’s income level plays a role in affecting the stages of food waste in the supply chain, i.e., lower-income countries waste more food at the early and middle stages of the supply chain due to limited production and post-harvesting handling techniques and inappropriate storage, while high- and middle-income countries waste more food at the consumption stage. The finding from the study reported here also resonate with Mondejar-Jimenez’s et al. [28] finding that the youth and young adults comprise the portion of the population that are most inclined to waste food in industrialized countries. However, it should be stressed that age and income (wealth) are not the only factors at play here. Apart from the factors (i.e., gender, education, awareness, etc.) discussed in Section 3.3.1, cultural and social norms and peer pressure are also regarded as important drivers behind waste behaviour [29,30,31]. Hence, running anti-waste campaigns and creating anti-waste social norms could influence individuals to behave in a manner to reduce their waste.
Table 7 also indicates that the recycling potential is positively related to the proportion of food waste on university campuses, which implies a connection between recycling potential and waste characterization. The higher the proportion of food waste, then the higher the recycling potential. It is understandable considering that food waste had been considered as recyclable waste in all studies, and its proportion in waste generation would no doubt have a positive influence on the recycling rate. This result emphasizes the importance of reducing food waste on a university campus in order to achieve campus sustainability.
4. Conclusions
An average of 7.32 tonnes of solid waste are generated on the LL Campus each day, and this equates to 487 g per student per day. Waste characterization analysis indicates that food waste is the highest proportion of solid waste on the LL Campus of HAU, followed by paper and cardboard waste, and plastic waste.
By comparing the result from this study with those published for universities in other countries, it was found that the annual growth of GDP per capita in the past five years before the research is an important influencing factor of food waste on university campus, whether it is a low-income country or a higher-income country. While the data set is limited in size, the results suggest that the higher the annual growth of GDP per capita in the past five years before the research, the higher the proportion of food that was wasted on campus.
The overall recycling potential is very high for the LL Campus of HAU (79.31%). The local recycling market can absorb around 92% of all the recyclables, the rest could be reused by recycling markets somewhere else in China. Waste characterization is found to be an influencing factor of recycling potential, and the higher the proportion of food waste, the higher the recycling potential.
To reduce food waste so as to improve the campus SWM on the LL Campus and other university campuses in China, it is suggested that the universities improve the education in environmental protection for college students and the need to reduce waste, especially food waste.
Author Contributions
Conceptualization, D.Z.; methodology, D.Z.; data collection, M.H., S.C.; writing—original draft preparation, M.H., D.Z.; writing—review and editing, D.Z., S.M.; funding acquisition, D.Z.. All authors have read and agreed to the published version of the manuscript.
Funding
This research was funded by the Department of Science and Technology, grant number: 202400410096, and Henan Agricultural University, grant number: 201910466019.
Conflicts of Interest
The authors declare no conflict of interest.
References
- Chen, X.; Geng, Y.; Fujita, T. An overview of municipal solid waste management in China. Waste Manag. 2010, 30, 716–724. [Google Scholar] [CrossRef] [PubMed]
- Li, G. Launching pilot project of “Waste-free City” to improve the level of solid waste resource utilization. Environ. Prot. 2019, 47, 8–9. [Google Scholar] [CrossRef]
- General Office of the State Council of China. Notice of the General Office of the State Council on the issuance of the Pilot Work Plan for the Construction of “No Waste City”. Available online: http://www.gov.cn/zhengce/content/2019-01/21/content_5359620.htm (accessed on 16 February 2020).
- Shanghai Municipal People’s Congress. Shanghai Domestic Waste Management Regulations. Available online: http://www.spcsc.sh.cn/n1939/n2440/n5781/u1ai190025.html (accessed on 19 February 2020).
- Ministry of Housing and Urban-Rural Development of China. National Urban Domestic Waste Classification Work Conference was Held in Shanghai. Available online: http://www.mohurd.gov.cn/jsbfld/201902/t20190222_239548.html (accessed on 19 February 2020).
- Li, D. Evolutionary game analysis on the supervision mechanism of waste sorted collection in colleges and universities. Chin. J. Environ. Manag. 2017, 5, 90–94. [Google Scholar] [CrossRef]
- Alshuwaikhat, H.M.; Abubakar, I. An integrated approach to achieving campus sustainability: Assessment of the current campus environmental management practices. J. Clean. Prod. 2008, 16, 1777–1785. [Google Scholar] [CrossRef] [Green Version]
- Smyth, D.P.; Fredeen, A.L.; Booth, A.L. Reducing solid waste in higher education: The first step towards ‘greening’ a university campus. Resour. Conserv. Recycl. 2010, 54, 1007–1016. [Google Scholar] [CrossRef]
- De Vega, C.A.; Ojeda Benítez, S.; Ramirez Barretob, M.E. Solid waste characterization and recycling potential for a university campus. Waste Manag. 2008, 28, S21–S26. [Google Scholar] [CrossRef]
- Rada, E.C.; Bresciani, C.; Girelli, E.; Ragazzi, M.; Schiavon, M.; Torretta, V. Analysis and measures to improve waste management in schools. Sustainability 2016, 8, 840. [Google Scholar] [CrossRef] [Green Version]
- Lonescu, G.; Rata, E.C.; Ragazzi, M.; Marculescu, C.; Badea, A.; Apostol, T. Integrated municipal solid waste scenario model using advanced pretreatment and waste to energy processes. Energy Conversion and Management 2013, 76, 1083–1092. [Google Scholar] [CrossRef]
- Painter, K.; Thondhlana, G.; Kua, H.W. Food waste generation and potential interventions at Rhodes University, South Africa. Waste Manag. 2016, 56, 491–497. [Google Scholar] [CrossRef]
- Adeniran, A.E.; Nubi, A.T.; Adelopo, A.O. Solid waste generation and characterization in the University of Lagos for a sustainable waste management. Waste Manag. 2017, 67, 3–10. [Google Scholar] [CrossRef]
- Gebreeyessus, G.D.; Berihun, D.; Terfassa, B. Characterization of solid wastes in higher education institutions: The case of Kotebe Metropolitan University, Addis Ababa, Ethiopia. Int. J. Environ. Sci. Technol. 2019, 16, 3117–3124. [Google Scholar] [CrossRef]
- Trends in Solid Waste Management. Available online: https://datatopics.worldbank.org/what-a-waste/trends_in_solid_waste_management.html (accessed on 10 March 2020).
- Implementation Plan of Municipal Solid Waste Classification System (in Chinese). Available online: http://www.gov.cn/zhengce/content/2017-03/30/content_5182124.htm (accessed on 10 March 2020).
- Yang, G.; Pan, X.; Luo, Y. Dynamic relationship between resources sustainability and human development and policy implications. Economist 2014, 36–45. [Google Scholar] [CrossRef]
- Zen, I.S.; Subramaniam, D.; Sulaiman, H.; Saleh, A.L.; Omar, W.; Salim, M.R. Institutionalize waste minimization governance towards campus sustainability: A case study of Green Office initiatives in Universiti Teknologi Malaysia. J. Clean. Prod. 2016, 135, 1407–1422. [Google Scholar] [CrossRef]
- Feng, W.; Cai, Y.; Gu, B. Population, Policy, and Politics: How Will History Judge China’s One-Child Policy? Popul. Dev. Rev. 2013, 38, 115–129. [Google Scholar] [CrossRef] [Green Version]
- Cameron, L.; Erkal, N.; Gangadharan, L.; Meng, X. Little emperors: Behavioural impacts of China’s one-child policy. Science 2013, 339, 953–957. [Google Scholar] [CrossRef] [PubMed]
- Zhang, D.; Jiang, Q.; Ma, X.; Li, J. Drivers for food risk management and corporate social responsibility; a case of Chinese food companies. J. Clean. Prod. 2014, 66, 520–527. [Google Scholar] [CrossRef]
- Qi, X. Face: A Chinese concept in a global sociology. J. Sociol. 2011, 47, 279–295. [Google Scholar] [CrossRef]
- Westerman, P.W.; Bicudo, J.R. Management considerations for organic waste use in agriculture. Bioresour. Technol. 2005, 96, 215–221. [Google Scholar] [CrossRef]
- Mason, I.G.; Brooking, A.K.; Oberender, A.; Harfordb, J.M.; Horsleyb, P.G. Implementation of a zero waste program at a university campus. Resour. Conserv. Recycl. 2003, 38, 257–269. [Google Scholar] [CrossRef]
- Yildiz, S.; Yaman, C.; Demir, G.; Ozcan, H.K.; Coban, A.; Okten, H.E.; Sezer, K.; Goren, S. Characterization of municipal solid waste in Istanbul, Turkey. Environ. Prog. Sustain. Energy 2013, 32, 734–739. [Google Scholar] [CrossRef]
- Convery, F.; Mcdonnell, S.; Ferreira, S. The most popular tax in Europe? Lessons from the Irish plastic bags levy. Environ. Resour. Econ. 2007, 38, 1–11. [Google Scholar] [CrossRef]
- Bird, J. What a waste: Online Retail’s Big Packaging Problem. Available online: https://www.forbes.com/sites/jonbird1/2018/07/29/what-a-waste-online-retails-big-packaging-problem/#6cb6c66e371d (accessed on 10 March 2020).
- Mondejar-Jimenez, J.; Ferrari, G.; Secondi, L.; Principato, L. From the table to waste: An exploratory study on behaviour towards food waste of Spanish and Italian youths. J. Clean. Prod. 2016, 138, 8–18. [Google Scholar] [CrossRef]
- Stangherlin, I.; de Barcellos, M.D. Drivers and barriers to food waste reduction. Br. Food J. 2018, 120, 2364–2387. [Google Scholar] [CrossRef]
- Hebrok, M.; Boks, C. Household food waste: Drivers and potential intervention points for design—an extensive review. J. Clean. Prod. 2017, 151, 380–392. [Google Scholar] [CrossRef]
- Merrow, K.; Penzien, P.; Dubats, T. Exploring Food Waste Reduction in Campus Dining Halls. Available online: https://wmich.edu/sites/default/files/attachments/ENVS%204100%20Final%20Project%20Report%20-%20Merrow,%20Penzien,%20Dubats.pdf (accessed on 4 April 2020).
Figure 1.
Solid waste collection areas marked on the map of the LL Campus of the Henan Agricultural University (HAU).
Figure 1.
Solid waste collection areas marked on the map of the LL Campus of the Henan Agricultural University (HAU).
Figure 2.
Recycling potential of solid waste on the LL Campus.

Table 1.
Building groups and the number of cleaners in each area
| Area | Building Groups | The Number of Cleaners |
|---|---|---|
| (a) | Seven male dormitory buildings, nine female dormitory buildings | 28 |
| (b) | First cafeteria and second cafeteria | 24 |
| (c) | Gardens, playgrounds, and roads | 9 |
| (d) | Academic area (including administrative building, computer building, teaching building) | 16 |
| (e) | Laboratory building | 10 |
Table 2.
Categories of solid waste on the LL Campus and their recyclability levels.
| Category | Description | Recyclability Levelb | ||
|---|---|---|---|---|
| 1 | 2 | 3 | ||
| Organic waste | Food waste | √ | ||
| Leaves, branches, flowers, corn cobs, etc. | √ | |||
| Animal carcasses | √ | |||
| Plastics | Plastic packaging bags, disposable plastic bags, food bags, etc. | √ | ||
| Plastic bottlesa | √ | |||
| Cardboard and paper | Cardboard packaging, paper boxes, etc. | √ | ||
| Printing paper, book paper, etc. | √ | |||
| Sanitary waste | Toilet paper, sanitary pads, etc. | √ | ||
| Others | Glass utensils | √ | ||
| Metal, tin cans, aluminium bottles, etc. | √ | |||
| Clothes, textiles, etc. | √ | |||
| Sand, dirt, hair, etc. | √ | |||
a Plastic bottles refer to all recyclable plastic containers in the local market; b 1 = Waste for which there exists a local recycling market; 2 = Waste for which there is not a local recycling market but there is somewhere else in China; 3 = Nonrecyclable waste.
Table 3.
Demographic information of interviewees.
| Area (a) | Area (b) | Area (c) | Area (d) | Area (e) | Recycling Waste Collector | Waste Transporter | Local Recycling Centre Employee | Total | |||||
|---|---|---|---|---|---|---|---|---|---|---|---|---|---|
| Cleaner | Gardener | Cleaner | Lab Technician | Food Waste Transporter | Other Waste Transporter | ||||||||
| Gender | Male | 56 | 51 | 22 | 6 | 30 | 10 | 9 | 2 | 2 | 6 | 4 | 198 |
| Female | 75 | 37 | 13 | 0 | 42 | 33 | 14 | 2 | 0 | 0 | 2 | 218 | |
| Age group (years old) | 30 and younger | 0 | 0 | 0 | 0 | 0 | 0 | 21 | 0 | 0 | 0 | 0 | 21 |
| 31–40 | 2 | 0 | 0 | 0 | 0 | 2 | 1 | 1 | 1 | 1 | 0 | 8 | |
| 41–50 | 32 | 1 | 2 | 0 | 9 | 11 | 1 | 0 | 1 | 1 | 2 | 60 | |
| 51–60 | 74 | 46 | 24 | 5 | 46 | 30 | 0 | 3 | 0 | 4 | 3 | 235 | |
| Above 60 | 23 | 41 | 9 | 1 | 17 | 0 | 0 | 0 | 0 | 0 | 1 | 92 | |
| Total | 131 | 88 | 35 | 6 | 72 | 43 | 23 | 4 | 2 | 6 | 6 | 416 | |
Note: Total number of interviewees in Area (a–e) is bigger than the number of cleaners in the respective area in Table 1; it is because cleaning is a low-paid and temporary job, people come and leave the job often from November 2018 to October 2019.
Table 4.
Mean daily solid waste generation for each month and area (a–e) of the LL Campus (tonnes) along with the percentage contribution to the campus total.
Table 4.
Mean daily solid waste generation for each month and area (a–e) of the LL Campus (tonnes) along with the percentage contribution to the campus total.
| Month | Mean Daily Waste Generation (% of the total) | Sum of Means | ||||
|---|---|---|---|---|---|---|
| Area (a) | Area (b) | Area (c) | Area (d) | Area (e) | ||
| Nov 2018 | 2.82 (30.1) | 2.95 (31.5) | 2.53 (27.1) | 0.91 (9.7) | 0.15 (1.6) | 9.36 (100) |
| Dec 2018 | 2.60 (33.4) | 3.49 (44.9) | 1.28 (16.5) | 0.15 (1.9) | 0.26 (3.3) | 7.78 (100) |
| Jan 2019 | 1.64 (28.1) | 2.74 (47.1) | 0.69 (11.9) | 0.28 (4.8) | 0.47 (8.1) | 5.82 (100) |
| Feb 2019 | 3.02 (37.4) | 3.16 (39.2) | 1.56 (19.3) | 0.20 (2.5) | 0.13 (1.6) | 8.07 (100) |
| Mar 2019 | 3.05 (35.5) | 4.83 (56.2) | 0.03 (0.3) | 0.38 (4.4) | 0.31 (3.6) | 8.60 (100) |
| Apr 2019 | 5.42 (52.7) | 4.00 (38.9) | 0.08 (0.8) | 0.46 (4.5) | 0.32 (3.1) | 10.28 (100) |
| May 2019 | 3.24 (38.1) | 4.35 (51.1) | 0.12 (1.4) | 0.45 (5.3) | 0.35 (4.1) | 8.51 (100) |
| Jun 2019 | 3.99 (44.7) | 3.83 (42.9) | 0.09 (1.0) | 0.61 (6.8) | 0.41 (4.6) | 8.93 (100) |
| Jul 2019 | 1.19 (47.8) | 0.54 (21.6) | 0.01 (0.4) | 0.17 (6.7) | 0.59 (23.5) | 2.50 (100) |
| Aug 2019 | 0.68 (25.6) | 1.20 (45.3) | 0.01 (0.4) | 0.12 (4.6) | 0.64 (24.1) | 2.65 (100) |
| Sep 2019 | 1.94 (27.8) | 4.13 (59.3) | 0.05 (0.7) | 0.35 (5.0) | 0.50 (7.2) | 6.97 (100) |
| Oct 2019 | 2.42 (30.0) | 4.53 (56.1) | 0.40 (4.9) | 0.33 (4.1) | 0.40 (4.9) | 8.08 (100) |
| Average | 2.67 (36.6) | 3.31 (45.3) | 0.57 (7.8) | 0.37 (5.1) | 0.38 (5.2) | 7.32 (100) |
| Average waste generation per day from November 2018 to October 2019: 7.32 tonnes | ||||||
| Average waste generation per student per day from November 2018 to October 2019: 487 g | ||||||
Note: Figures in parenthesis are the percentage contribution of each area to the total. For example, 2.82 is the daily average for the month of November 2018 in area (a), while 9.36 is the sum of the daily averages for the five areas (2.82 + 2.95 + 2.53 + 0.01 + 0.15) in the same month. Thus, for area (a) in November 2018, the percentage was found by (2.82/9.36)*100, which equals 30.1%; Source: data obtained from field interviews with respondents outlined in Table 3.
Table 5.
Comparison of waste generation, recycling potential, and waste characterization with previous research.
Table 5.
Comparison of waste generation, recycling potential, and waste characterization with previous research.
| Country of Study | Annual Growth of GDP per Capita in the 5 Years before the Study (%) | Waste Generation | Recycling Potential (%) | Food (%) | Plastics (%) | Paper & Cardboard (%) | |||
|---|---|---|---|---|---|---|---|---|---|
| Tonne/Day | g/Day/Student | ||||||||
| Previous studies | de Vega et al. (2008)a | Mexico | 1.44 | 1 | N/A | 65.00 | 2.68h | 4.84 | 26.60 |
| Smyth et al. (2010)b | Canada | 1.77 | 0.24g | 16g | 71.60 | 21.64 | 8.10 | 29.10 | |
| Zen et al. (2016)c | Malaysia | 3.87 | 0.56 | 830 | 86.60 | 46.00 | 12.91 | 16.12 | |
| Adeniran et al. (2017)d | Nigeria | 0.93 | 32.2 | 370 | 75.00 | 1.50i | 33.00 | 15.00 | |
| Gebreeyessus (2019)e | Ethiopia | 6.36 | 0.20 | 93 | 93.00 | 84.41 | 1.83 | 3.65 | |
| This study | Zhang et al. (2020) | China | 6.31f | 7.32 | 487 | 79.31 | 60.83 | 10.52 | 11.48 |
Source: GDP data is from the World Bank (various years): (a) Campus Mexicali I of the Autonomous University of Baja California (AUBC), Mexico; (b) Prince George Campus of the University of Northern British Columbia (UNBC), Canada; (c) Universiti Teknologi Malaysia (UTM), Malaysia; (d) Akoka Campus of the University of Lagos (ACUL), Nigeria; (e) Kotebe Metropolitan University (KMU), Ethiopia; (f) due to data availability, 2013–2018′s GDP per capita is used for China; (g) calculated based on Smyth et al. (2010): 1.2 and 2.2 tonnes of waste per week and annual enrolment of 5038 students; (h) calculated based on de Vega et al. (2008): food waste = 54.1% of the waste in community centre, which is 238 kg, and the total waste = 4800 kg; (i) calculated based on Adeniran et al. (2017): food waste = 10% of the total organic waste, and organic waste = 15% of total waste.
Table 6.
Waste Characterization (%).
| Waste Categories | % of the Weight of Solid Waste in the Area | ||||||
|---|---|---|---|---|---|---|---|
| Area (a) | Area (b) | Area (c) | Area (d) | Area (e) | Overall | ||
| Organics | Food waste | 37.82 | 94.00 | 6.40 | 26.14 | 42.85 | 60.83 |
| Leaves | 0.00 | 0.00 | 80.86 | 0.00 | 0.33 | 6.28 | |
| Animal carcasses | 0.00 | 0.00 | 0.00 | 0.00 | 1.34 | 0.07 | |
| Plastics | Plastic packaging bags | 15.26 | 3.90 | 5.20 | 19.58 | 17.48 | 10.52 |
| Plastic bottles | 1.14 | 0.10 | 0.78 | 1.12 | 0.66 | 0.61 | |
| Paper and cardboard | 20.27 | 0.00 | 4.20 | 22.93 | 16.49 | 11.48 | |
| Sanitary waste | 25.39 | 1.98 | 2.48 | 30.23 | 20.35 | 10.12 | |
| Others | 0.12 | 0.02 | 0.08 | 0.00 | 0.50 | 0.09 | |
| Total | 100.00 | 100.00 | 100.00 | 100.00 | 100.00 | 100.00 | |
Note: Others including metal, glass, clothes, sand, etc.
Table 7.
Correlation analysis between GDP and the weight of the waste, the recycling potential and waste characterisation.
Table 7.
Correlation analysis between GDP and the weight of the waste, the recycling potential and waste characterisation.
| GDP per Capita Growth in the 5 Years before the Research (annual, %) | Weight (g/day/person) | Recycling Potential (%) | Food (%) | Plastic (%) | Paper & Cardboard (%) | |
|---|---|---|---|---|---|---|
| GDP per capita growth rate in the 5 years before the research (annual, %) | 1 | |||||
| Weight (g/day/person) | 0.098 ns | 1 | ||||
| Recycling potential (%) | 0.762 ns | 0.210 ns | 1 | |||
| Food (%) | 0.964** | −0.011ns | 0.866* | 1 | ||
| Plastics (%) | −0.483 ns | 0.293ns | −0.162 ns | −0.514 ns | 1 | |
| Paper & cardboard (%) | −0.633 ns | −0.144 ns | −0.779 ns | −0.630 ns | −0.219 ns | 1 |
Figures are the correlation coefficients (df = 4); ** Correlation is significant at 0.01 level (2-tailed); * Correlation is significant at 0.05 level (2-tailed); ns = not significant at 0.05.
© 2020 by the authors. Licensee MDPI, Basel, Switzerland. This article is an open access article distributed under the terms and conditions of the Creative Commons Attribution (CC BY) license (http://creativecommons.org/licenses/by/4.0/).
Share and Cite
MDPI and ACS Style
Zhang, D.; Hao, M.; Chen, S.; Morse, S. Solid Waste Characterization and Recycling Potential for a University Campus in China. Sustainability 2020, 12, 3086. https://doi.org/10.3390/su12083086
AMA Style
Zhang D, Hao M, Chen S, Morse S. Solid Waste Characterization and Recycling Potential for a University Campus in China. Sustainability. 2020; 12(8):3086. https://doi.org/10.3390/su12083086
Chicago/Turabian StyleZhang, Dongyong, Mengge Hao, Sida Chen, and Stephen Morse. 2020. "Solid Waste Characterization and Recycling Potential for a University Campus in China" Sustainability 12, no. 8: 3086. https://doi.org/10.3390/su12083086
Note that from the first issue of 2016, this journal uses article numbers instead of page numbers. See further details here.