Proposal of Package-to-Product Indicator for Carbon Footprint Assessment with Focus on the Czech Republic


Department of Environmental Chemistry, University of Chemistry and Technology Prague, Technická 5, 166 28 Prague, Czech Republic
*
Author to whom correspondence should be addressed.
Sustainability 2020, 12(7), 3034; https://doi.org/10.3390/su12073034
Submission received: 18 March 2020
/
Revised: 6 April 2020
/
Accepted: 8 April 2020
/
Published: 10 April 2020
(This article belongs to the Special Issue Carbon Footprint and Sustainability Assessment)
Abstract
:Today, packaging is an integral part of most foods and beverages. However, excessive and just one-time applications of packaging can bring about indisputable environmental impacts in the form of large amounts of waste generated. If we want to monitor the environmental impacts of packaging materials, it is advisable to assess them in a complex way including not only the specific packaging but also specific products. No universal methodology currently exists that would enable this type of complex assessment regarding the environmental impacts of packaging in relation to particular products. Therefore, the aim of our study was to develop and test a Package-to-Product (PtP) indicator. For this purpose, the life cycle assessment (LCA) was employed to analyse four selected products considering different life cycle stages of packaging and their impacts on the climate change category. The results of the study confirm that the values of the PtP indicator significantly differ for various products, thus emphasising the need to establish a uniform methodology for individual product groups, such as meat, dairy and vegetable products or beverages. The application of this indicator, however, enables a clear impact assessment of different packaging materials and allows the packaging manufacturers to reduce their overall environmental impacts.
1. Introduction
The amount of packaging waste is constantly growing. According to Eurostat data for the year of 2017, EU generated 31.2 million tonnes of waste from paper and cardboard packaging, 14.5 million tonnes of waste from plastic, followed by 14 million tonnes of glass, 13 million tonnes of wood packaging waste, and almost 4 million tonnes of metallic packaging waste. This means that in 2017, the average European citizen produced around 173 kg of packaging waste [1]. It is now estimated that two-thirds of all household packaging come from the food industry [2].
Increasing amounts of packaging waste cause undeniable environmental impacts, especially in the form of excessive consumption of primary raw materials in their production phase as well as in the phase of their disposal, when large amounts still end up in landfills or worse, as litter. Recently, society has also been showing a growing concern about the environmental problems associated with the world’s oceans being polluted and littered with various types of packaging materials, especially plastics [3,4].
To effectively prevent the generation of packaging waste, it is first appropriate to quantify its environmental impacts associated with its entire life cycle, from the production stage to its disposal. Different types of packaging materials have different environmental impacts at different stages of their life cycles. While certain types of packaging are energetically demanding at their production stage, e.g., paper packaging [5], other types produce hazardous waste and significant amounts of atmospheric emissions during the production of primary materials, e.g., aluminium packaging [6]. Certain packaging may then be difficult to recycle, e.g., liquid packaging board [7]. Last but not least, packaging can also be made from materials that can decompose very slowly and bring other environmental problems this way, e.g., plastic packaging [8]. As already indicated, the handling and disposal of packaging after the end of its life cycle also plays quite an important role, since different impacts are caused by the packaging disposed at landfills compared to the packaging recycled for energy or material generation. In this respect, it is important to consider not only the type of raw materials from which the packaging is made but also their quantities [9,10].
As already mentioned, the primary role of food packaging is to protect and preserve food and beverages. In other words, packaging helps prevent food waste. Since the packaging is a part of the product, together they form one system. For this reason, it is appropriate to monitor the food and its package as one entity and assess the environmental impacts of both of its constituents. In that regard, it is worth mentioning that the overall environmental impact of food production is usually many times greater than the impact of its packaging [10,11]. Additionally, it is generally true that the environmental impacts of animal products tend to be higher than those of plant products [12].
It follows that, in order to compare individual packaging materials and types of packaging, it is necessary to evaluate the packages together with the respective product considering their entire life cycle. Life cycle assessment (LCA) is one of the few analytical methods currently available to cover all the different stages of the packaging life cycle and to assess their environmental impacts. Currently, however, there exists no uniform methodology that comprehensively compares the environmental impacts of the entire life cycle of packaging materials to the specific products they are used for. Such a methodology is much needed as it could serve as a tool to prevent the generation of unnecessary packaging waste. That is why this study focused on the development of a Package-to-Product (PtP) indicator, which would be able to analyse the environmental impacts of products and their packaging, thus serving as a waste prevention tool.
The aim of the study was: to create an indicator assessing the environmental impacts of the packaging together with the corresponding product and test the validity of the indicator in selected case studies focused on food packaging.
2. Materials and Methods
2.1. Types of Packaging
Food packaging is generally divided into three main groups: primary, secondary, and tertiary packaging. The groups are defined in more detail below.
2.1.1. Primary Packaging
The principal function of the primary or consumer packaging is to protect the products which the packaging is in direct contact with. The primary packaging further facilitates the handling and transport of products and, last but not least, it serves for marketing and information purposes. In this study, we looked at several types of packaging from different materials, such as glass, plastic, paper or fabric.
2.1.2. Secondary Packaging
Secondary packaging or group packaging facilitates the transport of multiple primary packages within a product distribution chain. Most often, these packages are made of paper, wood, plastic or various foils. Secondary packaging may usually be used multiple times.
2.1.3. Tertiary Packaging
The purpose of tertiary or transport packaging is to provide for the product transport. The most common type of tertiary packaging is a wooden or plastic pallet in combination with a stretch foil. Tertiary packaging is usually used multiple times.
2.2. Life Cycle Assessment
To create the PtP indicator, the LCA method was used enabling its testing on case studies. The LCA study was conducted in accordance with international standards ISO 14040 and 14044 [13,14]. LCA is an information analysis tool that can be used to quantify the potential environmental impact of a product or service. This method evaluates all inputs and outputs that interact with the environment of a given system, considering its entire life cycle. The evaluation, therefore, includes the processes of raw material acquisition, production of materials, consumed energy, production of waste, and emissions released into individual environmental compartments after the product life cycle ends [15].
2.2.1. System Boundaries and Functional Unit
For the purpose of the study, it was necessary to define a so-called functional unit to which all material and energy flows and the related environmental impacts. A functional unit was defined as “1000 kg of a product packaged in primary, secondary and tertiary packaging”. In order to verify the PtP indicator, we focused on its application to assess four examples of packaged products. The packaged products evaluated included cow’s milk, water, pork, and peas. The first product selected for assessment was cow’s milk. According to Czech Statistical Office data, in the Czech Republic in 2017, milk consumption was 240 L per capita on average. As milk is the most produced dairy product in the Czech Republic, cow’s milk was chosen as the representative for this category. Secondly, we evaluated bottled drinking water. Since both mineral water and soda water represent a significant part of the packaged beverage market in the Czech Republic (approximately 35%), drinking water was selected as a representative of soft drinks. The Czech Republic is a major consumer of pork, and in 2017, it consumed 42 kg on average per capita. As far as the representation of the Czech meat market is concerned, pork represents more than 50% of all the consumption and was, therefore, selected as the third product to be assessed. The last product evaluated is peas and its packaging options. Peas were chosen as a representative of the legume group, because in this category, it shows the highest average consumption in the Czech Republic [16]. Peas can also be considered a representative of vegetarian food.
The life cycle of each product under consideration consists of a variety of processes. The system boundaries determine which processes are significant for a given product system and need to be evaluated in the study [15]. Figure 1 represents the system boundaries as defined in our research. For the purpose of this work, the product manufacturing and life cycles of primary, secondary and tertiary packaging were assessed. Within the boundaries of the product life cycle of packaging materials, the study also analysed the packaging production; i.e., obtaining primary raw materials, energy production demand, transport and possible ways of ending the packaging life cycle. The usage phase of the packaging is assumed not to produce environmental impacts. Therefore, this phase was excluded from the boundaries of the systems assessed. As the study does not focus on food waste issues, the end-of-life cycle of the packaged product is not included in the system boundaries either.
2.2.2. Assumptions Accepted in the Study:
- To model electricity production, the Czech energy mix was used based on the data from the reference year of 2016;
- The number of possible uses (re-circulation) of refundable glass was set to 30 [19];
- The number of possible uses of plastic crates was set to 30 [19];
- The number of possible uses of wooden pallets was set to 25 [19];
- The materials used for the packaging were modelled as the materials derived from the primary raw materials;
- Packaging labels and stickers were not included in the study;
- The methods of transport and the transport distance were modelled for the production of the products and their packaging according to the recommendation of Guidance for the development of Product Environmental Footprint Category Rules - PEF [19]:
- ○
- Transport distance of packaging from a supplier to a processor within Europe was set to 230 km of truck transport, 280 km of rail transport, 360 km of shipping;
- ○
- Transport of products from a supplier to a processor within Europe was set to 130 km of truck transport, 240 km of rail transport, 270 km of shipping.
- For the transport of packaging to the place of material recovery after the end-of-its-life cycle, the packaging is supposed to be transported by trucks over the distance of 250 km. In the case of transport to places of energy recovery, the average distance is estimated to be 150 km and the transport distance of packaging to a landfill is expected to be ca. 50 km.
2.2.3. End-of-Life Scenarios
Environmental impacts of the product life cycle can be significantly affected by the way the product is handled at the end of its cycle: the packaging can be used for material or energy recovery, or it can be disposed at a landfill. Four end-of-life (EoL) scenarios were developed for the purpose of this study. Since the validity testing of the PtP indicator was focused on the Czech Republic, the first EoL scenario considers the value of average waste management in the Czech Republic, where, after the EoL life cycle, the expectations are as follows: 39 wt. % of waste material recovery, 18 wt. % of energy recovery, and 53 wt. % of waste disposal at a landfill [20]. In the case of pallets and cotton, their material recovery is not considered in this EoL scenario, but 50 wt. % are expected to be utilised energetically while the other 50 wt. % are assumed to end up landfilled. The second scenario represents the situation where all the packaging is 100% energetically utilised in an incineration plant. The third scenario assumes 100% material recovery of packaging; in the case of textiles, wood pallets and waxed paper, energy recovery is expected instead of the material recovery. In the case of recycling the liquid packaging board materials, the utilization of the packaging is considered for its paper portion while aluminium and segments are assumed to be landfilled [7]. The last scenario then assumes landfilling of all types of packaging.
2.3. Life Cycle Inventory
Data on the primary, secondary and tertiary product packaging was obtained from the literature, communication with experts and manufacturers, and it was also based on our measurements. For each product, a model was created in the GaBi 8 software [17]. Individual products and packaging methods are listed below.
2.3.1. Cow’s Milk
This study assessed 4 types of primary packaging for milk, namely polyethylene terephthalate (PET) bottles with high-density polyethylene (HDPE) caps, non-refundable glass, liquid packaging board and LDPE bags with polypropylene (PP) caps. The first three types are most often used for packing milk in the Czech Republic while HDPE bags are used rarely. The systems assessed differ only in the type of primary and secondary packaging and in the weight of the tertiary packaging, namely wooden pallet and light density polyethylene (LDPE) foil. Table 1 presents the types of packaged milk considered in this study.
2.3.2. Drinking Water
Table 2 lists the types of drinking water packages evaluated in the study. The primary packaging types are PET bottles with HDPE caps, refundable glass bottles and non-refundable glass bottles with metal caps and HDPE bags. The first three types of primary packaging are used for packing drinking water in the Czech Republic, while HDPE bags are not used for this product in this region. Secondary packaging varies in the material used (LDPE, HDPE) and its weight. Tertiary containers (wooden pallet, HDPE foil) also differ in weight.
2.3.3. Pork
This study evaluated four fresh meat packaging systems as presented in Table 3. Primary packaging under consideration involves polystyrene (PS) trays with an LDPE foil, aluminium foil, waxed paper and paper with an HDPE foil. The secondary packaging is made of HDPE in all instances, while the tertiary packaging is made of LDPE. In the Czech Republic, PS trays, waxed paper and paper with an HDPE foil are the materials frequently used for meat packaging. In general, the aluminium foil is not used for packing fresh meat in the Czech Republic, but it has still been included in the study on account of its possible, theoretical use.
2.3.4. Peas
Our study evaluated four packaging systems of peas as presented in the following Table 4. The primary packaging assessed here is a corrugated cardboard box, PP, cotton and paper sacks. The secondary packaging differs in the type of material applied (corrugated cardboard, LDPE) and its weight. Tertiary packaging is assumed to be the same for all packaging methods (wooden pallets, HDPE foil).
2.4. Calculation of PtP Indicator Focused on Carbon Footprint
In order to compare the impacts of individual systems with each other and to interpret the results of their environmental impacts, the calculation of the PtP indicator was designed based on the ratio of the climate change (CC) indicator of the impact category for the assessed packaging (labelled with the CCPa index) and the product (labelled with the index CCPr). For the purpose of this study, the impact category climate change of the Product Environmental Footprint Methodology 3.0 was selected since this methodology is recommended by the European Commission to evaluate the product environmental footprint. [29]. Focus on the CC category was primarily selected because of the long-term increase in greenhouse gas emissions in the atmosphere and the impact this trend has on climate change [30,31].
PtPCC (%) = Σ CCPa/Σ CCPr * 100
PtP values represent the ratio of the environmental impacts of the packaging when compared to the packaged product. The higher the PtP ratio, the more significant the environmental impact of the packaging system. In order to prevent the occurrence of the environmental impacts, it is appropriate to quantify the potentially occurring impacts first and then consider the possibilities of reducing them. On the basis of the PtP indicator, it is also possible to determine the so-called hot-spots or stages in the packaging life cycle responsible for the greatest environmental impacts.
Data Evaluation
To test the variation partitioning of the explanatory factor that was climate change values for its effects on dependent variables, the principal component analysis (PCA) was computed in CANOCO 5 [32]. Cow’s milk, water, pork, peas and all packaging materials were used as the responses to the explanatory variable.
3. Results
Product Environmental Footprint Methodology 3.0, namely its midpoint category of climate change impact, was used to test the validity of the proposed PtP indicator. The results are presented in two sections. Table 5, Table 6, Table 7 and Table 8 illustrate the individual life cycle contributions of primary, secondary and tertiary packaging and those of the product to the climate change impact category. As the research examines the validity of the PtP indicator within the scope of a case study focused on the Czech Republic, the results of the climate change parameter values are first presented for the EoL Czech mix scenario, then energy recovery, material recovery and landfilling scenario expressed in absolute values in kg CO2 eq. units. The validity of the indicator was verified in Figure 2, Figure 3, Figure 4 and Figure 5 together with the identification of the PtP values for individual products and packaging. To assess the environmental impacts of different EoL packaging material scenarios, the specific PtP values are presented for each scenario.
From the results presented, it is clear that with the exception of bottled water, the products themselves have significantly higher environmental impacts than their packaging, since the environmental impacts associated with the production of 1000 kg of the corresponding product were: 1520 kg of CO2 eq. for milk, 853 kg CO2 eq. for peas, 8980 kg CO2 eq. for pork and 0.2 kg CO2 eq. for drinking water. Based on the results shown in Table 5, Table 6, Table 7 and Table 8, it is clear that the primary packaging has the second-highest impact in the entire Package-to-Product system in terms of LCA. Secondary and tertiary packaging then shows lower environmental impacts.
3.1. Cow’s Milk
In the case of cow’s milk in the CZ EoL mix scenario, the LDPE bags packaging system has the lowest environmental impact, namely 22.9 kg CO2 eq., while the highest environmental impact is shown by packing milk in non-refundable glass, 355.0 kg CO2 eq. In the case of secondary and tertiary packaging, the highest environmental impacts are associated with glass packaging. The effects of the secondary packaging of non-refundable bottles show the impact of 47.4 kg CO2 eq. and the tertiary packaging impact was found to be 8.54 kg CO2 eq.
The following figure shows the results of the PtP parameter, which is the ratio of the environmental impact of the sum of primary, secondary and tertiary packaging compared to the product. The results also represent different EoL scenarios. The purpose of this comparison is to identify the optimal packaging management system with respect to the possible reduction of environmental impacts. As shown in Figure 2, the cow’s milk trends in the CZ EoL mix also follow most of the other EoL methods, where the lowest PtP ratio is displayed by the LDPE packaging system, while the highest ratios are shown by the packaging system using non-refundable glass in the three scenarios under review (CZ EoL mix, energy recovery and landfilling). The scenario representing the glass milk packaging system and its subsequent 100% material recovery shows the PtP ratio of 5%. On the basis of the results, it can be concluded that the most appropriate EoL of the packaging materials would be their material utilisation in all systems considered. In this scenario, the lowest PtP ratio ever reached is 1% for the LDPE bag packaging system. On the other hand, the system of milk packaging in non-refundable glass bottles presents the highest PtP value of 31%, where the packaging is used for energy recovery or landfill at the end of its life cycle.
3.2. Water
Compared with all the other products, water is an exception because the product itself has a very low environmental impact of 0.234 kg CO2 eq. Again, similar to other evaluated products, primary packaging still shows the highest impact of all the packaging systems monitored. The lowest environmental impact of 25.1 kg CO2 eq. in the CZ EoL mix scenario is displayed by the system of packing drinking water in an HDPE bag, while the highest impact of 509.2 kg CO2 eq. is shown by water packaged in non-refundable glass. In the case of secondary and tertiary packaging, the highest environmental impacts are again associated with glass packaging. For non-refundable glass, the secondary packaging shows the impact of 47.3 kg CO2 eq. and the tertiary packaging just 2.9 kg CO2 eq., as it can be seen in Table 6.
As can be seen in Figure 3, the PtP values are reported in thousands to hundreds of thousands per cent due to a lower order of magnitude of the environmental impacts associated with drinking water production. Similar to milk, the CZ EoL mix trends are copied in other EoL methods. The lowest ratio of PtP is manifested by the system of packing water into an HDPE bag, in case of its material recovery, it was 8009%. The highest PtP ratio is represented by the system of packaging water into non-refundable glass in case of its energy utilisation, which was 299380%. Based on the results, the most suitable EoL for a glass bottle would be its material recovery where the PtP values do not exceed 45021%.
3.3. Pork
Pork has the environmental impact of 8980 kg CO2 eq., the highest of all the products under review. When comparing individual packaging methods presented in Table 7, the lowest environmental impact in the CZ EOL mix scenario is displayed by waxed paper, 5.6 kg CO2 eq. On the other hand, the system of packaging meat in aluminium packaging shows the highest impact, namely 123.3 kg CO2 eq. In cases of secondary and tertiary packaging, the environmental impacts are the same for all packaging systems, specifically 1.1 kg CO2 eq. and 2.2 kg CO2 eq.
Given the very high environmental impact values of the product compared to all packaging materials, PtP for pork is the lowest, namely up to 2.2%. The lowest PtP in total was demonstrated by 0.03% of wax paper recycling. The highest PtP was then shown by the aluminium packaging reaching 2.2%. Based on the results in Figure 4, it can be concluded that material recycling of all selected types of packaging has the lowest potential environmental impact.
3.4. Peas
Production of peas has a relatively low environmental impact of 853 kg CO2 eq. Based on the results of the comparison of the packaging systems selected as presented in Table 8, it can be concluded that the lowest environmental impacts of pea packaging in the CZ EoL mix scenario are associated with the paper bag packaging system, namely 18.6 kg CO2 eq. The highest impact is shown when packing peas in a cotton bag, namely 843.6 kg CO2 eq., which is almost equal to the environmental impact of the product itself. The PP bag packaging system has a relatively low impact of 60.6 kg CO2 eq. In the case of secondary and tertiary packaging, the highest environmental impacts are associated with corrugated cardboard box packaging. In this case, the secondary packaging shows 40.8 kg CO2 eq. and tertiary packaging 8.4 kg CO2 eq.
The PtPs for each pea packaging system are presented in Figure 5. According to the results, the system of wrapping peas in a cotton bag appears to be the least environmentally friendly option in all of the EoL scenarios. On the other hand, the lowest PtP ratio in all of the EoL scenarios was shown by the paper sack packaging system. Based on the results, it can be stated that from the point of view of the environmental impacts, the most suitable EoL method is the material recovery of the packaging while the least environmentally friendly option is landfilling, here showing the PtP values of 106.7%.
To test the dependence of the climate change (CC) indicator values on the parameters of individual packaging and the products and for further verification of the PtP indicator, we used the PCA method, as can be seen in Figure 6. In this figure, individual products packed in different packaging materials were broken down into clusters that determine their mutual similarity, also considering the dependence on the impacts of the packaging materials and the products. The X-axis in the graph expressing PC1 explains 75.4% variability, while the Y-axis expressing PC2 explains 19.2% of the variability. Distances between different products in different packages are thus represented by more significant attributes in the horizontal direction than in the vertical direction. The values on the left in the upper half of the graph indicate that the predominant effects of the environmental impacts stem from the products alone. The marked cluster then shows which packaging materials in the CZ EoL scenario are the most appropriate with regard to the overall environmental impacts, particularly peas in a paper sack, milk in an LDPE bags and pork in waxed paper. These values complement the statements made in the previous Figure 2, Figure 3, Figure 4 and Figure 5. The values of the variables that are negatively correlated with the products were moved to the right half of the graph. As can be seen from the bottom-right cluster, the two packaging materials (HDPE bag and refundable glass bottle), seem to be optimal for bottled water. For other EoL scenarios, the PCA plots show very similar results differing only in minor particular parts. These graphs (Figures S1–S3) can be found in the Supplementary Materials.
4. Discussion
Many LCA studies have already dealt with the comparison of different packaging alternatives, but often with varying functional units and differing scopes of the studies, as well as the boundaries of the systems assessed and the selected evaluation methodology [9,33,34,35]. For this reason, it is very difficult to compare the results of individual studies. Regarding the system under consideration, studies frequently only deal with the primary type of packaging but less often with the secondary or even tertiary packaging. The complex evaluation of all three packaging types is usually monitored in a minor way. For the reasons mentioned above, the aim of our study was to create an indicator and test its validity on several products in order to comprehensively assess the environmental impacts of primary, secondary and tertiary packaging in relation to the products selected. The carbon footprint was chosen as the impact category used to determine the indicator because the carbon footprint is an impact category that is often monitored in many studies [9,33,36,37,38,39].
The topicality of the theme and the growing interest not only in the academic sphere but also among the wider public, is supported by the fact that a similar indicator assessing the environmental impacts of packaging has already been introduced by the American retail chain Wall-Mart. Scorecards or environmental packaging score can be defined by several indicators, such as the production of greenhouse gas emissions in packaging production, packaging weight to product ratio, transport efficiency and packaging recyclability [40,41]. Concerning this tool, Olsmats and Dominic [40] state that the inaccuracy of the input data may be a drawback as the data is based on the subjective evaluation of respondents. In fact, the inaccuracy of the input data may also be a limiting factor of our study as the data combine multiple sourcesi.e., literature, information from packaging material manufacturers, own measurements and assumptions.
Another objective of the study was to assess packaging management from a life-cycle perspective and to assess what environmental impacts they might bring about under different EoL scenarios. Based on the evaluation of the EoL scenario results for the monitored products and packaging using the PCA method, the data was divided into individual clusters, as can be seen in Figure 6. These clusters defined which product and packaging groups have their environmental impacts primarily determined by the product and which by the packaging. The results also presented a group that included products with the most appropriate packaging in terms of the overall environmental impacts. Specifically, these involved paper-wrapped peas, cow’s milk in LDPE bags, pork in waxed paper, and water in HDPE bags or refundable glass bottles. The results are consistent with the PtP indicator.
As for testing of the indicator itself on four different examples of packaged products, the results are consistent with other studies in many ways. For instance, Fantin et al. [42] reviewed the results of LCA studies on the global warming potential (GWP) category for bottled and tap water, harmonizing and comparing the results of each study. From the results of the harmonized scenario of their research, it can be concluded that an average value for a 1000 litre package packed in a PET bottle, including the EoL impacts of the bottle, is 162 kg CO2 eq. The results of our study indicate similar results for the PET drinking water packaging system in the EoL mix scenario - 106 kg CO2 eq, landfilling - 112 kg CO2 eq, energy recovery - 160 kg CO2 eq and recycling - 62 kg CO2 eq. If we use the values from the above-mentioned study to calculate the PtP for water in the PET bottle [42], the PtP value for bottled water would be 69 302%. The PtP calculated on the basis of the data in our study is lower, namely, in the EoL mix it is 54 205%, landfilling - 57 876%, energy recovery - 79 654% and in the scenario assuming recycling - 31 869%. When assessing the packaging of water in glass containers, refundable glass bottles show a lower environmental impact compared to non-refundable glass bottles, as already found in a study by Tichá [21], for example.
Another study of Meneses et al. [9] assessed the carbon footprint for different types of milk packaging, namely composite packaging, HDPE and PET packaging of different sizes. According to their study [10], the use of composite packaging displays lower environmental impacts than those of HDPE or PET packaging in EoL landfilling and energy recovery scenarios. Only when HDPE or PET is recycled, HDPE and PET packaging is a more environmentally friendly option compared to composite packaging. Our results are consistent with the cited study, where the aseptic packaging milk system generally shows a lesser impact on the GWP impact category compared to the PET bottle primary packaging system, the recycling scenario making an exception here. A non-refundable glass bottle is the least suitable option from the GWP point of view, similar to the study on the packaging of milk and dairy products [23].
The environmental impacts of different meat packaging methods were also addressed by Maga et al. [43]. Their study compared the impacts of plastic trays used for packing meat. The plastic trays compared were made of expanded polystyrene (EPS), PP, PET, and polylactic acid (PLA). According to this study, the extruded polystyrene coating shows the lowest environmental impact. A different study [44] dealing with the environmental impacts of disposable containers (containers) for take-away food presents comparisons of containers made of aluminium foil, PS and EPS. The results of the study [44] show an EPS container as being the most environmentally friendly option, 7–28 times less environmentally damaging than aluminium containers. The study evaluated the meat packaging in aluminium foil, EPS tray, waxed paper and HDPE with paper. According to the study results, wrapping meat into EPS is a more environmentally friendly option compared to the aluminium foil. This is true for all scenarios except for the energy recovery scenario, where the aluminium foil packaging system actually displays a lower impact. However, according to the PtP ratio, packing meat in waxed paper still appears to be the most suitable system.
In the case of packaged peas, the system of wrapping peas in a cotton bag showed the highest PtP values, as the production of cotton fibres causes a significant environmental burden. A study by Hedayati et al. [45] states that the production of 1 tonne of cotton fibres produces 1601 kg CO2 eq. The use of a cotton bag could be an environmentally friendly option if the bag was reused, as shown by the study [46] dealing with shopping bags. The smallest PtP ratio is presented by packing peas in a paper bag. The weight of paper used when packing peas in the paper bag is approximately six times lower than the weight of the paper box. This means that the reduction of the quantity (dematerialization) of the material used can significantly reduce the potential environmental impacts [43].
Study Limitations
The results of the study may be limited by the input data used as it comes from different sources. In the case of missing input data, the pieces of data necessary were obtained from actual measurements or they were estimated. The results of this study should be interpreted in this context. Using more accurate input data or adding missing information would lead to more accurate study results.
To evaluate the PtP indicator, the EF 3.0 methodology and the climate change impact category were selected. However, the environmental impacts of products and packaging vary across different impact categories or evaluation methodologies. For the further development of the indicator, it will be appropriate to focus on other impact categories too.
5. Conclusions
The results of this study show that in order to develop a uniform PtP methodology, it is necessary to create different categories of foods for which the PtP would be more specifically limited. This is due to the fact that different types of food display different environmental impacts. For instance, one tonne of pork has an impact of 8980 kg CO2 eq., while 1 tonne of peas only 853 kg CO2 eq. Since the impacts of packaging materials are of the same order of magnitude, the PtP ratio can vary by tens to hundreds of percent. A way to harmonize these derogations is to create a coefficient for individual categories that will relativize its environmental impacts. Another option is to test the PtP using other impact categories than just the category of climate change. These adjustments and further development of the PtP indicator will be examined within the scope of future research.
Supplementary Materials
The following are available online at https://www.mdpi.com/2071-1050/12/7/3034/s1, Figure S1: Principal component analysis of variations of climate change impact for different types of packaging and products for Energy Recovery Scenario, Figure S2: Principal component analysis of variations of climate change impact for different types of packaging and products for Material Recovery Scenario, Figure S3: Principal component analysis of variations of climate change impact for different types of packaging and products for Landfilling Scenario.
Author Contributions
Investigation and literature research, M.Š.; methodology, V.K.; resources, M.Š. and V.K.; supervision, V.K.; application of LCA model in software, M.Š.; writing—original draft, M.Š.; reviewing and editing, M.Š. and V.K. All authors have read and agreed to the published version of the manuscript.
Funding
Financial support from specific university research (MSMT No 21-SVV/2019), from the grant of Specific university research – grant No A1_FTOP_2020_004 and from institutional support of UCT Prague.
Conflicts of Interest
The authors declare no conflict of interest. The funders had no role in the design of the study; in the collection, analyses, or interpretation of data; in the writing of the manuscript, or in the decision to publish the results.
References
- Packaging Waste Statistics. Available online: https://ec.europa.eu/eurostat/statistics-explained/index.php/Packaging_waste_statistics#Waste_generation_by_packaging_material (accessed on 30 January 2020).
- Pongrácz, E. The Environmental Impacts of Packaging. In Environmentally Conscious Materials and Chemicals Processing; John Wiley & Sons, Inc.: Hoboken, NJ, USA, 2007; pp. 237–278. [Google Scholar]
- Kandziora, J.H.; van Toulon, N.; Sobral, P.; Taylor, H.L.; Ribbink, A.J.; Jambeck, J.R.; Werner, S. The Important Role of Marine Debris Networks to Prevent and Reduce Ocean Plastic Pollution. Mar. Pollut. Bull. 2019, 141, 657–662. [Google Scholar] [CrossRef] [PubMed]
- Mucientes, G.; Queiroz, N. Presence of Plastic Debris and Retained Fishing Hooks in Oceanic Sharks. Mar. Pollut. Bull. 2019, 143, 6–11. [Google Scholar] [CrossRef] [PubMed]
- Laurijssen, J.; Faaij, A.; Worrell, E. Benchmarking Energy Use in the Paper Industry: A Benchmarking Study on Process Unit Level. Energy Effic. 2013, 6, 49–63. [Google Scholar] [CrossRef] [Green Version]
- Tan, R.B.H.; Khoo, H.H. An LCA Study of a Primary Aluminum Supply Chain. J. Clean. Prod. 2005, 13, 607–618. [Google Scholar] [CrossRef]
- Xie, M.; Qiao, Q.; Sun, Q.; Zhang, L. Life Cycle Assessment of Composite Packaging Waste Management—A Chinese Case Study on Aseptic Packaging. Int. J. Life Cycle Assess. 2013, 18, 626–635. [Google Scholar] [CrossRef]
- Webb, H.K.; Arnott, J.; Crawford, R.J.; Ivanova, E.P. Plastic Degradation and Its Environmental Implications with Special Reference to Poly(Ethylene Terephthalate). Polymers (Basel) 2013, 5, 1–18. [Google Scholar] [CrossRef] [Green Version]
- Meneses, M.; Pasqualino, J.; Castells, F. Environmental Assessment of the Milk Life Cycle: The Effect of Packaging Selection and the Variability of Milk Production Data. J. Environ. Manag. 2012, 107, 76–83. [Google Scholar] [CrossRef]
- Silvenius, F.; Katajajuuri, J.; Grönman, K. Role of Packaging in LCA of Food Products. In Towards Life Cycle Sustainability Management; Springer Science: Dordrecht, Holland, 2011; pp. 359–370. [Google Scholar]
- Heller, M.C.; Selke, S.E.M.; Keoleian, G.A. Mapping the Influence of Food Waste in Food Packaging Environmental Performance Assessments. J. Ind. Ecol. 2018, 23, 480–495. [Google Scholar] [CrossRef] [Green Version]
- Leuenberger, M.; Jungbluth, N.; Büsser, S. Environmental Impact of Canteen Meals: Comparison of Vegetarian and Meat Based Recipes. In Proceedings of the International Conference on LCA in the Agri-Food, Bari, Italy, 22–24 September 2010; p. 5. [Google Scholar]
- International Organization for Standartization. ISO 14040: Environmental Management—Life Cycle Assessment—Principles and Guidelines; European Committee for Standardization: Brusel, Belgium, 2006. [Google Scholar]
- International Organization for Standartization. ISO 14044: Environmental Management—Life Cycle Assessment—Requirements and Gudelines; European Committee for Standardization: Brusel, Belgium, 2006. [Google Scholar]
- Curran, M.A. Life Cycle Assessment Handbook; John Wiley & Sons Inc.: Hoboken, NJ, USA, 2012. [Google Scholar]
- Spotřeba Potravin a Nealkoholických Nápojů. Available online: https://www.czso.cz/csu/czso/spotreba-potravin-2017 (accessed on 3 February 2020).
- Sphera. Life Cycle ssessment LCA Software: GaBi Software. 2020. Available online: http://www.gabi-software.com/ (accessed on 30 January 2020).
- Ecoinvent. The ecoinvent Database. 2020. Available online: https://www.ecoinvent.org/ (accessed on 30 January 2020).
- European Commission. PEFCR Guidance Document—Guidance for the Development of Product Environmental Footprint Category Rules (PEFCRs), version 6.3; European Commision: Brussels, Belgium, 2017. [Google Scholar]
- Produkce, Využití a Odstranění Odpadů. 2017. Available online: https://www.czso.cz/csu/czso/produkce-vyuziti-a-odstraneni-odpadu-2017 (accessed on 3 February 2020).
- Tichá, M. Porovnání environmentálních dopadů nápojových obalů v ČR metodou LCA; Report of Ministry of Environment of the Czech Republic: Prague, Czech Republic, 2009; p. 74. [Google Scholar]
- Waste & Resources Action Programme. Secondary Packaging Benchmarking across the Grocery Sector; Report of Waste & Resources Action Programme: Oxford, UK, 2014; p. 57. [Google Scholar]
- Ghenai, C. Life Cycle Assessment of Packaging Materials for Milk and Dairy Products. Int. J. Therm. Environ. Eng. 2012, 4, 117–128. [Google Scholar]
- Jelse, K.; Elin, E.; Elin, E. Life Cycle Assessment of Consumer Packaging for Liquid Food—LCA of Tetra Pak and Alternative Packaging on the Nordic Market; Report of Swedish Environmetal Research Institute: Stockholm, Sweden, 2009; p. 160. [Google Scholar]
- Meyhoff, F.J.; Hartlin, B.; Wallén, E.; Aumônier, S. Life Cycle Assessment of Example Packaging Systems for Milk; Report of Waste & Resources Action Programme: Banbury, UK, 2010; p. 125. [Google Scholar]
- Přibylová, M. Skleněné a PET Lahve Na Minerální Vody: Posuzování Životního Cyklu; Report of Hnutí Duha: Olomouc, Czech Republic, 2000; p. 65. [Google Scholar]
- Ingrao, C.; Lo Giudice, A.; Bacenetti, J.; Mousavi Khaneghah, A.; de Sant’Ana, A.S.; Rana, R.; Siracusa, V. Foamy Polystyrene Trays for Fresh-Meat Packaging: Life-Cycle Inventory Data Collection and Environmental Impact Assessment. Food Res. Int. 2015, 76, 418–426. [Google Scholar] [CrossRef]
- Albrecht, S.; Brandstetter, P.; Beck, T.; Fullana-I-Palmer, P.; Grönman, K.; Baitz, M.; Deimling, S.; Sandilands, J.; Fischer, M. An Extended Life Cycle Analysis of Packaging Systems for Fruit and Vegetable Transport in Europe. Int. J. Life Cycle Assess. 2013, 18, 1549–1567. [Google Scholar] [CrossRef]
- Fazio, S.; Biganzioli, F.; De Laurentiis, V.; Zampori, L.; Sala, S.; Diaconu, E. Supporting Information to the Characterisation Factors of Recommended EF Life Cycle Impact Assessment Methods; Report of European Commission: Ispra, Italy, 2018; p. 49. [Google Scholar]
- Christensen, J.; Olhoff, A. Lessons from a Decade of Emissions Gap Assessments; Report of United Nations Environmental Programme: Nairobi, Kenya, 2019; p. 18. [Google Scholar]
- Emissions Gap Report 2019; Report of United Nation Environment Programme: Nairobi, Kenya, 2019; p. 108.
- Lepš, J.; Šmilauer, P. Multivariate Analysis of Ecological Data Using CANOCO; Cambridge University Press: New York, NY, USA, 2003. [Google Scholar]
- Santos, H.C.M.; Maranduba, H.L.; de Almeida Neto, J.A.; Rodrigues, L.B. Life Cycle Assessment of Cheese Production Process in a Small-Sized Dairy Industry in Brazil. Environ. Sci. Pollut. Res. 2017, 24, 3470–3482. [Google Scholar] [CrossRef]
- Molina-Besch, K.; Wikström, F.; Williams, H. The Environmental Impact of Packaging in Food Supply Chains—Does Life Cycle Assessment of Food Provide the Full Picture? Int. J. Life Cycle Assess. 2018, 24, 37–50. [Google Scholar] [CrossRef] [Green Version]
- Roy, P.; Nei, D.; Orikasa, T.; Xu, Q.; Okadome, H.; Nakamura, N.; Shiina, T. A Review of Life Cycle Assessment (LCA) on Some Food Products. J. Food Eng. 2009, 90, 1–10. [Google Scholar] [CrossRef]
- He, B.; Liu, Y.; Zeng, L.; Wang, S.; Zhang, D.; Yu, Q. Product Carbon Footprint across Sustainable Supply Chain. J. Clean. Prod. 2019, 241, 118320. [Google Scholar] [CrossRef]
- Lo-Iacono-Ferreira, V.G.; Viñoles-Cebolla, R.; Bastante-Ceca, M.J.; Capuz-Rizo, S.F. Transport of Spanish Fruit and Vegetables in Cardboard Boxes: A Carbon Footprint Analysis. J. Clean. Prod. 2019, 244, 118784. [Google Scholar] [CrossRef]
- Vasilaki, V.; Katsou, E.; Ponsá, S.; Colón, J. Water and Carbon Footprint of Selected Dairy Products: A Case Study in Catalonia. J. Clean. Prod. 2016, 139, 504–516. [Google Scholar] [CrossRef]
- Cimini, A.; Moresi, M. Mitigation Measures to Minimize the Cradle-to-Grave Beer Carbon Footprint as Related to the Brewery Size and Primary Packaging Materials. J. Food Eng. 2018, 236, 1–8. [Google Scholar] [CrossRef]
- Olsmats, C.; Dominic, C. Packaging Scorecard—A Packaging Performance Evaluation Method. Packag. Technol. Sci. 2003, 16, 9–14. [Google Scholar] [CrossRef]
- Walmart Scorecard. Available online: https://www.greenerpackage.com/walmart_scorecard (accessed on 28 November 2019).
- Fantin, V.; Scalbi, S.; Ottaviano, G.; Masoni, P. A Method for Improving Reliability and Relevance of LCA Reviews: The Case of Life-Cycle Greenhouse Gas Emissions of Tap and Bottled Water. Sci. Total Environ. 2014, 476–477, 228–241. [Google Scholar] [CrossRef]
- Maga, D.; Hiebel, M.; Aryan, V. A Comparative Life Cycle Assessment of Meat Trays Made of Various Packaging Materials. Sustainability 2019, 11, 5324. [Google Scholar] [CrossRef] [Green Version]
- Gallego-Schmid, A.; Mendoza, J.M.F.; Azapagic, A. Environmental Impacts of Takeaway Food Containers. J. Clean. Prod. 2019, 211, 417–427. [Google Scholar] [CrossRef]
- Hedayati, M.; Brock, P.M.; Nachimuthu, G.; Schwenke, G. Farm-Level Strategies to Reduce the Life Cycle Greenhouse Gas Emissions of Cotton Production: An Australian Perspective. J. Clean. Prod. 2019, 212, 974–985. [Google Scholar] [CrossRef]
- Kočí, V. Porovnání Environmentálních Dopadů Odnosných Tašek z Různých Materiálů Metodou Posuzování Životního Cyklu—LCA; Report of University of Chemistry and Technology in Prague: Prague, Czech Republic, 2018; p. 102. [Google Scholar]
Figure 1.
System boundaries of investigated Package-to-Product system.

Figure 2.
Results of PtP ratio for cow’s milk and its individual packaging systems considering primary, secondary and tertiary packaging. The results also represent the PtP values for various scenarios for the handling of packaging material at the end-of-itslife cycle, namely the expected EoL mix in the Czech Republic, material recovery, energy recovery and landfilling. The results are presented as a percentage of PtP.

Figure 3.
Results of PtP ratio for water and its individual packaging systems considering primary, secondary and tertiary packaging. The results also represent the PtP values for various scenarios for the handling of packaging material at the end-of-its-life cycle, namely the expected EoL mix in the Czech Republic, material recovery, energy recovery and landfilling. The results are presented as a percentage of PtP.

Figure 4.
Results of PtP ratio for pork and its individual packaging systems considering primary, secondary and tertiary packaging. The results also represent the PtP values for various scenarios for the handling of packaging material at the end-of-its-life cycle, namely the expected EoL mix in the Czech Republic, material recovery, energy recovery and landfilling. The results are presented as a percentage of PtP.

Figure 5.
Results of PtP ratio for peas and its individual packaging systems considering primary, secondary and tertiary packaging. The results also represent the PtP values for various scenarios for the handling of packaging material at the end-of-its-life cycle, namely the expected EoL mix in the Czech Republic, material recovery, energy recovery and landfilling. The results are presented as a percentage of PtP.
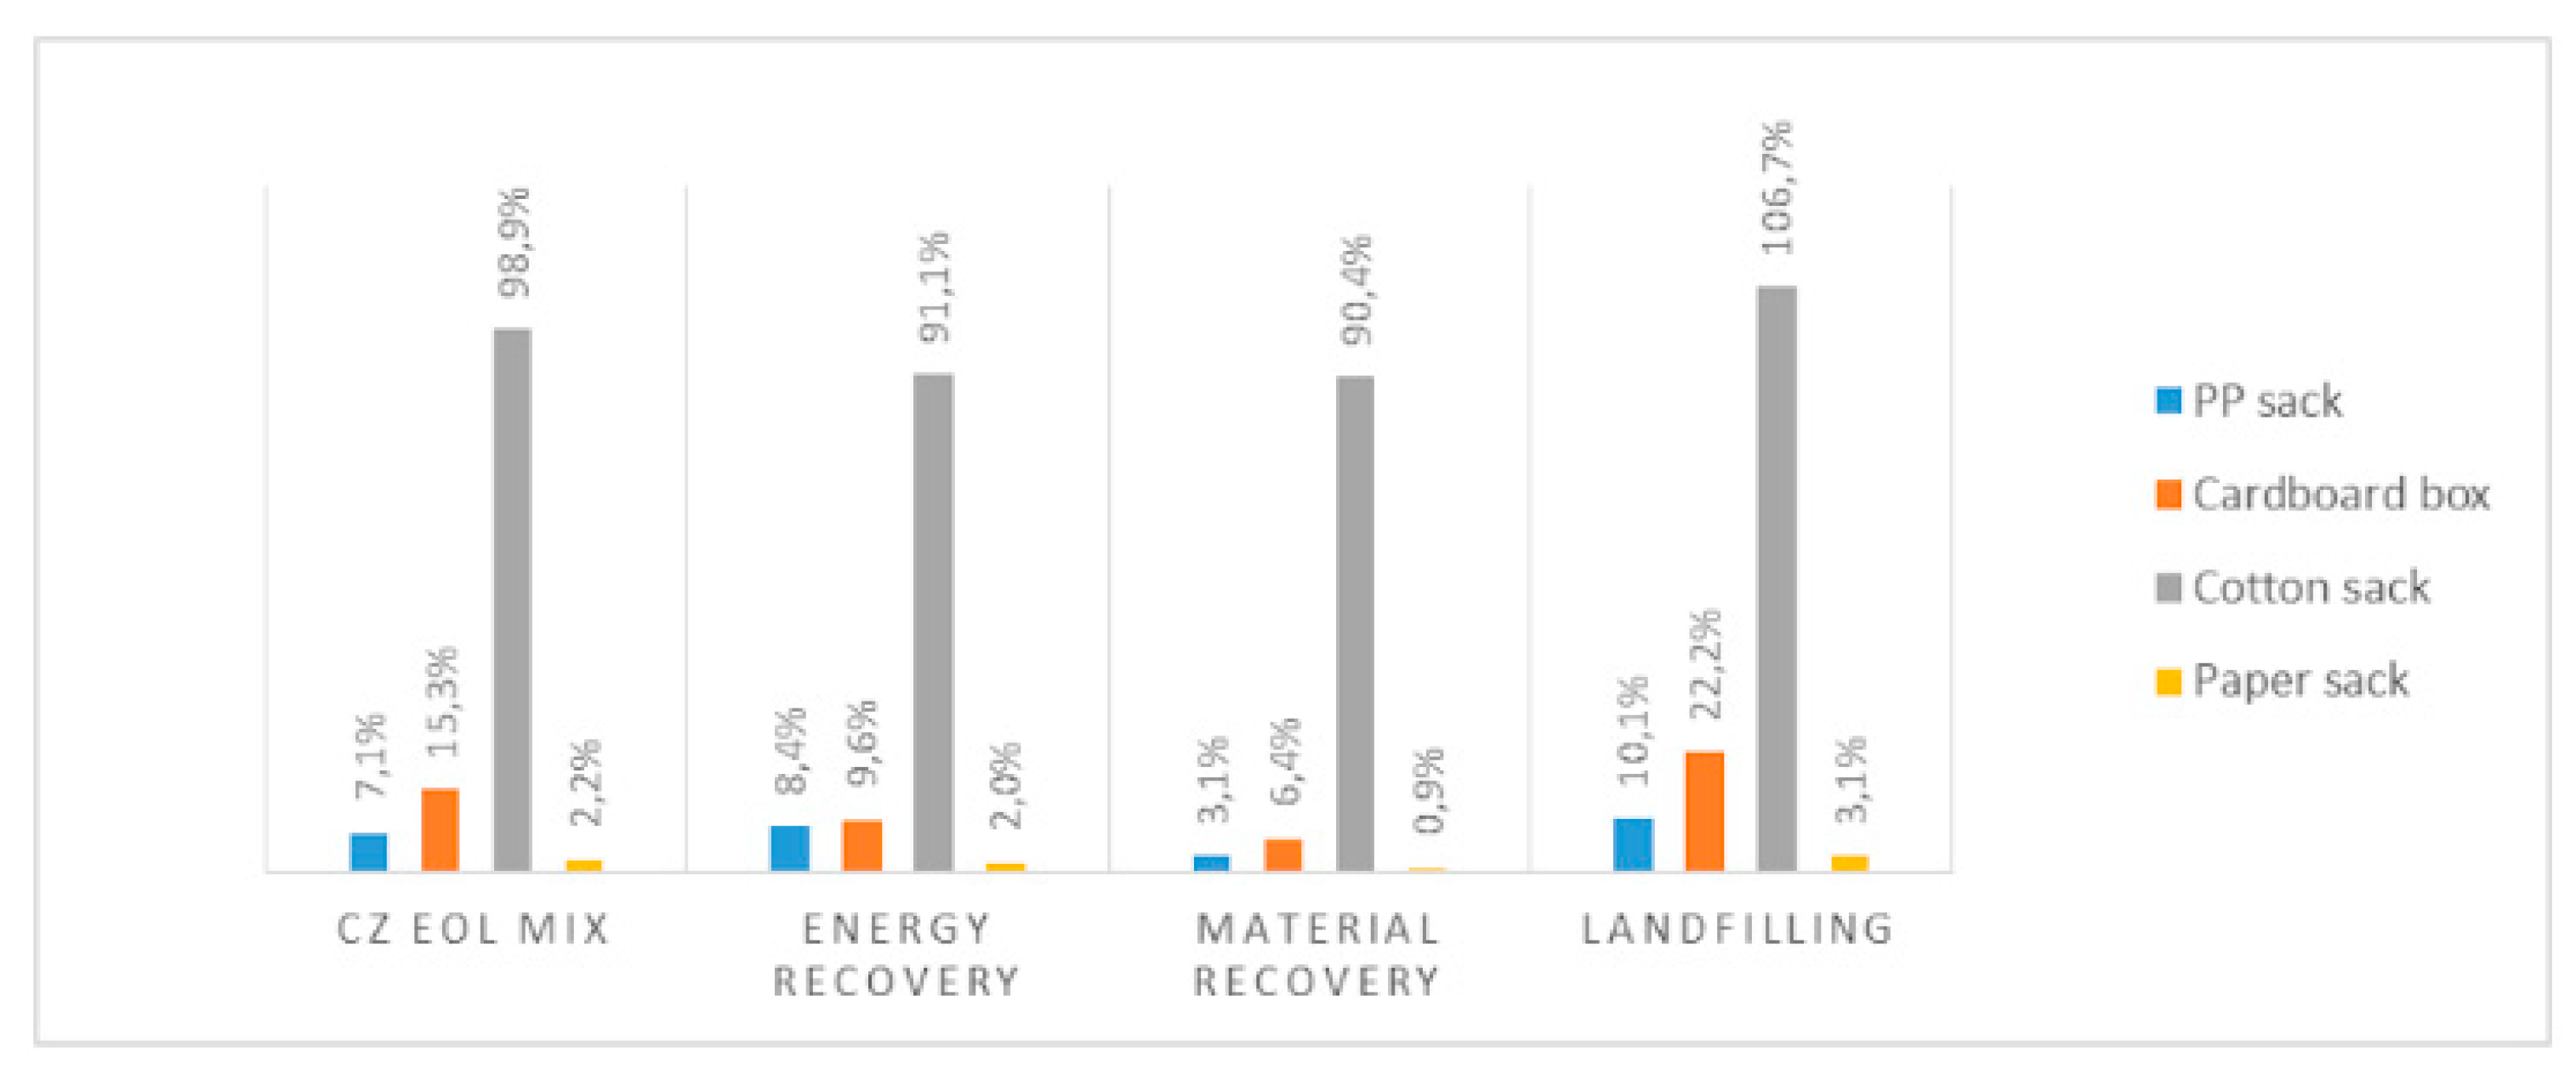
Figure 6.
Principal component analysis of variations of climate change impact for different types of packaging and products for the CZ EoL scenario.
Figure 6.
Principal component analysis of variations of climate change impact for different types of packaging and products for the CZ EoL scenario.


Table 1.
Investigated cow’s milk packaging - average weight per kg of product.
| Primary Packaging Material | Primary Pack. weight per 1 kg of Product [g] | Secondary Packaging Material | Secondary Pack. Weight per 1 kg of Product [g] | Tertiary Packaging Material | Tertiary Pack. Weight per 1 kg of Product [g] | Source of Data |
|---|---|---|---|---|---|---|
| PET bottle, HDPE cap | 35.7 3.0 | HDPE foil Corrugated cardboard box | 2.9 4.4 | Wooden pallet HDPE foil | 29.6 0.1 | [21,22], Producer of pack. mat. |
| Non-refundable glass bottle metal cap | 410.0 2.0 | HDPE foil Corrugated cardboard box | 4.00 × 10⁻² 29.0 | Wooden pallet HDPE foil | 29.6 0.1 | [22,23], Producer of pack. mat. |
| Liquid packaging board HDPE cap | 30.7 1.7 | LDPE foil Corrugated cardboard box | 0.5 13.9 | Wooden pallet HDPE foil | 25.0 0.1 | [21,22,24], Producer of pack. mat. |
| LDPE bag PP cap | 3.8 5.8 | LDPE foil Corrugated cardboard box | 0.03 7.00 × 10⁻² | Wooden pallet HDPE foil | 25.0 0.1 | [25], Producer of pack. mat. |
Table 2.
Investigated water packaging - average packaging weight per kg of product.
| Primary Packaging Material | Primary Pack. Weight per 1 kg of Product [g] | Secondary Packaging Material | Secondary Pack. Weight per 1 kg of Product [g] | Tertiary Packaging Material | Tertiary Pack. Weight per 1 kg of Product [g] | Source of Data Material |
|---|---|---|---|---|---|---|
| PET bottle HDPE cap | 21.3 1.3 | LDPE foil | 2.0 | Wooden pallet HDPE foil | 29.6 0.1 | [21], Own measurement, Producer of pack. mat. |
| Refundable glass bottle Metal cap | 629.0 4.3 | HDPE crate | 4.8 | Wooden pallet LDPE foil | 4.8 0.1 | [21,26], Producer of pack. mat. |
| Non-refundable glass bottle metal cap | 629.0 4.3 | Cardboard box, LDPE foil | 29; 0.04 | Wooden pallet LDPE foil | 4.8 0.1 | [21], Producer of pack. mat. |
| HDPE sack | 6.0 | LDPE sack | 2.0 | Wooden pallet HDPE foil | 2.5 2.50 × 10⁻² | Own assumption, Producer of pack. mat. |
Table 3.
Investigated pork meat packaging - average packaging weight per kg of product.
| Primary Packaging Material | Primary Pack. Weight per 1 kg of Product [g] | Secondary Packaging Material | Secondary Pack. Weight per 1 kg of Product [g] | Tertiary Packaging Material | Tertiary Pack. Weight per 1 kg of Product [g] | Source of Data Material |
|---|---|---|---|---|---|---|
| PS Tray LDPE foil | 17.8 0.2 | HDPE | 0.4 | LDPE tray | 34.0 | [27,28], Own measurement |
| Aluminium foil | 20.0 | HDPE | 0.4 | LDPE tray | 34.0 | [27], Own measurement |
| Waxed paper | 2.0 | HDPE | 0.4 | LDPE tray | 34.0 | [27], Own measurement |
| Paper HDPE foil | 33.0 9.0 | HDPE | 0.4 | LDPE tray | 34.0 | [27], Own measurement |
Table 4.
Investigated peas packaging - average packaging weight per kg of product.
| Primary Packaging Material | Primary Pack. Weight per 1 kg of Product [g] | Secondary Packaging Material | Secondary Pack. Weight per 1 kg of Product [g] | Tertiary Packaging Material | Tertiary Pack. Weight per 1 kg of Product [g] | Source of Data Material |
|---|---|---|---|---|---|---|
| Corrugated cardboard box | 50.0 | Corrugated cardboard box | 25.0 | Wooden pallet HDPE foil | 29.6 0.1 | Producer of pack. mat. |
| PP sack | 12.0 | Corrugated cardboard box | 27.3 | Wooden pallet HDPE foil | 24.2 0.1 | Producer of pack. mat. |
| Cotton sack | 80.0 | Corrugated cardboard box | 27.3 | Wooden pallet HDPE foil | 24.2 0.1 | Own assumption, Producer of pack. mat. |
| Paper sack | 8.0 | LDPE | 2.0 | Wooden pallet HDPE foil | 25.0 0.1 | Producer of pack. mat. |
Table 5.
Presentation of environmental impacts on the climate change category associated with life cycles of primary, secondary, and tertiary packaging for individual milk packaging systems and four end-of-life packaging management scenarios. The functional unit was defined as “1000 kg of product packed in primary, secondary and tertiary packaging” The results are expressed in kg CO2 eq.
| Packaging System | CZ EoL Mix [kg CO2 eq.] | Energy Recovery [kg CO2 eq.] | Material Recovery [kg CO2 eq.] | Landfilling [kg CO2 eq.] | ||||||||
|---|---|---|---|---|---|---|---|---|---|---|---|---|
| Prim | Sec | Ter | Prim | Sec | Ter | Prim | Sec | Ter | Prim | Sec | Ter | |
| Liquid packaging board | 71.1 | 22.4 | 7.2 | 78.9 | 16.2 | 6.5 | 52.0 | 3.7 | 5.7 | 99.6 | 34.6 | 8.3 |
| PET bottle | 156.6 | 16.4 | 8.5 | 271.0 | 18.9 | 7.7 | 27.7 | 10.5 | 6.7 | 189.0 | 18.8 | 9.8 |
| LDPE bag | 15.2 | 0.5 | 7.2 | 26.5 | 0.9 | 6.3 | 8.8 | 0.3 | 5.7 | 14.8 | 0.6 | 8.3 |
| Non-refundable glass | 299.0 | 47.4 | 8.5 | 43.0 | 28.0 | 7.7 | 54.5 | 18.8 | 6.7 | 386.0 | 69.4 | 9.8 |
Table 6.
Presentation of environmental impacts on the climate change category associated with life cycles of primary, secondary, tertiary packaging for individual water packaging systems and four end-of-life packaging management scenarios. The functional unit was defined as “1000 kg of product packed in primary, secondary and tertiary packaging” The results are expressed in kg CO2 eq.
| Packaging System | CZ EoL Mix [kg CO2 eq.] | Energy Recovery [kg CO2 eq.] | Material Recovery [kg CO2 eq.] | Landfilling [kg CO2 eq.] | |||||||||
|---|---|---|---|---|---|---|---|---|---|---|---|---|---|
| Prim | Sec | Ter | Prim | Sec | Ter | Prim | Sec | Ter | Prim | Sec | Ter | ||
| PET bottle | 106.0 | 12.3 | 8.5 | 160.0 | 18.7 | 7.7 | 61.9 | 5.9 | 6.7 | 112.0 | 13.6 | 9.8 | |
| HDPE sack | 16.0 | 3.4 | 5.7 | 28.1 | 9.9 | 6.5 | 9.7 | 3.4 | 5.7 | 15.3 | 5.7 | 8.3 | |
| Non-refundable glass | 459.0 | 47.3 | 2.9 | 669.0 | 28.7 | 2.9 | 84.5 | 18.6 | 2.3 | 593.0 | 69.3 | 3.3 | |
| Refundable glass | 49.1 | 0.4 | 2.9 | 54.0 | 0.7 | 2.9 | 34.5 | 0.2 | 2.3 | 51.5 | 0.4 | 3.3 | |
Table 7.
Presentation of environmental impacts on the climate change category associated with life cycles of primary, secondary, tertiary packaging for individual pork packaging systems and four end-of-life packaging management scenarios. The functional unit was defined as “1000 kg of product packed in primary, secondary and tertiary packaging” The results are expressed in kg CO2 eq.
| Packaging System | CZ EoL Mix [kg CO2 eq.] | Energy Recovery [kg CO2 eq.] | Material Recovery [kg CO2 eq.] | Landfilling [kg CO2 eq.] | ||||||||
|---|---|---|---|---|---|---|---|---|---|---|---|---|
| Prim | Sec | Ter | Prim | Sec | Ter | Prim | Sec | Ter | Prim | Sec | Ter | |
| PS tray | 63.1 | 1.1 | 2.2 | 111.0 | 1.9 | 3.6 | 16.8 | 0.7 | 1.4 | 72.2 | 1.1 | 2.2 |
| Aluminium foil | 120.0 | 1.1 | 2.2 | 42.4 | 1.9 | 3.6 | 38.3 | 0.7 | 1.4 | 191.0 | 1.1 | 2.2 |
| Waxed paper | 2.2 | 1.1 | 2.2 | 0.8 | 1.9 | 3.6 | 0.8 | 0.7 | 1.4 | 3.6 | 1.1 | 2.2 |
| Paper/Plastic sack | 34.0 | 1.1 | 2.2 | 12.0 | 1.9 | 3.6 | 4.0 | 0.7 | 1.4 | 57.9 | 1.1 | 2.2 |
Table 8.
Presentation of environmental impacts on the climate change category associated with life cycles of primary, secondary, tertiary packaging for individual peas packaging systems and four end-of-life packaging management scenarios. The functional unit was defined as “1000 kg of product packed in primary, secondary and tertiary packaging” The results are expressed in kg CO2 eq.
| Packaging System | CZ EoL Mix [kg CO2 eq.] | Energy Recovery [kg CO2 eq.] | Material Recovery [kg CO2 eq.] | Landfilling [kg CO2 eq.] | ||||||||
|---|---|---|---|---|---|---|---|---|---|---|---|---|
| Prim | Sec | Ter | Prim | Sec | Ter | Prim | Sec | Ter | Prim | Sec | Ter | |
| PP sack | 29.8 | 24.1 | 6.7 | 57.3 | 8.2 | 6.0 | 18.6 | 2.6 | 5.4 | 31.7 | 46.4 | 7.9 |
| Cardboard box | 81.5 | 40.8 | 8.4 | 49.5 | 24.7 | 7.3 | 32.1 | 16.0 | 6.6 | 120.0 | 59.8 | 9.6 |
| Cotton sack | 810.0 | 26.8 | 6.8 | 763.0 | 8.2 | 6.0 | 763.0 | 2.6 | 5.4 | 856.0 | 46.4 | 7.9 |
| Paper sack | 7.9 | 3.7 | 7.0 | 2.4 | 8.5 | 6.5 | 0.8 | 1.5 | 5.7 | 13.6 | 4.2 | 8.3 |
© 2020 by the authors. Licensee MDPI, Basel, Switzerland. This article is an open access article distributed under the terms and conditions of the Creative Commons Attribution (CC BY) license (http://creativecommons.org/licenses/by/4.0/).
Share and Cite
MDPI and ACS Style
Šerešová, M.; Kočí, V. Proposal of Package-to-Product Indicator for Carbon Footprint Assessment with Focus on the Czech Republic. Sustainability 2020, 12, 3034. https://doi.org/10.3390/su12073034
AMA Style
Šerešová M, Kočí V. Proposal of Package-to-Product Indicator for Carbon Footprint Assessment with Focus on the Czech Republic. Sustainability. 2020; 12(7):3034. https://doi.org/10.3390/su12073034
Chicago/Turabian StyleŠerešová, Markéta, and Vladimír Kočí. 2020. "Proposal of Package-to-Product Indicator for Carbon Footprint Assessment with Focus on the Czech Republic" Sustainability 12, no. 7: 3034. https://doi.org/10.3390/su12073034
Note that from the first issue of 2016, this journal uses article numbers instead of page numbers. See further details here.