Research on the Barrier Analysis and Strength Measurement of a Prefabricated Building Design
by
Zhenmin Yuan
1,2, 
Guodong Ni
1,2, 
Linxiu Wang
1,2, 
Yaning Qiao
1,2,
Chengshuang Sun
3,
Na Xu
1,2,4 and 
Wenshun Wang
1,2,* 1
School of Mechanics and Civil Engineering, China University of Mining and Technology, Xuzhou 221116, China
2
Research Center for Digitalized Construction and Knowledge Engineering, China University of Mining and Technology, Xuzhou 221116, China
3
School of Economics and Management Engineering, Beijing University of Civil Engineering and Architecture, Beijing 102616, China
4
Jiangsu Collaborative Innovation Center for Building Energy Saving and Construction Technology, Xuzhou 221116, China
*
Author to whom correspondence should be addressed.
Sustainability 2020, 12(7), 2994; https://doi.org/10.3390/su12072994
Submission received: 1 March 2020
/
Revised: 4 April 2020
/
Accepted: 7 April 2020
/
Published: 8 April 2020
(This article belongs to the Special Issue The Future of Facilities Management and Sustainable Development)
Abstract
:As a sustainable and cleaner type of facility, prefabricated buildings face more design barriers than traditional non-prefabricated buildings. Identifying and managing these barriers is key to improving the success rate of prefabricated building design. However, direct studies on these design barriers are extremely rare. The present study solved this problem by combining multiple methods, including grounded theory (GT), structured self-intersection matrix (SSIM), analytic network process (ANP), and the linear weighted sum method (LWSM). GT was adopted to identify the barriers to prefabricated building design and then SSIM was used to analyze the interactions among them. The eight design barriers were finally identified and classified into three clusters: technical barriers, economic barriers, and management barriers. A further analysis found that there is dependence and feedback among these clusters. The technical barrier cluster and management barrier cluster experience self-feedback. A network model based on ANP was next established to calculate the weights of the barrier elements and then this model was combined with LWSM to evaluate the overall design barrier strength of a project case. The results showed that architectural individualization has the greatest impact on prefabricated building design, followed by the collaborative issues among multiple units and professional designer issues. The overall design barrier strength of the project case was larger. Therefore, the first suggestion provided to the facility management sector is to establish a library for standard house types to achieve architectural design through multihouse combinations.
1. Introduction
Since prefabricated buildings have contributed greatly to the global fight against the new coronavirus “COVID-19”, they have again attracted global attention. Prefabricating buildings has long been considered a sustainable practice in the architecture, engineering, and construction (AEC) industries [1], and involves moving a partially finished building from a construction site into a controlled component factory [2]. Other terms related to prefabricated buildings include prefabrication [3], industrialized buildings [4], precast buildings [5], prefabrication techniques [6], prefabricated construction [7], and off-site construction [8]. Whether emergency-driven or market-driven, prefabricated buildings are becoming increasingly popular. However, several barriers affecting the development of prefabricated buildings are often mentioned, including a higher total cost [9], impaired aesthetics [10], additional risks [11], a lack of professional expertise [12], and the absence of management experience [13]. Nevertheless, prefabricated buildings are still favored by the government of China due to their many advantages, including their faster construction speed [14], less required on-site labor [15], higher construction quality [16], sustainable development [17], and superior occupational health and safety [18]. With the development of prefabricated buildings, some new issues are beginning to emerge and become increasingly prominent, especially the design changes of prefabricated buildings. Bogenstatter noted that the design stage determines up to 80% of operational costs, as well as the environment impacts [19,20]. Hence, design changes can waste a great deal of time and money and even affect the quality of buildings. Overcoming this issue remains a troubling prospect for industry insiders and researchers.
Design changes are common not just for ordinary buildings but also for prefabricated buildings. However, the design of a prefabricated building involves more units and professions than that of a standard building. The design unit needs more assistance from the manufacturing unit and the construction unit when it carries out the design of a prefabricated building. Design for manufacture and assembly (DFMA) is a tool for improving prefabricated design [21,22,23]. DFMA is a lean principle and advocates that the design of a unit should consider the requirements of other units during the prefabricated building design. The technological and economic feasibility of product manufacturing and assembly are the aim of DFMA [24]. In real life, it is difficult for these multiple units to be gathered to discuss the related design work due to geographical constraints. Hence, identifying the basic design barriers in advance is essential to enhance the success rate of prefabricated building design. We found via a literature review that specialized research on prefabricated building design barriers is relatively lacking. The required data can only be mined from partially relevant literature. Montali et al. [25] presented a series of challenges in facade design: the intrinsic interdependence of the design process, manufacturability information challenges, and a lack of multiobjective optimization and predictive design. Zhang et al. [26] summarized some hindrances to prefabrication design, including a long design time, a lack of design change flexibility, few available codes and standards, a lack of experienced designers, and the absence of management experience. Wu et al. [27] listed the design-related risks in prefabricated buildings: an insufficient consideration of supply chain conditions, the insufficient experience of architects and engineers, poor interdisciplinary design coordination, and a lack of standards and codes. According to Arditi et al. [28] and Polat [29], a lack of expertise in precast concrete systems may lead to poor design. Rahman [30] listed some design-related obstacles when studying the barriers of Modern Methods of Construction (MMCs), including a lack of experience and skills, fewer available codes, inflexible late design changes, and inadequate coordination.
Compared to other countries, China’s building market is extremely large and active. According to the data from the Ministry of Housing and Urban–Rural Development of the People’s Republic of China (MOHURD), the proportion of the newly built prefabricated building area to the newly built building area will be no less than 20% by 2020. Moreover, prefabricated multifamily buildings are mainstream in China. Hence, this paper focused on the prefabricated building market in China to develop a barrier analysis and study the strength measurements for prefabricated building design. Firstly, this paper selected and partially improvec the required theoretical methods. Secondly, these theoretical methods were used to identify and analyze the design barriers. Thirdly, a new network model based on the previous methods was established to calculate the weights of the identified barriers. Fourthly, a new mathematical model is proposed to measure the overall design barrier strength of a project. Finally, the detailed results, discussions, conclusions, and future work are presented. This research is intended to provide some new ideas and references for architectural design units not only in China, but also for other countries with similar situations.
2. Research Methodology
The research methodology was determined by the characteristics of the questions being studied. The study on design barriers for prefabricated buildings has the following characteristics: (1) few directly or indirectly related studies, (2) more professional factors, (3) closer to project practice, and (4) dependence between the design barriers. Considering these characteristics, the required methods included grounded theory (GT), a structured self-intersection matrix (SSIM), the analytic network process (ANP), and the linear weighted sum method (LWSM). GT was selected to identify and cluster the barriers towards prefabricated building design. SSIM was adopted to determine the interactions among these barriers. ANP was used to calculate the weight of each barrier. LWSM was used to calculate the overall design barrier strength of a prefabricated building project. There is a logical relationship between these methods.
2.1. GT-SSIM Method
Grounded theory (GT) is a qualitative research method proposed by Strauss and Glaser in 1967 [31], which is suitable for studies with little related research. Given the paucity of directly related studies on the present topic, GT was selected to identify the barriers for prefabricated building design. GT establishes a theory on the basis of empirical data and does not require theoretical assumptions at the beginning of the research [32]. The basic process of GT includes discovering the problem, collecting data, analyzing the data to establish a preliminary theory, verifying the theoretical saturation, and forming a final theory [33]. Figure 1 shows the detailed mechanism of the GT-SSIM method. This figure includes two subsystems: a processing subsystem and a technology subsystem. The technology subsystem expresses the relationship among the technologies adopted in the process subsystem.
As shown in Figure 1, GT allows for diverse data collection. This makes it very suitable for newer research. Open coding, axial coding, and selective coding are the core of GT [34]. Open coding conceptualizes and categorizes the collected data to obtain all subcategories. Axial coding summarizes several categories from among all subcategories and clarifies the relationships between each category. Selective coding further summarizes a central category from the above categories and then integrates those categories via diagrams or storytelling memos. Finally, a theoretical saturation test is carried out. If it passes the test, the theory is feasible. Otherwise, the above steps are repeated. The paradigm model for axial coding of GT only requires authors to determine the relationships between concepts and categories. This approach, however, is subjective. In order to add the objectivity of relationship judgments, domain experts are more suitable than the authors themselves. The time taken for expert judgment should not be short or too long in order to acquire more real and accurate data from the domain experts. The judgment process should avoid repetitive work as soon as possible to ensure the ongoing energy and patience of the experts. A structured self-intersection matrix (SSIM) meets all these requirements. Hence, SSIM was adopted to replace the subsequent steps of GT. In SSIM, four symbols are used to denote different relationships between two barriers [35,36]: V means that a certain barrier I will influence another barrier j but that j will not influence i; A means that barrier j will influence barrier i but that i will not influence barrier j; X means that barriers i and j will influence each other; and O means that barriers i and j are unrelated.
2.2. ANP-LWSM Method
The analytic network process (ANP) method proposed by Saaty entails a coupling of the control hierarchy and network hierarchy [37,38]. The control hierarchy includes objective criteria or subcriteria [39]. These criteria (or subcriteria) are independent of each other, and their weights can be calculated via the analytic hierarchy process (AHP). The network hierarchy consists of elements and clusters. There may be some dependence or feedback among these elements (or clusters). Hence, AHP is no longer suitable for calculating their weights. The power of ANP lies in its use of ratio scales to capture various interactions and make accurate decisions [40]. We assumed that the network hierarchy had m clusters (namely C1, C2,…,Cm). The unweighted super matrix W, weighted super matrix , and limited super matrix are calculated by equations (1), (2), and (3), respectively [41]. Wij indicates the effect of the elements in Ci on the elements in Cj, while aij indicates the weight of Ci compared to Cj.
After identifying and ranking the design barriers, the overall design barrier strength of a prefabricated building project was measured. Since the linear weighted sum method (LWSM) is an objective optimization method suitable for scheme evaluation [42], the measurement model was established based on LWSM. For the overall design barrier strength f, see equation (4), where xi is the score of barrier i, and wi is the weight of barrier i.
3. Barrier Identification and Relationship Judgement
3.1. GT-Based Barrier Identification
The design barriers for prefabricated buildings will be endless if they are subdivided. In addition, the relative independence among these barriers cannot be ensured. Given the feasibility of this study, these barriers should be collected as much as possible and then systematically clustered. GT is suitable for achieving this task.
The design of prefabricated buildings involves multiple units, including the owner, the design unit, the construction unit, and the manufacturing unit. Moreover, there are fewer relevant data and qualified respondents for such buildings compared to non-prefabricated buildings. Hence, it is unfeasible to collect the required data by sending out a large number of questionnaires. In order to obtain the required data, more attention should be paid to the diversity of data sources. Several approaches, including a literature review, a semistructured in-depth interview, an expert consultation, and project investigation, were adopted to collect and perfect the required data. During the literature review, a large amount of research literature was browsed by fuzzy retrieval. The search terms included barrier, barrier-like words, design, design-like words, prefabricated buildings, and many others. However, after careful reading, only five journal articles [25,26,27,28,29,30] and two online articles were ultimately selected for their valuable content. By reviewing the previous files on three prefabricated building projects, some practical relevant content was found and recorded. During the semi-structured in-depth interview and expert consultation, many experts were invited. Four of these experts agreed to accept face-to-face interviews, while the other two only provided online consultations due to their geographical distance. All related content was then combined. Since this content was in both Chinese and English, the number of words was not easy to count. Moreover, the amount of the content was too large to be displayed one by one. Hence, Table 1 only shows the portions of the open coding. According to the standardized process of “data, labeling, conceptualization, and categorization” in open coding, eight subcategories were extracted, including technical maturity issues, professional designer issues, limitations of professional knowledge, architectural individualization, funding issues, interest concerns among multiple units, internal management issues, and collaborative issues among multiple units.
Axial coding is a process of cluster analysis that uses a few main categories to represent many subcategories. Technical barriers, economic barriers, and management barriers were extracted from the eight subcategories according to the two dimensions of attributes and logic. Selective coding was adopted to extract the core category of “barriers in prefabricated building design” from the three main categories. After open coding, axial coding, and selective coding, a new theory was generated, as shown in Table 2. This theory includes the core category, main categories, subcategories, and a description. In classical GT, theoretical saturation is verified by raw data reserved in advance. If the new data no longer generate extra categories, then the theory tends to become saturated. The files provided by another two prefabricated building projects were conceptualized and categorized according to the standard process of GT. The results showed that new categories were not discovered. Therefore, the theory in Table 2 is saturated.
3.2. SSIM-Based Relationship Judgment
The relationships and weights of the prefabrication design barriers should be determined by designers with relevant experience. A one-to-one judging method was selected instead of anonymous questionnaires. The one-to-one contact method has several advantages over anonymous questionnaires: (1) the qualifications of the experts can be guaranteed; (2) direct communication between the interviewer and interviewee can be achieved; (3) subsequent feedback is available when the expert opinions are largely inconsistent; (4) more accurate responses and other valuable information can be obtained. Five of the six experts in GT and fifteen new experts were invited to one-to-one interviews. Although all twenty experts provided preliminary judgments, fifteen of them were ultimately selected according to one-on-one communication at the time, alongside later feedback. For information on the fifteen experts, see Table 3. Five of the experts agreed to be interviewed and make judgments face to face, while the other fifteen only engaged in online judgments one-to-one. Experts who engage in structural design (among four roles) accounted for a maximum of 60.00%. Experts with more than five years of experience accounted for 73.33%. Experts participating in more than ten prefabricated projects accounted for 60.00%. Hence, the qualifications of these experts were acceptable.
Inconsistencies among experts emerged when judging the dependence between the identified design barriers. Currently, there are two known principles for dealing with this phenomenon: the principle of “the minority gives way to the majority” [43,44] and the principle of “the error is within the allowable range” [45,46]. Since the error value in SSIM is not easy to calculate, the principle of “the minority gives way to the majority” was adopted here. The statistical results were sent to some experts with divergent perspectives to request their opinions. After several rounds of improvement, the final results are shown in Table 4.
4. ANP-Based Barrier Prioritization and Measurement
4.1. Establishment of a Network Model
ANP consists of control hierarchy and network hierarchy. A network model based on ANP was established to calculate the weights of the design barriers, as shown in Figure 2. This model only shows the structure of the network hierarchy. The elements of the network hierarchy include technical maturity issues, professional designer issues, limitations of professional knowledge, architectural individualization, funding issues, interest concerns among multiple units, internal management issues, and collaborative issues among multiple units. The clusters of the network hierarchy include technical barriers, economic barriers, and management barriers. The software SuperDecisions was specially designed for ANP and uses multidata entry methods. In order to use SuperDecisions for calculations, the cluster “alternative” was added, and the corresponding element was “a project”. The network model features independence and feedback within clusters (e.g., technical barriers and management barriers). The element “a project”, and all other elements influence each other.
In order to design a simple and effective questionnaire, it was necessary to determine the dependence between the relevant barriers. The statistical results of intercluster dependence are shown in Table 5, and the statistical results of interelement dependence are shown in Table 6. If the count of a cell in Table 5 is greater than 0, then the corresponding comparison item must be set in the questionnaire. By contrast, when the count of a cell in Table 6 is greater than 1 instead of 0, the corresponding comparison item can only be set in the questionnaire. This questionnaire was designed according to SuperDecisions, and the relevant content is attached in Appendix A.
4.2. Calculation of Barrier Weights
ANP does not require a large amount of sample data. Hence, the data provided by fifteen qualified experts is enough for the network model. The questionnaire itself has the function of data rationality testing: one test is a random consistency ratio test, and the other is a ranking error test. The unweighted super matrix, weighted super matrix, and limit super matrix of each questionnaire were automatically calculated by the software SuperDecisions to obtain the ANP ranking. If the error between the ANP ranking and the approximate ranking of a barrier in a questionnaire exceeds two, then the expert corresponding to the questionnaire needs to be contacted again. Kendall’s W test is suitable for assessing the degree of consensus among different experts [47]. The values of this test range from 0 to 1 [48], and values higher than 0.7 indicate an acceptable degree of consensus [49]. Hence, Kendall’s W test was used as a consistency test among the different questionnaires. If the tests within the questionnaire and between the questionnaires failed, the summary results were fed back to the experts with diverging perspectives to obtain their opinions. In order to complete all tests as quickly as possible, data processing followed the principle of “less obey most” as much as possible during the multiple feedbacks. After multiple rounds of feedbacks and calculations, the value of Kendall’s W was determined to be 0.891, which was greater than 0.7. The final weights of each barrier cluster and element are the average of all questionnaires (see Table 7).
4.3. Measurement of Barrier Strength
Although the weight of each design barrier has been determined, each barrier’s occurrence likelihood and severity may vary between different prefabricated building projects. For a prefabricated building project, it is sometimes necessary to assess its overall design’s barrier strength. The linear weighted sum method (LWSM) was used to calculate the overall barrier strength of a prefabricated building design. The key to LWSM is to select an evaluation set. A Likert scale served as the evaluation set in many previous studies [50,51]. Hence, it was adopted here to measure the severity of each design barrier: 1, 2, 3, 4, and 5 represent very weak, weak, medium, strong, and very strong, respectively [52]. The calculation principle is shown in Equations (5) and (6). W is a weight vector and R is the average scoring vector of n experts. f is the overall design barrier strength of the project. The value of f is limited to between 1 and 5. The higher the value, the greater the barrier strength encountered during the prefabricated building design, and vice versa.
4.4. Case Evaluation
A case study with detailed information is an effective way to simulate and test the established methodology. A prefabricated building project is under construction in Nanjing, China. It is a large project for improving the lives of the community residents. Some basic data on the project were obtained with the help of a project member, and the plane layout of the floor is shown in Figure 3. The gross floor area of this project is over 35000 m2, and the capacity building area above ground is about 20600 m2. The planning height limit is no more than 60 m. This project features an assembled monolithic frame structure with an overall assembly rate of no less than 40% divided into three construction areas: A, B, and C. Construction area A includes two floors underground and three floors above ground. Construction area B includes two floors underground and eleven floors above ground. Construction area C consists of two floors underground and four floors above ground. The building’s designed working life is 50 years.
A brief consultation was conducted with the above project member. Although some design barriers appeared during the project design, they were not specifically measured. Hence, three experts involved in the project design were further invited to evaluate the severity of each barrier. The corresponding questionnaire is attached in Appendix B. The final score of each barrier was calculated according to the average scores of the three experts, as shown in Table 8. The overall barrier strength of this project is 3.6244. This is an early warning signal that should be taken seriously by the design unit.
5. Results and Discussion
5.1. The Relationship and Importance Analysis of Design Barriers
This study identified eight barrier elements affecting prefabricated building design using GT and analyzed the dependence among these barrier elements via SSIM. Technical maturity issues and professional designer issues influence each other. Meanwhile, technical maturity issues are also influenced by architectural individualization. Collaborative issues among multiple units are influenced by internal management issues, funding issues, interest concerns among multiple units, as well as the limitations of professional knowledge. In addition, funding issues are also influenced by collaborative issues. The eight barrier elements were further classified into three clusters according to their respective attributes: the technical barrier cluster, the economic barrier cluster, and the management barrier cluster. Compared to the economic barrier cluster, the technical barrier cluster and management barrier cluster experience self-feedback.
The barrier prioritization towards prefabricated building design was implemented by ANP. In the three aforementioned clusters, we found that the technical barrier cluster is the most important, the management barrier cluster is the second most important, and the economic barrier cluster is third. The corresponding weights were 0.6285, 0.2221, and 0.1494, respectively. Hence, our study suggests that solving the technical barrier cluster is the key to improving the success rate of prefabricated building design by a large margin. In the eight barrier elements, architectural individualization had a maximum weight of 0.3190. This shows that architectural individualization is the most important factor hindering the success rate of prefabricated building design. In addition, architectural individualization is not conducive to the development of professional technology and its designers. Hence, architectural standardization should be taken seriously, including standard components, house types, and processes. Collaborative issues among multiple units came second. According to the feedback from experts, the collaborative issues between design units and owners are a priority. Professional designer issues, interest concerns among multiple units, and technical maturity issues ranked third, fourth, and fifth, respectively. The importance of technical maturity was reduced here, which may be related to the development time of prefabricated buildings. Technical maturity was a key factor hindering the development of prefabricated buildings in previous studies [53]. Professional designer issues are also related to the development times of prefabricated buildings. As time increases, the importance of professional designer issues will be further weakened. Limitations of professional knowledge, funding issues, and internal management issues ranked sixth, seventh, and eighth, respectively. The importance of these three barriers was very weak, so their management should require fewer resources.
5.2. Strength Analysis of Design Barriers
This study further establishes a mathematical model for measuring the overall design barrier strength of a prefabrication project. Considering the collection difficulty of project cases and their corresponding designers, only one project case was obtained. Some barriers were encountered during the project design. The results of the three experts’ scores indicate that the project faces serious architectural individualization and collaborative issues among multiple units. Professional designer issues, interest concerns among multiple units, and internal management issues tend to be medium in terms of their severity. Only technical maturity issues, limitations of professional knowledge, and funding issues are less severe. The overall barrier strength, 3.6244, was closer to 4 than 3. This value means that the overall barrier strength was greater. In order to reduce the overall design barrier strength more effectively, architectural individualization and collaborative issues among multiple units should be given priority in the process of solving the eight barriers.
6. Conclusions and Future Work
This study identified the eight barriers affecting prefabricated building design and classified these barriers into technical barrier clusters, economic barrier clusters, and management barrier clusters via grounded theory (GT). Then, this study analyzed the dependence among these barriers via a structured self-intersection matrix (SSIM). We determined that the technical barrier cluster and management barrier cluster present self-feedback. Based on the above, this study established a ANP-based network model to calculate the weight of each design barrier. Architectural individualization is the most important barrier during prefabricated building design, followed by the collaborative issues among multiple units and professional designer issues. In addition, this study further established a mathematical model that can measure the overall design barrier strength of a prefabrication project. The evaluation results of the project case show that the overall design barrier strength is greater. These findings will provide a reference for members of the facility management sector (especially those in the design unit) engaged in prefabricated buildings and improve the success rate of prefabricated building design.
Architectural individualization is crucial to improving people’s lives. Although it cannot be eliminated, its adverse effects can be weakened in other ways. Based on the results of further investigations and consultations, our first suggestion is to establish a library of standard house types to achieve architectural design via multihouse combinations. This library will consist of standard houses, standard components, and design codes. The individual demands of owners will be met through the permutation and combination of standard houses. The second suggestion is to create a cross-professional collaboration platform and increase the training for professional designers. Since building information modeling (BIM) possesses the characteristics of visualization, coordination, simulation, optimization, and parameterization, it should be used to assist in the realization of the library, platform, and training. For example, the facility management sector (especially the design unit) could establish a BIM-based collaboration platform.
Since this study is relatively new, these established theories and findings will provide reference and guidance for architectural design units in China and other countries with similar situations. The influence of labor unions in these countries is relatively weak or even ignored, so unions were not included in the barrier system. One limitation of this study is that we could only use one project case and its corresponding three designers due to the difficulty of data collection. In this study, we also found that technical maturity issues and professional designer issues are related to time. The time of the study may have an impact on the weights of these barriers. Hence, the number of project cases and the impact of time may be a direction for future research.
Author Contributions
Z.Y. was responsible for the conceptualization, data curation, formal analysis, methodology, validation, and writing of the original draft. W.W. supervised the research and provided guidance. G.N. and L.W. provided guidance and assisted in the collection of some data. Y.Q. assisted in the review and editing. The contributions from C.S. and N.X. were funding acquisition. All authors have read and agreed to the published version of the manuscript.
Funding
This research was supported by the National Natural Science Foundation of China (Grant No. 51878026), the Fundamental Research Funds for the Central Universities (Project No. 2020QN73), as well as Jiangsu Collaborative Innovation Center for Building Energy Saving and Construction Technology (Project No. SJXTBZ1704).
Acknowledgments
The authors are grateful to all the experts who provided us with guidance.
Conflicts of Interest
The authors declare no conflicts of interest.
Appendix A
Dear expert:
Hello! Changes in prefabricated building designs are common, which greatly reduces the success rate and quality of such designs. This survey aims to rank the barriers affecting prefabricated building design. We hereby promise that all questions in this questionnaire will maintain your work confidentiality and personal privacy. This study is only for academic research purposes, not commercial purposes.
(1) Please fill in your basic information in Table A1.

Table A1.
Basic information for the expert.
| Position | Role | Years of Experience in Prefabrication | Number of Prefabrication Projects |
|---|---|---|---|
(2) All design barriers and their explanations (omitted).
(3) Please approximately rank the barriers in Table A2.
Table A2.
Ranking of design barriers.
| Ranking | 1 | 2 | 3 | 4 | 5 | 6 | 7 | 8 |
| Barriers |
Note: 1 to 8 indicate a decreasing level of importance.
(4) Pairwise comparison of barrier importance.
The following Table A3, Table A4, Table A5, Table A6, Table A7, are used to determine the importance of barriers. Values 1, 3, 5, 7, and 9 represent equal importance, slightly important, more important, very important, and extremely important, while 2, 4, 6, and 8 represent the intermediate values (Please put “√” in the corresponding cells in the tables. For research purposes, the cluster “alternative” and the element “a project” are, by default, absolutely important, so the “√” is placed in advance at the corresponding position (9)).
(4.1) Comparison between clusters
Table A3.
Cluster comparisons with respect to “alternatives”.
| Clusters | 9 | 8 | 7 | 6 | 5 | 4 | 3 | 2 | 1 | 2 | 3 | 4 | 5 | 6 | 7 | 8 | 9 | Clusters |
|---|---|---|---|---|---|---|---|---|---|---|---|---|---|---|---|---|---|---|
| Technical barriers | Management barriers | |||||||||||||||||
| Technical barriers | Economic barriers | |||||||||||||||||
| Management barriers | Economic barriers |
Table A4.
Cluster comparisons with respect to technical barriers.
| Clusters | 9 | 8 | 7 | 6 | 5 | 4 | 3 | 2 | 1 | 2 | 3 | 4 | 5 | 6 | 7 | 8 | 9 | Clusters |
|---|---|---|---|---|---|---|---|---|---|---|---|---|---|---|---|---|---|---|
| Technical barriers | √ | Alternatives | ||||||||||||||||
| Technical barriers | Management barriers | |||||||||||||||||
| Alternatives | √ | Management barriers |
Table A5.
Cluster comparisons with respect to economic barriers.
| Clusters | 9 | 8 | 7 | 6 | 5 | 4 | 3 | 2 | 1 | 2 | 3 | 4 | 5 | 6 | 7 | 8 | 9 | Clusters |
|---|---|---|---|---|---|---|---|---|---|---|---|---|---|---|---|---|---|---|
| Alternatives | √ | Management barriers |
Table A6.
Cluster comparisons with respect to management barriers.
| Clusters | 9 | 8 | 7 | 6 | 5 | 4 | 3 | 2 | 1 | 2 | 3 | 4 | 5 | 6 | 7 | 8 | 9 | Clusters |
|---|---|---|---|---|---|---|---|---|---|---|---|---|---|---|---|---|---|---|
| Alternatives | √ | Management barriers | ||||||||||||||||
| Alternatives | √ | Economic barriers | ||||||||||||||||
| Management barriers | Economic barriers |
(4.2) Comparison between elements
Table A7.
Element comparisons with respect to “a project”.
| Elements | 9 | 8 | 7 | 6 | 5 | 4 | 3 | 2 | 1 | 2 | 3 | 4 | 5 | 6 | 7 | 8 | 9 | Elements |
|---|---|---|---|---|---|---|---|---|---|---|---|---|---|---|---|---|---|---|
| Limitations of professional knowledge | Professional designer issues | |||||||||||||||||
| Limitations of professional knowledge | Architectural individualization | |||||||||||||||||
| Limitations of professional knowledge | Technical maturity issues | |||||||||||||||||
| Professional designer issue | Architectural individualization | |||||||||||||||||
| Professional designer issues | Technical maturity issues | |||||||||||||||||
| Architectural individualization | Technical maturity issues | |||||||||||||||||
| Internal management issues | Collaborative issues between multiple units | |||||||||||||||||
| Interest concerns among multiple units | Funding issues |
Appendix B
Dear expert:
Hello! Changes in prefabricated building designs are common, which greatly reduces the success rate and quality of such designs. We have identified some barriers affecting the success rate of prefabricated building design. Please evaluate this prefabricated building project based on these identified barriers.
(1) All design barriers and their explanations (omitted).
(2) Questions and expert judgments.
According to your experience, please determine the severity of the following design barriers during the project design (Please put “√” in the corresponding cell in the Table A8 below).
Table A8.
Severity evaluation of the design barriers for the project case.
| Design Barrier Elements | Level (1 very weak, 2 weaker, 3 medium, 4 stronger, 5 very strong) | ||||
|---|---|---|---|---|---|
| 1 | 2 | 3 | 4 | 5 | |
| Technical maturity issues | |||||
| Professional designer issues | |||||
| Limitations of professional knowledge | |||||
| Architectural individualization | |||||
| Funding issues | |||||
| Interest concerns among multiple units | |||||
| Internal management issues | |||||
| Collaborative issues between multiple units | |||||
References
- Ma, L.; Le, Y.; Li, H.; Jin, R.; Piroozfar, P.; Liu, M. Regional Comparisons of Contemporary Construction Industry Sustainable Concepts in the Chinese Context. Sustainability 2018, 10, 3831. [Google Scholar] [CrossRef] [Green Version]
- Jiang, L.; Li, Z.; Li, L.; Gao, Y. Constraints on the Promotion of Prefabricated Construction in China. Sustainability 2018, 10, 2516. [Google Scholar] [CrossRef] [Green Version]
- Xue, H.; Zhang, S.; Su, Y.; Wu, Z. Capital Cost Optimization for Prefabrication: A Factor Analysis Evaluation Model. Sustainability 2018, 10, 159. [Google Scholar] [CrossRef] [Green Version]
- Teng, Y.; Mao, C.; Liu, G.; Wang, X. Analysis of stakeholder relationships in the industry chain of industrialized building in China. J. Clean. Prod. 2017, 152, 387–398. [Google Scholar] [CrossRef]
- Palanci, M.; Senel, S.M. Rapid seismic performance assessment method for one story hinged precast buildings. Struct. Eng. Mech. 2013, 48, 257–274. [Google Scholar] [CrossRef]
- Mao, C.; Shen, Q.; Pan, W.; Ye, K. Major Barriers to Off-Site Construction: The Developer’s Perspective in China. J. Manag. Eng. 2015, 31, 04014043. [Google Scholar] [CrossRef]
- Chen, K.; Xu, G.; Xue, F.; Zhong, R.Y.; Liu, D.; Lu, W. A Physical Internet-enabled Building Information Modelling System for prefabricated construction. Int. J. Comput. Integr. Manuf. 2017, 31, 349–361. [Google Scholar] [CrossRef] [Green Version]
- Yin, X.; Liu, H.; Chen, Y.; Al-Hussein, M. Building information modelling for off-site construction: Review and future directions. Autom. Constr. 2019, 101, 72–91. [Google Scholar] [CrossRef]
- Hong, J.; Shen, Q.; Li, Z.; Zhang, B.; Zhang, W. Barriers to promoting prefabricated construction in China: A cost–benefit analysis. J. Clean. Prod. 2018, 172, 649–660. [Google Scholar] [CrossRef]
- Larsson, J.; Eriksson, P.-E.; Olofsson, T.; Simonsson, P. Industrialized construction in the Swedish infrastructure sector: Core elements and barriers. Constr. Manag. Econ. 2013, 32, 83–96. [Google Scholar] [CrossRef]
- Li, C.Z.; Xu, X.; Shen, Q.; Fan, C.; Li, X.; Hong, J. A model for simulating schedule risks in prefabrication housing production: A case study of six-day cycle assembly activities in Hong Kong. J. Clean. Prod. 2018, 185, 366–381. [Google Scholar] [CrossRef]
- Gan, X.; Chang, R.; Wen, T. Overcoming barriers to off-site construction through engaging stakeholders: A two-mode social network analysis. J. Clean. Prod. 2018, 201, 735–747. [Google Scholar] [CrossRef]
- Jaillon, L.C.; Poon, C. Design issues of using prefabrication in Hong Kong building construction. Constr. Manag. Econ. 2010, 28, 1025–1042. [Google Scholar] [CrossRef]
- Godbole, S.; Lam, N.; Mafas, M.; Fernando, S.; Gad, E.; Hashemi, M.J. Dynamic loading on a prefabricated modular unit of a building during road transportation. J. Build. Eng. 2018, 18, 260–269. [Google Scholar] [CrossRef]
- Zhu, H.; Hong, J.; Shen, Q.; Mao, C.; Zhang, H.; Li, Z. The exploration of the life-cycle energy saving potential for using prefabrication in residential buildings in China. Energy Build. 2018, 166, 561–570. [Google Scholar] [CrossRef]
- Kurama, Y.; Sritharan, S.; Fleischman, R.B.; Restrepo, J.I.; Henry, R.S.; Cleland, N.M.; Ghosh, S.K.; Bonelli, P. Seismic-Resistant Precast Concrete Structures: State of the Art. J. Struct. Eng. 2018, 144, 03118001. [Google Scholar] [CrossRef] [Green Version]
- Liu, Y.-L.; Wang, Y.-S.; Fang, G.; Alrefaei, Y.; Dong, B.; Xing, F. A preliminary study on capsule-based self-healing grouting materials for grouted splice sleeve connection. Constr. Build. Mater. 2018, 170, 418–423. [Google Scholar] [CrossRef]
- Srisangeerthanan, S.; Hashemi, M.J.; Rajeev, P.; Gad, E.; Fernando, S. Numerical study on the effects of diaphragm stiffness and strength on the seismic response of multi-story modular buildings. Eng. Struct. 2018, 163, 25–37. [Google Scholar] [CrossRef]
- Bogenstätter, U. Prediction and optimization of life-cycle costs in early design. Build. Res. Inf. 2000, 28, 376–386. [Google Scholar] [CrossRef]
- Kovacic, I.; Zoller, V. Building life cycle optimization tools for early design phases. Energy 2015, 92, 409–419. [Google Scholar] [CrossRef]
- Chen, K.; Lu, W. Design for Manufacture and Assembly Oriented Design Approach to a Curtain Wall System: A Case Study of a Commercial Building in Wuhan, China. Sustainability 2018, 10, 2211. [Google Scholar] [CrossRef] [Green Version]
- Yuan, Z.; Sun, C.; Wang, Y. Design for Manufacture and Assembly-oriented parametric design of prefabricated buildings. Autom. Constr. 2018, 88, 13–22. [Google Scholar] [CrossRef]
- Fox, S.; Marsh, L.; Cockerham, G. Design for manufacture: A strategy for successful application to buildings. Constr. Manage. Econ. 2001, 19, 493–502. [Google Scholar] [CrossRef]
- Martinez, S.; Jardón, A.; Victores, J.; Balaguer, C. Flexible field factory for construction industry. Assem. Autom. 2013, 33, 175–183. [Google Scholar] [CrossRef] [Green Version]
- Montali, J.; Overend, M.; Pelken, P.M.; Sauchelli, M. Knowledge-Based Engineering in the design for manufacture of prefabricated façades: Current gaps and future trends. Arch. Eng. Des. Manag. 2017, 14, 78–94. [Google Scholar] [CrossRef] [Green Version]
- Zhang, W.; Lee, M.W.; Jaillon, L.C.; Poon, C.-S. The hindrance to using prefabrication in Hong Kong’s building industry. J. Clean. Prod. 2018, 204, 70–81. [Google Scholar] [CrossRef]
- Wu, P.; Xu, Y.; Jin, R.; Lu, Q.; Madgwick, D.; Hancock, C.M. Perceptions towards risks involved in off-site construction in the integrated design & construction project delivery. J. Clean. Prod. 2019, 213, 899–914. [Google Scholar]
- Arditi, D.; Ergin, U.; Gunhan, S. Factors Affecting the Use of Precast Concrete Systems. J. Arch. Eng. 2000, 6, 79–86. [Google Scholar] [CrossRef]
- Polat, G. Factors Affecting the Use of Precast Concrete Systems in the United States. J. Constr. Eng. Manag. 2008, 134, 169–178. [Google Scholar] [CrossRef]
- Rahman, M.M. Barriers of Implementing Modern Methods of Construction. J. Manag. Eng. 2014, 30, 69–77. [Google Scholar] [CrossRef] [Green Version]
- Shojaei, P.; Haeri, S.A.S. Development of supply chain risk management approaches for construction projects: A grounded theory approach. Comput. Ind. Eng. 2019, 128, 837–850. [Google Scholar] [CrossRef]
- Walsh, I. Using quantitative data in mixed-design grounded theory studies: An enhanced path to formal grounded theory in information systems. Eur. J. Inf. Syst. 2015, 24, 531–557. [Google Scholar] [CrossRef]
- Village, J.; Searcy, C.; Salustri, F.; Neumann, W.P.; Salustri, F. Design for human factors (DfHF): A grounded theory for integrating human factors into production design processes. Ergonomics 2015, 58, 1529–1546. [Google Scholar] [CrossRef] [PubMed]
- Hu, Z.; Cheng, H.; Liu, X. The definition of capability of public service and elemental analysis for its structure based on the grounded research. J. UESTC (Soc. Sci. Ed.) 2019, 21, 1–6. (In Chinese) [Google Scholar]
- Abuzeinab, A.; Arif, M.; Qadri, M.A. Barriers to MNEs green business models in the UK construction sector: An ISM analysis. J. Clean. Prod. 2017, 160, 27–37. [Google Scholar] [CrossRef]
- Yu, T.; Shi, Q.; Zuo, J.; Chen, R. Critical factors for implementing sustainable construction practice in HOPSCA projects: A case study in China. Sustain. Cities Soc. 2018, 37, 93–103. [Google Scholar] [CrossRef]
- Xu, P.; Chan, E.H. ANP model for sustainable Building Energy Efficiency Retrofit (BEER) using Energy Performance Contracting (EPC) for hotel buildings in China. Habitat Int. 2013, 37, 104–112. [Google Scholar] [CrossRef]
- Peng, S.-H. Landscape Assessment for Stream Regulation Works in a Watershed Using the Analytic Network Process (ANP). Sustainability 2019, 11, 1540. [Google Scholar] [CrossRef] [Green Version]
- Wong, J.; Li, H.; Lai, J. Evaluating the system intelligence of the intelligent building systems—Part 2: Construction and validation of analytical models. Autom. Constr. 2008, 17, 303–321. [Google Scholar] [CrossRef]
- Bayazit, O. Use of analytic network process in vendor selection decisions. Benchmarking Int. J. 2006, 13, 566–579. [Google Scholar] [CrossRef]
- Wang, L. The theory and algorithm of analytic network process. Syst. Eng. Theory Pract. 2001, 3, 44–50. (In Chinese) [Google Scholar]
- Zhong, D.; Li, Z.; Wu, B.; Hu, W.; Lv, P. Time-quality-cost tradeoff optimization of rockfill dam construction based on pareto solution. J. Tianjin Univ. (Sci. Technol.) 2016, 49, 1001–1007. (In Chinese) [Google Scholar]
- Gan, X.; Chang, R.; Zuo, J.; Wen, T.; Zillante, G. Barriers to the transition towards off-site construction in China: An Interpretive structural modeling approach. J. Clean. Prod. 2018, 197, 8–18. [Google Scholar] [CrossRef]
- Shen, L.; Song, X.; Wu, Y.; Liao, S.; Zhang, X.; Xiangnan, S. Interpretive Structural Modeling based factor analysis on the implementation of Emission Trading System in the Chinese building sector. J. Clean. Prod. 2016, 127, 214–227. [Google Scholar] [CrossRef]
- Zeng, J.; Huang, R.; Guan, Y. Research on application of entropy-unascertained measure theory in tailing pond safety standardization. J. Saf. Sci. Technol. 2014, 10, 160–166. (in Chinese). [Google Scholar]
- Guo, J.; Jin, X.; Guo, S. Study of the Operational Safety of a Vascular Interventional Surgical Robotic System. Micromachines 2018, 9, 119. [Google Scholar] [CrossRef] [Green Version]
- Akhavan, P.; Shahabipour, A.; Hosnavi, R. A model for assessment of uncertainty in tacit knowledge acquisition. J. Knowl. Manag. 2018, 22, 413–431. [Google Scholar] [CrossRef]
- Bunting, S. Assessing the Stakeholder Delphi for Facilitating Interactive Participation and Consensus Building for Sustainable Aquaculture Development. Soc. Nat. Resour. 2010, 23, 758–775. [Google Scholar] [CrossRef]
- Gearhart, A.; Booth, D.T.; Sedivec, K.; Schauer, C. Use of Kendall’s coefficient of concordance to assess agreement among observers of very high resolution imagery. Geocarto Int. 2013, 28, 517–526. [Google Scholar] [CrossRef]
- Yin, Y.; He, Y.; Zhang, L.; Zhao, D. Impact of Building Environment on Residential Satisfaction: A Case Study of Ningbo. Sustainability 2019, 11, 1197. [Google Scholar] [CrossRef] [Green Version]
- Wang, R.; Liu, G.; Zhou, J.; Wang, J. Identifying the Critical Stakeholders for the Sustainable Development of Architectural Heritage of Tourism: From the Perspective of China. Sustainability 2019, 11, 1671. [Google Scholar] [CrossRef] [Green Version]
- Liu, J.; Xie, Q.; Xia, B.; Bridge, A. Impact of Design Risk on the Performance of Design-Build Projects. J. Constr. Eng. Manag. 2017, 143, 04017010. [Google Scholar] [CrossRef]
- Wu, G.; Yang, R.; Li, L.; Bi, X.; Liu, B.; Li, S.; Zhou, S. Factors influencing the application of prefabricated construction in China: From perspectives of technology promotion and cleaner production. J. Clean. Prod. 2019, 219, 753–762. [Google Scholar] [CrossRef]
Figure 1.
Detailed mechanism of the grounded theory and structured self-intersection matrix (GT-SSIM) method.
Figure 1.
Detailed mechanism of the grounded theory and structured self-intersection matrix (GT-SSIM) method.

Figure 2.
Network model based on analytic network process (ANP).
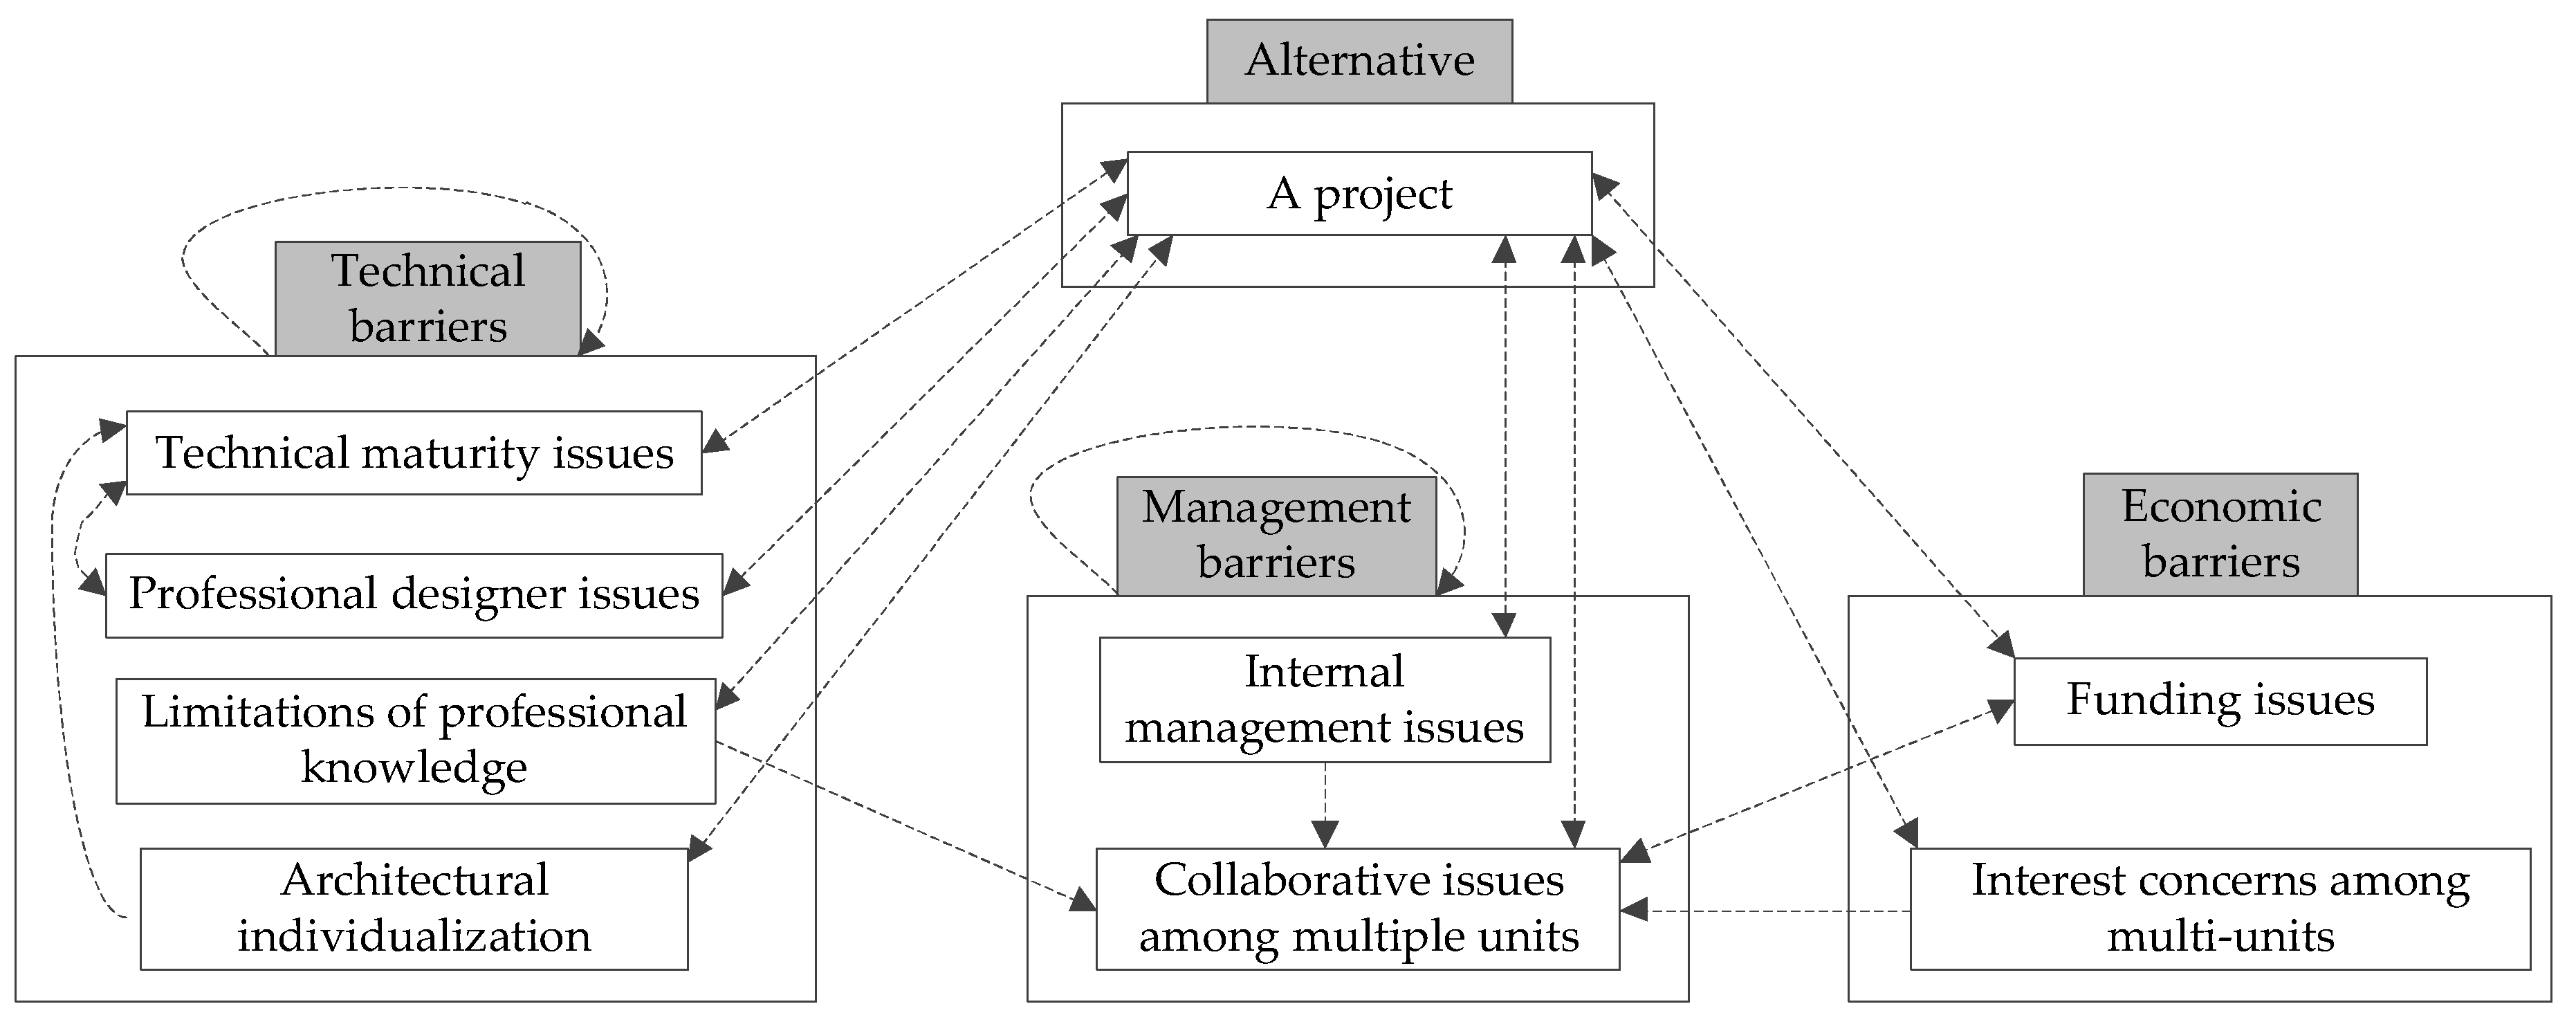
Figure 3.
The plane layout of a floor in the project case.
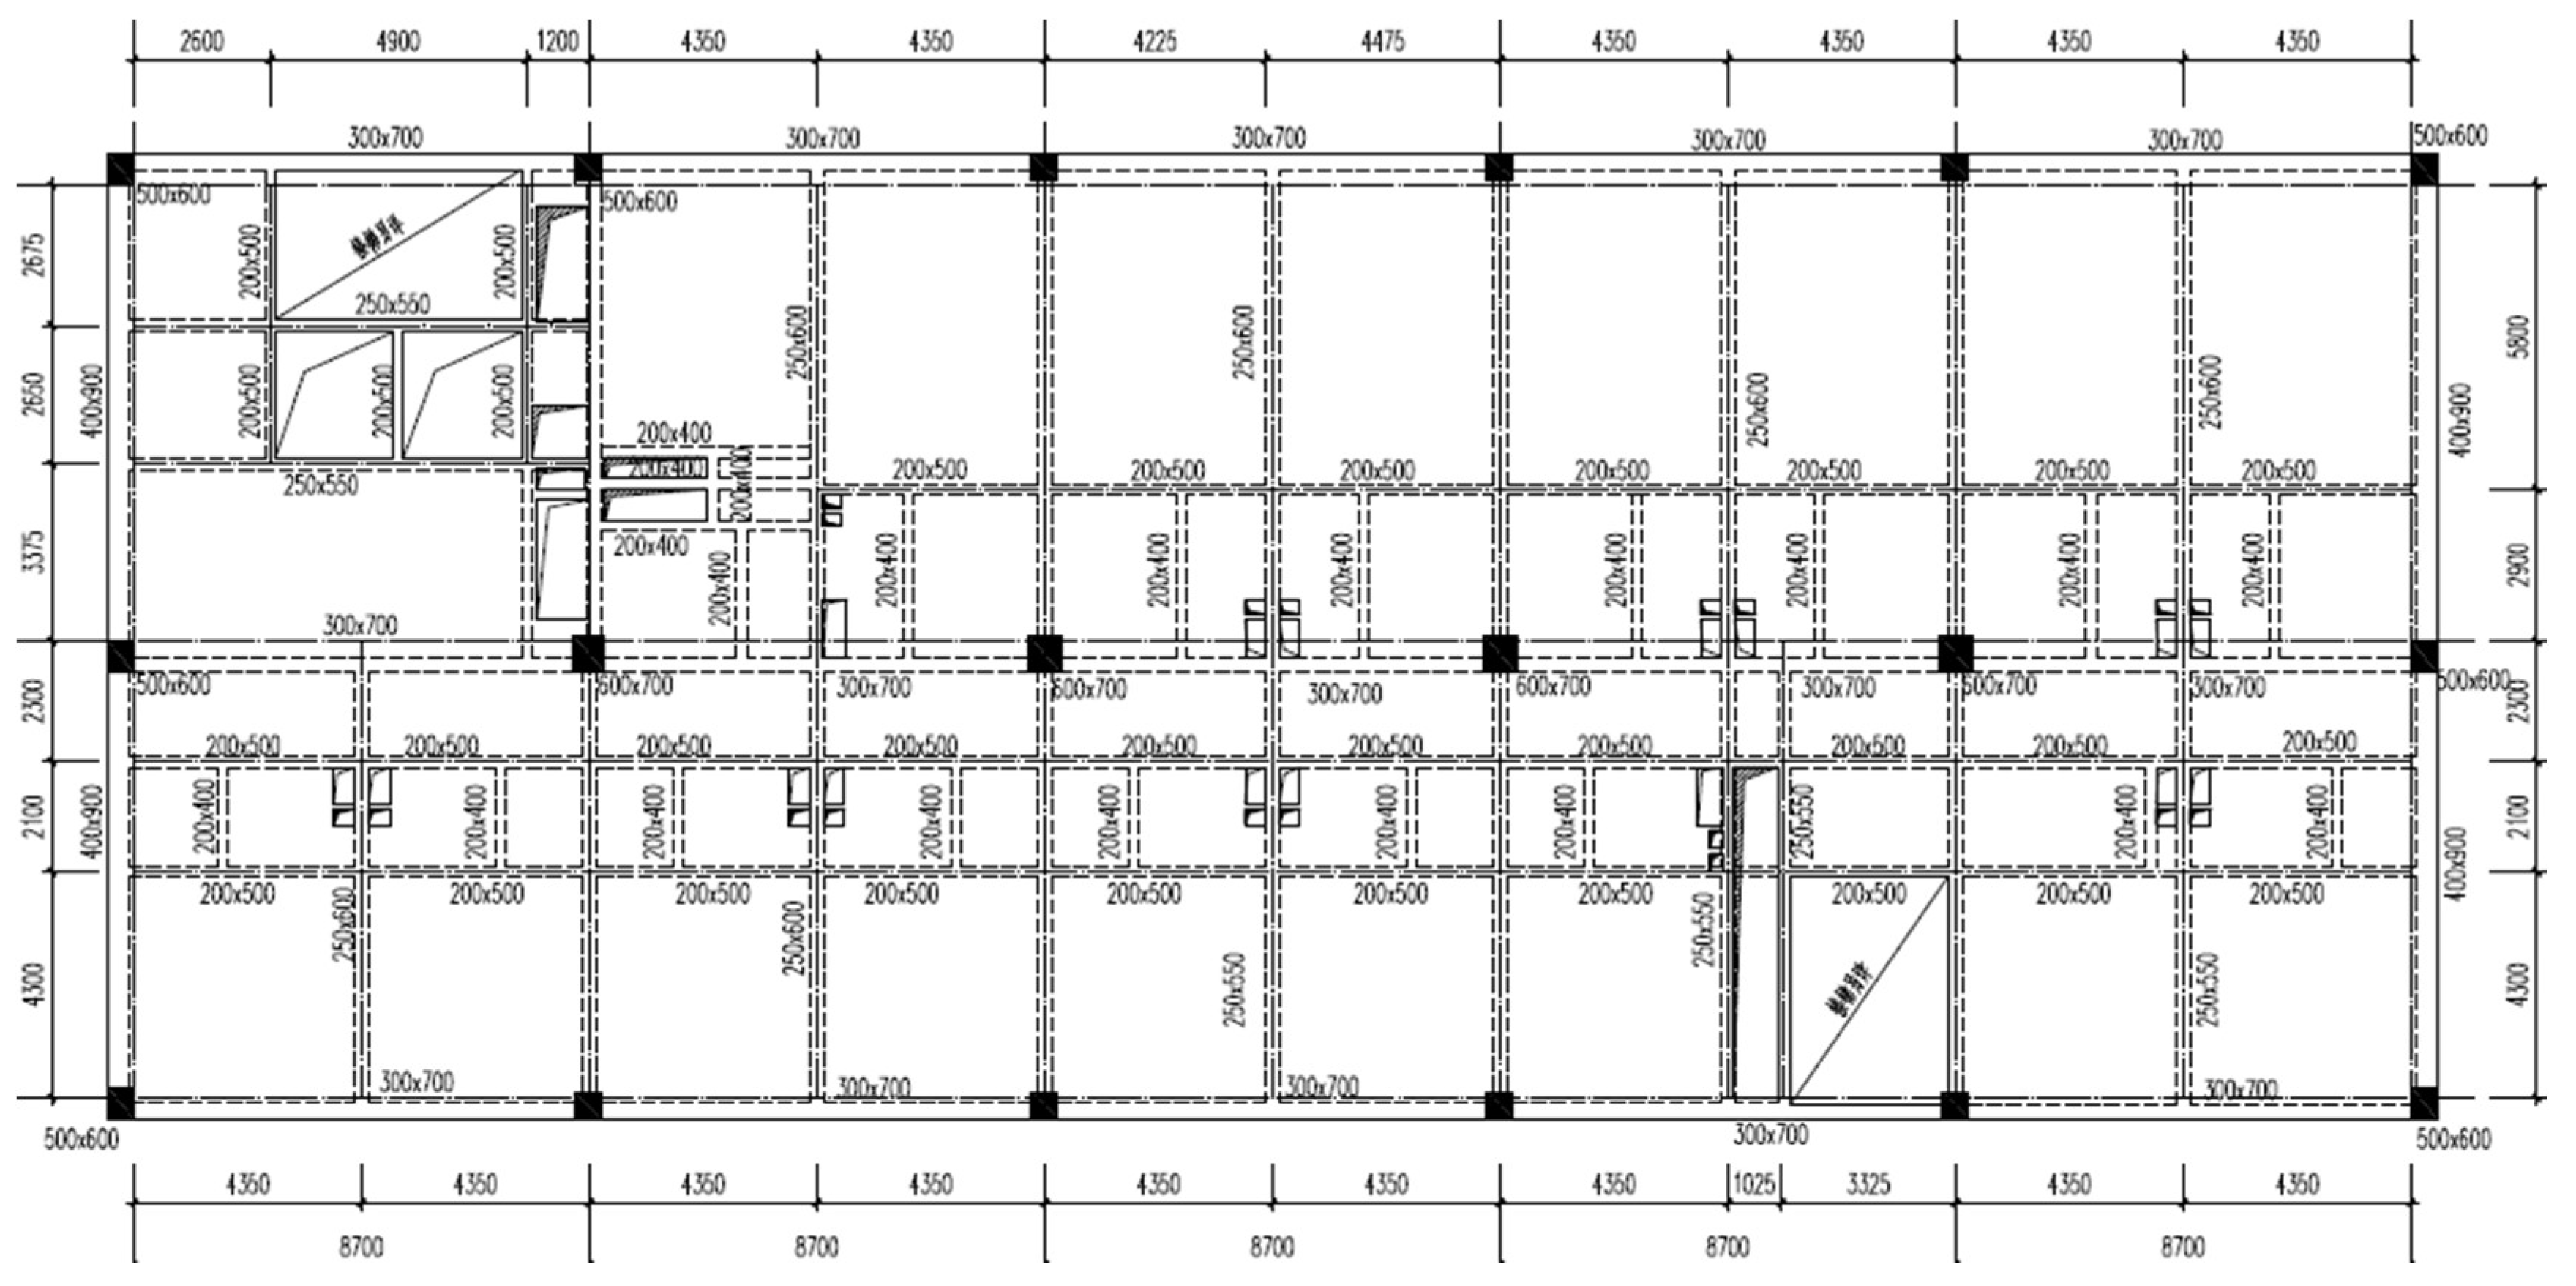
Table 1.
Parts of open coding in GT.
| Raw Data | Labeling | Conceptualization | Categorization |
|---|---|---|---|
| For prefabricated buildings, a traditional design is not enough, and an in-depth process design is required. … The barrier to current fabricated architectural design is that the standardized design is relatively poor (aa1). | aa1. Standardized design is relatively low | a1. Low standardized design | A1. Architectural individualization |
| Determining the optimal design by considering the difficulty of manufacturing, logistics, and on-site installation, rather than producing the drawings alone (aa2). | aa2. Considering manufacturing, logistics, and on-site installation during design | a2. Collaboration among multiple units | A2. Collaborative issues among multiple units |
| … | … | … | … |
| Lack of standards for modular members that can be adopted consistently in design and construction across projects (aa5). … Lack of a well-established design code or standard for the joints to connect with modular components on-site (aa6). ……. Insufficiently developed regulations and policies to promote OSC (aa7). | aa5. Lack of standards for modular members aa6. Lack of a well-established design code or standards for joints aa7. Insufficiently developed regulations and policies | a5. Lacking policies and design code | A5. Technical maturity issues |
| … | … | … | … |
Table 2.
Barrier systems affecting prefabricated building design.
| Core Category | Main Categories | Subcategories | Description of Subcategories |
|---|---|---|---|
| Barriers for prefabricated building design | Technical barriers (T) | Technical maturity issues (T1) | Prefabricated technology is still relatively new and immature, and some design standards and norms are imperfect or even lacking. |
| Professional designer issues (T2) | Prefabricated buildings require detailed designs, but professional designers are scarce, and/or their design experience is insufficient. | ||
| Limitations of professional knowledge (T3) | The process of prefabricated building design involves multiple units and professions, but it is impossible for designers to master all types of knowledge. | ||
| Architectural individualization (T4) | Some prefabricated buildings pursue individualization, which leads to a low level of design standardization. | ||
| Economic barriers (E) | Funding issues (E1) | Insufficient funds required by the design unit during the prefabricated building design. | |
| Interest concerns among multiple units (E2) | Units often provide guidance for prefabricated building designs based on their own interests. | ||
| Management barriers (M) | Internal management issues (M1) | Management issues of the design unit itself. | |
| Collaborative issues among multiple units (M2) | Coordination and cooperation between design units and other units during prefabricated building design. |
Table 3.
Information regarding the fifteen experts.
| Roles of Experts | Percent | Years of Experience in Prefabrication | Percent | Numbers of Prefabrication Projects | Percent |
|---|---|---|---|---|---|
| Detailed design | 20.00 | 1~5 | 26.67 | 1~10 | 40.00 |
| Architectural design | 13.33 | 6~10 | 46.67 | 11~20 | 26.67 |
| Structural design | 60.00 | >10 | 26.67 | 21~30 | 13.33 |
| Research and development | 6.67 | >30 | 20.00 |
Table 4.
Structured self-intersection matrix for design barriers.
| j | M2 | M1 | E2 | E1 | T4 | T3 | T2 | T1 | |
|---|---|---|---|---|---|---|---|---|---|
| i | |||||||||
| T1 | O | O | O | O | A | O | X | ||
| T2 | O | O | O | O | O | O | |||
| T3 | V | O | O | O | O | ||||
| T4 | O | O | O | O | |||||
| E1 | X | O | O | ||||||
| E2 | V | O | |||||||
| M1 | V | ||||||||
| M2 | |||||||||
Table 5.
Statistical results of intercluster dependence.
| Clusters Affected by others | Alternative | T | E | M | |
|---|---|---|---|---|---|
| Clusters | |||||
| Alternative | 4 | 2 | 2 | ||
| T | 4 | 3 | 0 | 1 | |
| E | 2 | 0 | 0 | 2 | |
| M | 2 | 0 | 1 | 1 | |
Table 6.
Statistical results of interelement dependence.
| Elements Affected by others | Alternative | T | E | M | |
|---|---|---|---|---|---|
| Elements | |||||
| Alternative | A project | 4 | 2 | 2 | |
| T | T1 | 1 | 1 | 0 | 0 |
| T2 | 1 | 1 | 0 | 0 | |
| T3 | 1 | 0 | 0 | 1 | |
| T4 | 1 | 1 | 0 | 0 | |
| E | E1 | 1 | 0 | 0 | 1 |
| E2 | 1 | 0 | 0 | 1 | |
| M | M1 | 1 | 0 | 0 | 1 |
| M2 | 1 | 0 | 1 | 0 |
Table 7.
Weights of each barrier cluster and element.
| Clusters | Weights | Elements | Weights | Ranking |
|---|---|---|---|---|
| Technical barriers (T) | 0.6285 | Technical maturity issues (T1) | 0.1027 | 5 |
| Professional designer issues (T2) | 0.1471 | 3 | ||
| Limitations of professional knowledge (T3) | 0.0597 | 6 | ||
| Architectural individualization (T4) | 0.3190 | 1 | ||
| Economic barriers (E) | 0.1494 | Funding issues (E1) | 0.0401 | 7 |
| Interest concerns among multiple units (E2) | 0.1093 | 4 | ||
| Management barriers (M) | 0.2221 | Internal management issues (M1) | 0.0288 | 8 |
| Collaborative issues among multiple units (M2) | 0.1932 | 2 |
Table 8.
Average value of the severity of each barrier.
| Barrier Elements | Average Value of Expert Judgments |
|---|---|
| Technical maturity issues (T1) | 2.6667 |
| Professional designer issues (T2) | 3.3333 |
| Limitation of professional knowledge (T3) | 2.0000 |
| Individualization of architecture (T4) | 4.3333 |
| Funding issues (E1) | 2.6667 |
| Interest concerns among multiple units (E2) | 3.0000 |
| Internal management issues (M1) | 3.0000 |
| Collaborative issues among multiple units (M2) | 4.3333 |
© 2020 by the authors. Licensee MDPI, Basel, Switzerland. This article is an open access article distributed under the terms and conditions of the Creative Commons Attribution (CC BY) license (http://creativecommons.org/licenses/by/4.0/).
Share and Cite
MDPI and ACS Style
Yuan, Z.; Ni, G.; Wang, L.; Qiao, Y.; Sun, C.; Xu, N.; Wang, W. Research on the Barrier Analysis and Strength Measurement of a Prefabricated Building Design. Sustainability 2020, 12, 2994. https://doi.org/10.3390/su12072994
AMA Style
Yuan Z, Ni G, Wang L, Qiao Y, Sun C, Xu N, Wang W. Research on the Barrier Analysis and Strength Measurement of a Prefabricated Building Design. Sustainability. 2020; 12(7):2994. https://doi.org/10.3390/su12072994
Chicago/Turabian StyleYuan, Zhenmin, Guodong Ni, Linxiu Wang, Yaning Qiao, Chengshuang Sun, Na Xu, and Wenshun Wang. 2020. "Research on the Barrier Analysis and Strength Measurement of a Prefabricated Building Design" Sustainability 12, no. 7: 2994. https://doi.org/10.3390/su12072994
Note that from the first issue of 2016, this journal uses article numbers instead of page numbers. See further details here.