Can Young Generations Recognize Marine Plastic Waste as a Systemic Issue?


College of Policy Science, Ritsumeikan University, Osaka 567-8570, Japan
Sustainability 2020, 12(7), 2586; https://doi.org/10.3390/su12072586
Submission received: 25 February 2020
/
Revised: 23 March 2020
/
Accepted: 23 March 2020
/
Published: 25 March 2020
(This article belongs to the Collection Science Education Promoting Sustainability)
Abstract
:This study reports preliminary survey results exploring whether children can recognize marine plastic waste as a systemic issue, especially regarding stock–flow relationships and delays. A systemic understanding of this issue is key to reducing marine plastic waste and to avoid its irreversible effects. Reducing the inflow of waste does not necessarily reduce the waste accumulated in the ocean, unless its rate becomes smaller than the outflow (e.g., cleanup). Delays due to a wait-and-see policy will result in irreversible effects, such as animals swallowing plastic waste, and plastic waste becoming microplastics that are difficult to clean up. A questionnaire survey was conducted during workshops and poster sessions at an event for sustainability in Japan. Participants were children from fourth grade to high school (9–18 years old). Participants were shown to have a limited systematic understanding of marine plastic waste. The majority incorrectly adopted pattern matching (70.6%) and failed to draw correct inflow and outflow curves (94.1%). The majority (83.6%) did not point out delay issues. This study indicates a need to correct mental models to understand the issue by introducing system education.
1. Introduction
Global plastic production has increased rapidly from 1.7 million metric tons (MMT) in 1950 to 288 MMT in 2012 [1]. While plastic has contributed to economic growth and prosperity, the amount of plastic waste generated and discarded in landfills and the natural environment has also increased [2,3]. Out of the 275 MMT of plastic waste generated in 2012, Jambeck et al. [4] estimated 4.8–12.7 million MMT entered the ocean. A recent study estimated that by 2030, the cumulative sum of marine plastic waste will amount to 183.14 MMT [5].
Marine plastic waste is ubiquitous [6], with negative impacts felt across social-ecological systems, including human health [7,8], as well as aesthetic concerns [9]. The United Nations Environmental Programme (UNEP) estimated the cost of marine plastic waste to marine ecosystems (economic losses incurred by fisheries, tourism, and time spent cleaning up beaches) to be approximately 13 billion USD per year [10]. To maintain the amount of marine plastic waste at the 2010 level by 2030, it will cost 0.7%–1.0% of the world gross domestic product (GDP) [5].
A systems perspective plays a crucial role in designing solutions towards eradicating marine plastic waste. Anderies et al. [11] stated that individual sustainability activities do not necessarily add up to global sustainability, and argued the importance of system-level sustainability. The problem structure of marine plastic waste is similar to greenhouse gas (GHG) concentrations in the atmosphere; it is an issue of stock and flow relationships and delays [12]. The GHG concentrations (stock) will continue to rise even if emissions (inflow) fall, unless removal (outflow) is equalized or outweighs emissions. Peoples’ mental models, (i.e., the way in which people are able to understand phenomena), may violate the conservation of matter [12]. People also underestimate delays or the time it takes for change to be enacted, so they support “wait-and-see policies” believing that problems can be solved more quickly [12]. This is true of marine plastic waste, as the amount accumulated in the ocean (stock) will fall only when the amount entering the ocean (inflow) is smaller than the amount cleaned up (outflow) [5]. Marine plastic waste does not disappear [13]. Whatever innovative solutions we invent [14], the conservation law holds. Marine plastic waste also involves delays [2,15]. This adds further challenges, as plastics become smaller (i.e., conversion into micro- and nano-plastics) and become harder to clean up [15]. Thus, wait-and-see policies have irreversible consequences.
Experiments with highly educated adults regarding the mental models of climate change revealed a widespread misunderstanding of the fundamental stock and flow relationships [12]. This suggests that people may have a similar misunderstanding of marine plastic waste, and, to date, there has been no study conducted in this regard. Thus, it is critical to correct our mental models and have an improved understanding to move towards solving marine plastic waste, otherwise, wrong mental models will incorrectly address these issues [11].
The purpose of this study was to uncover children’s mental models to understand marine plastic waste, with a focus on its systemic characteristics (i.e., stock and flow relationships and delays). The goal was to address whether children can recognize the stock and flow relationships and the importance of delays in the marine plastic waste issue. There are two reasons for targeting children. First, as it requires decades to solve marine plastic waste issues, it is essential to educate children early to ensure they understand the key issues. For example, the Osaka Blue Ocean Vision shared at the G20 Osaka Summit its goal to reduce additional pollution by marine plastic waste to zero by 2050 [16]. Second, it is important to implement systems thinking education as early as primary school [17,18,19,20]. Some scholars argue that children are natural systems thinkers who have the innate intelligence to understand systems behaviors [19,21]. In contrast, there is a concern that formal education suppresses their natural intelligence by fragmenting and compartmentalizing phenomena [21,22].
The rest of the paper is organized as follows. In the second section, I explain the participants of the study and the questionnaire surveys to test children’s systemic understanding of marine plastic pollution. The third section reports the survey results. The last section discusses the results to elicit implications for improving children’s systemic understanding and concludes.
2. Material and Methods
2.1. Participants
Participants were children between the fourth grade and high school (9–18 years old), following previous studies and educations. Draper [18] proposed a sequence for developing systems thinking for the grade 4−12 curriculum. Ben-Zvi-Assaraf and Orion [17] chose the fourth grade, as they had acquired sufficient reading skills to participate in the experiment. Fisher [19] even suggested to include children as young as five years old.
Participants were recruited during the workshops and poster sessions given at “EcoPro2019: Towards A Sustainable Society”, an exhibition held in Tokyo, 5–7 December 2019. It was one of the biggest exhibits for sustainability, with about 550 exhibits, 1350 booths, and 160,000 visitors. Visitors included all ages, from children to adults. There were 34 and 73 participants, ranging from the fourth grade to high school, at the workshops and poster sessions, respectively.
2.2. Questionnaire Surveys
Two sets of questionnaire surveys were established for two groups (see Supplementary Information (SI)), namely: one for those participating in the workshops and the other for those attending the poster sessions. The former was to test children’s understanding of stock–flow relationships regarding marine plastic waste via five questions closed and open-ended questions and drawing curves. The latter was to test their understanding of delays, or irreversible effects of delaying taking action, via one closed and one open-ended question. The design of the surveys was drawn from a Sterman and Sweeney [12] study on college students’ systemic understanding of climate change. However, as their study was targeted at college students, questions were simplified by reducing the number of items and using easier wording for children. Although it was desirable to conduct both questionnaire sets with one sample group, a pre-test indicated that there were too many questions to ask during a 30-min workshop. Therefore, the questions were separated into the following two sets: one was given to participants at the workshop held six times in total, and the other was given to participants at the poster session held throughout the exhibition. During the workshops, a research scientist or assistant was present to explain the poster.
The answers were divided into the following two groups by school year: elementary school vs. middle- and high-school students. The purpose was to explore if their answers differed by the educational level. As the sample sizes were small, Fisher’s exact test was applied to test the independence of the samples [21].
2.2.1. Questionnaire Set 1: Understanding of Stock–Flow Relationships
Two quizzes were created to test the children’s understanding of stock–flow relationships with the different degrees of difficulty, namely: one was a multiple-choice question with a focus on inflow and stock, the other required participants to draw curves for inflow (marine plastic waste entering the ocean) and outflow (cleanup) linked to stock accumulation.
During the workshops, participants were asked to formulate solutions to address marine plastic waste. In addition to direct solutions, such as avoiding mismanaged plastic waste and cleaning up the waste by and in the ocean, participants proposed solutions regarding reducing the plastic waste entering into the ocean, including using less plastic and using alternatives such as reusable bottles and bags. Some mentioned that society must change its behavior by changing our knowledge of the problem. However, nobody mentioned mass balance, that is, in order to reduce the amount of marine plastic waste, the cleanup every year must exceed the amount entering the ocean. To give them a cue to think about mass balance, it was pointed out that their proposing solutions can be categorized into two types, namely: reducing the amount of plastic waste into the ocean and increasing the amount of clean up.
The workshops provided participants with basic information about marine plastic waste, including the amount of marine plastic waste and negative social-ecological impacts. Following a similar study about climate change [12], the stock of the waste, the waste entering into the ocean every year, and its removal were explicitly described. For example, the participants were asked to raise solutions to marine plastic waste and to categorize them into two types, namely: reducing the waste entering and removing the waste already in the ocean. This provided cues prompting the participants to notice the stock–flow relationships.
The first quiz tested whether the participants properly understood the relationship between the stock and inflow. The goal set by the “Osaka Blue Ocean Vision”, decided upon at the G20 Osaka Summit (June 2019), was adopted, which is to reduce the amount of plastic flowing into oceans to zero by 2050. Participants were asked, “What do you think will be the amount of plastic trash accumulating in oceans by 2050 compared to the existing amounts based on this initiative?” and were instructed to circle one of the following options:
- (1)
- It will drop to zero.
- (2)
- It will decrease; however, it will not drop to zero.
- (3)
- It will increase.
To prompt them to ignore outflow (cleanup), participants were instructed, “Assume that no new initiatives will be taken besides reducing the amount flowing into oceans”. The current cleanup rate is actually considered to be relatively negligible [4,5]. The participants were asked to write the reason for their choice to check if they chose options 1 or 2 by reflecting the outflow.
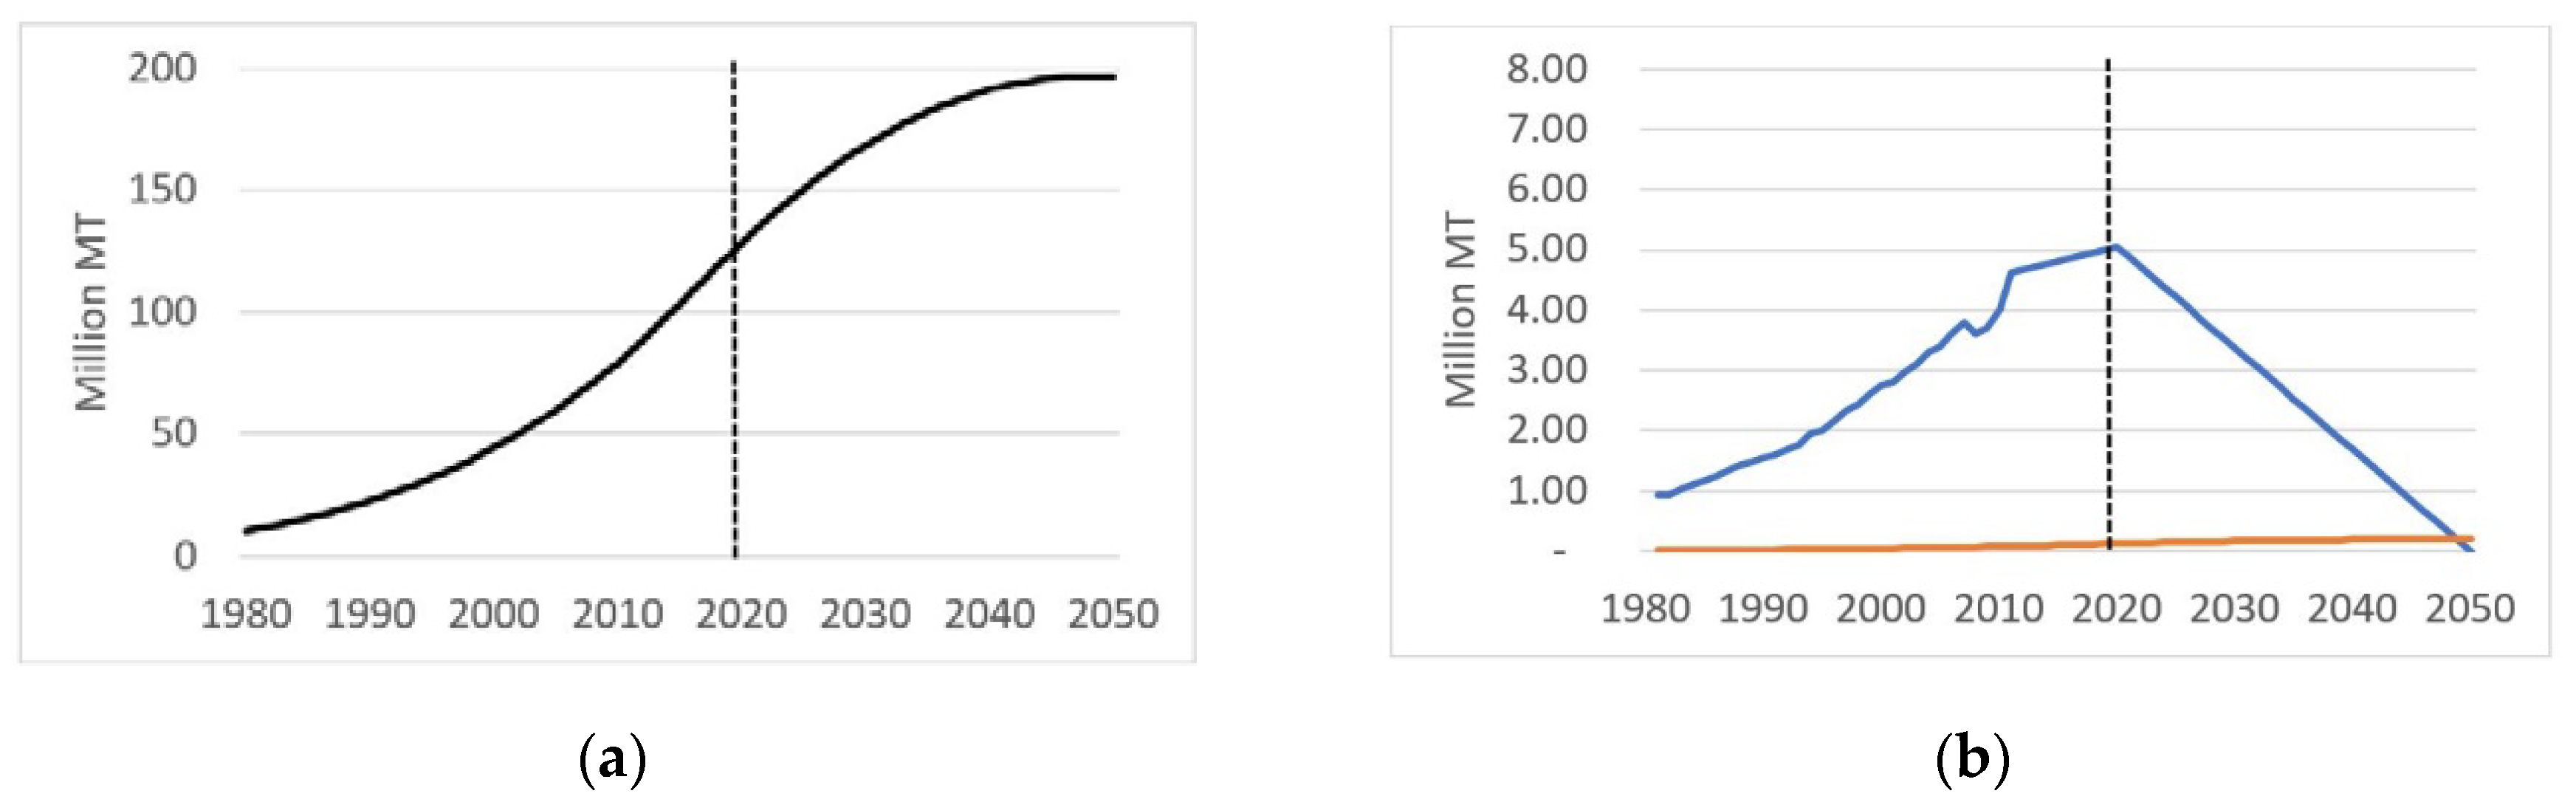
Figure 1a shows the estimated stock of marine plastic waste for the Osaka Blue Ocean Vision scenario. Figure 1b shows the amounts of marine plastic waste entering and cleaned up from the ocean. To draw Figure 1a,b and Figure 2a,b, the estimate method proposed by Cordier and Uehara [5] was adopted, with their estimates of accumulation up to 2020 (128.64 MMT in 2020; see SI for the raw data).
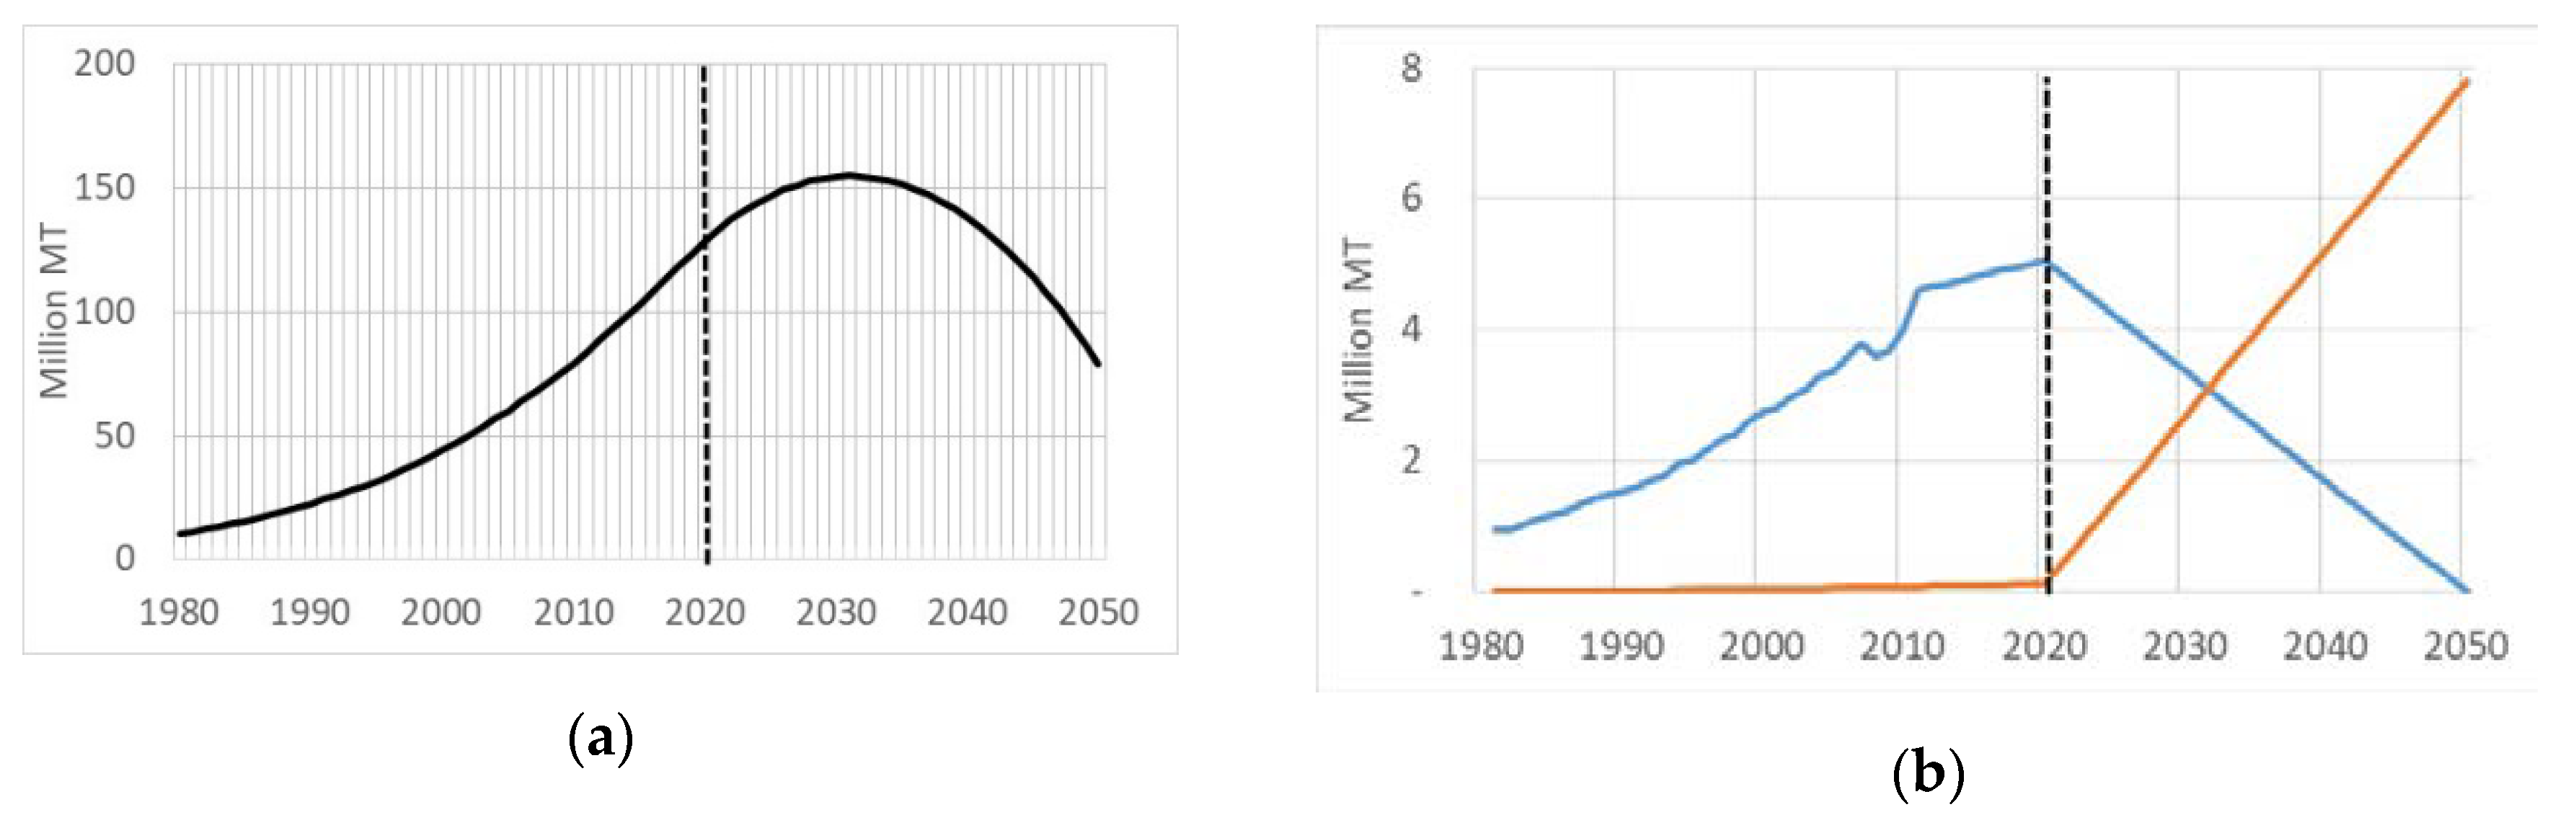
The second questionnaire tested if the participants could draw curves for the entering and cleanup of plastic waste, so as to realize a given scenario of the stock of marine plastic waste (Figure 2a). The scenario was designed to have a point where the stock decreased. That is, there was a point where outflow (cleanup) outweighed inflow (entering). After 2020, the amount of plastic accumulated in 2050 was set below the 2020 level to the 2010 level (79.24 million tons). The participants were asked to draw curves for entering and cleaning up after the vertical dashed line (i.e., after 2020). Figure 2b shows an example of this. The dynamics can be understood using a bathtub analogy, in which the water level represents the stock of marine plastic waste (Figure 3). Water in a bathtub increases only when the water flowing from the faucet exceeds draining. The water in the bathtub remains the same when they are at an equal amount per time or both stop. As what is critical is the net inflow (i.e., inflow–outflow), there could be infinite combinations to realize (Figure 2a). However, whatever the combinations, outflow (removal, R) must outweigh inflow (entering, E) when the stock starts to decrease (i.e., R > E).
The participants’ understanding of these issues were tested using pattern matching and the violation of mass balance principles [12]. People tended to match the path of flows with the dynamics of the stock, rather than to think about the stock–flow relationships [12]; however, a declining inflow does not lead to a declining stock. Rather, inflows always contribute to stock accumulation.
To test pattern matching, the ability of the respondents to match the inflow curve with the stock accumulation was examined. Students tended to focus on the inflow or to assume that the inflow and outflow were equal [22]. The purpose of this test was to check if their drawing of inflow curves were influenced by stock accumulation. As this is a hand drawing examination, the criterion for judging the pattern matching were relaxed. An inflow curve that matches the pattern if the inflow rate of entering (E) at the time year 2020 < t < 2050 satisfies the following conditions.
E2020 < E2020+t and E2020 > E2050,
Because pattern matching does not necessarily indicate a violation of mass balance principles, violations were directly tested [12]. Because the exams were handwritten, qualitative consistency was favored over numerical accuracy. To summarize, it was assumed that a respondent used stock–flow reasoning if removal (R) exceedd entering (E) when the stock started to decline (Figure 2a,b). The inflection point was the year 2031; however, following Sterman and Sweeney [12], a fortiori procedure was adopted, and allowed a tolerance (i.e., error), such that
R exceeds E in the year 2031 ± 3 years,
The fortiori procedure assumes that participants whose drawings of crossing E and R differed by up to three years nevertheless correctly understand that they cross when the stock starts to decline.
2.2.2. Questionnaire Set 2: Understanding of Delays and Irreversibility
The timing of removing marine plastic waste matters, as they can break down into microplastics over time, making them hard to collect. In addition, the longer plastic waste is left in the ocean, the more susceptible animals are to ingest it. Poster session attendees were asked to answer the pros and cons of two different timings of waste collection. The following question was asked with figures:
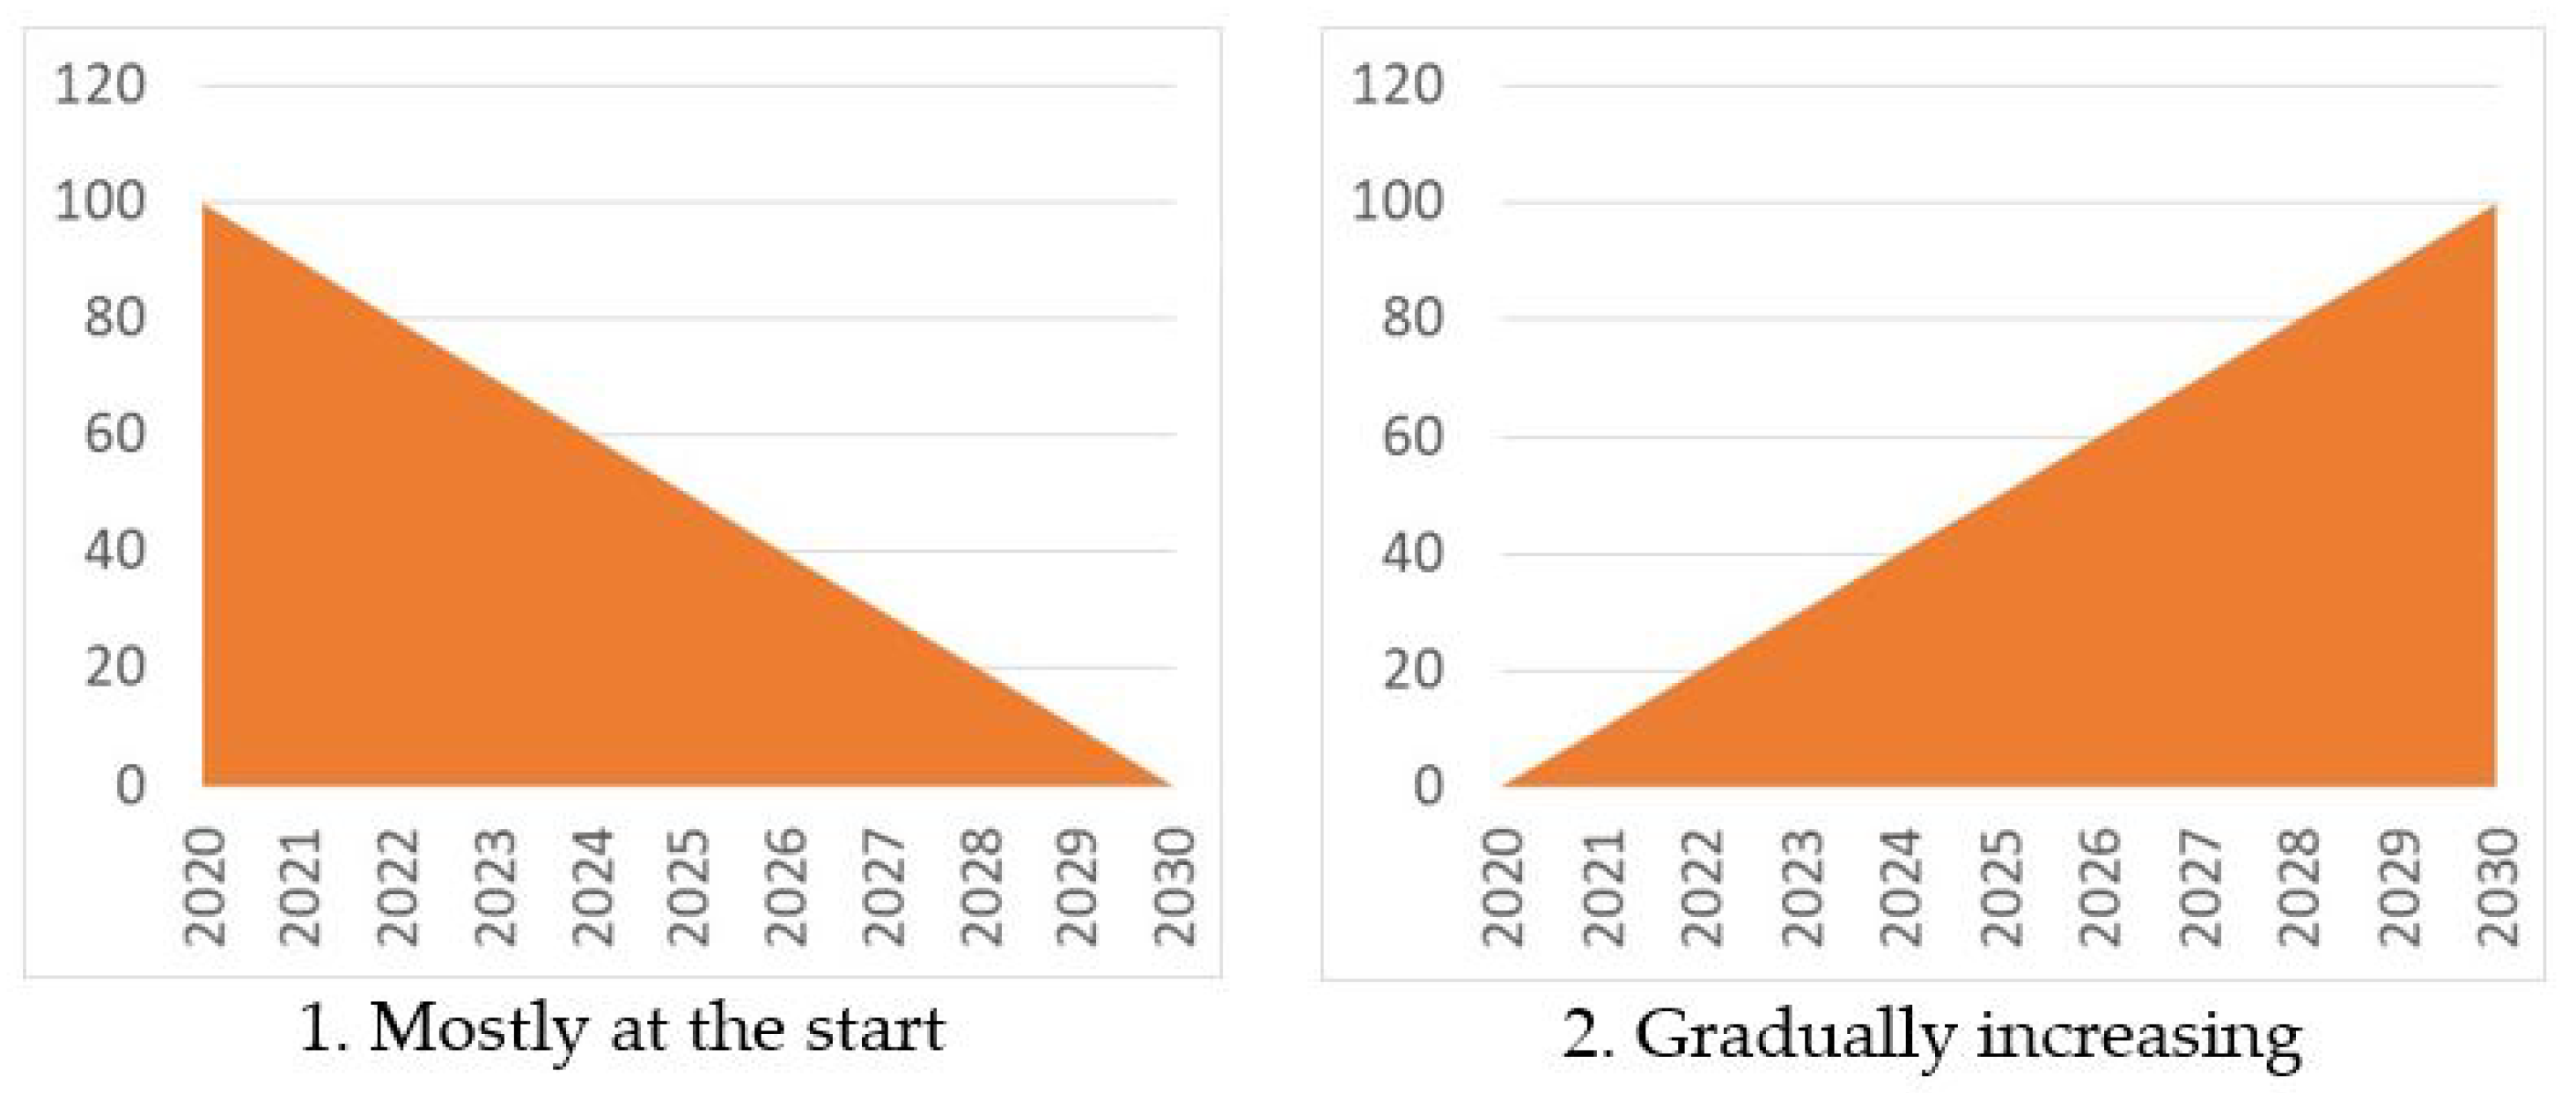
Q2. There are several timing issues even when collecting the same amount of waste at the end. Examples include the following:
Please describe the pros and cons of each. Please see Figure 4.
Before asking them to fill out the pros and cons, the marine plastic waste problem, including microplastics, was explained. If they understood the seriousness of procrastination or the adoption of a wait-and-see policy, it was expected that they would write about irreversible effects as a con for “2. Gradually increasing”.
3. Results
There were 34 participants from the fourth grade to high school. The rest were college students and adults who were not the target of this study. Fifteen (44%) were elementary school students from fourth to sixth grade, and 19 (56%) were middle school or high school students. Approximately 40% of elementary school students and 58% of middle- and high-school students knew that the amount of plastic trash accumulating in oceans is a problem. This may not, however, represent the population, because some of them mentioned that they came to the exhibition as part of their school program studying environmental issues. Thus, the participants may be more knowledgeable than the average children. At the poster sessions, 73 children from the fourth grade to high school answered the questionnaire. Thirty-nine (53%) were elementary school students from the fourth to sixth grade, and 34 (47%) were middle school or high school students.
3.1. The Osaka Blue Ocean Vision
Approximately 76.5% of study participants misunderstood the results (Table 1). As long as the cleanup rate increases markedly, the Vision does not decrease the amount of marine plastic waste, but sees it increase compared with the current rate (Figure 1a). There was no significant difference between elementary school students and middle- or high-school students regarding their answers (Fisher’s exact test, p = 1.000).
The decision to choose option 2 revealed confusion among participants regarding the questionnaire. First, some participants did not seem to understand the question. For example, an elementary school student explained, “Because we cannot clean all microplastics” by focusing on cleaning up rather than the target of Vision. Second, some seemed to be confused about the distinction between stock and flows. A middle school student explained, “Even if we reduce the amount entering, marine plastic waste does not disappear”. This indicated that the participant did not differentiate a stock from the flow. While some participants who chose option 3 addressed the correct reason based on the stock–flow relationship, not everyone made this choice for the correct reasons. An elementary school student explained, “Because I think the amount of our using plastics will increase”, ignoring what Vision proposed.
3.2. Pattern Matching and Violation of Mass Balance Principles
Table 2 shows the pattern matching of the curves for the entering (inflow) and the marine plastic waste (stock). Approximately 70% of participants drew the entering in the same manner as the marine plastic waste (Equation (1)). There was no significant difference between age groups (Fisher’s exact test, p = 0.718).
Table 3 shows that there was only one participant in each age group who drew an inflow curve correctly, without violating the mass balance principle (condition (2), Figure 2b). There was no significant difference between age groups (Fisher’s exact test, p = 1.000).
The reasons for drawing curves that violated the mass balance principles indicated various degrees of understanding. An elementary school student did not pay attention to the balance, stating, “I thought that it is sufficient to stop emitting plastic waste into the ocean and clean the waste in the ocean”. Another elementary school student related the inflow to the outflow but was not clear about their relationship, saying, “Because the plastic waste increases every year, the amount to clean up should also be increased”. A middle school student misunderstood the distinction between the net flow (i.e., inflow–outflow) and inflow, stating, “As a prerequisite, we have to realize zero emissions”. As long as the net flow is negative, the marine plastic waste accumulated in the ocean decreases.
3.3. Delays and Irreversibility
Table 4 shows that approximately 15% of participants pointed out issues related to delays and irreversibility when adopting the gradually increasing scenario (Figure 4). There was no significant difference between elementary school students and middle- and high-school students (Fisher’s exact test, p = 0.761).
Ten participants pointed out that if we wait, marine plastic waste can be converted to microplastics, increasing the difficulty of cleanup efforts. Four participants were concerned about ecological impacts. For example, one middle school student wrote: “Fish may eat the plastic waste during it has been accumulated in the ocean”.
4. Discussion and Conclusions
This preliminary survey was intended to uncover children’s mental models of marine plastic waste with a focus on its systemic characteristics (i.e., stock and flow relationships and delays). While some scholars assert that people are natural system thinkers [19,21], this survey is the first to explore whether young generations can see marine plastic waste as a systemic issue. The survey targeted participants in an event for sustainability, from the fourth grade to high school.
The preliminary survey results revealed that younger generations have a limited systemic understanding of marine plastic waste. The first part of the survey tested if the participants understood the relationship between stock and inflow using the Osaka Blue Ocean Vision scenario. Approximately 76.5% of the participants violated the mass balance principles by choosing option 2, “It will decrease; however, it will not drop to zero” (Table 1). This indicates that their mental models mixed the notion of stock and inflow; for example, they might think that stock changes proportional to inflow. The results of the second part of the survey, asking for an accurate drawing of inflow (entering) and outflow (cleanup) curves realizing a marine plastic waste scenario up to 2050 (Figure 2a), also showed their limited systemic understanding. This was more challenging than the first part of the survey, as it asked how inflow and outflow relate to realizing the scenario. Approximately 70.6% of participants matched the pattern of inflow with the stock (Table 2), indicating that they applied pattern matching rather than stock–flow relationships [12]. Almost all participants (94.1%) violated the mass balance principles (Table 3). Similar to the first part of the survey, the results showed that their systemic understanding did not seem to improve with more current education. The survey on delay also revealed their limited understanding of a systemic aspect of the issue, as 16.4% of participants pointed out issues caused by procrastination when tackling marine plastic waste (Table 4). Similar to the previous tests, understanding this concept did not seem to improve with more current education. This indicates that a wait-and-see policy may gain support based on their incorrect mental models and understanding, and such a policy may have irreversible impacts (e.g., ecological impacts and difficulty when cleaning microplastics).
Because marine plastic waste is a systemic issue, it is critical to improve mental models in younger generations in order to enable systemic understanding. The survey results indicate that while improvement is needed in their systemic understanding, this improvement in education is feasible. Furthermore, early education before the current education compartmentalizes phenomena and curbs children’s innate understanding of systems [22]. This indicates the importance of early education of systems thinking. In the United States, there is an emphasis on systems learning, such as the Science for All Americans and the Next Generation Science Standards [23], and K-12 teachers have integrated systems thinking over several decades [19]. In Japan, however, there seems to be no such emphasis in the guide for elementary and secondary education by the government [24]. The science education curriculum in Japan covers the following four major themes: energy, particles, life, and Earth. While the learning objective is to acquire skills to solve problems with natural phenomena, the guideline does not explicitly encourage learning systems thinking skills [24].
Previous studies and experience show that children can learn about systems [17,19,25,26]. Furthermore, several teaching guidelines for educating children about systems have been presented [17,18,19,27]. For example, Hokayem et al. [26] found that first through eleventh grade students had difficulty using feedback loop reasoning, a key concept of systems thinking. Shepardson et al. [28] examined seventh grade students and found that they had limited understanding of the multiple levels of interactions among the components of the climate system. Koski and de Vries [29], studying 8–10 years old students, found that they had difficulties in setting boundaries to systems. Benz-Zvi-Assaraf and Orion [17] studied how fourth grade students could learn system thinking skills, using the hydrological Earth system as a case, and revealed that they made great progress with their systems thinking skills. Benz-Zvi-Assaraf and Orion [30] found that children’s learning progress depends on their individual cognitive abilities and on the level of involvement in the knowledge integration activities. Furthermore, several teaching guidelines for educating children about systems have been presented [17,18,19,31]. Given the lack of systems thinking education in Japan, the results of this study suggest an adoption of such a teaching guideline to cultivate systems thinking skills in Japanese children in order to better understand systemic issues, such as marine plastic waste. In particular, this would be beneficial to science education courses within Japanese school systems. Another possibility is to adopt systems thinking in “a period of integrated studies”, whose purpose is to cultivate problem-solving skills and ability via integrated studies in children [32].
This survey was the first to explore whether children can recognize marine plastic waste as a systemic issue. However, there are several limitations in this study. First, the small sample size restricted this study to conduct a limited statistical analysis. With a larger sample size, we could further explore, for example, what factors influence children’s systemic understanding of marine plastic waste by using more sophisticated statistical analysis (e.g., logit model). Second, the study is context-specific (i.e., Japan), making it difficult to elicit general implications. Further studies in other countries could provide more context. Third, because of the time constraint, this study did not compare a before and after scenario, which could explain a systemic understanding of marine plastic waste, or compare the two groups with and without the explanation. To elicit policy implications, it is critical to see how systems thinking education changes children’s recognition.
Supplementary Materials
The following are available online at https://www.mdpi.com/2071-1050/12/7/2586/s1.
Funding
This work was supported by JSPS KAKENHI Grant Number 19KK0271.
Conflicts of Interest
The author declares no conflict of interest.
References
- PlasticsEurope. Plastics-The Facts 2013: An Analysis of European Latest Plastics Production, Demand and Waste Data; PlasticsEurope: Brussels, Belgium, 2013. [Google Scholar]
- Geyer, R.; Jambeck, J.R.; Law, K.L. Production, use, and fate of all plastics ever made. Sci. Adv. 2017, 3, e1700782. [Google Scholar] [CrossRef] [PubMed] [Green Version]
- PlasticsEurope. Plastics-The Facts 2019: An Analysis of European Plastics Production, Demand and Waste Data; PlasticsEurope: Brussels, Belgium, 2019. [Google Scholar]
- Jambeck, J.R.; Geyer, R.; Wilcox, C.; Siegler, T.R.; Perryman, M.; Andrady, A.; Narayan, R.; Law, K.L. Plastic waste inputs from land into the ocean. Science 2015, 347, 768–771. [Google Scholar] [CrossRef] [PubMed]
- Cordier, M.; Uehara, T. How much innovation is needed to protect the ocean from plastic contamination? Sci. Total Environ. 2019, 670, 789–799. [Google Scholar] [CrossRef] [PubMed]
- Zettler, E.R.; Mincer, T.J.; Amaral-Zettler, L.A. Life in the “Plastisphere”: Microbial Communities on Plastic Marine Debris. Environ. Sci. Technol. 2013, 47, 7137–7146. [Google Scholar] [CrossRef] [PubMed]
- Beaumont, N.J.; Aanesen, M.; Austen, M.C.; Börger, T.; Clark, J.R.; Cole, M.; Hooper, T.; Lindeque, P.K.; Pascoe, C.; Wyles, K.J. Global ecological, social and economic impacts of marine plastic. Mar. Pollut. Bull. 2019, 142, 189–195. [Google Scholar] [CrossRef]
- Vethaak, A.D.; Leslie, H.A. Plastic Debris Is a Human Health Issue. Environ. Sci. Technol. 2016, 50, 6825–6826. [Google Scholar] [CrossRef] [Green Version]
- Latinopoulos, D.; Mentis, C.; Bithas, K. The impact of a public information campaign on preferences for marine environmental protection. The case of plastic waste. Mar. Pollut. Bull. 2018, 131, 151–162. [Google Scholar] [CrossRef]
- UNEP. Valuing Plastics: The Business Case for Measuring, Managing and Disclosing Plastic Use in the Consumer Goods Industry; UNEP: Nairobi, Kenya, 2014. [Google Scholar]
- Anderies, J.M.; Folke, C.; Walker, B.; Ostrom, E. Aligning Key Concepts for Global Change Policy: Robustness, Resilience, and Sustainability. Ecol. Soc. 2013, 18, 16. [Google Scholar] [CrossRef] [Green Version]
- Sterman, J.D.; Sweeney, L.B. Understanding public complacency about climate change: Adults’ mental models of climate change violate conservation of matter. Clim. Chang. 2007, 80, 213–238. [Google Scholar] [CrossRef]
- Barnes, D.K.A.; Galgani, F.; Thompson, R.C.; Barlaz, M. Accumulation and fragmentation of plastic debris in global environments. Philos. Trans. R. Soc. B Biol. Sci. 2009, 364, 1985–1998. [Google Scholar] [CrossRef] [Green Version]
- Foundation, E.M.; MacArthur, D.E.; Waughray, D.; Stuchtey, M.R. The New Plastics Economy, Rethinking the Future of Plastics. In Proceedings of the World Economic Forum, Davos Klosters, Switzerland, 20–23 January 2016; p. 120. [Google Scholar]
- Lebreton, L.; Egger, M.; Slat, B. A global mass budget for positively buoyant macroplastic debris in the ocean. Sci. Rep. 2019, 9, 1–10. [Google Scholar] [CrossRef] [PubMed] [Green Version]
- Ministry of Foreign Affairs of Japan Japan’s “MARINE Initiative” Toward Realization of the Osaka Blue Ocean Vision. Available online: https://www.mofa.go.jp/ic/ge/page25e_000317.html (accessed on 23 January 2020).
- Ben-Zvi-Assaraf, O.; Orion, N. System thinking skills at the elementary school level. J. Res. Sci. Teach. 2010, 47, 540–563. [Google Scholar]
- Draper, F. A proposed sequence for developing systems thinking in a grades 4–12 curriculum. Syst. Dyn. Rev. 1993, 9, 207–214. [Google Scholar] [CrossRef]
- Fisher, D.M. “Everybody thinking differently”: K–12 is a leverage point. Syst. Dyn. Rev. 2011, 27, 394–411. [Google Scholar] [CrossRef]
- Forrester, J.W. Learning through system dynamics as preparation for the 21st century. Syst. Dyn. Rev. 2016, 32, 187–203. [Google Scholar] [CrossRef]
- Field, A.; Miles, J.; Field, Z. Discovering Statistics Using R (Kindle Edi); SAGE Publications: Thousand Oaks, CA, USA, 2012. [Google Scholar]
- Sweeney, L.B. Learning to Connect the Dots: Developing Children’s Systems Literacy. Solutions 2012, 5, 55–62. [Google Scholar]
- Yoon, S.A.; Goh, S.E.; Park, M. Teaching and Learning about Complex Systems in K–12 Science Education: A Review of Empirical Studies 1995–2015. Rev. Educ. Res. 2018, 88, 285–325. [Google Scholar] [CrossRef] [Green Version]
- MEXT. Guide for Elementary and Secondary Education; MEXT: Tokyo, Japan, 2017.
- Sweeney, L.B.; Sterman, J.D. Thinking about systems: Student and teacher conceptions of natural and social systems. Syst. Dyn. Rev. J. Syst. Dyn. Soc. 2007, 23, 285–311. [Google Scholar] [CrossRef]
- Ben-Zvi-Assaraf, O.; Orion, N. Four case studies, six years later: Developing system thinking skills in junior high school and sustaining them over time. J. Res. Sci. Teach. 2010, 47, 1253–1280. [Google Scholar] [CrossRef]
- Hokayem, H.; Ma, J.; Jin, H. A Learning Progression for Feedback Loop Reasoning at Lower Elementary Level. J. Biol. Educ. 2015, 49, 246–260. [Google Scholar] [CrossRef]
- Shepardson, D.P.; Roychoudhury, A.; Hirsch, A.; Niyogi, D.; Top, S.M. When the atmosphere warms it rains and ice melts: Seventh grade students’ conceptions of a climate system. Environ. Educ. Res. 2014, 20, 333–353. [Google Scholar] [CrossRef]
- Koski, M.I.; De Vries, M. An exploratory study on how primary pupils approach systems. Int. J. Technol. Des. Educ. 2013, 23, 835–848. [Google Scholar] [CrossRef]
- Ben-Zvi-Assaraf, O.B.; Orion, N. Development of system thinking skills in the context of earth system education. J. Res. Sci. Teach. Off. J. Natl. Assoc. Res. Sci. Teach. 2005, 42, 518–560. [Google Scholar]
- Hokayem, H.; Gotwals, A.W. Early elementary students’ understanding of complex ecosystems: A learning progression approach. J. Res. Sci. Teach. 2016, 53, 1524–1545. [Google Scholar] [CrossRef]
- MEXT. The Period for Integrated Studies. 2009. Available online: https://www.mext.go.jp/a_menu/shotou/sougou/main14_a2.htm (accessed on 25 March 2020).
Figure 1.
(a): The stock of marine plastic waste for the Osaka Blue Ocean Vision scenario. (b): The amount of marine plastic waste entering (blue line) and removed (orange line) from the ocean.
Figure 1.
(a): The stock of marine plastic waste for the Osaka Blue Ocean Vision scenario. (b): The amount of marine plastic waste entering (blue line) and removed (orange line) from the ocean.

Figure 2.
(a): The stock of marine plastic waste where the stock will decrease. (b): An example of the inflow (blue line) and outflow (orange line) to realize the scenario in Figure 2a. The participants were asked to draw curves after the vertical dashed line.
Figure 2.
(a): The stock of marine plastic waste where the stock will decrease. (b): An example of the inflow (blue line) and outflow (orange line) to realize the scenario in Figure 2a. The participants were asked to draw curves after the vertical dashed line.

Figure 3.
A bathtub analogy. The amount of plastic waste in the bathtub depends on the relative strength of inflow (top-left) and outflow (bottom-right). The picture was prepared by Junya Ueda.
Figure 3.
A bathtub analogy. The amount of plastic waste in the bathtub depends on the relative strength of inflow (top-left) and outflow (bottom-right). The picture was prepared by Junya Ueda.

Figure 4.
Collection methods with the same amount of waste at the end.


Table 1.
The participants’ predictions of the Osaka Blue Ocean Vision.
| 1. It will Drop to Zero | 2. It will Decrease; However, It will not Drop to Zero | 3. It will Increase | Total | |
|---|---|---|---|---|
| Elementary school | 0 0.0% | 11 73.3% | 4 26.7% | 15 100.0% |
| Middle- and high-school | 0 0.0% | 15 78.9% | 4 21.1% | 19 100.0% |
| Total | 0 0.0% | 26 76.5% | 8 23.5% | 34 100.0% |
Table 2.
Pattern matching of the entering and marine plastic waste.
| No | Yes | Total | |
|---|---|---|---|
| Elementary school | 5 33.3% | 10 66.7% | 15 100.0% |
| Middle- and high-school | 5 26.3% | 14 73.7% | 19 100.0% |
| Total | 10 29.4% | 24 70.6% | 34 100.0% |
Table 3.
Violation of mass balance principles.
| No | Yes | Total | |
|---|---|---|---|
| Elementary school | 1 6.7% | 14 93.3% | 15 100.0% |
| Middle- and high-school | 1 5.3% | 18 94.7% | 19 100.0% |
| Total | 2 5.9% | 32 94.1% | 34 100.0% |
Table 4.
The number of participants who pointed out the delay and irreversible issue when we choose a gradually increasing scenario (Figure 4).
Table 4.
The number of participants who pointed out the delay and irreversible issue when we choose a gradually increasing scenario (Figure 4).
| No | Yes | Total | |
|---|---|---|---|
| Elementary school | 32 82.1% | 7 17.9% | 39 100.0% |
| Middle- and high-school | 29 85.3% | 5 14.7% | 34 100.0% |
| Total | 61 83.6% | 12 16.4% | 73 100.0% |
© 2020 by the author. Licensee MDPI, Basel, Switzerland. This article is an open access article distributed under the terms and conditions of the Creative Commons Attribution (CC BY) license (http://creativecommons.org/licenses/by/4.0/).
Share and Cite
MDPI and ACS Style
Uehara, T. Can Young Generations Recognize Marine Plastic Waste as a Systemic Issue? Sustainability 2020, 12, 2586. https://doi.org/10.3390/su12072586
AMA Style
Uehara T. Can Young Generations Recognize Marine Plastic Waste as a Systemic Issue? Sustainability. 2020; 12(7):2586. https://doi.org/10.3390/su12072586
Chicago/Turabian StyleUehara, Takuro. 2020. "Can Young Generations Recognize Marine Plastic Waste as a Systemic Issue?" Sustainability 12, no. 7: 2586. https://doi.org/10.3390/su12072586
Note that from the first issue of 2016, this journal uses article numbers instead of page numbers. See further details here.