Suitability Evaluation and Layout Optimization of the Spatial Distribution of Rural Residential Areas

1
College of Environment and Planning, Henan University, Kaifeng 475004, China
2
Key Laboratory of Geospatial Technology for Middle and Lower Yellow River Regions (Henan University), Ministry of Education, Kaifeng 475004, China
3
Institute of Geographic Sciences and Natural Resources Research, CAS, Beijing 100101, China
4
Institute of Urban Big Data, Henan University, Kaifeng 475004, China
*
Author to whom correspondence should be addressed.
Sustainability 2020, 12(6), 2409; https://doi.org/10.3390/su12062409
Submission received: 24 February 2020
/
Revised: 16 March 2020
/
Accepted: 17 March 2020
/
Published: 19 March 2020
Abstract
:A reasonable layout optimization strategy of rural residential areas can improve the quality of life of rural residents and promote rural revitalization. Evaluating the suitability of rural residential areas is the basis of layout optimization. Based on 1:100,000 land cover data and a digital elevation model (30 m) for the Henan Province, China, we used the minimum cumulative resistance model to evaluate the spatial distribution suitability of rural settlements in the Zhengzhou administrative area (abbreviated: Zhengzhou). Then, we used a weighted Voronoi diagram to determine the scope of influence of central villages and determined the direction of relocation for the “combined migration” rural residential areas. The study results support the following conclusions: (1) the comprehensive resistance value of rural residential areas in the Northeastern part of Zhengzhou is low and the suitability is high. However, the comprehensive resistance value of the Southwestern part is high and the suitability is low. (2) The study area can be divided into highly suitable areas, suitable areas, generally suitable areas, unsuitable areas, and extremely unsuitable areas. Unsuitable areas and extremely unsuitable areas accounted for 33.66% of the total area and included 662 rural residential areas. (3) The rural residential areas were divided into four types of optimization: urbanization, key development, controlled development, and combined migration. Based on an analysis of the characteristics of each type of rural residential area, we proposed corresponding optimization strategies. The results remedy the lack of layout optimization strategies for large-scale rural residential areas and can provide support for the optimization of the layout of rural residential areas in Zhengzhou. Furthermore, the research techniques may apply to other regions.
1. Introduction
Rural residential land is an essential part of the rural land system that bears the primary function of supporting agricultural production and farmers’ residences. Its layout is not only the external expression of various activities in rural areas, but also stimulates or restricts the development of multiple undertakings in rural areas [1,2,3]. For a long time, due to the lack of systematic planning guidance and supervision and the influence of the traditional concept of free site-choosing settlement, rural residential areas in China have exhibited problems, such as scattered distribution and low land use efficiency in the process of construction and development. With the development of the social economy and urbanization in China, the rural population is continuously migrating to cities, and “village diseases,” such as “hollow villages” and idle houses, are increasingly prominent [4,5]. The allocation of rural land resources, especially the utilization of residential areas, has become the focus of the government and academia. How to promote the rational and orderly utilization of residential areas and reduce the waste of rural land resources and project investment have become important issues in the implementation of rural revitalization strategies in the new era [6,7,8].
Evaluation of the suitability of rural residential areas is a crucial initial step to guide the layout optimization of rural residential areas. This analysis will also help enrich and improve the evaluation methods and improve the scientific rationality of the evaluation results, which will inform rural land use planning. In recent years, scholarly research on rural residential areas has mainly focused on: (1) spatial distribution characteristics and influencing factors [9,10,11,12,13,14]. Mendras, a French rural sociologist, pointed out that economic and social development, government policy making, family economic income change, and population growth had a significant impact on the layout of rural residential areas when he summarized the rural Renaissance in the 1980s. Zhong and Le studied rural residential areas in mountainous areas and plain areas, respectively, and the results showed that the layout of rural residential areas was characterized by large aggregation and small dispersion, and was influenced by topography, landform, road, and river. (2) Spatial layout evolution and driving mechanisms [15,16,17,18,19]. Hai et al. analyzed the evolution characteristics of the scale structure, spatial distribution, and morphological structure of rural residential areas in Gongyi, Henan Province, from 1990 to 2010, and explored the influence of terrain factors, location factors, and social and economic factors on the development and change of rural residential areas. Long et al. analyzed the influence of social economy, land use change, government policy, and other factors on the residential transformation of rural land in China. (3) Suitability evaluation. Xu et al. [20,21,22,23] introduced a random forest, a hierarchical fuzzy evaluation model, a niche suitability model, and other methods to study the suitability of residential layout. Hong et al. [24,25] analyzed the suitability of rural residential land from an ecological perspective. (4) Layout optimization. Scholars have proposed a variety of layout optimization strategies from different perspectives, including optimization by grade or type [26,27,28,29], function-led optimization [30,31,32], and farmer-led optimization [33,34,35,36]. Using the weighted Voronoi diagram, Zou et al. divided the rural residential areas in the research area into five grades: key town villages, priority villages, conditional extension villages, restricted extension villages, and demolition combined villages. Nath et al. proposed that with the improvement of the social and economic development level, the layout, function, and spatial structure characteristics of rural residential areas have changed, and the functional transformation of rural residential areas has been studied from the perspective of “functional structure”. Cecilia et al. pointed out the defects of rural community planning in the study of Jalisco State in Mexico and the influence of farmers’ participation on the spatial layout of rural settlements, thus, providing new ideas for the optimization of the layout of rural residential areas. In the study of rural residential areas in the Pinggu District, Qu et al. put forward four renovation modes with the farmers’ will as the leading role, which reflected the importance of farmers’ participation.
From the perspective of the research scale, the scale of scholarly research on rural residential areas is mostly concentrated below the county scale, and there is a lack of research on the larger scale of rural residential areas. In terms of suitability evaluation methods, random forest and the hierarchical fuzzy evaluation models basically extend the “thousand layers cake” analysis method of McHarg, which superimposes the factors of landscape unit, emphasizes the vertical process of the land landscape unit, and ignores the horizontal process of a landscape change. Therefore, the objective of this study was to apply the minimum cumulative resistance model to Zhengzhou, China (as an example) to evaluate the spatial distribution suitability of rural residential areas from the perspective of landscape ecology, which can remedy the above two deficiencies. On this basis, four types of rural residential area optimization were determined, and corresponding optimization strategies were proposed for various types of rural residential areas. For the “combined migration” rural residential areas, the weighted Voronoi diagram method was used to determine the influence of a central village and to suggest the best direction for the “combined migration” of rural residential areas. The results provide a basis and reference for Zhengzhou’s future resettlement and new residential site selection, and the research techniques may be applicable in other regions. The research has great practical significance for improving the land use efficiency of Zhengzhou and promoting the integration of urban and rural development [37].
2. Research Scope and Data Sources
2.1. Overview of the Study Area
Zhengzhou (112°42′ E–114°14′ E, 34°16′ N–34°58′ N) is located in the Southern part of the North China Plain, downstream of the Yellow River (Figure 1), which has an urban population of 7.137 million and a rural population of 2.744 million. The total area of Zhengzhou is about 7446 km2, accounting for 4.46% of the total area of the Henan Province. Zhengzhou spans two large regions of significantly different elevations (the “second and third levels” of China), and the terrain is tilted from West to East. The Southwestern part is affected by erosion that has formed low hills. Gradually, to the South of the transition to the loess slope plain, erosion has created the alluvial plains of Huanghuai and a small number of dunes and sandy land. There are 124 rivers with variable sizes in the territory; 29 rivers have large drainage areas, and all belong to the Yellow River and Huaihe River systems. The region has well-developed traffic systems and is located in the center of the National Crossroad. Zhengzhou is an essential hub for railways, airports, and highways.
2.2. Data Sources and Processing
Land use data of the Henan Province (1:100,000), data describing the distribution of new rural communities in the Henan Province, and soil texture data were obtained from the Yellow River Downstream Science Data Center (http://henu.geodata.cn). The primary source of the land use data of Zhengzhou was the 2015 Landsat 8 OLI (Operational Land Imager) multi-spectral data. The land use was determined through manual visual interpretation using the ArcGIS software platform (ESRI, Inc., Redlands, CA, USA). Then, basic geographical data, such as map spots of the rural residential areas, urban construction land, surface water bodies, and roads in Zhengzhou, were extracted from the land use data.
The distribution of new rural communities in Zhengzhou was used to identify the central village from the “key development” rural residential areas, and central villages were used to “absorb” the “combined migration” rural residential areas. Elevation data for Zhengzhou (30 m digital elevation model) were obtained from the geospatial data cloud (http://www.Gscloud.cn/), from which the elevation, slope, aspect, and other features were extracted. Precipitation data, soil data, topographic data, and normalized difference vegetation index data were obtained from the National Earth System Science Data Center (http://www.geodata.cn/) and were used as input to the Revised Universal Soil Loss Equation (RUSLE) model in the Integrated Valuation of Ecosystem Services and Tradeoffs (InVEST) model to calculate the degree of regional soil hydraulic erosion. A spatial distribution map (30 m × 30 m grids) of the degree of regional soil hydraulic erosion was produced; ecologically sensitive areas were graded according to the grade of soil hydraulic erosion.
3. Research Methods
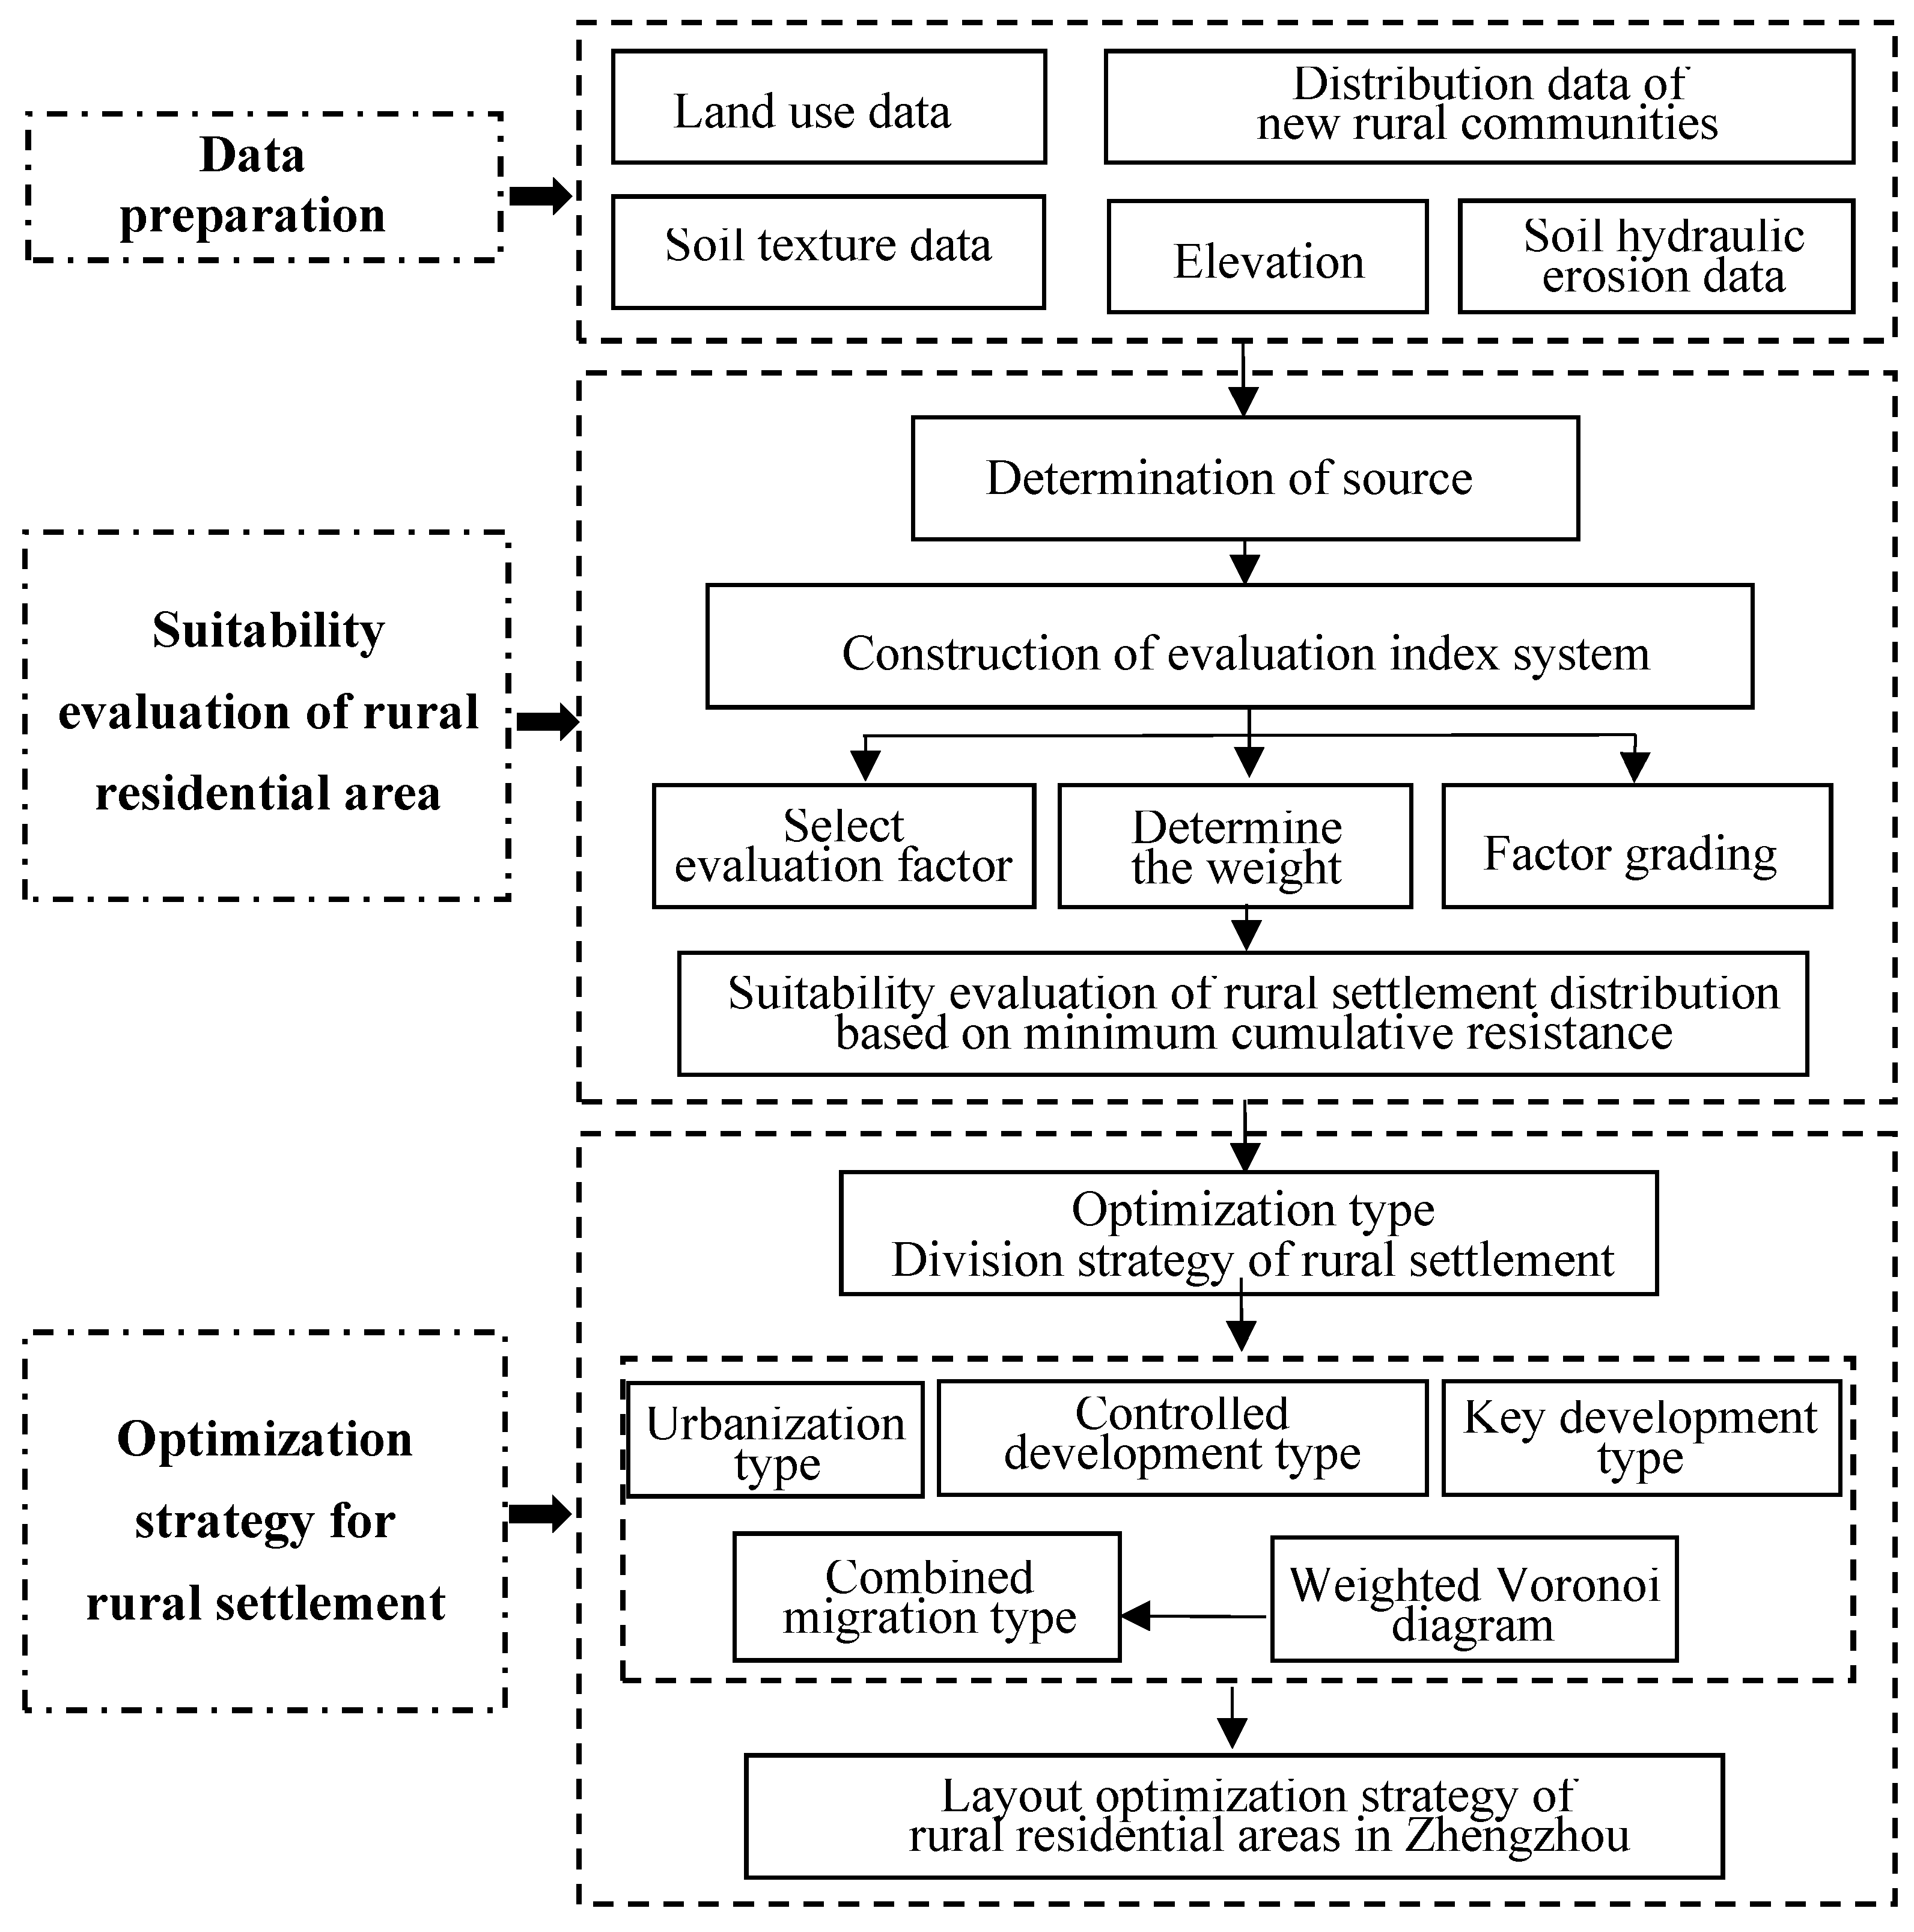
The minimum cumulative resistance (MCR) model was used to evaluate the distribution suitability of rural residential areas in Zhengzhou. The rural residential areas in Zhengzhou were divided into four optimization types, and corresponding optimization strategies were proposed for each type of rural residential area. Firstly, the Zhengzhou Basic Geography Database was constructed by incorporating data for land use, new rural community distribution, soil texture, elevation, soil water erosion, and other features. Secondly, we determined the source of rural residential areas in Zhengzhou, and, then, we determined 11 evaluation factors that were selected from the aspects of topographical geomorphic resistance, land resistance, and location resistance. The subjective and objective methods of the analytic hierarchy process and principal component analysis were combined to determine a weighting method for the factors. The evaluation factors were graded to construct the evaluation index system of rural residential areas in Zhengzhou. The MCR was used to evaluate the suitability of rural residential areas. Thirdly, based on a suitability evaluation, four types of the rural residential areas (namely, urbanization, key development, controlled development, and combined migration) were identified. Based on these divisions, the weighted Voronoi diagram method was used to determine the range of influence of the central village and the migration direction of the rural residential areas. Finally, corresponding optimization strategies were proposed for each type of rural settlement (Figure 2).
3.1. Minimum Cumulative Resistance Model
The MCR model assumes that a species will expend the least effort when passing through different types of landscapes during its movement from source to destination. Knaapen first proposed the model in 1992 [38], and it was later modified by Yu and others [39,40]. Equation (1) is used to calculate the MCR.
In Equation (1), MCR refers to the minimum cumulative resistance value; represents the distance of species A from source to landscape unit ; represents the resistance coefficient of landscape unit to the movement of the species A in the horizontal plane; Σ represents the accumulation of distance and drag coefficient of species A moving from source to all units crossed before reaching landscape unit ; reflects the minimum cumulative resistance of any point and its positive correlation function with the distance to the source and the land landscape feature; and represents the minimum value of the cumulative resistance of the evaluation unit for different sources. In the MCR model, the selection of the source and the construction of the resistance surface system are crucially important.
3.2. Suitability Evaluation Model
3.2.1. Determination of Source
“Source” in the MCR model refers to the starting point of factor expansion. In the study of a landscape ecological security pattern, the core area of a nature reserve and an ecologically sensitive area are often considered to be ecological “sources.” Starting from the construction status, location, and natural factors, three control factors (namely, size of residential area, distance from road, and slope) were used to set the selection conditions to define the source of rural residential areas. These selection conditions were: (1) the residential area was greater than 40 hm2; (2) the slope was less than 5°; and (3) the distance from the road (above county road level) was less than 500 m. In total, 89 sources were identified for the 3489 rural residential areas existing in Zhengzhou at the time of the study.
3.2.2. Building a Resistance System
The spatial distribution of rural residential areas is affected by many factors, such as natural conditions, socio-economic factors, and ecological factors. In this study, a statistical analysis of the evaluation indexes of rural residential land suitability in the relevant literature was conducted. From this analysis and expert opinions, as well as an examination of the actual situation in Zhengzhou, 11 secondary resistance factors (including elevation, slope, aspect, landscape, soil texture, surface waters, land cover, advanced highway, general road, town distance, and ecological sensitivity) were identified and used to establish the resistance surface in the three resistance categories of terrain, land use, and location. The resistance coefficient values were divided into five resistance values (from 1 to 5) according to the level of each factor. By combining the subjective and objective methods of the analytical hierarchy process and principal component analysis, the weights of indicators were determined, and the resistance system of rural residential land expansion in Zhengzhou was constructed (Table 1).
3.3. Weighted Voronoi Diagram
Suppose that is a finite point set on a Euclidean plane, and the points in the point set are different from each other. The point and the point are, respectively, two points in , and is any point on the Euclidean plane different from the point and the point . The weights of point and point are , respectively, and and represent the Euclidean distance between point and point and point , respectively. and represent the weighted Euclidean distance of point and point , point , respectively, and is the segmentation area of point on the plane. Within this framework, can be defined as:
In Equation (2), is the weighted Voronoi polygon of point . The weighted Voronoi polygon set V (Equation (3)) corresponding to all points in the set s constitutes a weighted Voronoi diagram of s. Among all polygons, the more significant the weight, the larger the area of the formed Voronoi diagram polygon—i.e., the greater the influence range of the force. Based on the comprehensive consideration of the differences between rural residential areas and their geographical distribution, this method can accurately and intuitively define the affected area of rural residential areas around a central village according to the size of the village’s area of spatial influence.
4. Results and Analysis
4.1. Suitability Evaluation of Rural Residential Areas
The Raster Calculator tool in ArcGIS 10.5 software was used to weight-stack the raster layers of each resistance factor to generate the comprehensive resistance value of Zhengzhou rural residential areas (based on 30 m × 30 m grid cells) (Figure 3). The resistance value of rural residential areas in Zhengzhou was generally high in the Southwest and low in the Northeast. The Northeastern part of Zhengzhou has a flat terrain, fertile land, and is close to the Yellow River Basin and convenient transportation. It is greatly influenced by Zhengzhou and the airport area, and its economic conditions are superior to those elsewhere in the study area. Therefore, the resistance value was small and conducive to the development of rural residential areas. Development in the Southwestern region is affected by the topography; the terrain is relatively steep, and there are more mountainous grasslands than elsewhere. Therefore, the development resistance of rural residential areas was relatively large in this part of the study area, which is not suitable for the layout of rural residential areas.
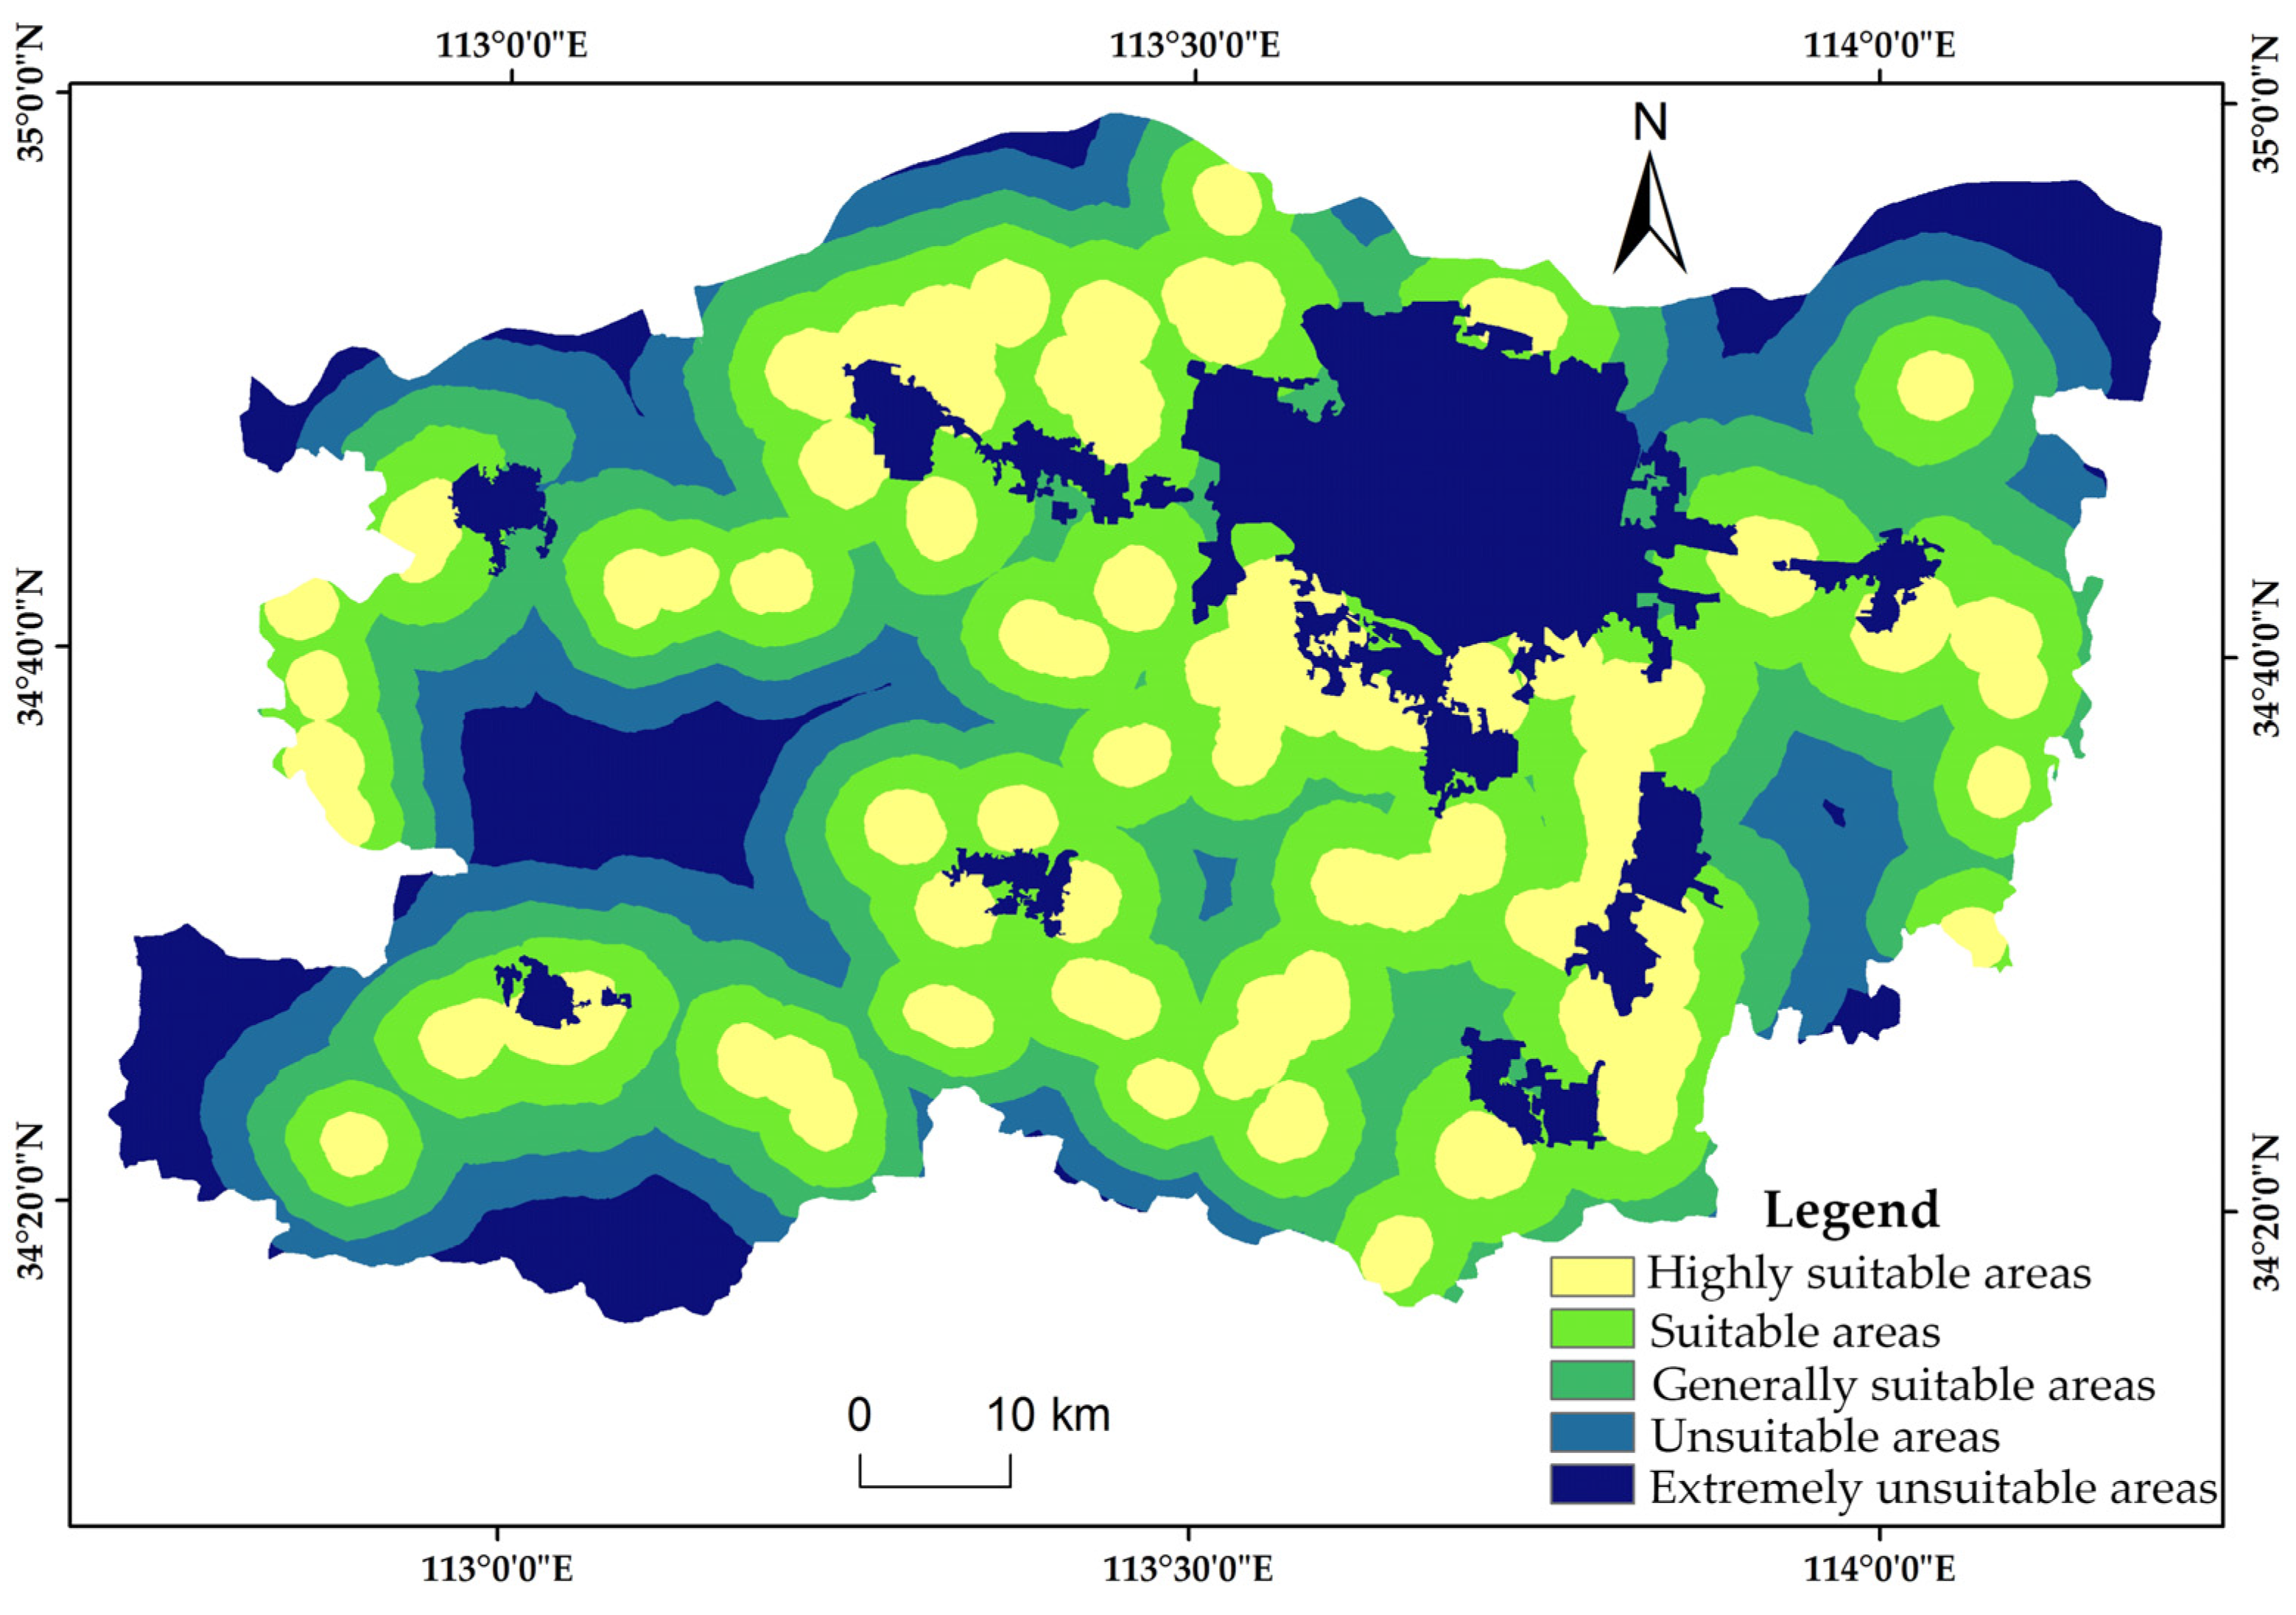
According to the surface source and comprehensive resistance values of rural residential areas in Zhengzhou, the cost–distance model was used to calculate the minimum cumulative resistance of each grid cell to the source of rural residential areas and determine the cost distance. The cost distance is a measure of the relative accessibility of any grid cell to the source of residents in the region, where the minimum cumulative resistance value to the source is considered to be the reachability value. In this paper, the degree of suitability of rural residents’ point sources to the surrounding space is indicated. The results show that the minimum cumulative resistance value of rural residential areas in Zhengzhou ranged from 0 to 63,307. According to the natural breaks method, Zhengzhou was divided based on the minimum cumulative distance values into highly suitable areas (0–4999), suitable areas (5000–11,999), generally suitable areas (12,000–19,999), unsuitable areas (20,000–29,999), and extremely unsuitable areas (30,000–63,307). Urban construction land was automatically classified as extremely unsuitable. The suitability classification results are shown in Figure 4.
The results of the suitability classification were superimposed onto the current distribution of rural residential areas in Zhengzhou. The number and area of rural residential areas and the proportion of total residential areas in each district was determined. The enumeration results are shown in Table 2.
The area of rural residential land classified as “suitable” in Zhengzhou was 208,112.43 hm2 and accounted for 27.49% of the study area (and 30.63% of the total residential area). The number of rural residential settlements in the area classified as suitable amounted to 1202. The amount of highly suitable and generally suitable areas was similar and accounted for between 19% and 20% of the total area of Zhengzhou. It is worth noting that the total amount of unsuitable and extremely unsuitable areas was 254,853.02 hm2 and accounted for 33.66% of the total area of Zhengzhou. Nevertheless, there were 662 rural residential settlements in these two types of areas; the settlements comprised a total area of 12,101.07 hm2, accounting for 20.36% of the total rural residential area. These results indicate the need for the optimization of rural residential areas in Zhengzhou.
4.2. Classification of Rural Residential Area Optimization
Based on the results of the suitability classification of rural residential areas in Zhengzhou, the rural residential areas were initially divided into four types: urbanization, key development, controlled development, and combined migration. The rural residential areas were then adjusted by setting the plaque area constraints, and the distribution of each type of rural residential area was determined. This determination served as the foundation for the corresponding optimization plan. The specific division strategy is described subsequently, and the results are summarized in Table 3.
Firstly, according to the Zhengzhou Master Plan (2010–2020), rural residential areas within the scope of urban planning in 2020 were regarded as reserve areas for urban construction land. They were then included in the “urbanization” category within the urban system, no matter what their previous suitability classification was.
Secondly, the rural residential areas classified as “highly suitable” were initially placed in the “key development” category with an average plaque area, A, of 19.53 hm2. The rural residential areas classified as “suitable” and “generally suitable” were initially placed in the “controlled development” category. Rural residential areas that had rich historical and cultural heritage, national characteristics, and tourism values were also placed in the “controlled development” category. The average plaque area, B, was 14.36 hm2. Rural residential areas located in what were classified as unsuitable and extremely unsuitable areas were initially placed in the “combined migration” category, with an average plaque area, C, of 17.54 hm2.
Finally, the four categorized areas were adjusted according to their corresponding plaque areas. If the plaque area of a lower-level rural residential area was more than twice the average area of the upper-level rural residential area, the rural residential area was automatically upgraded by one level. Similarly, if a higher-level rural residential area amounted to less than half the average area of the next-level rural residential area, the rural residential area was lowered by one level. In addition, some rural residential areas that had a certain scale and were difficult to transfer were reserved. The “combined migration” rural residential areas with an area larger than 10 hm2 were re-categorized into the “controlled development” category. The distribution of rural residential area optimization types in Zhengzhou is shown in Figure 5.
4.3. Optimization Strategies for Various Types of Rural Residential Areas
4.3.1. “Urbanization” Type
In total, 504 rural residential areas in Zhengzhou were identified as the urbanization type; these accounted for a total area of 11,929.37 hm2, which was 20.07% of the total rural residential area in Zhengzhou (Table 4). These areas were mainly distributed around construction land in Zhengzhou and other cities and counties, and located within the boundary of Zhengzhou Town Planning for 2020. Furthermore, a small number of rural residential areas already existed within the urban construction land. Rural residential areas in the “urbanization” type have excellent spatial locations compared to those in other types, and their development is greatly affected by the nearby urban area. The specific optimization strategies for this type of rural residential area are as follows: (1) by adopting the methods of institutional transformation of rural residential areas and land property rights transformation, rural residential areas in Zhengzhou that are in the urbanization category are optimized by “non-agricultural transformation” and “village-to-street transformation,” and are directly incorporated into the urban development scope or transformed into reserve areas for future urban development. (2) The rural residential areas that are distributed around the town can be used directly as township small business land. The government can also formulate relevant policies to attract appropriate enterprises to invest in opportunities that can solve the employment problems of land-expropriated farmers. (3) Local government should improve the management system, realize the transformation of farmers into urban dwellers with urban lifestyles, improve the living standard, and build a new residential community.
4.3.2. “Key Development” Type
A total of 620 rural residential areas with a total area of 20,883.45 hm2 were identified as the “key development” type. These accounted for 35.14% of the total rural residential area in Zhengzhou (Table 4). The distribution of these areas was relatively concentrated where Xingyang, Xinmi, Xinzheng, and Zhengzhou Erqi District intersect. This type of rural residential area has excellent development potential because of its natural environment, economic strength, and location near transportation networks. This type of residential area also has a strong radiation effect on surrounding settlements and can promote the development of other rural residential areas. The specific optimization strategies for this category of rural residential areas are as follows: (1) the government should strictly control the examination and approval of housing sites in the region, and reserve sufficient construction land for establishing new residential communities that are suitable for farmers’ continued production activities and living in order to resettle rural residents who have moved into the region. According to the development orientation, science-based planning of public service facilities and infrastructure should be undertaken within the region. (2) The government should also promote the construction of infrastructure to meet the development needs of rural residential areas identified as the key development type and play a leading role in surrounding rural residential areas. (3) A trading market for agricultural products and an area for the concentration of agricultural product processing industries should be established, which not only can increase farmers’ income and industrial added value, but also extend the agricultural industrial chain and realize regional economic development.
4.3.3. “Controlled Development” Type
A total of 1367 rural residential areas comprised the “controlled development” type of optimization and they were almost evenly distributed in Zhengzhou. These areas had a collective area of 21,558.07 hm2, accounting for 36.27% of the total rural residential area in Zhengzhou (Table 4). This type of rural residential area can still meet the demand of residential life, but they have insufficient development momentum in the future, which makes them less attractive to residents. They cannot reach the possibility of rapid development, but they cannot move, so they can only control the development. The specific optimization strategies for this category of optimized residential area are as follows: (1) the government should actively encourage farmers to use the idle residential land and waste homesteads in villages to realize the recycling of homesteads, thereby effectively restricting the disorderly expansion of residential land, reducing the idleness and waste of land resources, and improving land utilization. (2) For reserved rural residential areas with low suitability and large-scale migration problems, the government should adopt restrictions on its development strategy to guide settlements to locate closer to a central village or town, or to cause rural residential areas to decline naturally. (3) Rural residential areas with national characteristics, historical and cultural heritage, or those located around tourist attractions should be protected and developed on the basis of preserving the original buildings, becoming cultural tourism scenic locations, and promoting economic development.
4.3.4. “Combined Migration” Type
A total of 997 rural residential areas were identified as the “combined migration” type; these had a total area of 5062.05 hm2 and accounted for 8.52% of the total rural residential areas in Zhengzhou (Table 4). These areas were concentrated in Dengfeng, Xinmi, Xiangyang, and Gongyi, and were distributed to a smaller extent in other regions. These areas are mountainous and hilly and are located at high altitude in complex terrain with inadequate transportation networks. The weighted Voronoi diagram was used to define the scope of influence of a central village and provide the direction of migration for the “migration merge” category of rural residential areas.
As noted previously, 620 rural residential areas in Zhengzhou were identified as the “key development” type. If all the key development rural residential plaques had been included in the calculation of the weighted Voronoi diagram, the scope of influence of rural residential area patches of the “key development” type would have been smaller, and not conducive to the intensive use of land within the region. Therefore, the distribution data of new rural communities in the Henan Province were used to extract the key development rural residential areas as “central villages,” and, finally, determine that 171 central village plaques (such as the Xiangyang Central Community) were specifically used to absorb the “combined migration” rural residential areas.
The anti-normalization of the comprehensive resistance value of the rural residential area was then used as the weight value of the influence range of the central point. A weighted Voronoi diagram was generated using the “Weight Voronoi” plugin in the ArcGIS 9.3 software. The spatial constraints of county-level administrative boundaries were increased so that rural residential areas within the administrative area could not be merged or merged across administrative boundaries, and, ultimately, the scope of influence of central villages was determined (Figure 6). Taking Dengfeng, within the boundary of Zhengzhou, as an example, the direction of migration and consolidation of rural residential areas is shown in Figure 7.
The “combined migration” type of rural residential areas in Zhengzhou were mostly distributed in mountainous areas at high altitude with complex topography. The agricultural production conditions in these areas are weak, and soil erosion is severe. The suitability of the area for residential uses is low, but the vegetation coverage is high, the species diversity is abundant, and the ecological environment is of high quality. To effectively protect the local ecological environment, it is necessary to reduce the impact of human activities. The following remediation measures can be taken for this type of rural residential area: (1) the government should promulgate relevant policies that benefit the residents. The government should respect the wishes of farmers and actively guide, coordinate, and organize farmers to move as entire villages to nearby central villages that have convenient transportation and better living conditions. (2) The abandoned homesteads left due to the migration to central villages should be reclaimed and converted into cultivated land, grassland, woodland, and other land use types to realize intensive land use for residential areas, while ensuring that the ecological environment is protected and enhanced.
5. Conclusions
In this study, an evaluation index system was constructed to objectively determine the suitability and distribution of rural residential areas in Zhengzhou, China. The minimum cumulative resistance model was used to realize the spatial distribution of rural residential areas based on suitability. The rural residential areas in Zhengzhou were divided into four optimization categories: urbanized, key development, controlled development, and combined migration. Corresponding optimization strategies were proposed for rural settlements in each optimization category. A weighted Voronoi diagram was used to determine the scope of influence of central villages as well as the migration direction for the “combined migration” rural residential areas. The main conclusions are as follows:
(1) The Northeastern part of Zhengzhou is affected by the central districts of Zhengzhou and is conducive to the construction of rural residential areas (mainly because the area has flat terrain and an excellent transportation network). The comprehensive resistance value of rural residential areas in the Northeastern area is small overall, the suitability for residential housing is high, the scale of residential areas is vast, and there are more rural residential areas in the “urbanization” and “key development” optimization categories than in other parts of Zhengzhou. The Southwestern part of Zhengzhou consists mostly of mountainous and hilly areas at relatively high altitudes, with complex terrain and inconvenient transportation. These physical characteristics restrict the generation and activity of rural residential areas. The resistance value of rural residential areas in the Southwestern part of Zhengzhou is considerable overall, and the suitability for residential construction is low. The “combined migration” rural residential areas are mostly distributed here.
(2) In terms of suitability for residential development, Zhengzhou is divided into areas that are highly suitable, suitable, generally suitable, unsuitable, and extremely unsuitable. There are 662 rural residential areas in unsuitable and extremely unsuitable areas, with a total area of 12,101.07 hm2, and accounting for 20.36% of the total rural residential area. The rural residential areas in Zhengzhou need to be optimized.
(3) There are 997 “combined migration” rural residential areas in Zhengzhou, with a total area of 5062.05 hm2, and accounting for 8.2% of the total residential area. There are 171 rural residential plaques (such as Xiangyang Central Community and Junzhao Central Community) that are identified as a central village and are mainly used to absorb the merged rural residential areas.
The following policy recommendations are proposed for the four types of rural residential areas: the government should take measures, such as the transformation of rural residential areas and the transformation of land property rights, solve the problems of rural household registration, land compensation, employment resettlement, and social security, and use urbanized rural residential areas as a reserved area for future urban development. The government should optimize the industrial structure of rural residential areas in key development areas and create a new type of rural residential community with reasonable spatial layout, the capacity for rapid economic development, suitable infrastructure and a beautiful living environment. The government should actively guide villagers to recycle residential land, adopt external control, and internally achieve full utilization to limit the expansion of the rural residential areas in controlled development areas. Finally, the government should reasonably guide the “combined migration” rural residential areas to focus on the “key development” rural residential areas, and at the same time rehabilitate the abandoned homesteads.
Although this research studied the suitability and layout optimization strategies of rural residential areas in Zhengzhou, it did not consider farmers’ willingness to move, living habits, or other factors when constructing the evaluation index system of rural residential distribution suitability and proposing corresponding optimization strategies. These factors have a significant impact on the spatial distribution of rural settlements and the formulation of optimization schemes and should be further explored in future research.
Author Contributions
F.Z.; Funding acquisition, H.W. and F.Q.; Investigation, P.G. and F.Z; Methodology, H.W.; Project administration, H.W.; Resources, F.Q.; Software, P.G.; Validation, F.Z.; Visualization, F.Z.; Writing—original draft, P.G.; Writing—review & editing, H.W. and F.Q. All authors have read and agreed to the published version of the manuscript.
Funding
This research was funded by “the National Nature Science Foundation of China, grant number 41401457” and “Science and Technology Planning Project of Henan province, grant number 172102210191”and “First-class disciplines innovation team training projects in Henan University, grant number 2018YLTD16.”
Acknowledgments
We thank International Science Editing (http://www.internationalscienceediting.com) for editing this manuscript.
Conflicts of Interest
The authors declare no conflict of interest.
References
- Long, H.; Liu, Y.; Li, X.; Chen, Y. Building new countryside in China: A geographical perspective. Land Use Policy 2010, 27, 457–470. [Google Scholar] [CrossRef]
- Long, H.; Zou, J.; Pykett, J.; Li, Y. Analysis of rural transformation development in China since the turn of the new millennium. Appl. Geogr. 2011, 31, 1094–1105. [Google Scholar] [CrossRef]
- Wang, Y.; Liu, Y.; Li, Y. Spatial-temporal patterns of urbanization and rural development and their coordination in Bohai Rim region. Geogr. Res. 2015, 34, 122–130. [Google Scholar]
- Caulfield, M.; Bouniol, J.; Fonte, S.J.; Kessler, A. How rural out-migrations drive changes to farm and land management: A case study from the rural Andes. Land Use Policy 2019, 81, 594–603. [Google Scholar] [CrossRef]
- Zheng, X.; Liu, Y. Connotation, formation mechanism and regulation strategies of rural disease in the new epoch in china. Hum. Geogr. 2018, 33, 100–106. [Google Scholar]
- Woods, M. Rural cosmopolitanism at the frontier? Chinese farmers and community relations in northern Queensland, c.1890–1920. Aust. Geogr. 2018, 49, 107–131. [Google Scholar] [CrossRef] [Green Version]
- Ge, D.; Wang, Z.; Tu, S.; Long, H.; Yan, H.; Sun, D.; Qiao, W. Coupling analysis of greenhouse- led farmland transition and rural transformation development in China’s farming area: A case of Qingzhou City. Land Use Policy 2019, 86, 113–125. [Google Scholar] [CrossRef]
- Long, H.; Qu, Y. Land use transitions and land management: A mutual feedback perspective. Land Use Policy 2018, 74, 111–120. [Google Scholar] [CrossRef]
- Mendras, H. Farewell to Peasant; Li, P., Ed.; Social Sciences Press: Beijing, China, 1991; pp. 78–106. [Google Scholar]
- Zhong, Z.; Wang, Z.; Li, W. Spatial distribution characteristics and affecting factors of rural residential land in the mountainous area based on Voronoi and landscape indices. Res. Soil Water Conserv. 2014, 21, 211–216. [Google Scholar]
- Yue, R.C.; Lei, G.P.; Yin, J.D.; Ding, X.; Ma, X.P.; Wang, J.W. Analysis the distribution pattern and influence factors of rural settlements: A case study of Qing’an County. J. China Agric. Univ. 2017, 22, 173–180. [Google Scholar]
- Polat, H.E.; Olgun, M. Analysis of the rural dwellings at new residential areas in The Southeastern Anatolia, Turkey. Build. Environ. 2004, 39, 1505–1515. [Google Scholar] [CrossRef]
- Currit, N.; Easterling, W.E. Globalization and population drivers of rural-urban land-use change in Chihuahua, Mexico. Land Use Policy 2009, 26, 535–544. [Google Scholar] [CrossRef]
- Carrion-Flores, C.; Irwin, E.G. Determinants of residential land-use conversion and sprawl at therural-urban fringe. Am. J. Agric. Econ. 2004, 86, 889–904. [Google Scholar] [CrossRef]
- Hai, B.B.; Li, X.J.; Xu, J.W. Spatio-temporal evolution of rural settlements in Gongyi. Geogr. Res. 2013, 32, 2257–2269. [Google Scholar]
- Long, H.; Heilig, G.K.; Li, X.; Zhang, M. Socio-economic development and land-use change:analysis of rural housing land transition in the Transect of the Yangtse River, China. Land Use Policy 2007, 24, 141–153. [Google Scholar] [CrossRef]
- Berihun, M.L.; Tsunekawa, A.; Haregeweyn, N.; Meshesha, D.T.; Adgo, E.; Tsubo, M.; Masunaga, T.; Fenta, A.A.; Sultan, D.; Yibeltal, M. Exploring land use/land cover changes, drivers and their implications in contrasting agro-ecological environments of Ethiopia. Land Use Policy 2019, 87, 104052. [Google Scholar] [CrossRef]
- Marlow, V.; Krupa, K.S. Rural Residential Land use: Tracking its grows. Agric. Outlook 2002, 8, 14–17. [Google Scholar]
- Long, H.; Li, Y.; Liu, Y.; Woods, M.; Zou, J. Accelerated restructuring in rural China fueled by ‘increasing vs. decreasing balance’ land-use policy for dealing with hollowed villages. Land Use Policy 2012, 29, 11–22. [Google Scholar] [CrossRef]
- Xu, F.; Wang, Z.Q.; Zhang, H.W.; Ji, C. Application of random forest algorithm in suitability evaluation of rural residential land. Resour. Sci. 2018, 40, 2085–2098. [Google Scholar]
- Lin, A.W.; Pang, Y. Hierarchical Fuzzy Evaluation Model the Suitability Evaluation Readjustment of Village Land Use. Geomat. Inf. Sci. Wuhan Univ. 2006, 31, 624–627. [Google Scholar]
- Zhang, J.F.; Zhang, A.L.; Dong, J. Study on Partition Layout of Rural Settlements Based on Niche-fitness Model—A Case Study in Xinzhou District of Wuhan. J. Huazhong Agric. Univ. (Soc. Sci. Ed.) 2013, 4, 96–101. [Google Scholar]
- Lambin, E.F.; Meyfroidt, P. Land use transitions: Socio-eco-logical feedback versus socio-economic change. Land Use Policy 2010, 27, 108–118. [Google Scholar] [CrossRef]
- Hong, B.T.; Ren, P. Assessment of ecological suitability for rural residential land based on minimum cumulative resistance model: A case study in Dujiangyan city. Resour. Environ. Yangtze Basin 2019, 28, 1386–1396. [Google Scholar]
- Qin, T.T.; Qi, W.; Li, Y.Q.; Qu, Y.B. Suitability evaluation of rural residential land based on niche theory in mountainous area. Acta Ecol. Sin. 2012, 32, 5175–5183. [Google Scholar]
- Liu, X.Q.; Bi, R.T.; Gao, Y. The analysis of spatial distribution and optimization on rural settlement in upland half a mountainous using GIS technology. Econ. Geogr. 2011, 31, 822–826. [Google Scholar]
- Zou, L.L.; Wang, Z.Q.; Wang, J.Y. Spatial Distribution and Optimization of Rural Residential Land in the Mountainous Area. China Land Sci. 2012, 26, 71–79. [Google Scholar]
- Wen, B.; Liu, Y.; Xia, M. Layout optimization of rural residential land based on theory of landscape security pattern. Trans. Chin. Soc. Agric. Eng. (Trans. CSAE) 2014, 30, 181–191. [Google Scholar]
- Fan, T.X.; Yang, Q.Y.; He, J.; Pan, F.; Deng, Y.W. Spatial distribution optimization of rural residential land in hilly areas: A case study of Haitang town in Changshou district. Geogr. Res. 2015, 34, 883–894. [Google Scholar]
- Long, H.; Zou, J.; Liu, Y. Differentiation of rural development driven by industrialization and urbanization in eastern coastal China. Habitat Int. 2009, 33, 454–462. [Google Scholar] [CrossRef]
- Nath, T.; Inoue, M. The Upland Settlement Project of Bangladesh as a Means of Reducing Land Degradation and Improving Rural Livelihoods. Small-Scale For. 2008, 7, 163. [Google Scholar] [CrossRef]
- Porta, J.; Parapar, J.; Doallo, R.; Barbosa, V.; Santé, I.; Crecente, R.; Díaz, C. A Population-based Iterated Greedy Algorithm for the Delimitation and Zoning of Rural Settlements. Comput. Environ. Urban Syst. 2013, 39, 12–26. [Google Scholar] [CrossRef]
- Wei, Y.F.; Chen, Y.K.; Tong, X.H.; Ou, X.J. Research on optimizing the spatial pattern of rural residential points based on improved Particle Swarm Optimization algorithm. Geogr. Geo-Inf. Sci. 2014, 30, 72–76. [Google Scholar]
- Liu, Y.J.; Zhu, Q.; Lv, L.G.; Liao, K.H. Time-series zoning for rural residential land consolidation based on study of farm households′ willingness. Res. Soil Water Conserv. 2017, 24, 299–304. [Google Scholar]
- Cecilia, V.S.; David, N.F.; Robert, A.K. Participatory landscape planning and sustainable co-mmunity development: Methodological observations from a case study in rural Mexico. Landsc. Urban Plan. 2010, 94, 63–70. [Google Scholar]
- Qu, Y.; Jiang, G.; Zhang, F.; Shang, R. Models of rural residential land consolidation based on rural households’ willingness. Trans. Chin. Soc. Agric. Eng. (Trans. CSAE) 2012, 28, 232–242. [Google Scholar]
- Liu, Y.; Lu, S.; Chen, Y. Spatio-temporal change of urban–rural equalized development patterns in China and its driving factors. J. Rural Stud. 2013, 32, 320–330. [Google Scholar] [CrossRef]
- Kaaapen, J.P.; Scheffer, M.; Harms, B. Estimating habitat isolation in landscape planning. Landsc. Urbain Plan. 1992, 23, 1–16. [Google Scholar] [CrossRef]
- Yu, K.J. Landscape ecological security patterns in biological conservation. Acta Ecol. Sin. 1999, 1, 8–15. [Google Scholar]
- Yu, K.J. Ecologically strategic points in landscape and surface model. Acta Geogr. Sin. 1998, 65, 11–20. [Google Scholar]
Figure 1.
Location and topography of Zhengzhou, China.
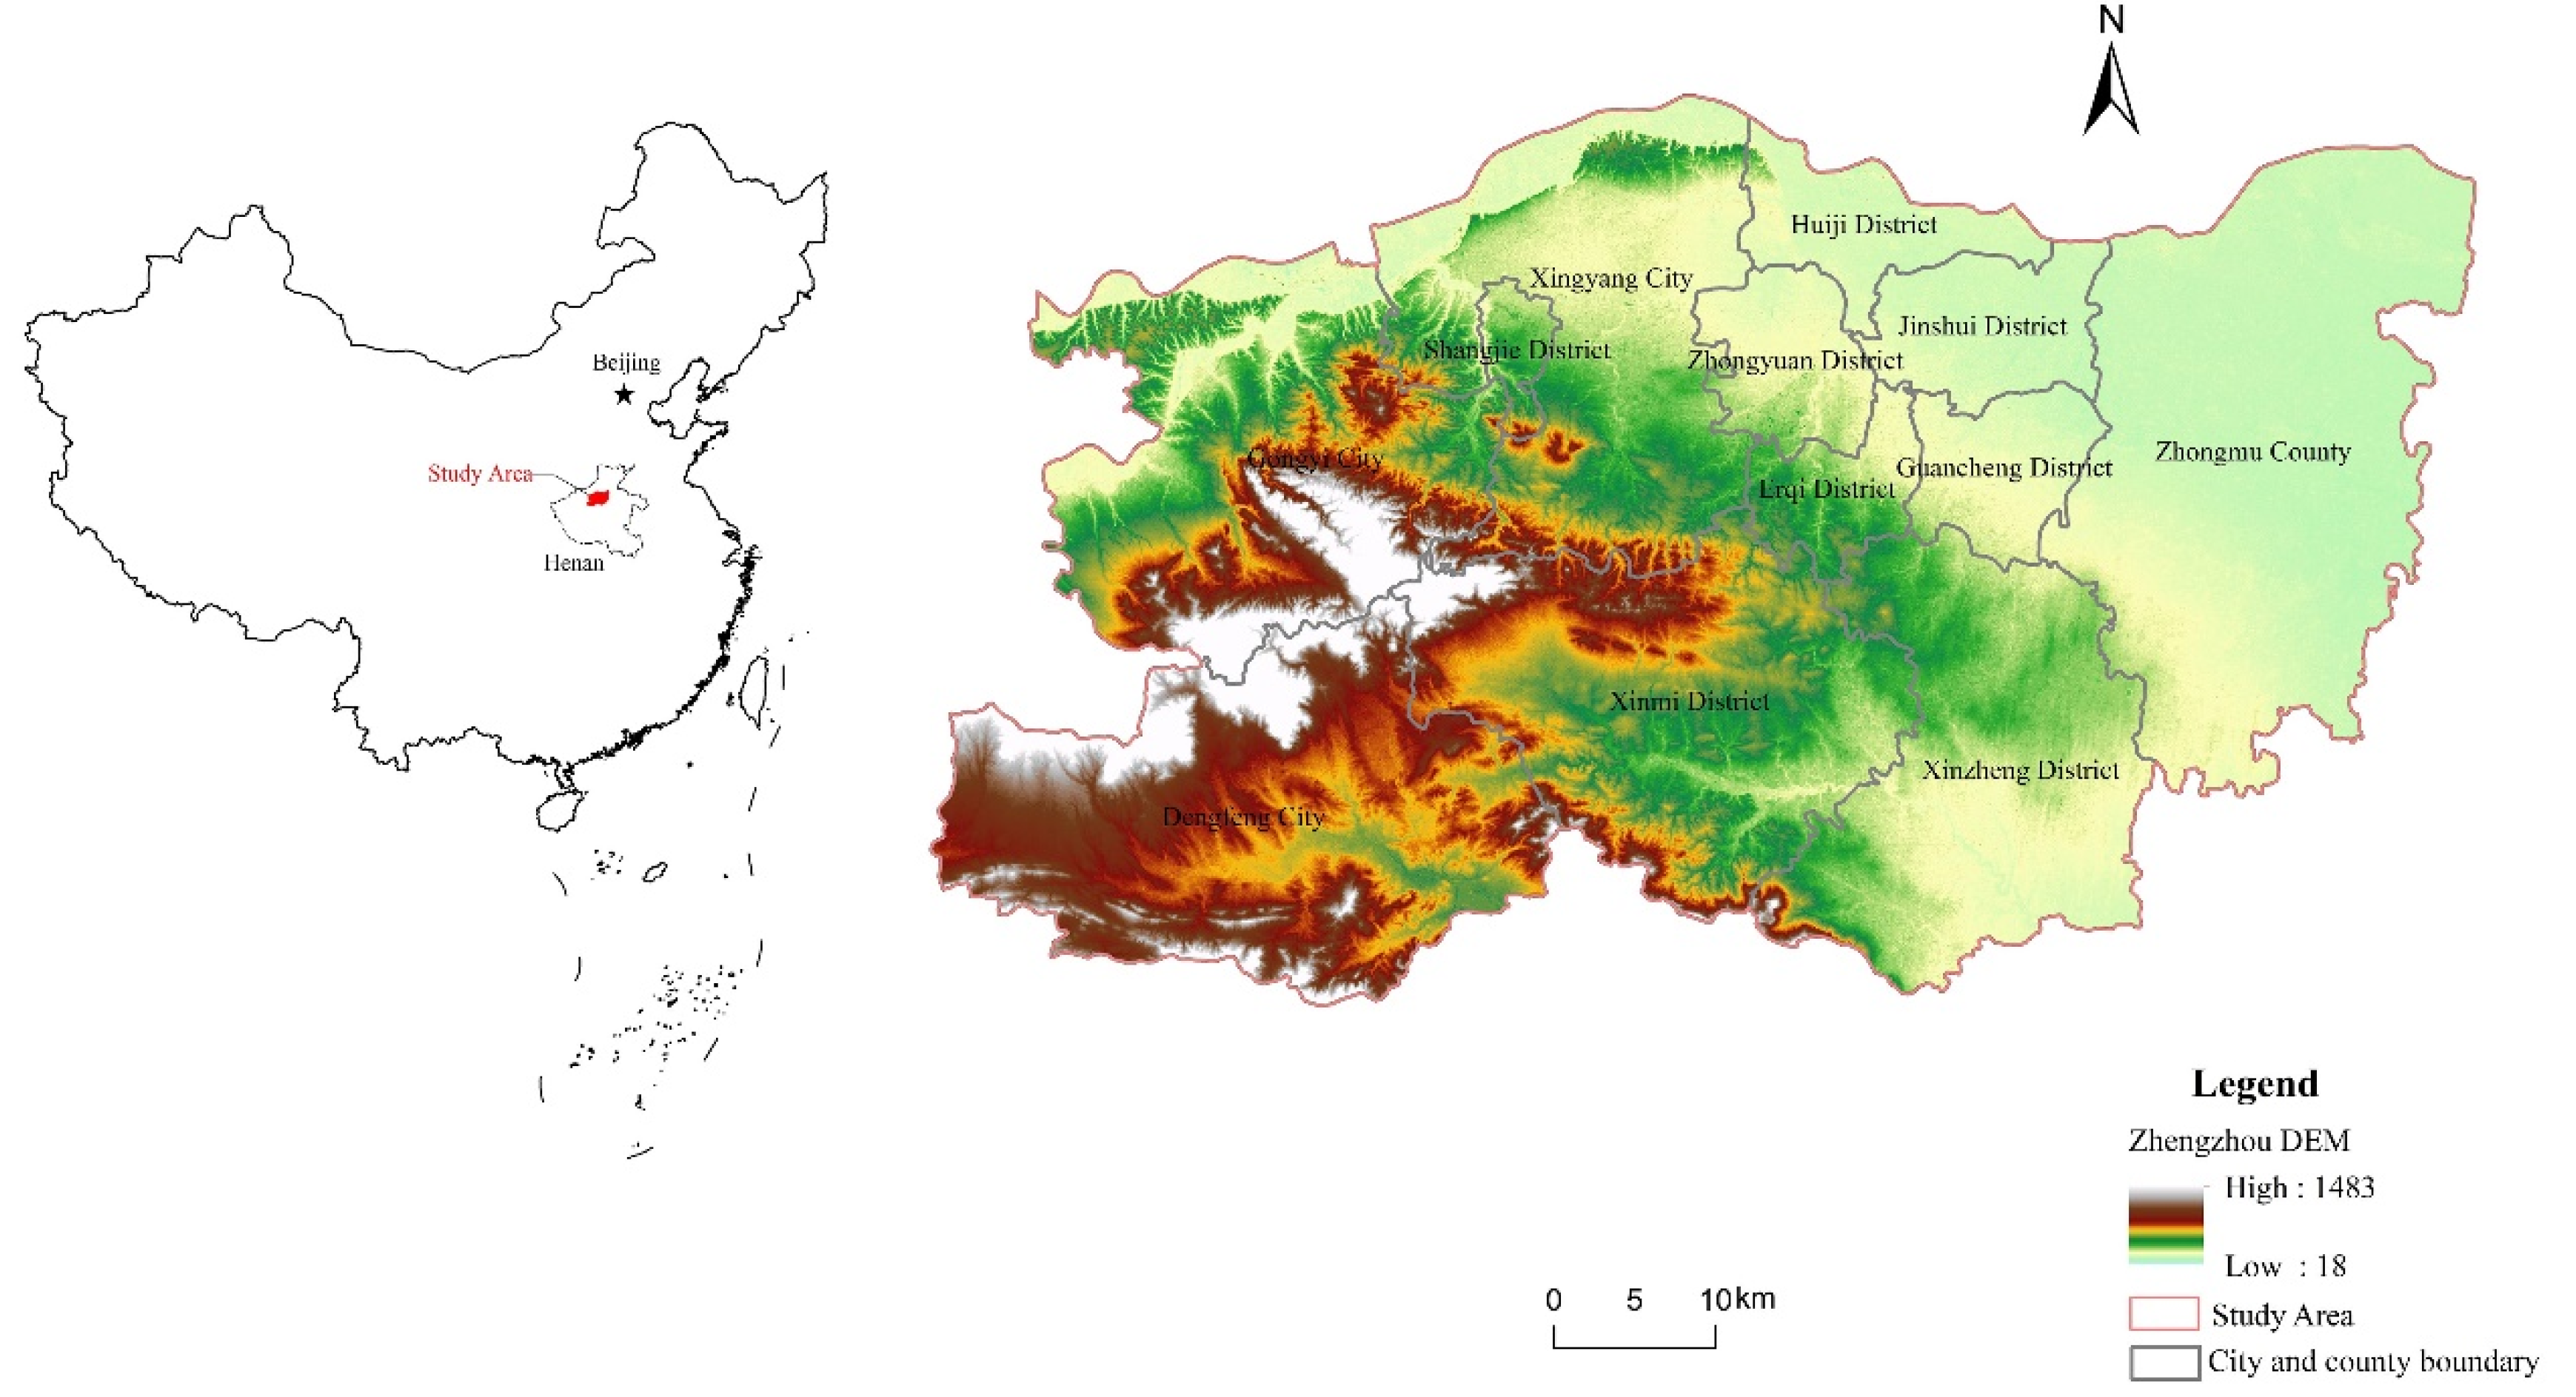
Figure 2.
Analytical framework for the study.

Figure 3.
Comprehensive resistance values of rural residential areas in Zhengzhou.

Figure 4.
Suitability classification of rural residential areas in Zhengzhou.

Figure 5.
Distribution of rural residential area optimization types in Zhengzhou.

Figure 6.
Influence areas of central villages in Zhengzhou.

Figure 7.
Schematic diagram showing the direction of migration and consolidation of rural residential areas in Dengfeng.
Figure 7.
Schematic diagram showing the direction of migration and consolidation of rural residential areas in Dengfeng.


Table 1.
Resistance system for land expansion of rural residential areas in Zhengzhou.
| Level Indicators | The Secondary Indicators (The Weight) | Resistance Coefficient and Classification | ||||
|---|---|---|---|---|---|---|
| 1 | 2 | 3 | 4 | 5 | ||
| Topographic resistance | Elevation (0.085) | <160 m | 160–300 m | 300–460 m | 460–710 m | >710 m |
| Slope (0.075) | 0–5° | 5–10° | 10–18° | 18–30° | >30° | |
| Aspect (0.051) | South, Horizontal | Southeast, Southwest | East, West | Northeast, Northwest | North | |
| Landscape (0.072) | Plain | Mesa | Hills | - | Mountain | |
| Land resistance | Soil texture (0.069) | loam | sand | sticky loam | clay | waters |
| Surface waters (0.049) | 0–0.5 km | 0.5–1 km | 1–2 km | 2–2.5 km | >2.5 km | |
| Land cover (0.154) | Rural settlement | Bare rock, Bare land | The dry land, Industrial and mining land | Garden, woodland, grassland | Construction Land, Transportation Land, Water Body | |
| Location resistance | Advanced highway (0.106) | 0–1 km | 1–2 km | 2–3 km | 3–4 km | >4 km |
| General road (0.094) | 0–0.5 km | 0.5–1 km | 1–2 km | 2–3 km | >3 km | |
| Town distance (0.177) | 0–2 km | 2–5 km | 5–8 km | 8–10 km | >10 km | |
| Ecological sensitivity (0.069) | micro degrees | mild | moderate | strong | very strong | |
Table 2.
Suitability classification of rural residential areas in Zhengzhou.
| Suitability Zoning | Suitable Area (hm2) | Proportion of Total Area | Number of Rural Settlements | Residential Area (hm2) | Percentage of Total Residential Area |
|---|---|---|---|---|---|
| Highly suitable area | 145,672.85 | 19.24% | 922 | 18,787.38 | 31.61% |
| Suitable area | 208,112.43 | 27.49% | 1202 | 18,201.37 | 30.63% |
| Generally suitable area | 148,423.69 | 19.61% | 703 | 10,343.12 | 17.40% |
| Unsuitable area | 100,336.44 | 13.25% | 383 | 6675.98 | 11.23% |
| Extremely unsuitable area | 154,516.58 | 20.41% | 279 | 5425.09 | 9.13% |
Table 3.
Rural residential area optimization types in Zhengzhou.
| Types of Rural Settlements | Cumulative Resistance | Suitability Zoning | Patch Area Threshold |
|---|---|---|---|
| Urbanization type | Unlimited | Unlimited | Unlimited |
| Key development type | (0–5000) | Highly suitable area | >B/2 |
| (5000–20,000) | Suitable area Generally suitable area | >2A | |
| Controlled Development type | (0–5000) | Highly suitable area | <B/2 |
| (5000–20,000) | Suitable area Generally suitable area | >C/2 | |
| (20,000–63,307) | Unsuitable area Extremely unsuitable area | >2B | |
| Combined migration type | (5000–20,000) | Suitable area Generally suitable area | <C/2 |
| (20,000–63,307) | Unsuitable area Extremely unsuitable area | <2B |
Table 4.
Classification of rural residential areas by optimization type in Zhengzhou.
| Optimization Types of Rural Residential Areas | Number of Rural Settlements | Residential Area (hm2) | Average Residential Area (hm2) | Area Than (%) |
|---|---|---|---|---|
| Urbanization | 504 | 11,929.37 | 23.65 | 20.07% |
| Key development | 620 | 20,883.45 | 33.67 | 35.14% |
| Controlled development | 1367 | 21,558.07 | 15.77 | 36.27% |
| Combined migration | 997 | 5062.05 | 5.08 | 8.52% |
© 2020 by the authors. Licensee MDPI, Basel, Switzerland. This article is an open access article distributed under the terms and conditions of the Creative Commons Attribution (CC BY) license (http://creativecommons.org/licenses/by/4.0/).
Share and Cite
MDPI and ACS Style
Guo, P.; Zhang, F.; Wang, H.; Qin, F. Suitability Evaluation and Layout Optimization of the Spatial Distribution of Rural Residential Areas. Sustainability 2020, 12, 2409. https://doi.org/10.3390/su12062409
AMA Style
Guo P, Zhang F, Wang H, Qin F. Suitability Evaluation and Layout Optimization of the Spatial Distribution of Rural Residential Areas. Sustainability. 2020; 12(6):2409. https://doi.org/10.3390/su12062409
Chicago/Turabian StyleGuo, Pengfei, Fangfang Zhang, Haiying Wang, and Fen Qin. 2020. "Suitability Evaluation and Layout Optimization of the Spatial Distribution of Rural Residential Areas" Sustainability 12, no. 6: 2409. https://doi.org/10.3390/su12062409
Note that from the first issue of 2016, this journal uses article numbers instead of page numbers. See further details here.