Abstract
It was demonstrated that conventional resource use efficiency (RUE) estimation methodology is largely subject to arithmetic weakness. Extensive field research data on aboveground biomass (AGB), absorbed photosynthetically active radiation (APAR), and crop evapotranspiration (ETc) in maize, soybean, sorghum, and winter wheat confirmed this methodological bias for light use efficiency (LUE) and water use efficiency (WUE) estimation. LUE and WUE were derived using cumulated (data aggregates across samplings) and independent (data increments across samplings) approaches. Use of cumulated data yielded strong-but-false correlation between AGB and APAR or ETc, being a statistical artefact. RUE values from an independent approach were substantially lower than that from a cumulated approach with greater standard errors. Overall, a cumulated approach tends to oversimplify the complex interactions among carbon and resource coupling in agroecosystems, which is accurately represented when employing an independent approach instead.
1. Introduction
The resource use efficiency (RUE) concept has been extensively used to evaluate agroecosystem productivity across environments, management regimes, time scales [1,2,3,4,5], and parameterization of crop models [6,7,8]. RUE metrics (water use efficiency or WUE and light use efficiency or LUE) are commonly estimated using measures of dry matter assimilation (photosynthesis, gross/net primary productivity, aboveground or total biomass) and corresponding resource use (crop evapotranspiration or ETc for WUE and intercepted/absorbed light or IPAR/APAR for LUE). These quantities are usually regressed linearly, and the slopes are interpreted as RUE estimates.
However, this methodology has been subject to strong yet limited criticism. Specifically, the computational aspects of LUE have been originally critiqued by Demetriades-Shah et al. [9]. Among the criticisms, a major proposition was to reconsider the arithmetic nature of the quantities regressed in LUE estimation. Specifically, LUE estimates derived from cumulated plant dry matter and light interception were shown to be erroneous due to error propagation from biased sampling, consequently supported by Demetriades-Shah et al. [10] and Malet et al. [11]. Despite the critique, scientists have long continued the use of cumulated data in LUE computation [12,13,14,15,16,17,18,19,20,21], although very limited exceptions [22,23] exist that rely on incremental data to estimate LUE. For identical reasons, the use of cumulated data also confounds WUE estimates, since both LUE and WUE estimations use the same methodology. WUE research has also relied on cumulated quantities of dry matter and ETc [16,20,21,24]. While cumulated WUE estimation has not been directly criticized as for LUE, it is logical and necessary to evaluate its impacts on WUE estimates and their interpretation. It is critical to evaluate whether methodological weakness exists in conventional LUE and WUE estimation techniques, due to extensive dependence on these metrics to characterize cropping systems around the globe. To this end, field research was conducted for four major row crops, to observe and record high-frequency aboveground biomass, APAR, and ETc for two growing seasons, and consequently assess the potential weaknesses in the estimation of LUE and WUE.
The four crops are maize-short and long season hybrids: S.S. and L.S. maize, respectively (Zea mays L.), soybean (Glycine max (L.) Merr.), sorghum (Sorghum bicolor (L.) Moench), and winter wheat (Triticum aestivum L.). The datasets collected in this research provide an excellent opportunity to revisit this criticism and evaluate potential misrepresentation of RUE estimates from cumulated data, and consequently present an arithmetically alternate strategy of using independent data. Our specific objectives are to: (i) detect any differences in LUE and WUE estimates derived from cumulated data and independent data approaches; (ii) contrast the strength of association among dry matter accumulation and resource use as interpreted from the two approaches; and (iii) discuss broader implications resulting from the choice of approaches and recommend that the research community refrain from the use of weak methods.
2. Materials and Methods
2.1. Research Site Characteristics and Crop and Soil Management
The experiments were conducted at the South-Central Agricultural Laboratory, Nebraska (U.S.A.) on a subsurface drip-irrigated field for the 2016 and 2017 growing seasons (2016–2017, and 2017–2018 for winter wheat). The soil at the site is a Hastings silt loam, well-drained upland soil (fine, montmorillonitic, mesic Udic Argiustoll) with 0.34 m3 m−3 field capacity, 0.14 m3 m−3 permanent wilting point, and 0.53 m3 m−3 saturation point [25]. The total available water holding capacity of the soil profile is 240 mm per 1.2 m. The particle size distribution is 15% sand, 65% silt, and 20% clay, with 2.5% organic matter content in the topsoil. The long-term average annual rainfall in the area is 680 mm, with significant annual and growing season variability in both magnitude and timing. To accommodate all the above mentioned crops within the extent of the experimental field, the field was divided in the N–S direction into smaller independent plots, each dedicated to a single crop grown in E–W rows. All four crops were fertilized appropriately and sufficiently, and herbicide, insecticide, and fungicide were applied uniformly when needed, aimed at optimal growing conditions. Non-water-stressed growth conditions were ensured by soil water status monitoring, and irrigation was initiated each time soil water depletion in crop root zone was 40–45%. In addition to nutrients and water, the experiment was intensively managed to ensure avoidance of any stresses from weeds, insects, and diseases. Additional details of crop establishment, site characteristics, and management can be gained from Kukal and Irmak [21,26,27].
2.2. Sampling Aboveground Biomass, Soil Water Flux, and Light Flux
Every 1–1.5 weeks starting <10 days after emergence until harvest, four quadrats of 1 m2 area were destructively sampled (randomly, avoiding border effects) for aboveground biomass, dried at 60 °C until constant weight, and dry matter was recorded for each crop. This will be referred to as AGB hereon. Kukal and Irmak [26] should be referred for detailed analyses and description of AGB dynamics across these crops for comparison.
Soil moisture was measured in all crops at multiple depths in the soil profile (0–0.15 m, 0.15–0.25 m, 0.25–0.40 m, 0.40–0.75 m, and 0.75–1.20 m) every 30 min using 4–6 capacitance-based John Deere (JD) Field Connect (John Deere Water, San Marcos, CA, USA) sensors. Depth-specific calibration functions [28,29] were used to correct any uncertainties in sensor-reported moisture.
Canopy light (PAR) interactions including incoming PAR at the top of the canopy (PARin), transmitted PAR through the canopy (PARtr), and reflected PAR from canopy and soil (PARref) were measured using sensors that were installed in each crop canopy for the entire growing seasons, sampling light data every minute continuously during the entire growing seasons. Incoming PARin was measured using a point quantum sensor (SQ-110-SS: Apogee Instruments Inc., Logan, UT, USA), due to its spatially static nature, whereas PARtr and PARref PAR fluxes were measured using line quantum sensors (SQ-316-SS: Apogee Instruments Inc., Logan, UT, USA) due to their spatially nonuniform nature. Kukal and Irmak [29] describe sensor specification, mounting details, and analysis of the light balance instrumentation in greater detail.
2.3. Quantification of Light and Water Use
2.3.1. Light Use (Absorbed PAR)
The fate of PARin can take three possible outcomes, depending on the surface characteristics. When these possible outcomes, described in Equation (1), are summed, they have to be equal to PARin, similar to a mass or energy balance:
where APAR is the quantity of light absorbed by the canopy to be used in photosynthesis. Additional details of the instrumentation, theory, and methodology are presented in [29].
PARin = PARtr + APAR + PARref
2.3.2. Water Use (Crop Evapotranspiration)
A general soil–water balance (represented by Equation (2)) was used to compute ETc as a residual from the closed equation.
where P is rainfall (mm), I is irrigation water applied (mm), R is surface runoff from the field (mm) computed using the United States Department of Agriculture (USDA)-Natural Resources Conservation Service (NRCS) curve number method [30], ΔSW is the change in soil moisture storage in the soil profile between the beginning and end of the growing season (mm), and D is the deep percolation (mm) below the crop root zone estimated by the daily soil–water balance approach using the two-step approach using a computer program that was written in Microsoft Visual Basic [31,32]. Additional details of the water balance methodology and its components are presented in [21].
ETc = P + I − R − D ± ΔSW
2.4. LUE and WUE Estimation Approaches
Approach 1: This extensively used approach utilized cumulated values (across successive sampling events) of AGB and (1) APAR; and (2) ETc in a linear regression. The slope of this relationship was interpreted as LUE (LUE1) and WUE (WUE1), respectively.
Approach 2: This limitedly used approach relied on independent values (incremental gain in productivity and resource use between sampling intervals) of AGB and (1) APAR; and (2) ETc in a linear regression. The slope of this relationship was interpreted as LUE (LUE2) and WUE (WUE2), respectively.
3. Results and Discussion
3.1. Nature of Correlation among Dry Matter and Resource Use
Under Approach 1, AGB and cumulated APAR were strongly correlated (R2 > 0.93; left panel of Figure 1). However, when a gain in AGB and APAR corresponding to the gain were regressed under Approach 2 (right panel of Figure 1), the correlation was considerably lower. This was also true for WUE estimated using Approaches 1 and 2 (Figure 2), although the R2 values were lower by a greater degree under Approach 2 when estimating WUE. This decreased level of association under Approach 2 has been previously reported in the literature, although only in the context of LUE. Demetriades-Shaw et al. [9] found low correlations (R2 < 0.32) among crop growth rates (CGR) and light interception rate in sugar beets, tall-grass prairie, sorghum, sunflower, and soybean, which otherwise were highly correlated under Approach 1, and hence stated that the use of cumulated data has logical and arithmetical weaknesses. Mitchell et al. [23] and Lindquist et al. [22] found similar inconsistencies when quantifying rice and maize LUE, respectively, using cumulated and independent data. Thus, past research as well as evidence reported in this research establish that the perceived excessive emphasis placed on the strong correlation among AGB and APAR (or IPAR)/ETc is oversimplistic and results from biased analysis procedures (such as Approach 1). Subseasonal environmental variability and plant physiological factors highly impact LUE and WUE, and Approach 1 veils such impacts and oversimplifies the challenging task of quantifying sensitivity of carbon assimilation to resource use.
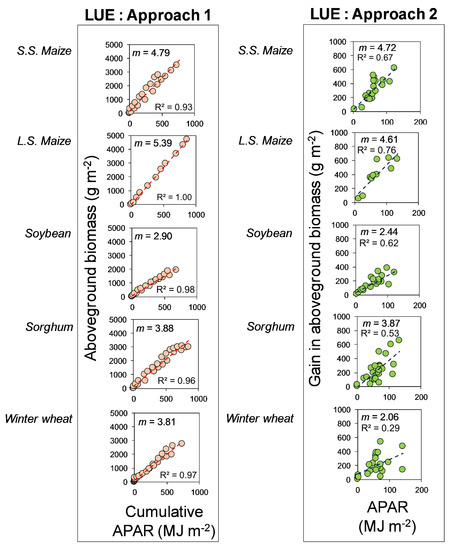
Figure 1.
Light use efficiency (LUE) in S.S. maize, L.S. maize, soybean, sorghum, and winter wheat obtained using Approach 1 (left panel) and Approach 2 (right panel). The slopes (m) of these relationships represent LUE estimates derived using Approach 1 (red trendline) and Approach 2 (blue trendline), respectively. The number of observations were 20, 12, 23, 25, and 23 for S.S. maize, L.S. maize, soybean, sorghum, and winter wheat, respectively.
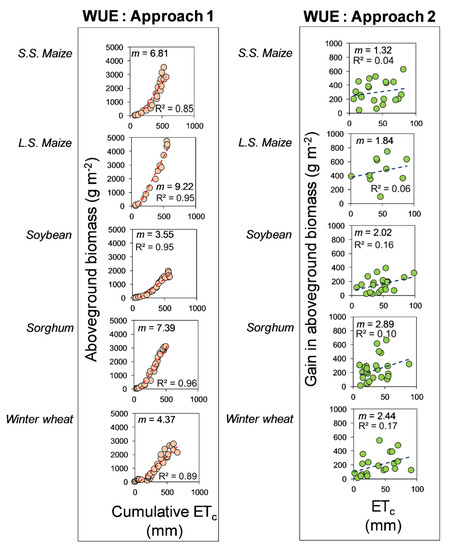
Figure 2.
Water use efficiency (WUE) in S.S. maize, L.S. maize, soybean, sorghum, and winter wheat obtained using Approach 1 (left panel) and Approach 2 (right panel). The slopes (m) of these relationships represent WUE estimates derived using Approach 1 (red trendline) and Approach 2 (blue trendline), respectively. The number of observations were 20, 12, 23, 25, and 23 for S.S. maize, L.S. maize, soybean, sorghum, and winter wheat, respectively.
The correlations among AGB versus APAR, and AGB versus ETc found under Approach 2, although lower than that under Approach 1, imply that APAR and ETc are responsible for explaining appropriate and realistic portions of the variability in AGB, which vary from low (0.04–0.29) to moderate (0.53–0.76) magnitudes. This is in contrast to Approach 1, where both APAR and ETc show a near-perfect explanation of variability in AGB, which is a theoretical fallacy, as two resources simultaneously cannot explain the entire variance in AGB. This interpretation can be misleading, as it confounds the true relative importance of APAR and ETc as drivers of AGB, and thus due to dangers of flawed interpretation, use of Approach 1 should ideally be terminated in biological–environmental research.
We find that, overall, APAR was a larger driver of AGB gain than ETc, as, on average, R2 from AGB gain versus APAR analysis was 706% greater than that from AGB gain versus ETc analysis. Specifically, this relatively greater importance of APAR than ETc was the highest in S.S. maize (1575%), followed by L.S. maize (1167%), sorghum (430%), soybean (288%), and winter wheat (71%). This might be due to three primary reasons. Firstly, since crop productivity was not limited by any inputs, crop performance was near full potential, and hence, governed largely by light absorption. Secondly, resolving soil–water balance is certainly more challenging than light balance, given the uncertainties associated with quantification of surface runoff, deep percolation, and soil-water storage, thus confounding ETc. Third, our representation of crop water use term considers ETc, which, due to inclusion of the nonbeneficial evaporation component, does not result in proportional carbon assimilation. The relative importance of APAR and ETc cannot be discerned under Approach 1, and hence, brings out the sophistication and value of Approach 2.
The differences in relative importance of APAR and ETc across the four crops stem from contrasting crop characteristics responsible for varying levels of water and light use during crop growth stages. Specifically, these underlying crop characteristics are photosynthetic pathway mechanisms (C3, C4), phylogenetic affinity (monocots, dicots), canopy architecture and geometry (spherical, heliotropic), leaf angle distribution (erectophile, planophile), ground cover fraction, and leaf morphology.
3.2. Confounding Estimates of RUE
Mean seasonal LUE and WUE estimates from both Approaches 1 and 2 (Figure 1 and Figure 2) and are referred to as LUE1 and LUE2, and WUE1 and WUE2, respectively. Approach 1 yielded greater LUE and WUE estimates than Approach 2 for all crops. LUE1 was 1.5%, 16.9%, 18.9%, 0.3%, and 85% greater than LUE2 for S.S. maize, L.S. maize, soybean, sorghum, and winter wheat, respectively. WUE showed more pronounced differences, with WUE1 being 416%, 401%, 76%, 156%, and 79% greater than WUE2 for S.S. maize, L.S. maize, soybean, sorghum, and winter wheat, respectively. This is evidence that choice of the estimation approach yields significantly different LUE and WUE. Ideally, the slope of the regression analyses of AGB and APAR/ETc should convey the sensitivity of AGB to light and water consumption, i.e., the amount of AGB produced per unit MJ of APAR, and per unit mm of ETc, respectively. LUE1 and WUE1 fail to convey these quantities as the cumulation process renders the data unfit for such a quantification by ignoring or deflating the intersampling variability recorded in AGB and APAR/ETc. The framework of Approach 2 avoids this issue by preserving the intersampling variability in data sampling, and hence, LUE2 and WUE2 are accurate measures of AGB sensitivity to APAR/ETc.
As a result of preserving intersampling variability in data under Approach 2, LUE2 and WUE2 showed 488% and 375% greater standard errors (SE) relative to LUE1 and WUE1, respectively. Lindquist et al. (2005) showed 163% greater SE for maize LUE when using independent data relative to cumulated data, but both approaches produced the same LUE estimates, similar to our findings for sorghum. Overall, we established that the cumulated Approach 1 results in RUE overestimation as well as low-but-false uncertainties (SE). Moreover, Approach 1 is vulnerable to error propagation into successive data due to cumulation process, even if one sampling event is biased, negatively impacting accurate RUE estimation.
For four crop species, we confirm that the usage of cumulated data for dry matter and resource use was misleading, and the high correlation perceived is a statistical artefact. It has been shown that any cumulated quantity yielded equally high correlations, even when no physical relationship existed with crop biomass, or simply were random numbers [9]. This discrepancy has been further mathematically highlighted using a theorem, and verified using a case study of greenhouse-grown tomatoes [11], concluding that cumulated variables should be avoided in bioenvironmental relationships. There has been significant consensus on this issue [9,33,34], although research practice has not paid heed.
4. Conclusions
We found that: (a) a cumulated approach leads to perceived strong correlation among dry matter and resource use, which is inaccurate and misleading; and (b) cumulated and independent approaches result in largely dissimilar LUE and WUE estimates, with the former yielding overestimates. Use of cumulated data, which has continued despite strong evidence dating back at least 25 years, leads to false confidence in RUE estimates and can significantly hinder accurate assessments of crop resource use. Empirical estimates of LUE and WUE are extensively used in “growth-engines” of crop models [35,36,37,38,39,40] to predict crop performance and resource use, that are consequently used in practical applications and policy development. Thus, error propagation from flawed LUE and WUE estimates into crop modeling-based assessments needs to be evaluated in the future. Via this research, we underscore the importance of independent approaches in bioenvironmental research by demonstrating their success in the context of LUE and WUE in four major US row crops for broad visibility and impact. Overall, we aim to redirect the attention of the scientific community to deter from using arithmetically weak LUE and WUE estimation methods.
Author Contributions
M.S.K. and S.I. conceptualized the study, and M.S.K. conducted field data collection under S.I.’s supervision. M.S.K. and S.I. contributed to discussions and interpretation of the results. M.S.K. compiled datasets and created figures in close consultation and discussions with S.I. M.S.K. drafted the first version of the manuscript and S.I. conducted detailed review and revisions. S.I. obtained grant funding for the research. The work presented in this manuscript was included as part of the first author’s Ph.D. study while he was a graduate student in the Irmak Research Laboratory at the University of Nebraska-Lincoln under the supervision of S.I. All authors have read and agreed to the published version of the manuscript.
Funding
This study is based upon the work that is supported by the National Institute of Food and Agriculture, U.S. Department of Agriculture, Hatch Project, under Professor Suat Irmak’s Project Number NEB-21-167.
Conflicts of Interest
The authors declare no conflict of interest. The funders had no role in the design of the study; in the collection, analyses, or interpretation of data; in the writing of the manuscript, or in the decision to publish the results.
References
- Lobell, D.B.; Hicke, J.A.; Asner, G.P.; Field, C.B.; Tucker, C.J.; Los, S.O. Satellite estimates of productivity and light use efficiency in United States agriculture, 1982–1998. Glob. Chang. Biol. 2002, 8, 722–735. [Google Scholar] [CrossRef]
- Schwalm, C.R.; Black, T.A.; Amiro, B.D.; Arain, M.A.; Barr, A.G.; Bourque, C.P.; Dunn, A.L.; Flanagan, L.B.; Giasson, M.; Lafleur, P.M. Photosynthetic light use efficiency of three biomes across an east–west continental-scale transect in canada. Agric. For. Meteorol. 2006, 140, 269–286. [Google Scholar] [CrossRef]
- Huang, M.; Piao, S.; Sun, Y.; Ciais, P.; Cheng, L.; Mao, J.; Poulter, B.; Shi, X.; Zeng, Z.; Wang, Y. Change in terrestrial ecosystem water-use efficiency over the last three decades. Glob. Chang. Biol. 2015, 21, 2366–2378. [Google Scholar] [CrossRef] [PubMed]
- Yang, Y.; Guan, H.; Batelaan, O.; McVicar, T.R.; Long, D.; Piao, S.; Liang, W.; Liu, B.; Jin, Z.; Simmons, C.T. Contrasting responses of water use efficiency to drought across global terrestrial ecosystems. Sci. Rep. 2016, 6, 23284. [Google Scholar] [CrossRef] [PubMed]
- Kukal, M.S.; Irmak, S. Spatial and temporal changes in maize and soybean grain yield, precipitation use efficiency, and crop water productivity in the US Great Plains. Trans. ASABE 2017, 60, 1189–1208. [Google Scholar] [CrossRef]
- Boote, K.J.; Jones, J.W.; Pickering, N.B. Potential uses and limitations of crop models. Agron. J. 1996, 88, 704–716. [Google Scholar] [CrossRef]
- Jones, J.W.; Hoogenboom, G.; Porter, C.H.; Boote, K.J.; Batchelor, W.D.; Hunt, L.A.; Wilkens, P.W.; Singh, U.; Gijsman, A.J.; Ritchie, J.T. The DSSAT cropping system model. Eur. J. Agron. 2003, 18, 235–265. [Google Scholar] [CrossRef]
- Steduto, P.; Hsiao, T.C.; Raes, D.; Fereres, E. AquaCrop—The FAO crop model to simulate yield response to water: I. concepts and underlying principles. Agron. J. 2009, 101, 426–437. [Google Scholar] [CrossRef]
- Demetriades-Shah, T.H.; Fuchs, M.; Kanemasu, E.T.; Flitcroft, I.D. A note of caution concerning the relationship between cumulated intercepted solar radiation and crop growth. Agric. For. Meteorol. 1992, 58, 193–207. [Google Scholar] [CrossRef]
- Demetriades-Shah, T.H.; Fuchs, M.; Kanemasu, E.T.; Flitcroft, I.D. Further discussions on the relationship between cumulated intercepted solar radiation and crop growth. Agric. For. Meteorol. 1994, 68, 231–242. [Google Scholar] [CrossRef]
- Malet, P.; Pécaut, F.; Bruchou, C. Beware of using cumulated variables in growth and development models. Agric. For. Meteorol. 1997, 88, 137–143. [Google Scholar] [CrossRef]
- Gou, F.; van Ittersum, M.K.; Simon, E.; Leffelaar, P.A.; van der Putten, P.E.; Zhang, L.; van der Werf, W. Intercropping wheat and maize increases total radiation interception and wheat RUE but lowers maize RUE. Eur. J. Agron. 2017, 84, 125–139. [Google Scholar] [CrossRef]
- Kemanian, A.R.; Stöckle, C.O.; Huggins, D.R. Variability of barley radiation-use efficiency. Crop. Sci. 2004, 44, 1662–1672. [Google Scholar] [CrossRef]
- Ceotto, E.; Di Candilo, M.; Castelli, F.; Badeck, F.; Rizza, F.; Soave, C.; Volta, A.; Villani, G.; Marletto, V. Comparing solar radiation interception and use efficiency for the energy crops giant reed (Arundo donax L.) and sweet sorghum (sorghum bicolor L. moench). Field Crops Res. 2013, 149, 159–166. [Google Scholar] [CrossRef]
- Van Roekel, R.J.; Purcell, L.C. Soybean biomass and nitrogen accumulation rates and radiation use efficiency in a maximum yield environment. Crop. Sci. 2014, 54, 1189–1196. [Google Scholar] [CrossRef]
- Caviglia, O.P.; Sadras, V.O. Effect of nitrogen supply on crop conductance, water-and radiation-use efficiency of wheat. Field Crop. Res. 2001, 69, 259–266. [Google Scholar] [CrossRef]
- Hatfield, J.L. Radiation use efficiency: Evaluation of cropping and management systems. Agron. J. 2014, 106, 1820–1827. [Google Scholar] [CrossRef]
- Fletcher, A.L.; Johnstone, P.R.; Chakwizira, E.; Brown, H.E. Radiation capture and radiation use efficiency in response to N supply for crop species with contrasting canopies. Field Crop. Res. 2013, 150, 126–134. [Google Scholar] [CrossRef]
- Singer, J.W.; Meek, D.W.; Sauer, T.J.; Prueger, J.H.; Hatfield, J.H. Variability of light interception and radiation use efficiency in maize and soybean. Field Crop. Res. 2011, 121, 147–152. [Google Scholar] [CrossRef]
- Narayanan, S.; Aiken, R.M.; Vara Prasad, P.V.; Xin, X.; Yu, J. Water and radiation use efficiencies in sorghum. Agron. J. 2013, 105, 649–656. [Google Scholar] [CrossRef]
- Kukal, M.S.; Irmak, S. Characterization of water use and productivity dynamics across four C3 and C4 row crops under optimal growth conditions. Agric. Water Manag. 2019, 227, 105840. [Google Scholar] [CrossRef]
- Lindquist, J.L.; Arkebauer, T.J.; Walters, D.T.; Cassman, K.G.; Dobermann, A. Maize radiation use efficiency under optimal growth conditions. Agron. J. 2005, 97, 72–78. [Google Scholar] [CrossRef]
- Mitchell, P.L. Potential yields and the efficiency of radiation use in rice. IRRI Discuss. Pap. Ser. 1998, 32, 62. [Google Scholar]
- Pradhan, S.; Sehgal, V.K.; Das, D.K.; Jain, A.K.; Bandyopadhyay, K.K.; Singh, R.; Sharma, P.K. Effect of weather on seed yield and radiation and water use efficiency of mustard cultivars in a semi-arid environment. Agric. Water Manag. 2014, 139, 43–52. [Google Scholar] [CrossRef]
- Irmak, S. Nebraska Water and Energy Flux Measurement, Modeling and Research Network (NEBFLUX). Trans. ASABE 2010, 53, 1097–1115. [Google Scholar] [CrossRef]
- Kukal, M.S.; Irmak, S. Comparative canopy growth dynamics in four row crops and their relationships with allometric and environmental determinants. Agron. J. 2019, 111, 1–18. [Google Scholar] [CrossRef]
- Kukal, M.S.; Irmak, S. Canopy Light Interactions, Use and Efficiency in Four Row Crops under Optimal Growth Conditions. Agric. For. Meteorol. 2020, 284, 107887. [Google Scholar] [CrossRef]
- Sharma, K.; Irmak, S.; Kukal, M.S.; Vuran, M.C.; Qiao, X. Evaluating Soil Moisture Sensing Technology in Silt Loam and Loamy Sand Soils: Assessment of Performance, Temperature Sensitivity, and Site- and Sensor-Specific Calibration Functions. Agric. Water Manag. 2020. in review. [Google Scholar]
- Zhu, Y.; Irmak, S.; Jhala, A.J.; Vuran, M.C.; Diotto, A. Time-domain and frequency-domain reflectometry type soil moisture sensor performance and soil temperature effects in fine-and coarse-textured soils. Appl. Eng. Agric. 2019, 35, 117–134. [Google Scholar] [CrossRef]
- United States Department of Agriculture-USDA. National Engineering Handbook: Part 630-Hydrology. Estimation of Direct Runoff from Rainfall; United States Department of Agriculture-USDA: Washington, DC, USA, 2004.
- Payero, J.O.; Tarkalson, D.D.; Irmak, S.; Davison, D.; Petersen, J.L. Effect of timing of a deficit-irrigation allocation on corn evapotranspiration, yield, water use efficiency and dry mass. Agric. Water Manag. 2009, 96, 1387–1397. [Google Scholar] [CrossRef]
- Bryant, K.J.; Benson, V.W.; Kiniry, J.R.; Williams, J.R.; Lacewell, R.D. Simulating corn yield response to irrigation timings: Validation of the EPIC model. J. Prod. Agric. 1992, 5, 237–242. [Google Scholar] [CrossRef]
- Monteith, J.L. Validity of the correlation between intercepted radiation and biomass. Agric. For. Meteorol. 1994, 68, 213–220. [Google Scholar] [CrossRef]
- Arkebauer, T.J.; Weiss, A.; Sinclair, T.R.; Blum, A. In defense of radiation use efficiency: A response to Demetriades-Shah et al. (1992). Agric. For. Meteorol. 1994, 68, 221–227. [Google Scholar] [CrossRef]
- Albrizio, R.; Steduto, P. Resource use efficiency of field-grown sunflower, sorghum, wheat and chickpea: I. Radiation use efficiency. Agric. For. Meteorol. 2005, 130, 254–268. [Google Scholar] [CrossRef]
- Brisson, N.; Gary, C.; Justes, E.; Roche, R.; Mary, B.; Ripoche, D.; Zimmer, J.; Sierra, J.; Bertuzzi, P.; Burger, P. An overview of the crop model STICS. Eur. J. Agron. 2003, 18, 309–332. [Google Scholar] [CrossRef]
- Jones, C.A.; Dyke, P.T.; Williams, J.R.; Kiniry, J.R.; Benson, V.W.; Griggs, R.H. EPIC: An operational model for evaluation of agricultural sustainability. Agric. Syst. 1991, 37, 341–350. [Google Scholar] [CrossRef]
- Jones, C.A.; Kiniry, J.R.; Dyke, P.T. CERES-Maize: A Simulation Model of Maize Growth and Development; Texas A&M University Press: College Station, TX, USA, 1986. [Google Scholar]
- Steduto, P.; Albrizio, R. Resource use efficiency of field-grown sunflower, sorghum, wheat and chickpea: II. Water use efficiency and comparison with radiation use efficiency. Agric. For. Meteorol. 2005, 130, 269–281. [Google Scholar] [CrossRef]
- Stöckle, C.O.; Donatelli, M.; Nelson, R. CropSyst, a cropping systems simulation model. Eur. J. Agron. 2003, 18, 289–307. [Google Scholar] [CrossRef]
© 2020 by the authors. Licensee MDPI, Basel, Switzerland. This article is an open access article distributed under the terms and conditions of the Creative Commons Attribution (CC BY) license (http://creativecommons.org/licenses/by/4.0/).