Life Cycle Assessment and Indoor Environmental Quality of Wooden Family Houses


Institute of Environmental Engineering, Faculty of Civil Engineering, Technical University of Košice, 04200 Košice, Slovakia
*
Author to whom correspondence should be addressed.
Sustainability 2020, 12(24), 10557; https://doi.org/10.3390/su122410557
Submission received: 7 November 2020
/
Revised: 9 December 2020
/
Accepted: 14 December 2020
/
Published: 17 December 2020
(This article belongs to the Special Issue Sustainable Development of Energy, Water and Environment Systems (SDEWES))
Abstract
:This article analyzes in detail the impact of wooden houses on the environment using the life cycle assessment (LCA) methodology and at the same time evaluates the indoor environmental quality (IEQ) in these houses. The investigated detached family houses had a wooden structure. The first one had a bearing system made of a wooden frame; other materials were conventional. The second house was built entirely of log wood. Given the high risk of greenhouse gas emissions, the concentration of which in the atmosphere is causing global climate change, the global warming potential (GWP) indicator is crucial. According to results, the family house built entirely of wood and with a biomass boiler significantly reduces CO2 emissions and is therefore considered from the LCA point of view as a more suitable alternative compared to a house with a wooden frame structure. The building materials with the highest share involved in the creation of GWP include concrete structures (38–48%), ceramic roof tiles (33%) and plasterboard (15%). Plasterboard cladding (55%), concrete structures (17–19%), oriented strand board OSB (9–22%), impregnated wooden structures (31–52%) and plastic windows (9%) are the most involved in acidification potential (AP) and eutrophication potential (EP). Plasterboard structures (21%), impregnated wood materials (47.4%), reinforced concrete structures (12%) and mineral wool and roof tiles significantly contribute to the creation of photochemical ozone creation potential (POCP) and ozone depletion potential (ODP). The indoor environmental quality was evaluated through short-term measurements of basic physico-chemical parameters. Since both houses have different characteristics, the aim of this monitoring was to evaluate the actual state of IEQ in selected wooden houses under real conditions. Based on the recorded results, it can be stated that neither presented wooden house, in terms of thermal-humidity microclimate, concentration of CO2 and particulate matter, represents an environment with a negative impact on their occupants. With regards to volatile organic compounds (VOCs), the increased concentrations of xylenes and tetrachlorethylene in the log house were probably caused by the application of impregnation and protective coatings six months before monitoring. In this case, the concentration of tetrachloroethene, which is considered a potential carcinogen, was six times higher than the legislative limit. For VOCs, such as limonene, isobutylene and n-butylacetate, which were found in the wooden frame house, no limits are set. The legislative limits for xylenes and tetrachlorethylene in this house have not been exceeded, and therefore the IEQ cannot yet be considered harmful for health. The presence of all the mentioned VOCs in the interior air of the wooden frame house is more related to the activities of occupants, as this house has been inhabited for several years.
1. Introduction
Recently, the building industry has seen a significant return to houses made of natural wood materials [1]. In general, wood is considered to be one of the most environmentally friendly materials because it has a negative balance of CO2 emissions compared to metals, cement, steel and concrete [2]. At the same time, it can absorb harmful substances from the environment, regulates humidity in the building, has low heat absorption and unquestionable thermal insulation properties, and its construction is fast and dry. The number of houses with wooden construction is growing as much as possible in increasingly novel versions, also because their features and low energy consumption do not burden the environment—neither during the construction phase nor during its use [3]. In the context of continuous environmental improvement processes, building life cycle assessment (LCA) is a useful tool for comparing the environmental footprint of building structures [4]. Life cycle assessment of a wooden family house in the study of Petrovic et al. demonstrates the impact of a building material on the environment from its production and construction phase, including transport, replacement and deconstruction phase [5]. The results of this study show that the choice of wood-based materials has a significantly lower impact on CO2 emissions compared to non-wood-based materials. A comparative study of the LCAs of different wooden and mineral buildings and methods for calculating substitution factors at the building level has shown that there is a positive potential for reducing greenhouse gas emissions when using wooden building materials instead of mineral materials [6]. In addition to building-wide LCA studies, many LCA analyses focused on specific building systems, material options and environmental technologies [7,8,9,10,11,12,13] and found that concrete is the largest contributor in all impact categories except abiotic depletion; with wall systems, floors and foundations they also make a significant contribution to the environmental burden. An overall LCA comparison of the two houses (wooden and brick) showed that materials for the construction of wooden houses have a less negative impact on the environment than materials for the construction of brick houses. The results using the global warming potential (GWP) method show that materials for the construction of a brick house (ceramic masonry, mineral wool insulation) leave in the environment twice the carbon footprint as materials for a wooden house (wood, fiber insulation) [14]. As reported by Pajchrowski et al., however, the advantages of using wood in construction do not only lie in its neutral carbon balance and the possibility of recovering energy by combustion; the analyses performed also showed benefits in other phases of the life cycle of buildings such as transport, construction sites and demolition. The only shortcoming in the use of wood is the need to perform more frequent protective and renovation activities (painting, impregnation) during the use of the building and almost double the use of impregnations and paints associated with it. These activities also have environmental consequences in terms of the production of these materials and the disposal of waste [15]. From the point of view of sustainability, it is necessary to limit the use of materials with high energy inputs in production and to exclude materials that have an adverse effect on the health of users. Therefore, it is important to find a balance between the construction industry and the environment so that they can coexist. The environmental impacts of the construction of a current conventional building are about as great as the environmental impacts associated with operating a passive house for 100 years. It is also necessary to think about minimizing transport demands and reducing the amount of construction waste by recycling it and reusing it in construction. Local, recycled and natural materials such as wood, stone, clay plaster, linoleum, wooden floors, flax, hemp, cork, pulped wood or cellulose should be used to a greater extent [16,17].
In addition to the impact of wooden buildings on the environment, it is important to assess the impact of the quality of the indoor environment of these buildings on the occupants themselves. According to a study by Sviták et al., wooden buildings provide a better indoor environment in terms of CO2 concentration and relative humidity compared to conventional buildings [18]. However, a significant difference can be observed in the case of volatile organic compounds, which are found in the indoor environment of wooden buildings to a much greater extent compared to houses with traditional construction. They are released into the air mostly in the form of emissions from varnishes and other wood preservatives. According to several studies, compared to conventional houses, higher concentrations of individual VOCs occur only in new wooden buildings. Long-term measurements have shown that these elevated concentrations of VOCs tend to gradually decrease over time [19,20]. The study according to Čech et al. further emphasizes that, in addition to relative humidity, the type of heating is likely to have an effect on the total VOC concentrations in the indoor air. The highest VOC concentrations were demonstrated in the log building, where a tiled furnace placed in the monitoring room was used as a heating source [21].
This work deals with the evaluation of the impact of wooden buildings on the environment using LCA analysis. Although there are still few studies in Slovakia focusing on indoor air quality in wooden houses, the aim of this work is also to evaluate whether wooden houses provide a healthy indoor environment by examining their basic physical and chemical parameters, which include operating temperature, relative humidity, air velocity, concentrations of measured particulate matter fractions, selected volatile organic compounds and CO2.
2. Materials and Methods
2.1. Objects
Both assessed wooden houses are situated in the east of Slovakia. The wooden frame house is located in the village of Rozhanovce and was built in 2006. The log house is situated in the village of Štós and was built in 2018. Views of both wooden houses are shown in Figure 1. Table 1 shows the basic characteristics of selected wooden houses.
The wooden frame house is two-storey, non-basement, with a saddled roof with a dormer. The ground floor consists of an entrance hall, boiler room and a large open space in which there is a living room with kitchen and staircase. On the second floor, there are four rooms, a hallway and a bathroom. The external walls are made of a wooden frame structure covered with plasterboard from the interior side and OSB boards from the exterior. They are insulated with mineral wool and plastered with lime-cement plaster from the inside and silicone plaster from the outside. Internal partitions are built of autoclaved aerated concrete. The horizontal structures are formed by a wooden bearing ceiling above the ground floor. The roof construction is saddle-shaped with ceramic roof tiles. The thermal insulation is made of mineral wool. The plasterboard is hung in the ceiling. All wooden structures were coated with impregnating coatings against wood-destroying fungi, molds and insects. These coatings generally consist of a complex mixture with active ingredients such as tebuconazole, 3-iodprop-2-inyl-butylcarbamate and permentin. The foundation structures are made of concrete. Plinth masonry is insulated with XPS insulation. The floor on the ground is insulated with extruded polystyrene EPS and covered with laminate and ceramic tiles. Transparent constructions are plastic with insulating double glazing. The family house is connected to the public network of electrical system, water supply and drainage. The water is brought into the building by water-service pipe HDPE DN 25. The PVC DN 150 sewer connection drains the sewage water. The source of heating space and hot water is a gas turbo boiler.
The family log house is one-storey, non-basement, with a residential attic. On the ground floor, there is a living room with kitchen, bathroom, boiler room, balcony and stairs to the attic. In the attic, there are three rooms and a hallway. The external walls as well as the partition are made of wooden logs with a diameter of 32–35 cm. The perimeter walls are insulated with sheep wool insulation and lined with wood cladding. The foundation structures consist of concrete strips in the above-ground part formwork blocks up to a height of 50 cm. Macadam is compacted under the base plate. The tread layer comprises ceramic tiles and wooden boards. The roof construction is saddle-shaped and clad with ceramic roof tiles. The thermal insulation is made of cellulose. The ceiling is covered with wooden boards. Envelope structures of the evaluated houses are also insulated with suitable waterproofing materials against ground moisture and rainwater. All wooden constructions were coated with impregnating coatings, which consist of a complex mixture with the following active ingredients 2-methyl-2H-isothiazol-3-one, propiconazole, 3-iodo-2-propynylbutylcarbamate and 5-chloro-2-methyl-2H-isothiazole -3-one. The family house is only connected to the public network of the electrical system. Water is supplied to the building via HDPE pipe DN 25 from a drilled well. Sewage water is drained through a PVC connection DN 150 into the sewer sump. The source of the heating space and hot water is a solid fuel boiler and tile stove.
2.2. Methods
2.2.1. Life Cycle Assessment
The environmental performance of both wooden houses was calculated using the LCA assessment method within the “cradle to grave” boundaries based on EN 15978. LCA is an analytical method for assessing the potential environmental impacts associated with the life cycle of a product. In other words, the LCA includes all steps that lead from raw materials to industrial products, including material extraction, energy consumption, manufacturing, transportation, use, recycling and final disposal or end of life. It is a holistic methodology that quantifies how a product or process affects climate change, non-renewable resources and the environment as a whole. The essence of LCA is explained in detail in the standard EN ISO 14040–44. The aim of our analysis was to assess the environmental impact of the global warming potential (GWP), ozone depletion potential (ODP), acidification potential (AP), eutrophication potential (EP), photochemical ozone creation potential (POCP), abiotic depletion potential—elements (ADPE), abiotic depletion potential—fossil fuels (ADPF), use of renewable primary energy resource as energy source (PERE), use of renewable primary energy resource, as raw materials (PERM), use of non-renewable primary energy resource, as energy source (PENRE), net use of fresh water (FW), hazard waste (HWD), components for reuse (CRU), materials for recycling (MFR), materials for energy recovery (MER), non-hazardous waste (NHWD) and radioactive waste (RWD) (expressed as kilograms of CO2eq, CFC11eq, SO2eq, PO43−eq, C2H4eq, kg Sbeq, MJ, MJ, MJ, MJ, m3, kg, kg, kg, kg, kg and kg) respectively. In accordance with the methodology CML-IA v4.5, the software eToolLCD [22] was used to evaluate LCA.
GHG emissions from final energy consumption are calculated for the energy-related activity sector by multiplying the activity data by the emission factor per energy carrier (Equation (1)) [23]:
For this case, the activity data refers to energy consumption. The emission factor is defined as the average emission rate of a given GHG for a given source, relative to units of activity, expressed in t CO2eq/MWh [23]. Emissions of CO2eq for combustion by firewood (log house) were determined by using emission factor 0.416 according to document [24]. The demand for heating and hot water was multiplied by this emission factor.
The reference period for LCA was 60 years. The functional unit in this study is defined as one square meter of a fully enclosed floor area per life cycle period. Selected assessed phases are depicted and described in Figure 2.
2.2.2. Indoor Environmental Quality
Indoor air quality was assessed under real conditions without disturbing the natural home routine of their occupants. Monitoring and sampling indoor environmental quality (IEQ) devices were located in both houses approximately in the middle of the room at a height of 1.1 m above the floor. All measurements were performed for one hour, in a selected room (living room), where its occupants spend the most time together. During the measurement, there were three adults in the monitoring room in the wooden frame house and one adult in the log house. The values of air temperature, relative humidity, air velocity and CO2 concentration were recorded using a TESTO 435-4 multifunction measuring instrument with appropriate probes (Testo 435, Testo AG, Lenzkirch, Germany) at one-minute intervals. Particulate matter (PM) concentrations were measured over the entire 0.5 to 10 micrometer fraction range using a HANDHELD 3016 IAQ meter (Lighthouse Worldwide Solutions, Inc., Fremont, CA, USA) also at one-minute intervals. Vernon-Jokl globe thermometer was used for measurement of mean radiant temperature. The AirCheck 2000 sampling pump was used to collect selected VOCs in the air. Sampling was performed for 8 h. An air sample was collected onto an Anasorb CSC sampling tube. After sampling, the sample was analyzed in an accredited laboratory by gas chromatography. The quality of the indoor air in both houses was examined in the cold period during the heating season.
3. Results and Discussion
3.1. Results of Life Cycle Assessment
The life cycle impact assessment (LCIA) results for assessed houses are shown in Table 2 and Table 3. The colored cells in the tables indicate the rate of environmental impact categories in the research phase of the life cycle. The product phase (A1–A3), the integrated operational energy (B6) and the refurbishment (B5) of the use stage, and the information module—disposal (C4) of the end of life phase, are the highest contributors to environmental impact. Family houses built of natural materials are characterized by low and negative CO2eq emissions in the product phase, whereas they have higher impact values in other categories of this phase (up to 50 percent of the entire life cycle in the wooden frame house). In the integrated operational energy module, the CO2eq amount is higher for a wooden frame house with gas boiler space and water heating. Log house has a significantly lower CO2eq value due to the usage of a solid fuel boiler. Wood reduces CO2eq emissions significantly taken into account its sequestration.
The log house has negative CO2 emissions, as it was built mostly of wooden materials, and we can count on the sequestration of wood. In the case of POCP, the log house shows a 13.7% increase in C2H4eq emissions compared to the wooden framed house. With the PERE potential, the increase is up to 90% higher, with the MER and CRU more than 50%. The impacts of ODP, FW, NHWD and RWD are approximately the same for both houses. Other impact categories show higher values for wooden frames house (from 23 to 74%). Given the high risk of greenhouse gas emissions, of which the higher concentration in the atmosphere causes global climate change, the GWP indicator is crucial. It is clear from Figure 3 and Figure 4. We can see that the operational energy phase (B6) at the main potential has the greatest environmental impacts from the whole life cycle of buildings. We can state that the log house is therefore a more suitable alternative. The total emissions of the wooden single-family house in study [5] are 6 kg CO2eq/m2 per year.
The product phase represents 30% of the total equivalent of CO2 emissions, while the maintenance and refurbishment part represents 37%. The water consumption, construction and end-of-life phase of the building have shown a small contribution to total greenhouse gas emissions (12%). Energy use during the operational energy phase of the house showed a lower environmental impact (21%) due to the Swedish electricity mix that is mostly based on energy sources with low carbon dioxide emissions. More than half of the energy used in Sweden comes from renewable energy sources. Hydropower (water) and bioenergy are the main energy sources in Sweden—hydropower mostly for electricity production and bioenergy for heating. The Swedish government’s energy policy also supports the production of electricity from wind, solar, geothermal or wave energy. Since 2012, Sweden and Norway have a certification system in place for the joint electricity market. Other research studies also point out that the family house built using natural green materials is characterized by negative emission of CO2 in the product stage [6,25,26]. The study [25] states that a family house from conventional materials shares the potential of GWP by 61% more compared to a wooden house, which is caused by the phase of operational energy (B6).
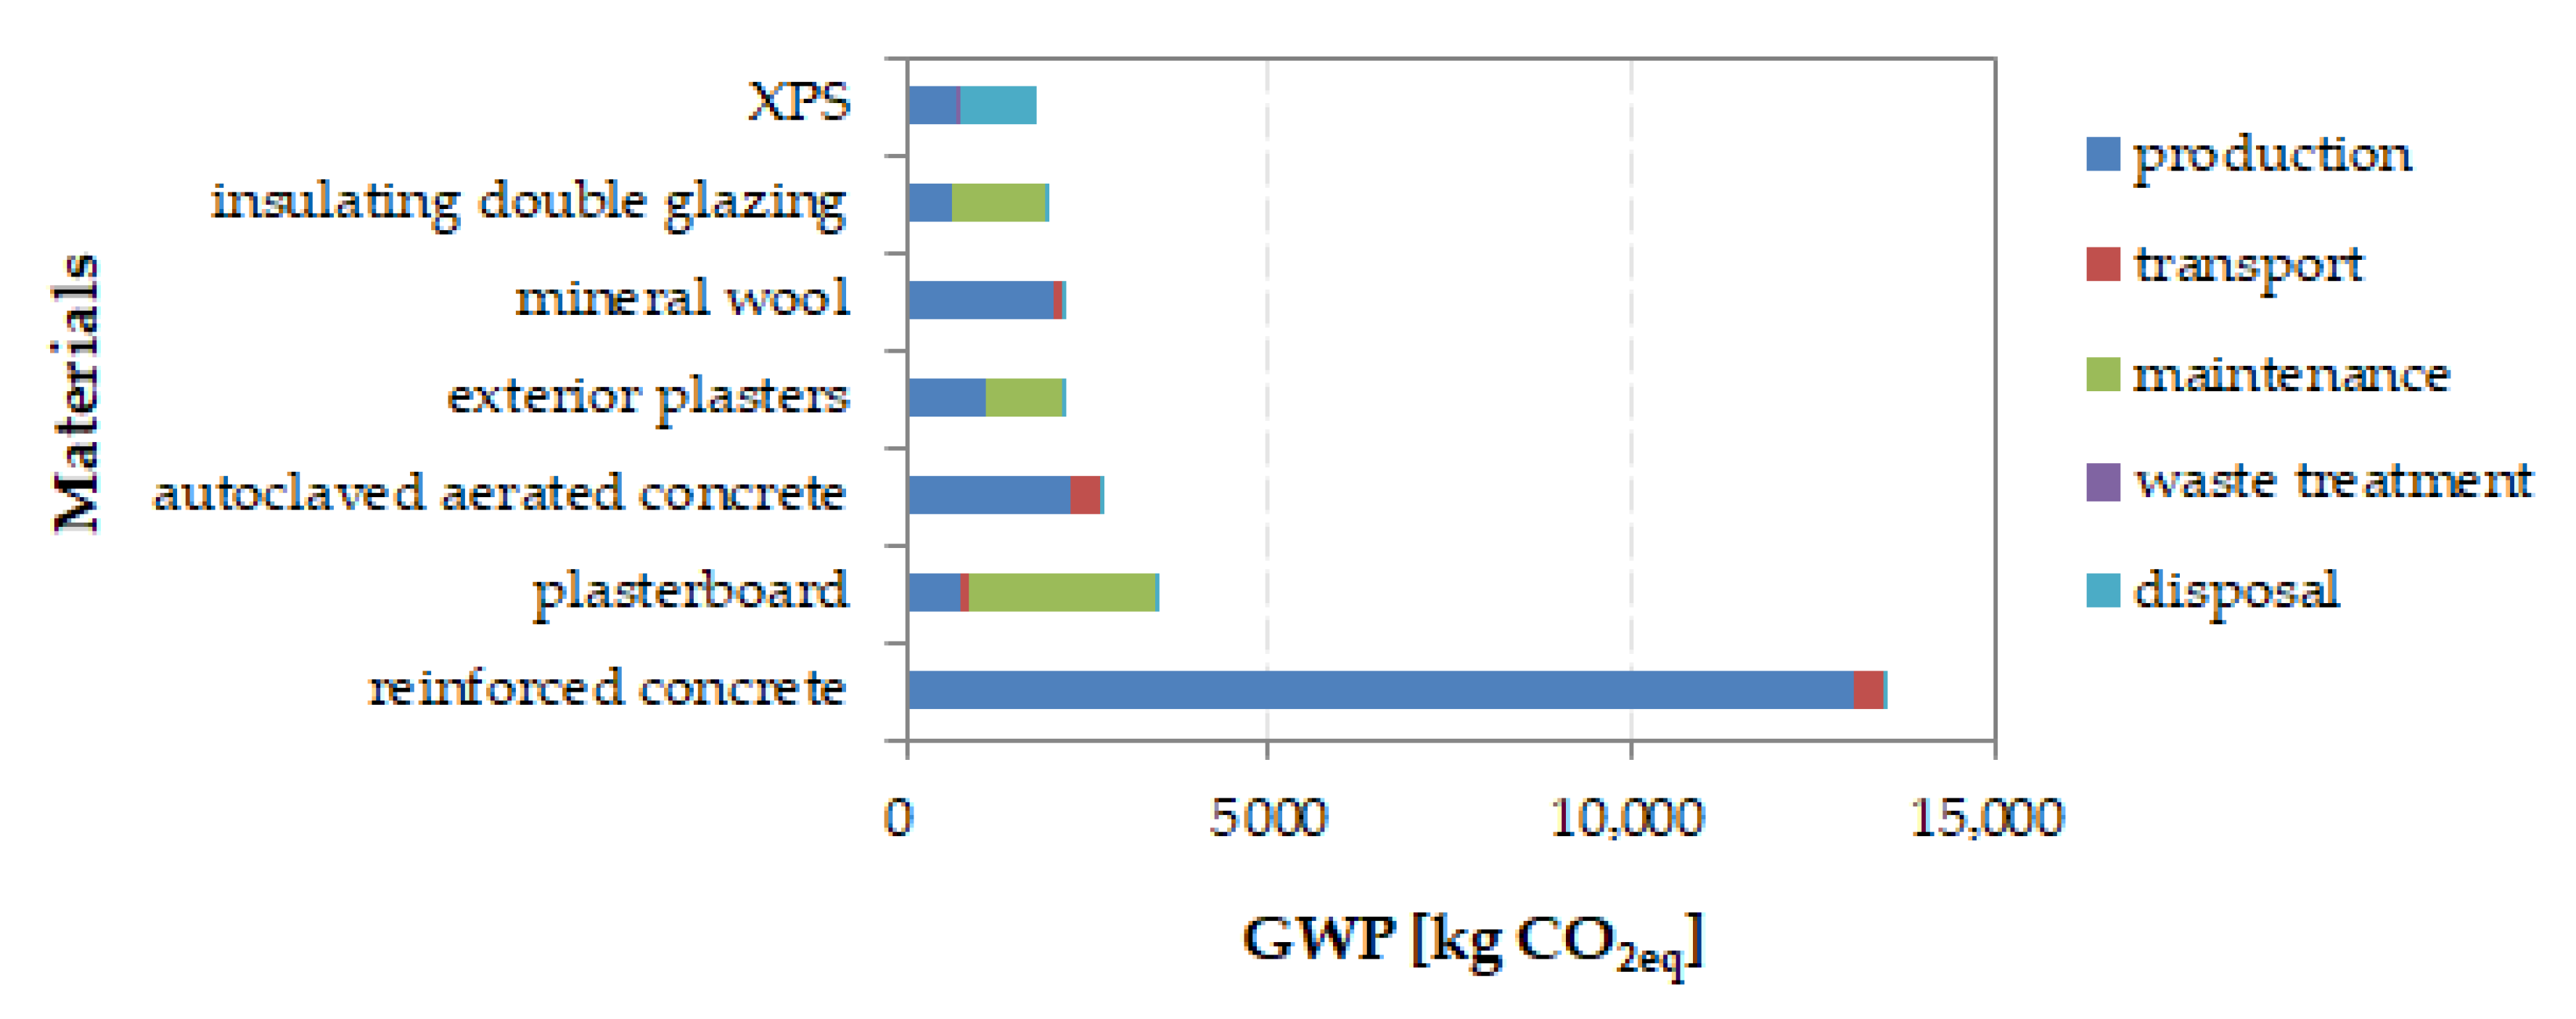
Figure 5 and Figure 6 depict the representation of building materials that are most involved in the creation of GWP. Concrete structures have the largest share in GWP. They represent 38–48% of all used materials. Ceramic roof tiles (33%) and plasterboard (15%) also have a high share. Other contributors to GWP are aerated concrete blocks, external plaster, mineral wool and XPS thermal insulation boards.
Figure 7, Figure 8, Figure 9 and Figure 10 illustrate the share of building materials in the creation of AP and EP, respectively. These are plasterboard cladding (55%), concrete structures (17–19%), OSB (9–22%), impregnated wooden structures (31–52%) and plastic windows (9%).
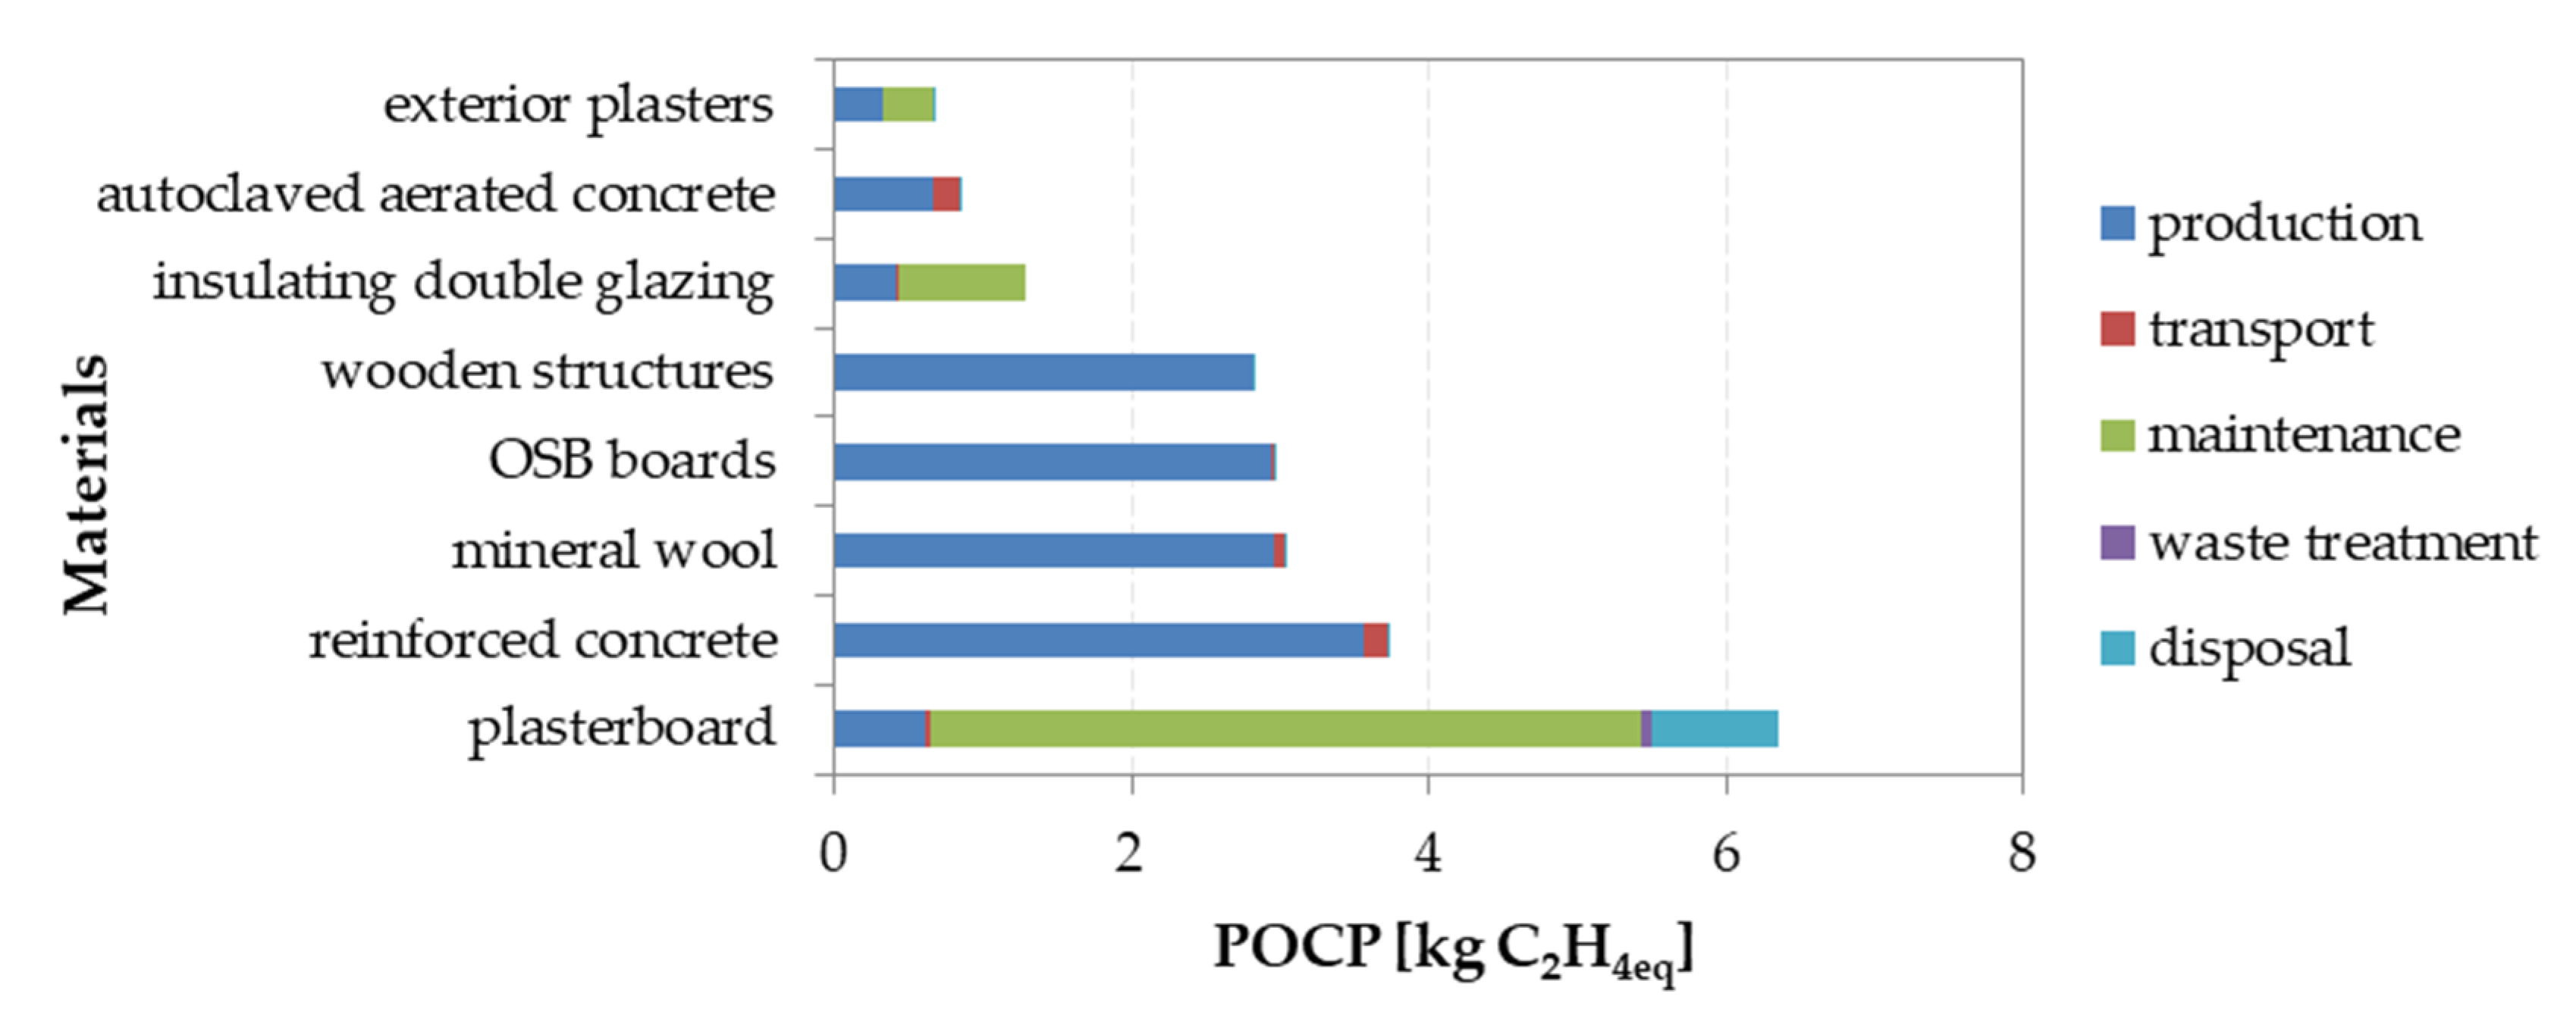
Figure 11, Figure 12, Figure 13 and Figure 14 depict the most significant contributions of building materials on the formation of ODP and POCP. According to the analysis, plasterboard structures (21%), impregnated wood materials (47.4%), reinforced concrete structures (12%) and mineral wool and roof tiles significantly contribute to the creation of POCP. These materials also have the highest percentage of ODP. Regarding POCP, the results of study [27] also suggest that the production of green pressed wood using green glue could reduce the formation of POCP by up to 50%.
In addition to these results, it can be pointed out that sheep wool and cellulose insulation, ceramic tiles and tinsmith products affect the formation of ADPE.
Finally, it can be stated that wooden buildings have a lower negative impact on the environment.
3.2. Results of Indoor Air Quality Measurements
Statistical evaluation of the measured data of the thermal-humidity microclimate, parameters, concentrations of CO2 and particulate matter (PM2.5 and PM10) is presented in Table 4. The results processed in this way were compared with the highest permissible values stated in the Decree of the Ministry of Health of the Slovak Republic No. 259/2008 and Decree No. 210/2016 [28,29].
The basic parameters evaluated within the thermal-humidity microclimate in the indoor environment are air temperature, operative temperature, relative humidity and air velocity. In the case of both wooden houses, the average measured values of all the above parameters were within the legislative limits. An exception was observed only for relative humidity values, which fluctuated around the lower legislative limit of 30%. According to the decree of the Ministry of Health, the values of relative humidity in the interior should be in the range of 30–70%. The indoor air temperatures in the log house were mostly constant and ranged from 23.5 °C to 23.8 °C. The temperatures in the wooden frame house ranged from 23.3 °C to 25 °C. These results indicate that the interior of this house began to slightly overheat. The opposite was noted in a similar study, where interiors were underheated in winter because homeowners preferred to limit the use of firewood due to costs [30]. As the measurements were performed in the cold season during the heating period, this fact was significantly reflected in the increased values of indoor temperatures and thus also in the reduced values of relative humidity. It should be noted that different heating sources were used in these two monitored houses, which also significantly affects the overall thermal comfort in the room. The operative temperature of the wooden frame house reached the value of 24.6 °C and that of the log house reached 23.7 °C. These values were within the optimal (22–26 °C) and permissible (20–27 °C) legislative limits. In both cases, the values of the air velocity also met the requirements set by legal regulations and did not exceed a value of 0.2 m/s.
The average hourly CO2 concentration in the wooden frame house with three people in a room was 866 ppm. Since there was only one adult in the log house during the measurement, the average CO2 concentration was 639 ppm. The course of CO2 concentrations in both monitored wooden houses is shown in Figure 15. The measurements were mostly performed with the windows and doors closed so that the air exchange was significantly reduced. A decree of the Ministry of Health of the Slovak Republic does not set a limit value for CO2 concentrations in indoor air. For this reason, the recommended value of 1000 ppm according to Pettenkofer was used as a limit value [31]. This recommended limit value for CO2 concentration, which does not yet cause discomfort, has not been exceeded in any of the monitored homes. In a French study, the weekly median CO2 levels in the two monitored energy-efficient homes during occupancy were below 840 ppm [31].
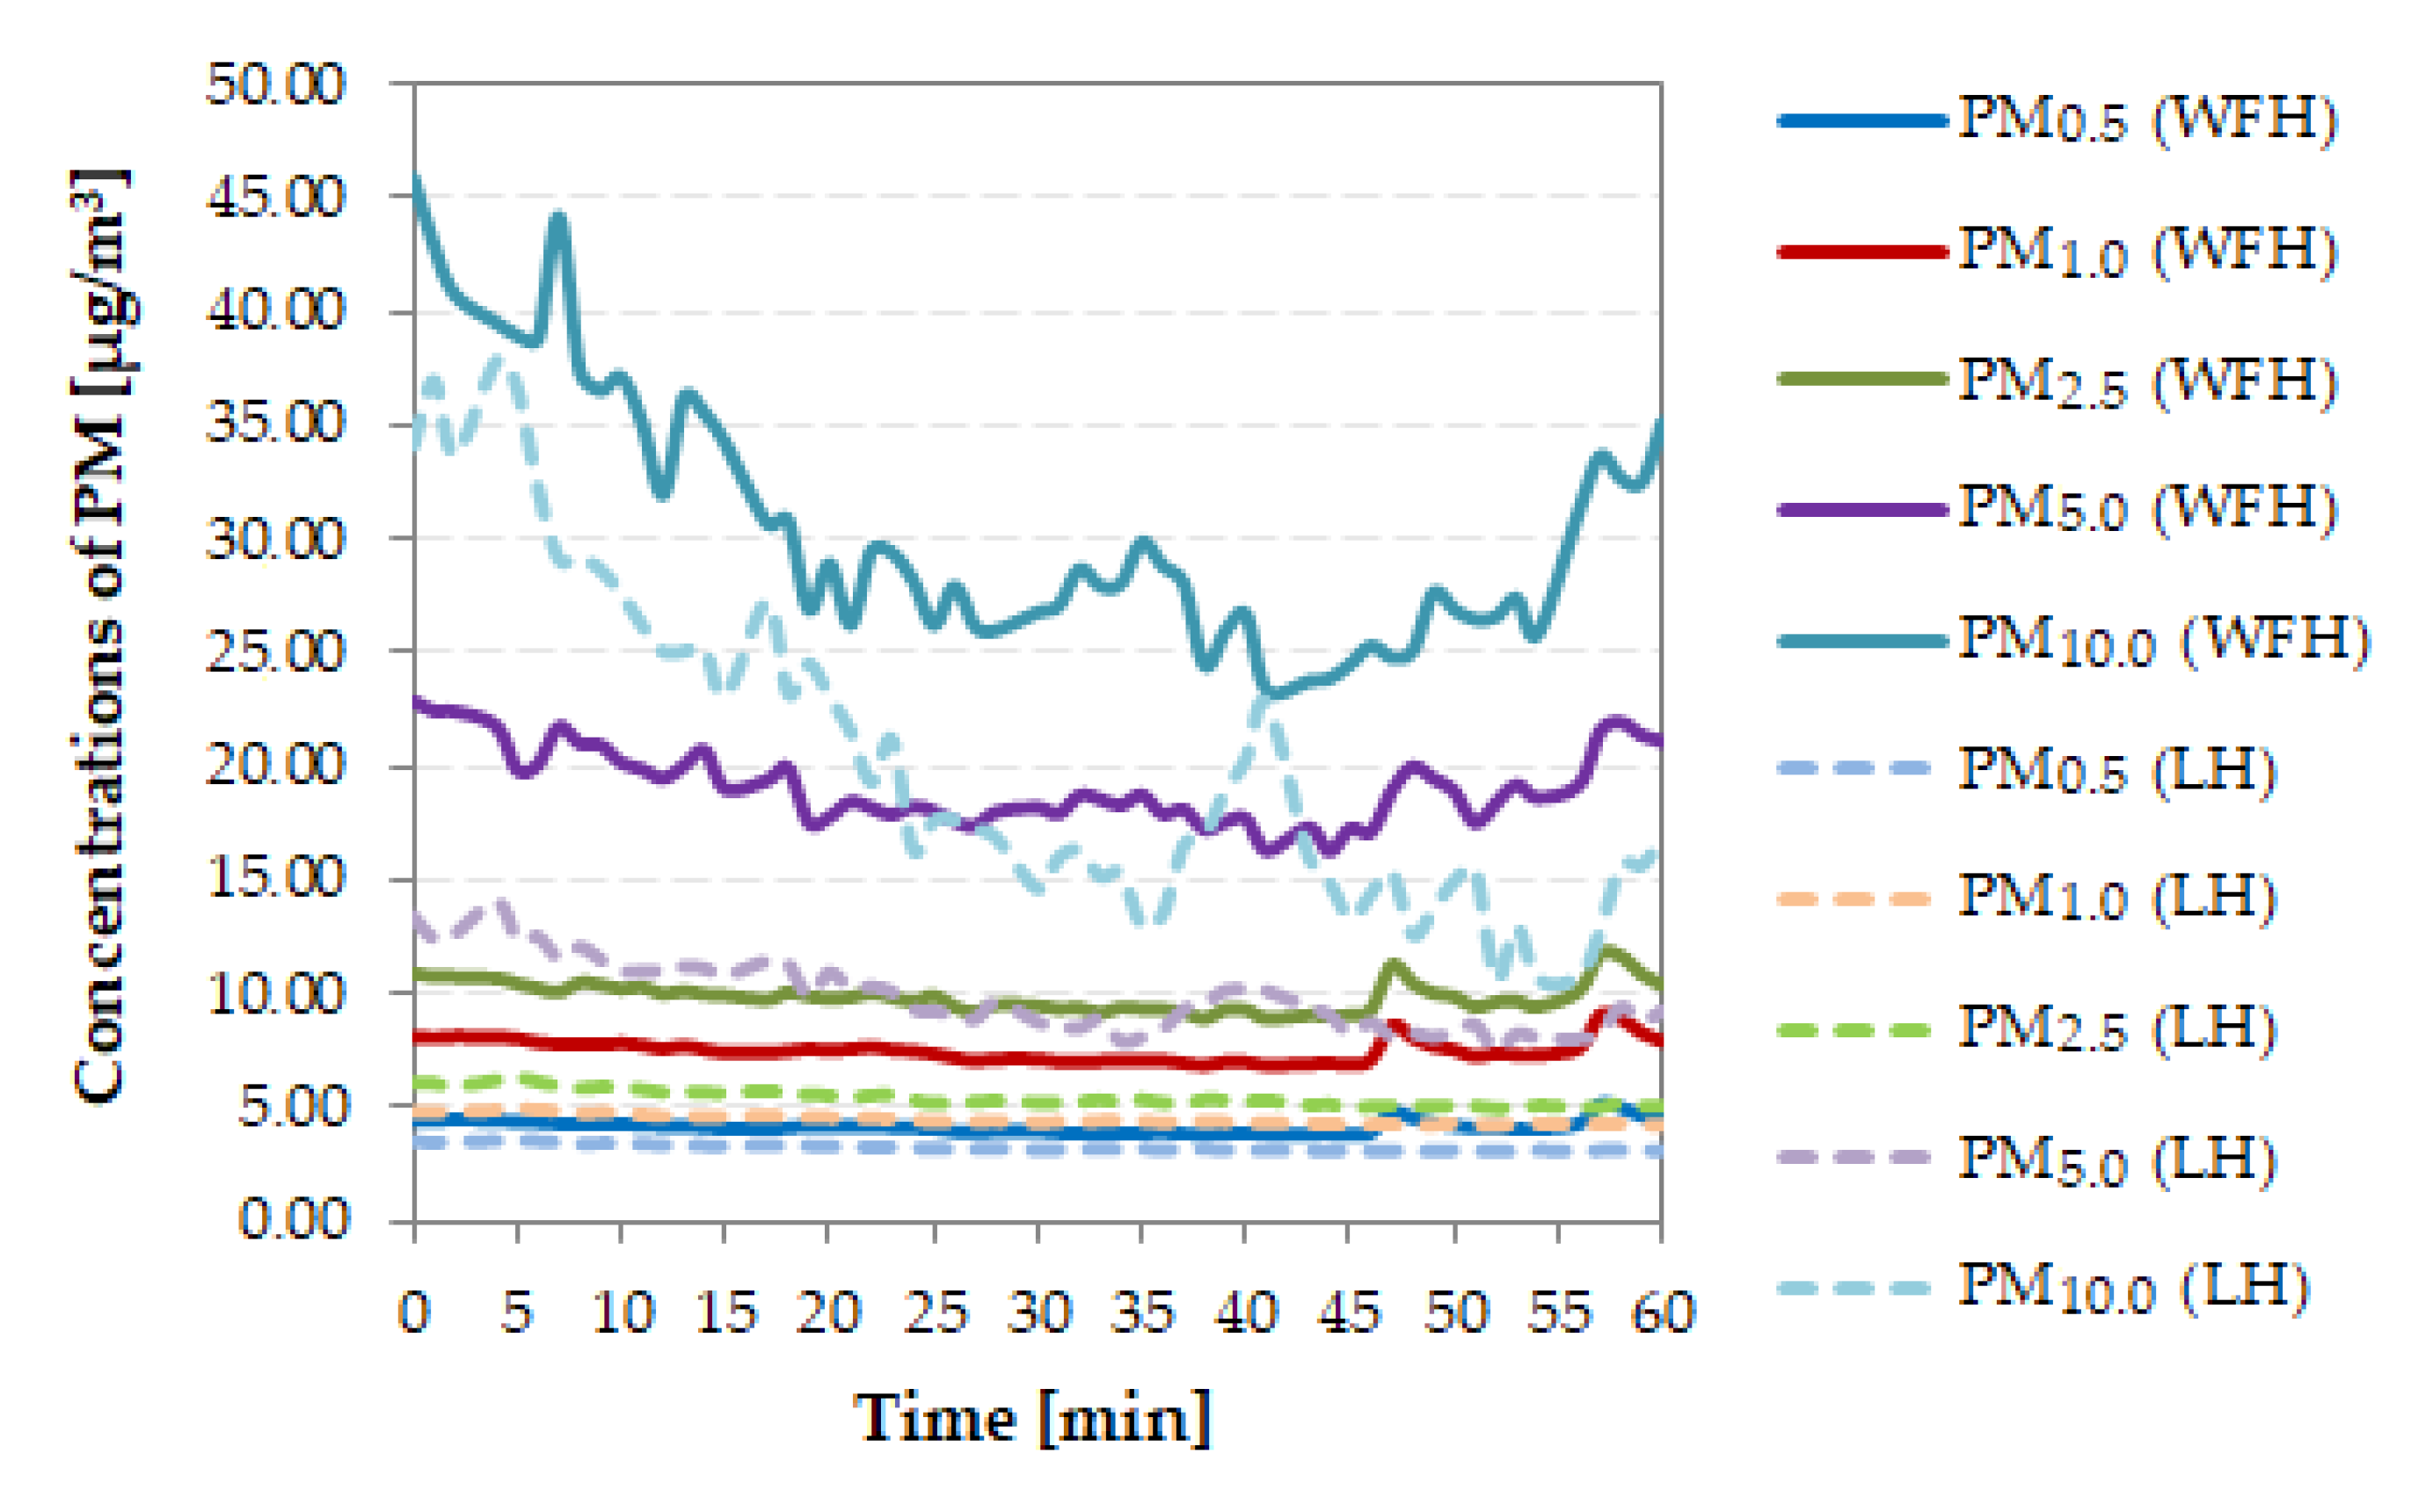
Monitoring of particulate matter included recording their concentration in fractions from 0.5 to 10.0 micrometers. However, more attention is focused on the most represented fractions, PM2.5 and PM10. Figure 16 shows the course of particulate matter concentrations of all monitored fractions. As can be seen from the figure, the concentrations of the lower fractions have a constant course. The average concentration of PM2.5 for the wooden frame house reached a value of 9.92 µg/m3 and for the log house 5.44 µg/m3. On the contrary, PM10 concentrations had a slightly more fluctuating course, but in both monitored wooden houses, their values were below the legislative limit of 50 µg/m3. The average concentration of PM10 for the wooden frame house was 30.57 µg/m3 and that for the log house was 20.24 µg/m3. Higher concentrations of PM2.5 and PM10 particulate matter recorded in the wooden house may be due to the fact that in winter, PM concentrations are more strongly influenced by internal activities [30], as the wooden frame house was already occupied, while the log house was a relatively new and sporadically occupied building.
The concentrations of detected volatile organic compounds are given in Table 5. The first four compounds (toluene, xylenes, styrene and tetrachloroethene) are considered to be harmful organic compounds according to a Decree of the Ministry of Health of Slovak Republic Number 210/2016. Of these four compounds, the presence of two of them (xylenes and tetracholorethene) in the indoor air of both wooden houses was proved.
The concentrations of toluene and styrene were below the detection limits (LOD), which means that their presence was not confirmed in any of the monitored houses. The detected concentrations of xylenes were below the legislative limit of 4800 µg/m3, and therefore, it can be stated that exposure to such concentrations does not yet pose a health risk. On the other hand, the measured concentration of tetrachloroethene was exceeded six times compared to the legislative limit in the case of the log house. Prolonged exposure to such concentrations may have adverse effects on human health, as tetrachloroethene is considered a possible human carcinogen. In the case of the wooden frame house, an increased concentration of tetrachloroethene in the indoor air was observed, but this value was still below the legislative limit of 250 µg/m3. Xylenes and tetrachloroethene are present in various consumer products (paints, varnishes, adhesives, etc.). The presence of three other organic compounds, namely n-butylacetate, isobutanol and limonene, was found in the wooden frame house, while in the log house only isobutanol was found. With regard to these three compounds, the decree of the Slovak Republic does not state their maximum permissible values. Limonene and n-butylacetate are compounds that occur naturally in many types of fruits and may also be used as a flavoring and fragrance additive in food, cleaning, polishing, personal care products or solvents. This means that their occurrence is more related to indoor human activities, and therefore their concentrations tend to fluctuate in the indoor environment [30].
The total concentration of volatile organic compounds in the indoor air of the log house is probably associated with the application of protective and impregnating coatings in this house approximately half a year before monitoring. In the wooden frame house, the collection of volatile organic compounds in the indoor environment was carried out several years after construction, so it can be assumed that high levels of the most hazardous VOCs have partially evaporated from wooden surfaces and interior over the years. However, it cannot be ruled out that the presence of detected VOCs in this house may be caused by user activities. High concentrations of xylenes are usually observed in the indoor air during the first stages of construction or after the stages of completion or reconstruction. As described in a similar study, xylene concentrations in the interior after the first stage of construction (structural work stage) of a passive wooden house exceeded 5000 µg/m3, while after the last stage (furnishing stage), the presence of xylenes was no longer detected [32]. The declining trend of xylene and toluene levels is also confirmed by other studies, according to which concentrations of these compounds tend to decrease within one year of occupation, possibly because of decreasing emissions from building materials [30,33]. The final values of some VOCs in the two French wooden-frame energy-efficient houses were at a similar level to the results reported in this study. The average concentrations of selected VOCs in a French study were 12.7 and 13.6 µg/m3 for xylenes, 6.1 and 6.6 µg/m3 for toluene, 15.6 and 11.8 µg/m3 for limonene, and 186.5 and 4.2 µg/m3 for n-butylacetate [30]. The release of these substances from various building materials, protective coatings or surfaces was also supported by the increased room temperature, because heat sources were switched on in both houses during the measurements. It should be mentioned that, while in the wooden frame house the heat source was a boiler, in the second case, in the log house, the heating source was a tiled stove. This fact could have significantly contributed to the increase in VOC levels in the log house, as mentioned in [21].
4. Conclusions
The presence of buildings releases many substances into the air, which can have a negative impact not only on the environment but also on human health. Therefore, ecological optimization of construction impacts is an important part of sustainable architecture. One of the priorities of sustainable construction is the minimization of material flows and emissions in the production of building materials, reducing embedded energy and potentials of environmental impacts. Based on the results of the LCA analysis, it can be stated that the wooden log house has a significantly lower negative impact on the environment compared to the wooden house, which is a combination of a wooden frame and other conventional materials. Wooden products have the potential to play a major role in developing a sustainable built environment. In a continuous cycle of material flow, the use of wood products prevents the accumulation of production or disposal waste, as biomass residues can be used as a source of bioenergy.
The results of indoor air quality monitoring indicate that selected wooden houses meet the legislative requirements regarding thermal-humidity microclimate and PM10 concentration. The relative humidity values fluctuated around 30%, which represents the minimum value of relative humidity that can be achieved in the indoor environment according to the regulations. With regard to volatile organic compounds, the presence of two of the four compounds listed in the decree of the Ministry of Health was demonstrated in both monitored houses. Increased concentrations of xylene and extremely high concentrations of tetrachloroethene were caused in the interior air of the log house, probably because air samples were taken in this house less than a year after the application of protective and impregnating coatings. However, the concentration of xylene was still below the legislative limit, while in the case of tetrachloroethene, the legislative value was exceeded up to six times. The concentrations of these two compounds in the wooden frame house were below the legislative limits, and for this reason, they do not yet pose a health risk to their inhabitants. Additional VOCs, such as n-butylacetate, isobutanol and limonene, were found in the interior air of this house, for which no permissible values are set. In the case of the wooden frame house, the occurrence of all the above compounds was rather associated with the activity of the inhabitants. The low value of relative humidity, as well as the release of some VOCs, was supported by the fact that heating sources were active in both houses during measurement and sampling. The concentrations of CO2 in both houses were below the recommended limit value of 1000 ppm and thus did not cause discomfort for the occupants themselves.
Research aimed at assessing the life cycle of buildings and that assessing the indoor environmental quality were deliberately presented together. The reason is that buildings must not only be designed and operated with minimal impact on the environment but must also ensure health, quality, comfort and well-being in the indoor environment. This study can be seen as a pilot, and we aim to do such research tasks on a larger sample of single-family houses as well as to highlight the importance of the current assessment of sustainability aspects and their practical implementation.
Author Contributions
S.V. had the original idea and design of the study. A.M. and K.H. carried out measurements and analyzed data. S.V., A.M. and K.H. interpreted the results, prepared the text and provided the final version of the manuscript. E.K.B. revised the paper. All authors have read and agreed to the published version of the manuscript.
Funding
This research was funded by VEGA grant agency, grant number 1/0512/20.
Acknowledgments
This study was supported by Grant Agency of Slovak Republic to support project No. 1/0512/20. This paper is also the result of the Project implementation: University Science Park TECHNICOM for Innovation Applications Supported by Knowledge Technology, ITMS: 26220220182, supported by the Research & Development Operational Programme funded by the ERDFI.
Conflicts of Interest
Authors declare no conflicts of interest.
References
- Sandanayake, M.; Lokuge, W.; Zhang, G.; Setunge, S.; Thushar, Q. Greenhouse gas emissions during timber and concrete building construction—A scenario based comparative case study. Sustain. Cities Soc. 2018, 38, 91–97. [Google Scholar] [CrossRef] [Green Version]
- Zubizarreta, M.; Cuadrado, J.; Orbe, A.; García, H. Modeling the environmental sustainability of timber structures: A case study. Environ. Impact Assess. Rev. 2019, 78, 106286. [Google Scholar] [CrossRef]
- Asdrubali, F.; Ferracuti, B.; Lombardi, L.; Guattari, C.; Evangelisti, L.; Grazieschi, G. A review of structural, thermo-physical, acoustical, and environmental properties of wooden materials for building applications. Build. Environ. 2017, 114, 307–332. [Google Scholar] [CrossRef]
- Liang, S.; Gu, H.; Bergman, R.; Kelley, S.S. Comparative life-cycle assessment of a mass timber building and concrete alternative. Wood Fiber Sci. 2020, 52, 217–229. [Google Scholar] [CrossRef]
- Petrovic, B.; Myhren, J.A.; Zhang, X.; Wallhagen, M.; Eriksson, O. Life cycle assessment of a wooden single-family house in Sweden. Appl. Energy 2019, 251, 113253. [Google Scholar] [CrossRef]
- Hafner, A.; Schäfer, S. Comparative LCA study of different timber and mineral buildings and calculation method for substitution factors on building level. J. Clean. Prod. 2017, 167, 630–642. [Google Scholar] [CrossRef]
- Hanandeh, A. Environmental assessment of popular single-family house construction alternatives in Jordan. Build. Environ. 2015, 92, 192–199. [Google Scholar] [CrossRef] [Green Version]
- Li, P.; Froese, T.M. Life-cycle assessment of high performance, low cost homes. Procedia Eng. 2016, 145, 1322–1329. [Google Scholar] [CrossRef] [Green Version]
- Gerilla, G.P.; Teknomo, K.; Hokao, K. An environmental assessment of wood and steel reinforced concrete housing construction. Build. Environ. 2007, 42, 2778–2784. [Google Scholar] [CrossRef]
- Eštoková, A.; Porhinčák, M. Reduction of primary energy and CO2 emissions through selection and environmental evaluation of building materials. Theor. Found. Chem. Eng. 2012, 46, 704–712. [Google Scholar] [CrossRef]
- Häfliger, I.F.; John, V.; Passer, A.; Lasvaux, S.; Hoxha, E.; Saade, M.R.M.; Habert, G. Buildings environmental impacts’ sensitivity related to LCA modelling choices of construction materials. J. Clean. Prod. 2017, 156, 805–816. [Google Scholar] [CrossRef] [Green Version]
- Guggemos, A.A.; Horvath, A. Comparison of environmental effects of steel-and concrete-framed buildings. J. Infrastruct. Syst. 2005, 11, 93–101. [Google Scholar] [CrossRef]
- Kylili, A.; Ilic, M.; Fokaides, P.A. Whole-building Life Cycle Assessment (LCA) of a passive house of the sub-tropical climatic zone. Resour. Conserv. Recycl. 2017, 116, 169–177. [Google Scholar] [CrossRef]
- Mitterpach, J.; Štefko, J. An environmental impact of a wooden and brick house by the LCA Method. Key Eng. Mater. 2016, 688, 204–209. [Google Scholar] [CrossRef]
- Pajchrowski, G.; Noskowiak, A.; Lewandowska, A.; Strykowski, W. Wood as a building material in the light of environmental assessment of full life cycle of four buildings. Constr. Build. Mater. 2014, 52, 428–436. [Google Scholar] [CrossRef]
- Jašek, M.; Česelský, J.; Vlček, P.; Černíková, M.; Berankova, E.W. Application of BIM process by the evaluation of building energy sustainability. Adv. Mater. Res. 2014, 899, 7–10. [Google Scholar] [CrossRef]
- Vilčeková, S.; Selecká, I.; Burdová, E.K.; Mečiarová, Ľ. Interlinked sustainability aspects of low-rise residential family house development in Slovakia. Sustainability 2018, 10, 3966. [Google Scholar] [CrossRef] [Green Version]
- Sviták, M.; Krontorád, K.; Kropáček, J.; Hlásková, L.; Solař, A. Parameters of indoor air quality (IAQ) in wooden houses. BioResources 2018, 13, 8222–8238. [Google Scholar] [CrossRef]
- Fürhapper, C.; Habla, E.; Stratev, D.; Weigl, M.; Dobianer, K. Living Conditions in Timber Houses: Emission Trends and Indoor Air Quality. Front. Built Environ. 2019, 5, 151. [Google Scholar] [CrossRef] [Green Version]
- Langer, S.; Bekö, G.; Bloom, E.; Widheden, A.; Ekberg, L. Indoor air quality in passive and conventional new houses in Sweden. Build. Environ. 2015, 93, 92–100. [Google Scholar] [CrossRef]
- Čech, P.; Tesařová, D.; Hadačová, J.; Jeřábková, E. The quality of indoor air in wooden based buildings and the factors with impact of them. Wood Res. 2016, 61, 583–598. [Google Scholar]
- Hermon, P. eTool. Life Cycle Assessment. Office Presentation Example, Isetta Square, eToolLCD. 2017. Available online: https://etoollcd.com (accessed on 1 January 2018).
- Bertoldi, P. (Ed.) Guidebook “How to Develop a Sustainable Energy and Climate Action Plan (SECAP)”—Part 2—Baseline Emission Inventory (BEI) and Risk and Vulnerability Assessment (RVA); European Union: Brussels, Belgium, 2018. [Google Scholar]
- CoM Default Emission Factors for the Member States of the European Union—Version 2017. Available online: https://jeodpp.jrc.ec.europa.eu/ftp/jrc-opendata/COM-EF/dataset/comw/JRC-CoM-EF-CoMW-EF-2017.pdf (accessed on 30 December 2017).
- Moňoková, A.; Vilčeková, S. Sustainable Construction—Environmental Impacts Assessment of Architectural Elements and Building Services. Int. J. Eng. Res. Afr. 2020, 47, 77–83. [Google Scholar] [CrossRef]
- Kaoula, D.; Bouchair, A. Identification of the best material-energy-climate compatibility for five ecological houses and the contribution of their impact sources to the overall balance. Sustain. Cities Soc. 2020, 52, 101781. [Google Scholar] [CrossRef]
- Sathre, R.; González-García, S. Life cycle assessment (LCA) of wood-based building materials. In Eco-Efficient Construction and Building Materials; Woodhead Publishing: Cambridge, UK, 2014; pp. 311–337. [Google Scholar]
- Ministry of Health, Slovak Republic. Detailed Requirements for the Internal Environment of Buildings and on Minimum Requirements for Apartments of Lower Standard and Accommodation Facilities; Governmental Regulation Number 259/2008 Coll; Government of the Slovak Republic: Bratislava, Slovakia, 2008.
- Ministry of Health, Slovak Republic. Detailed Requirements for Indoor Environment of Buildings and Minimum Requirements for Low-Standard Flats and Accommodation Facilities; Governmental Regulation Number 259/2008 Coll; Government of the Slovak Republic: Bratislava, Slovakia, 2006.
- Derbez, M.; Berthineau, B.; Cochet, V.; Pignon, C.; Ribéron, J.; Wyart, G.; Kirchner, S. A 3-year follow-up of indoor air quality and comfort in two energy-efficient houses. Build. Environ. 2014, 82, 288–299. [Google Scholar] [CrossRef]
- Pettenkofer, M.V. Über den Luftwechsel in Wohngebäuden; Literarischartistische Anstalt der Cotta’schen Buchhandlungen: München, Germany, 1858. [Google Scholar]
- Plaisance, H.; Vignau-Laulhere, J.; Mocho, P.; Sauvat, N.; Raulin, K.; Desauziers, V. Volatile organic compounds concentrations during the construction process in newly-built timber-frame houses: Source identification and emission kinetics. Environ. Sci. Process. Impacts 2017, 19, 696–710. [Google Scholar] [CrossRef] [PubMed]
- Derbez, M.; Berthineau, B.; Cochet, V.; Lethrosne, M.; Pignon, C.; Riberon, J.; Kirchner, S. Indoor air quality and comfort in seven newly built, energy-efficient houses in France. Build. Environ. 2014, 72, 173–187. [Google Scholar] [CrossRef]
Figure 1.
Views of the assessed wooden family houses: (a) wooden frame house; (b) log house.
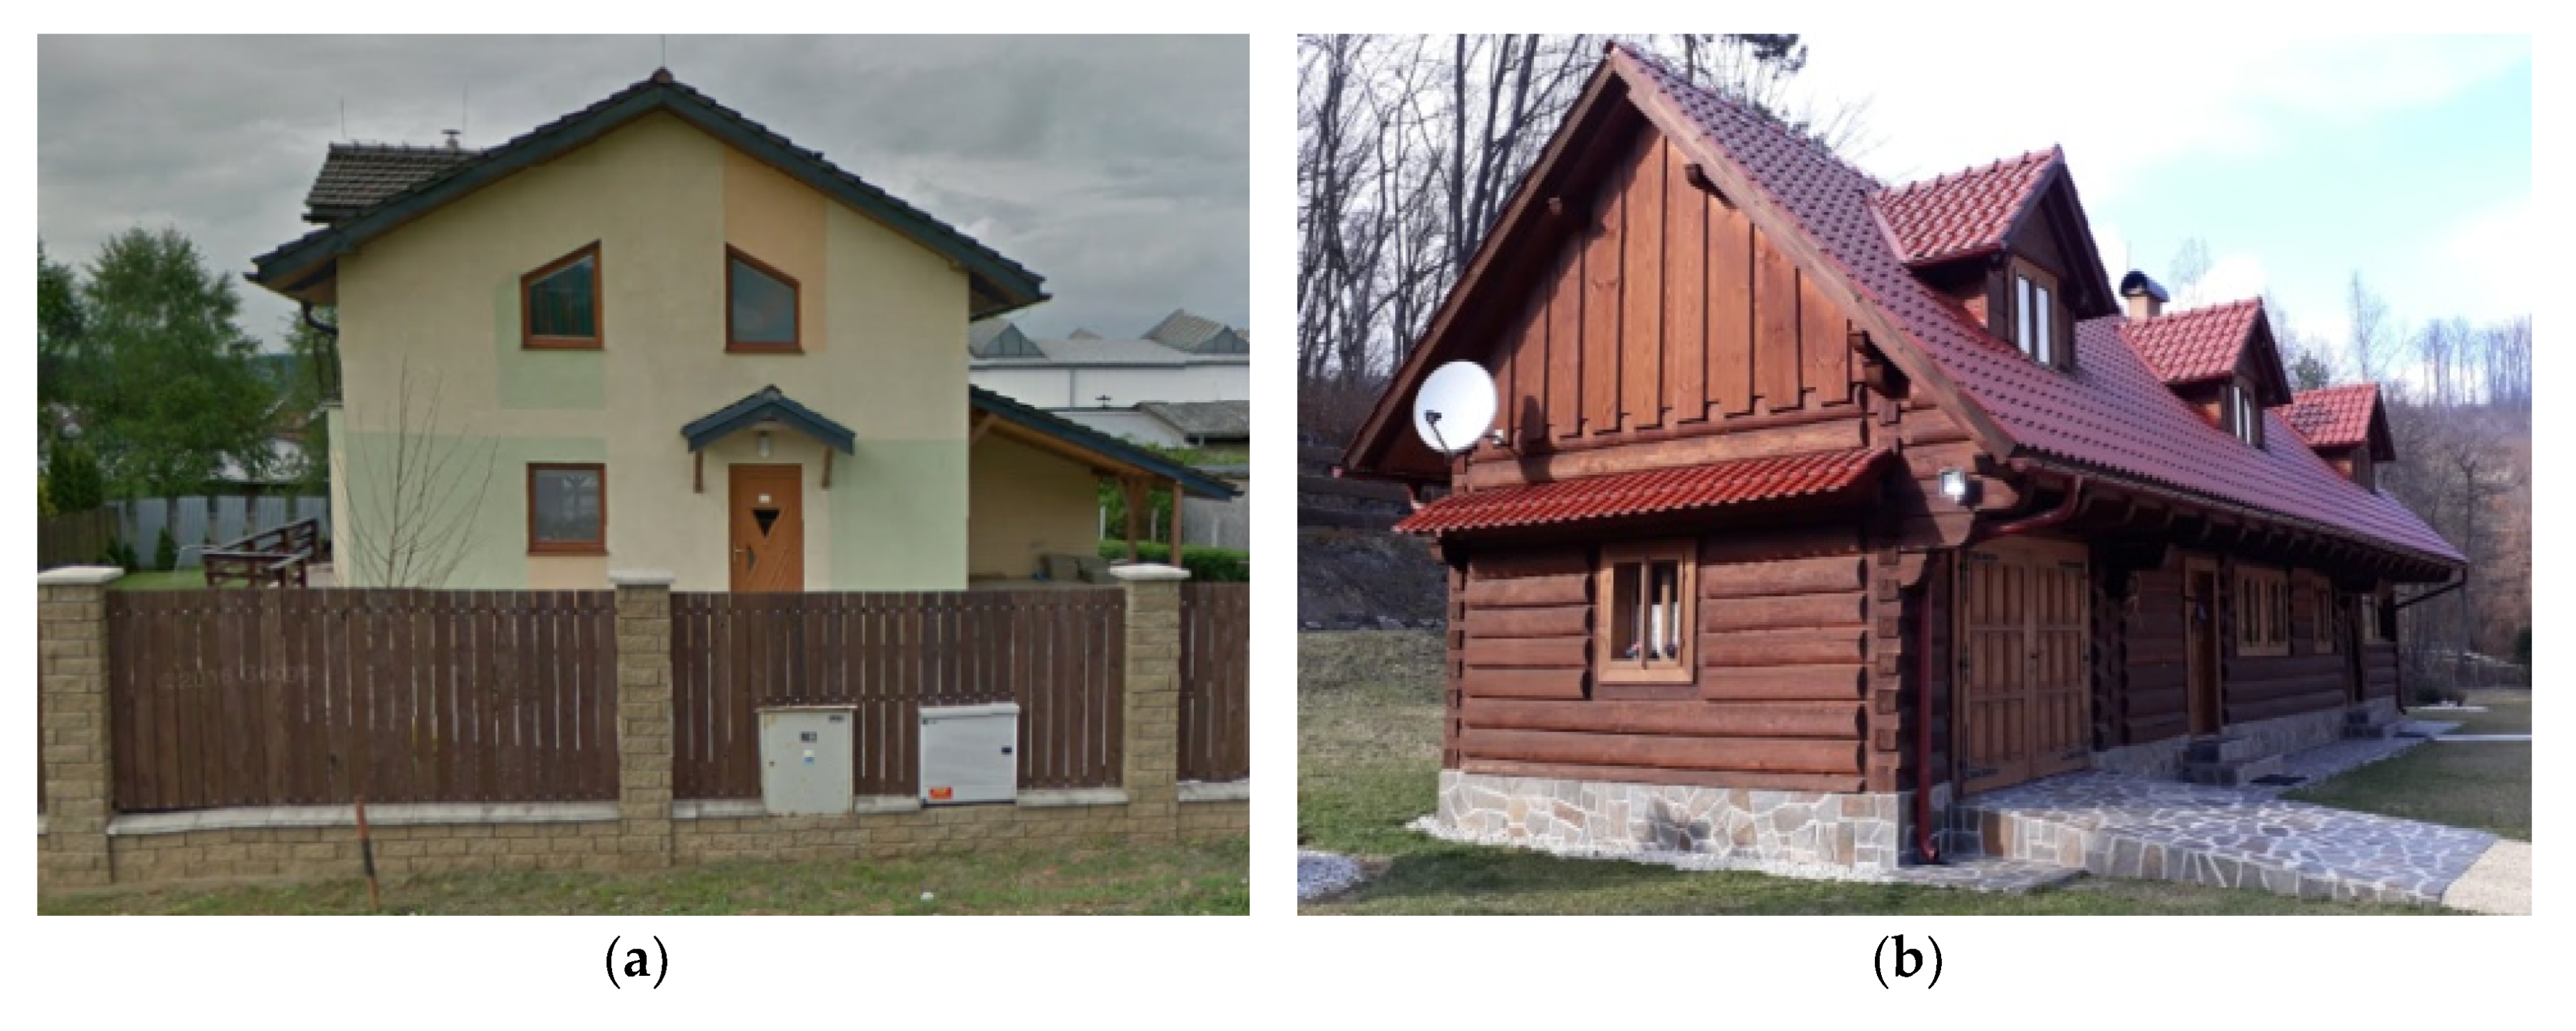
Figure 2.
Evaluated phases and informative modules within the life cycle of selected houses.

Figure 3.
Percentage of impacts categories of selected life cycle phases for the wooden frame house.
Figure 3.
Percentage of impacts categories of selected life cycle phases for the wooden frame house.

Figure 4.
Percentage of impacts categories of selected life cycle phases for the log house.

Figure 5.
Materials involved in global warming potential (GWP) formation (kg CO2eq) for the wooden frame house.
Figure 5.
Materials involved in global warming potential (GWP) formation (kg CO2eq) for the wooden frame house.

Figure 6.
Materials involved in GWP formation (kg CO2eq) for the log house.
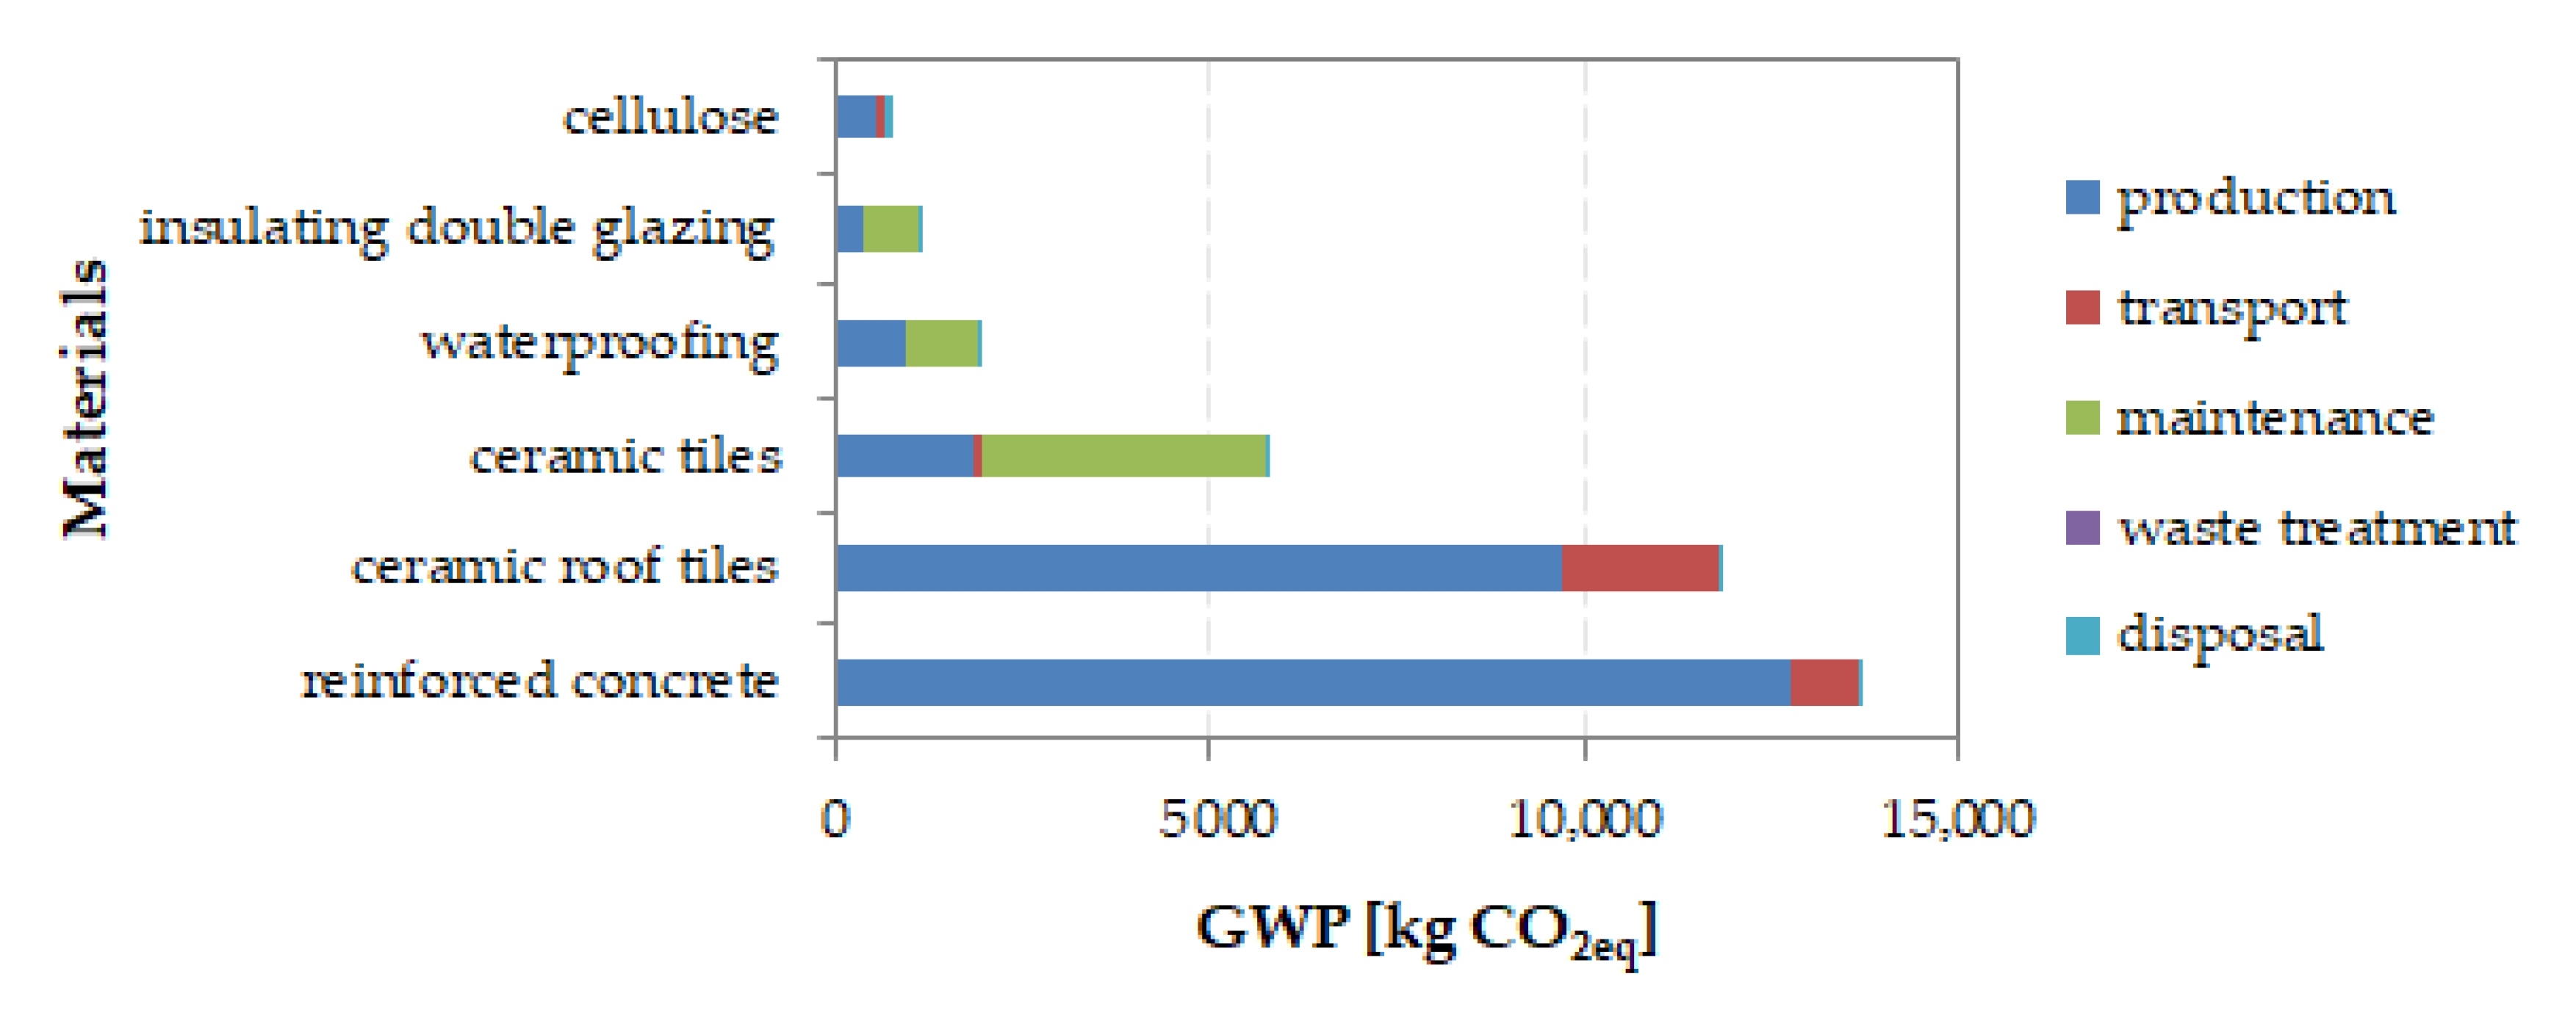
Figure 7.
Materials involved in the formation of acidification potential (AP) (kg SO2eq) for the wooden frame house.
Figure 7.
Materials involved in the formation of acidification potential (AP) (kg SO2eq) for the wooden frame house.
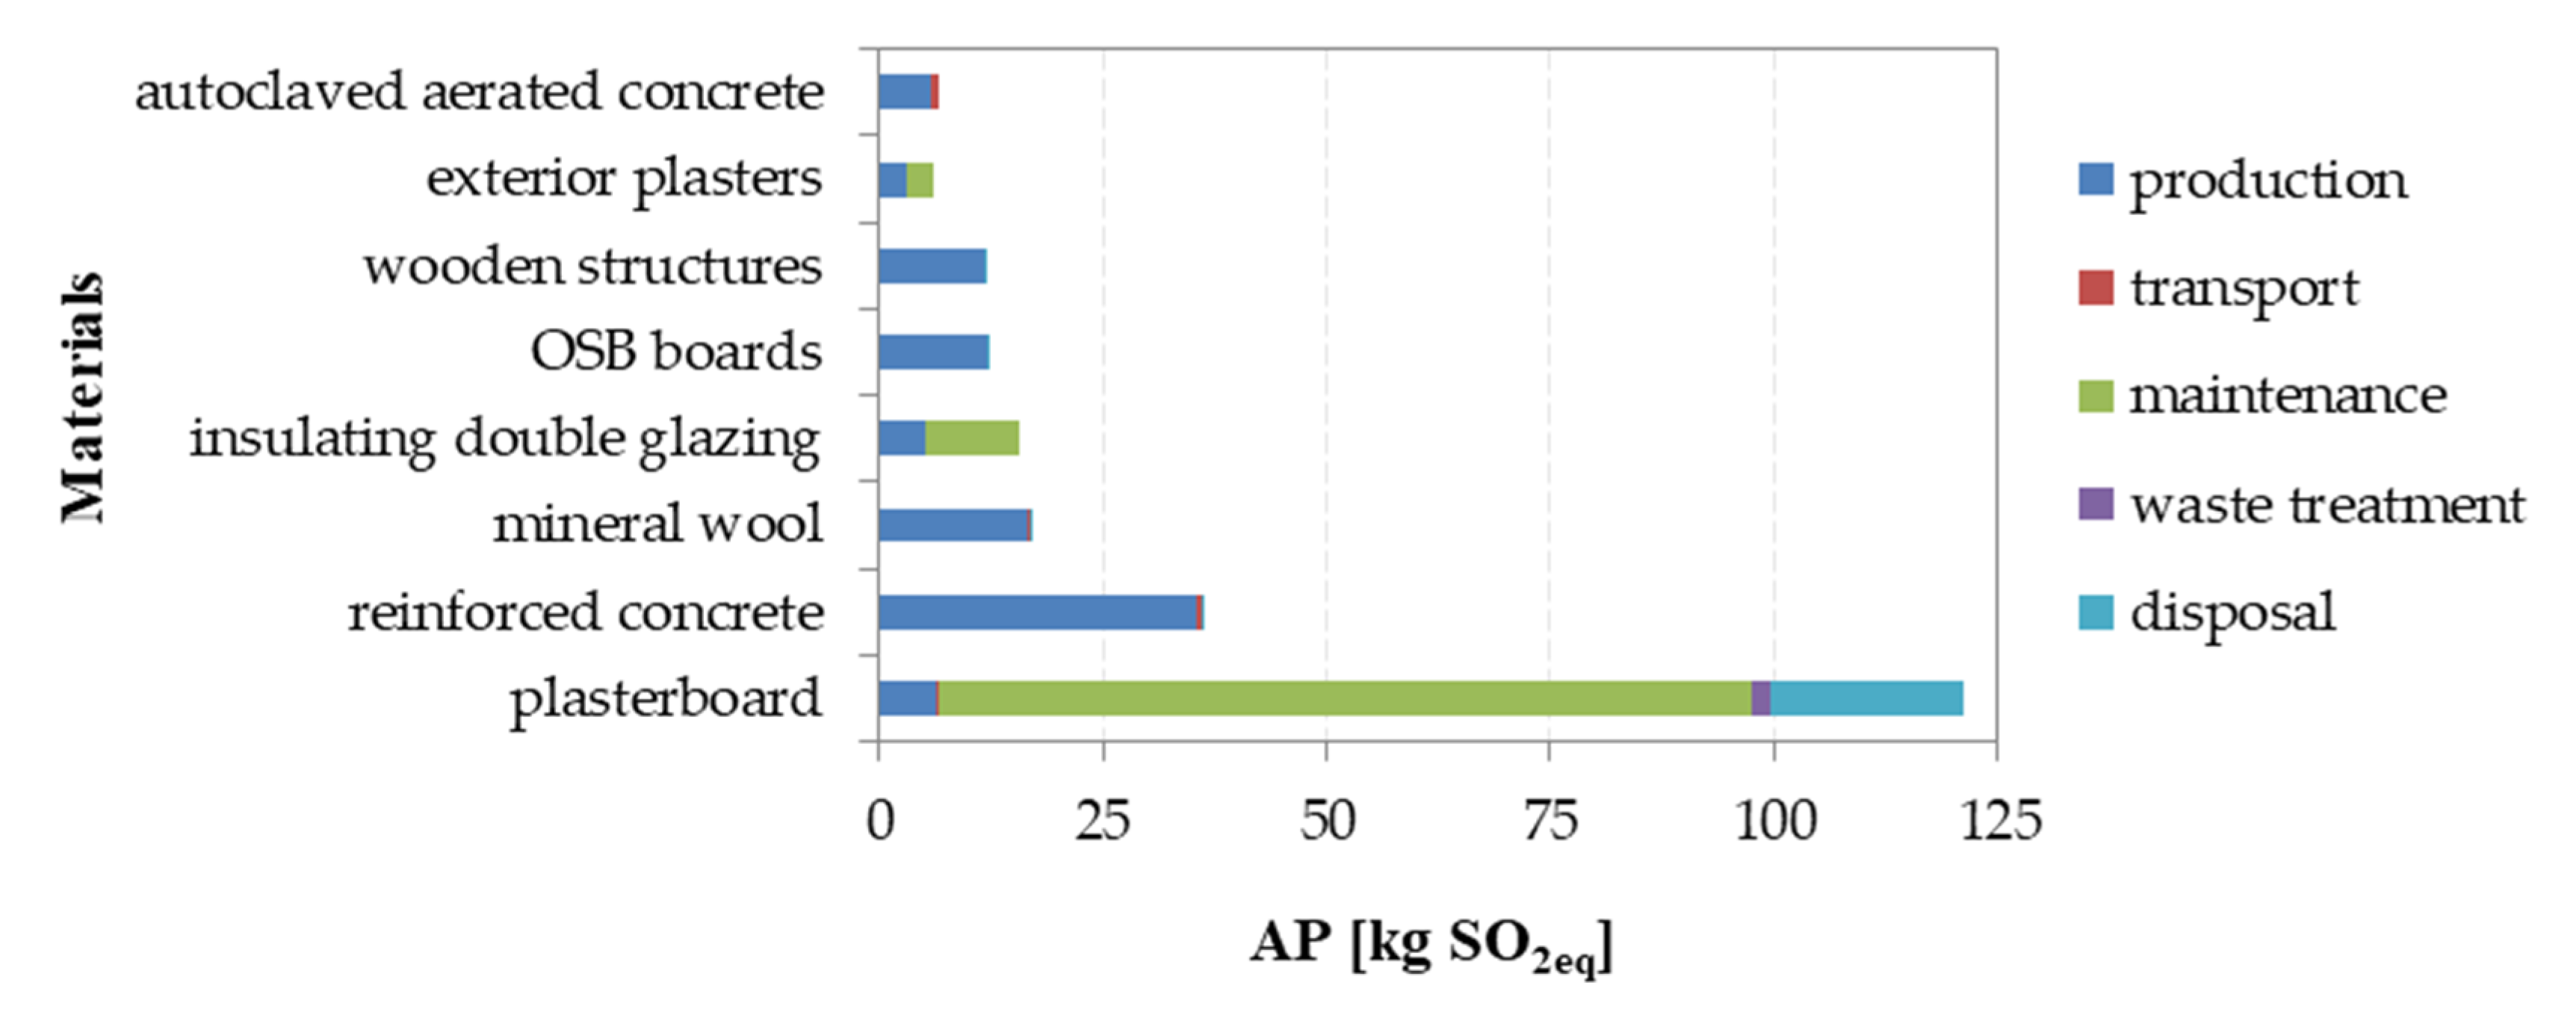
Figure 8.
Materials involved in the formation of AP (kg SO2eq) for the log house.

Figure 9.
Materials involved in the formation of eutrophication potential (EP) (kg PO43−eq) for the wooden frame house.
Figure 9.
Materials involved in the formation of eutrophication potential (EP) (kg PO43−eq) for the wooden frame house.
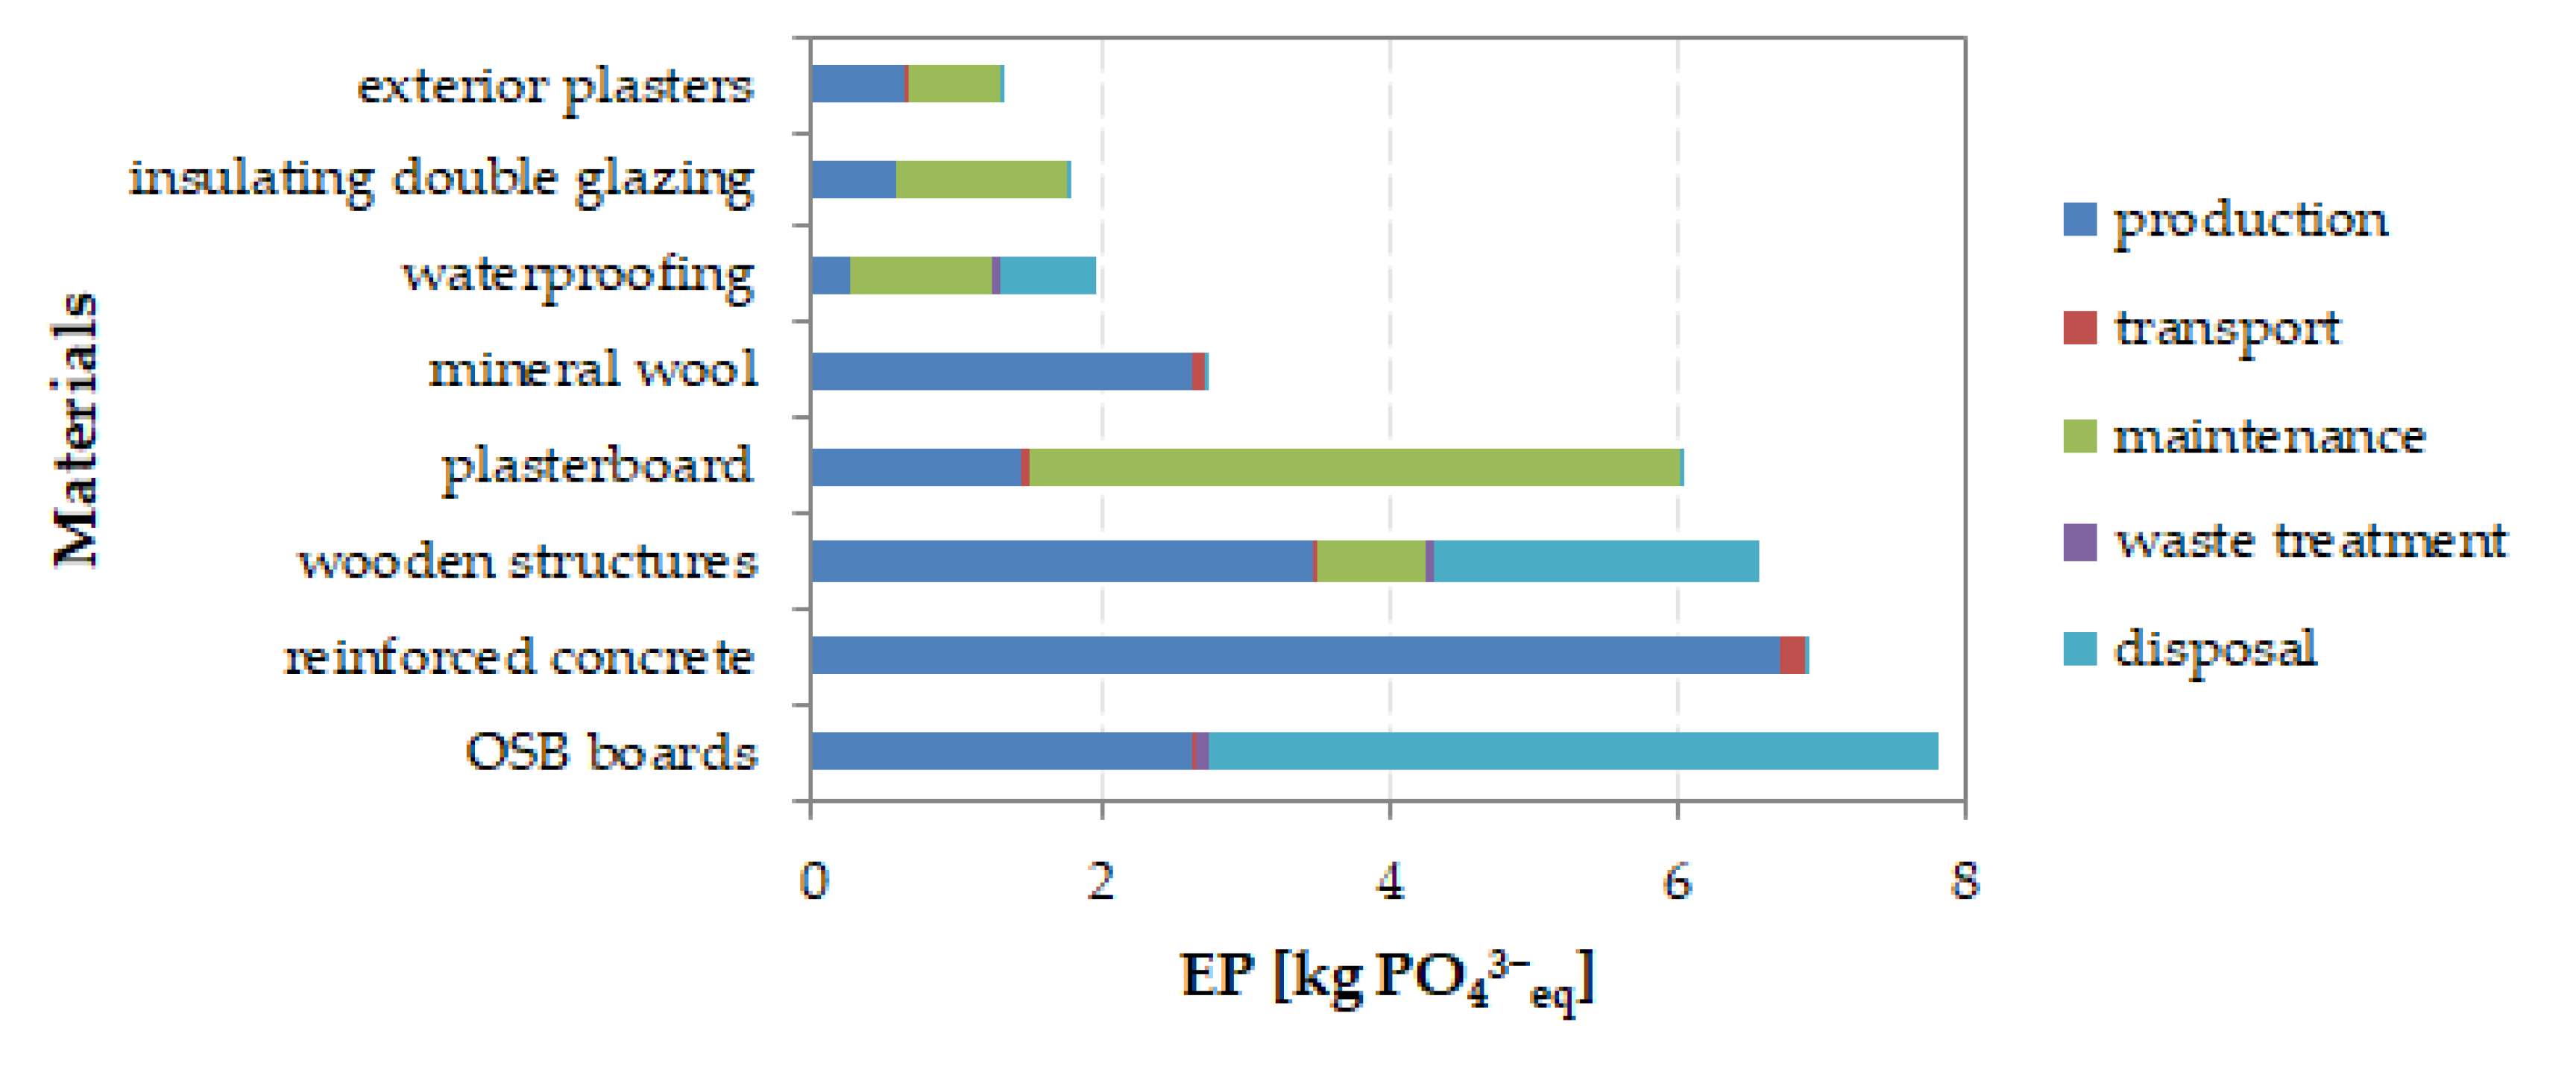
Figure 10.
Materials involved in the formation of EP (kg PO43−eq) for the log house.
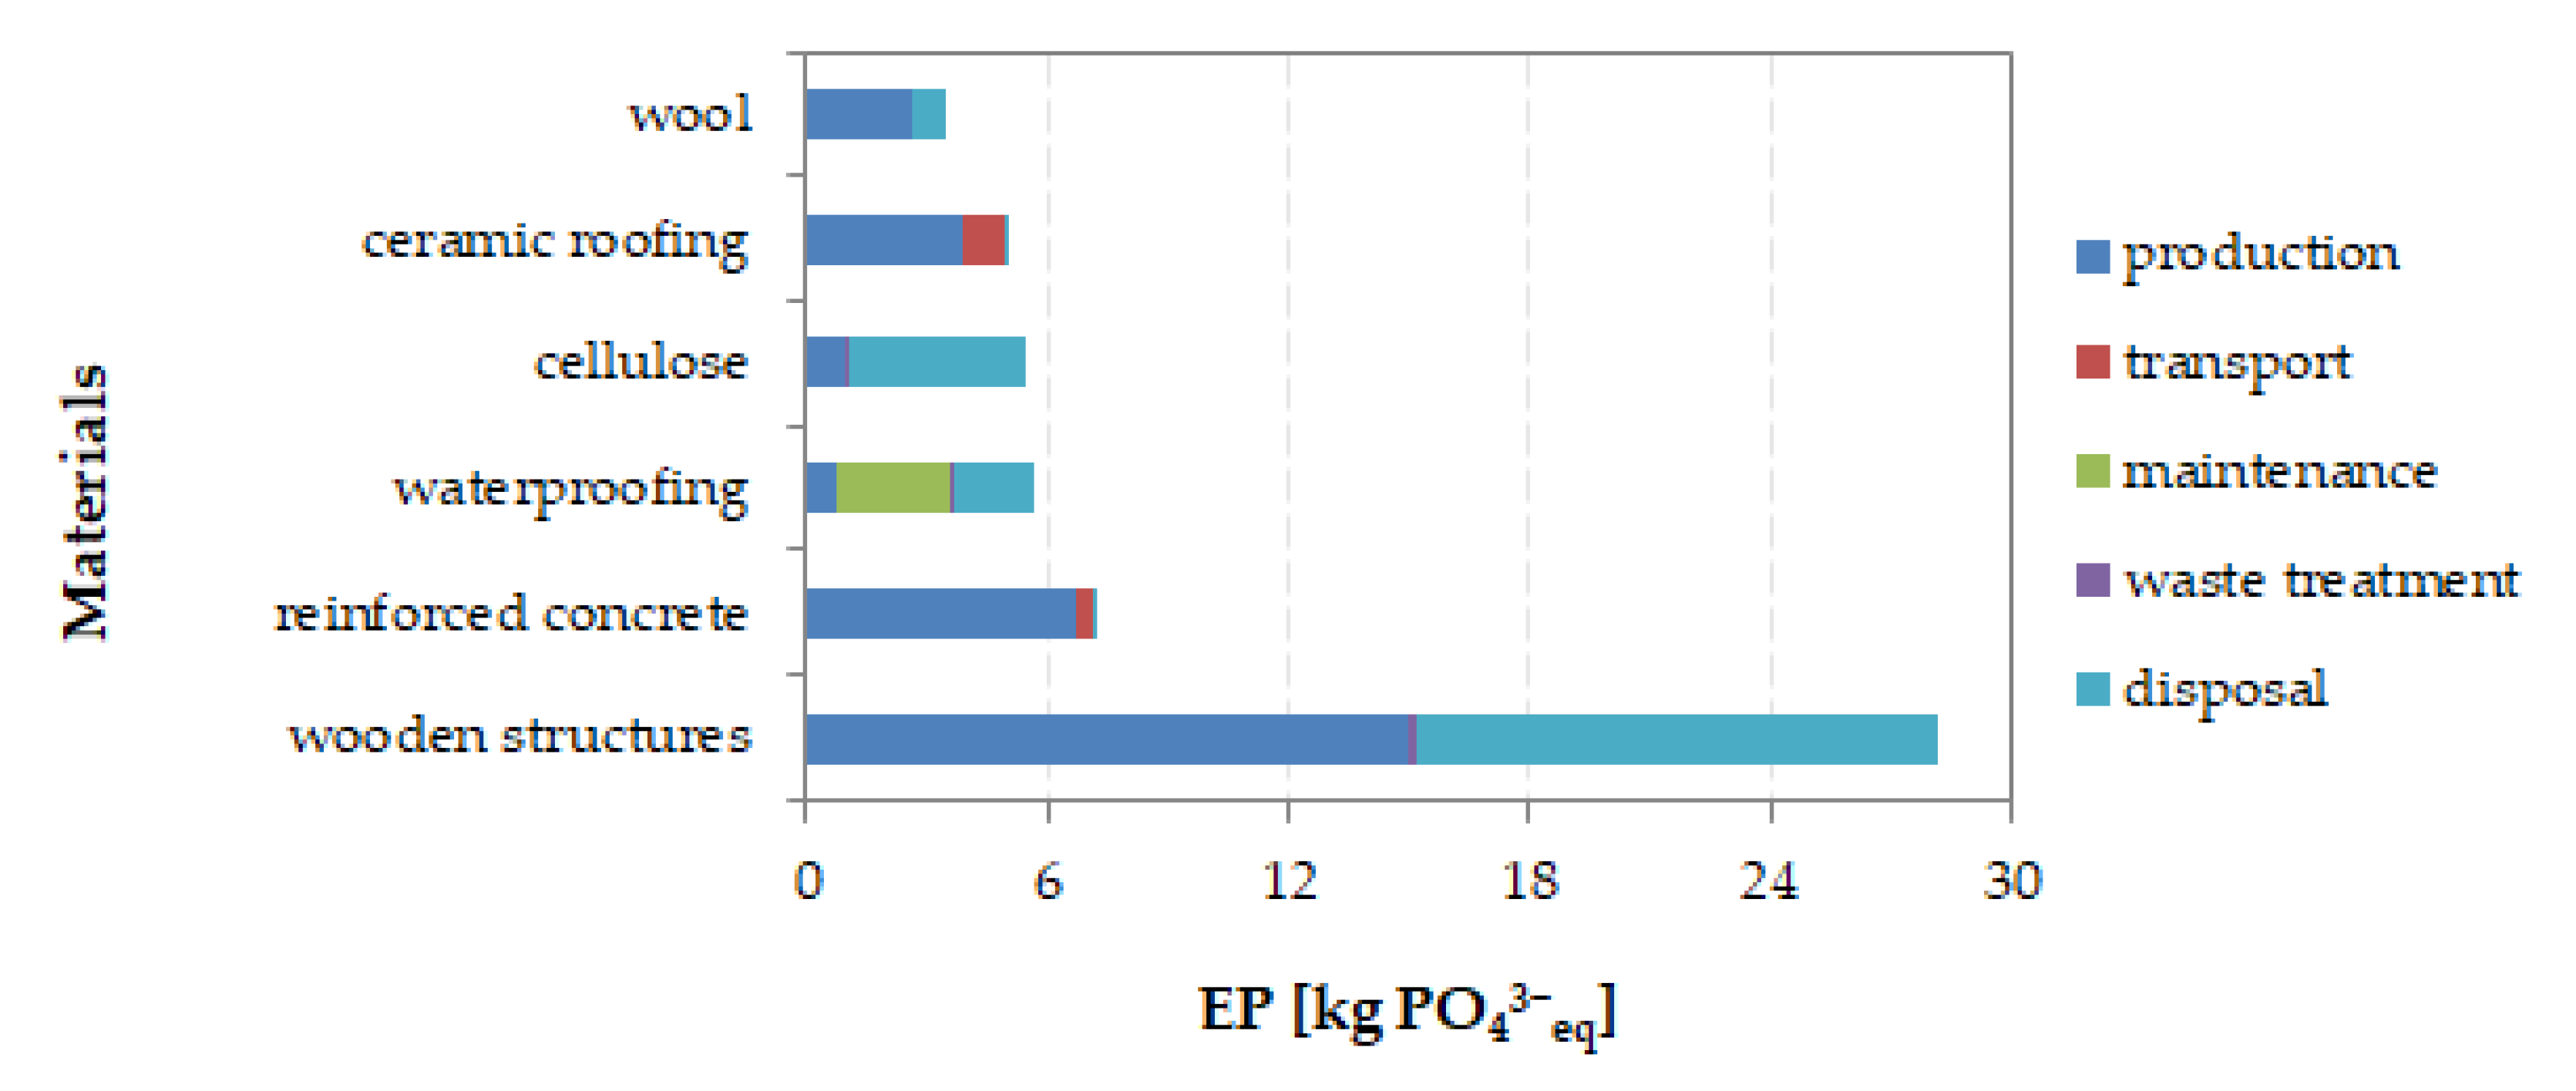
Figure 11.
Materials involved in the formation of ozone depletion potential (ODP) (kg CFC11eq) for the wooden frame house.
Figure 11.
Materials involved in the formation of ozone depletion potential (ODP) (kg CFC11eq) for the wooden frame house.

Figure 12.
Materials involved in the formation of ODP (kg CFC11eq) for the log house.

Figure 13.
Materials involved in the formation of photochemical ozone creation potential (POCP) (kg C2H4eq) for the wooden frame house.
Figure 13.
Materials involved in the formation of photochemical ozone creation potential (POCP) (kg C2H4eq) for the wooden frame house.

Figure 14.
Materials involved in the formation of POCP (kg C2H4eq) for the log house.

Figure 15.
The course of CO2 concentrations in two selected wooden houses.
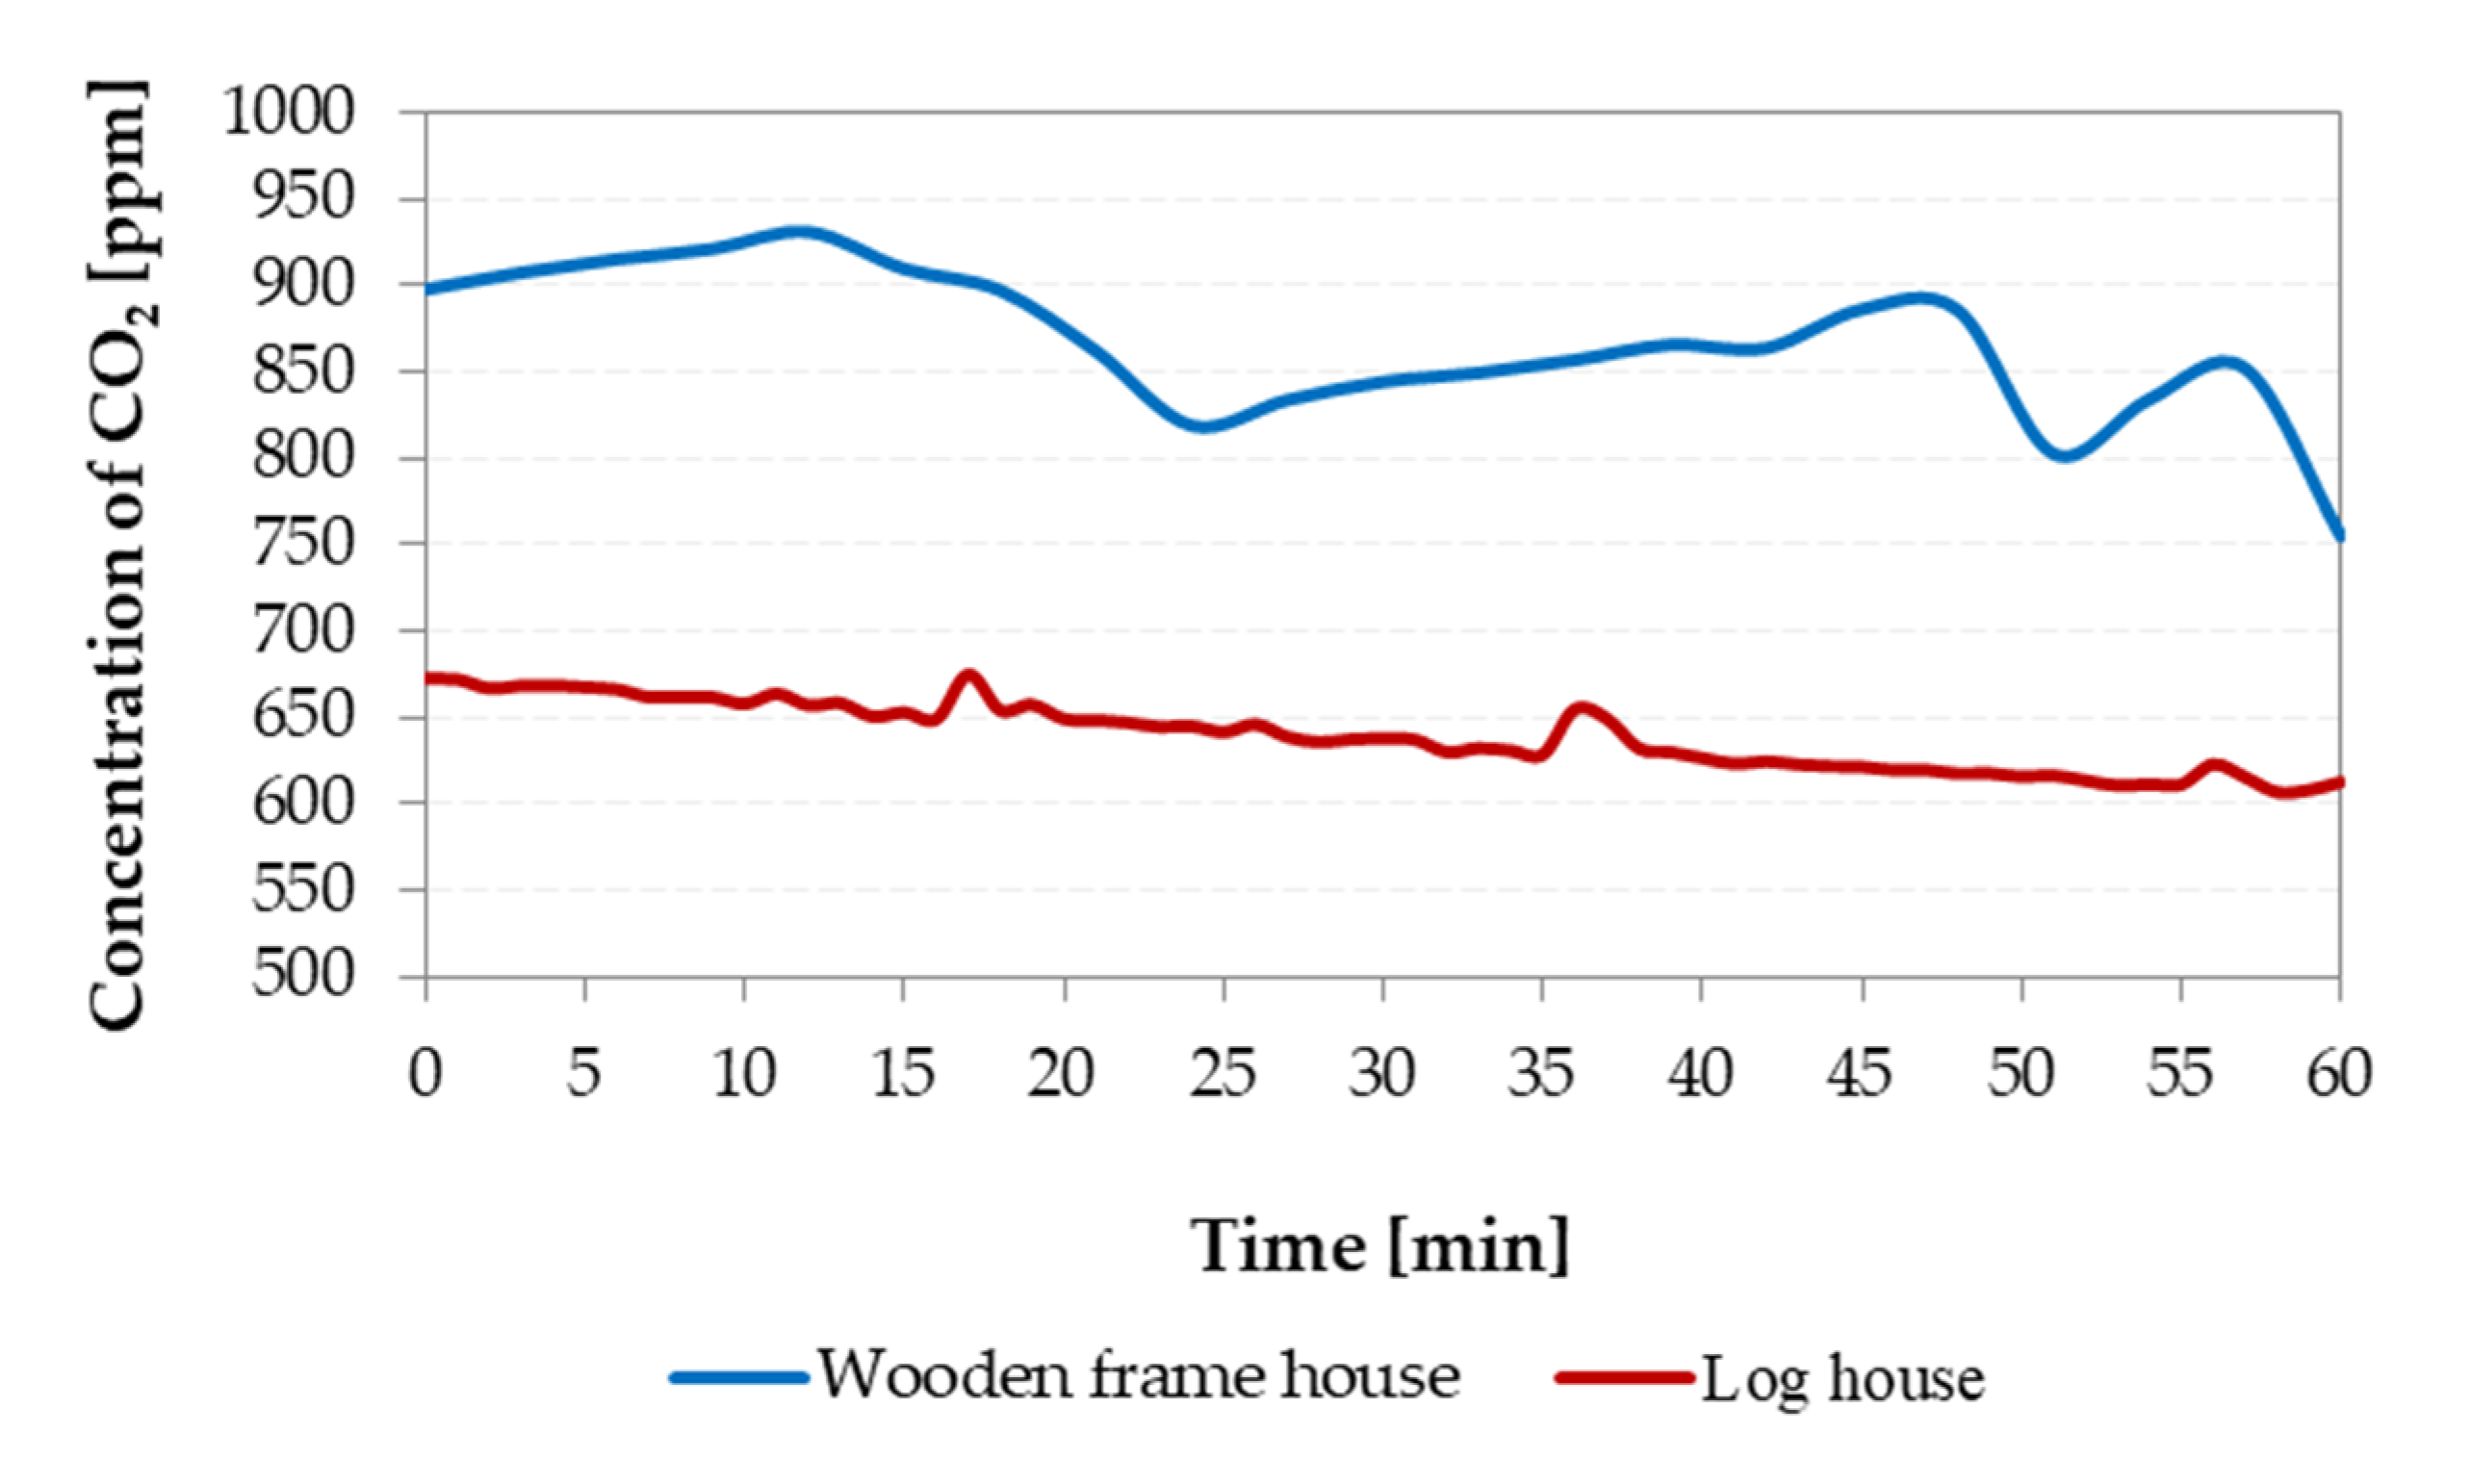
Figure 16.
The course of concentration of particulate matter with fractions 0.5–10 µm. The solid line shows the fractions for the wooden frame house (WFH) and the dashed line for the log house (LH).
Figure 16.
The course of concentration of particulate matter with fractions 0.5–10 µm. The solid line shows the fractions for the wooden frame house (WFH) and the dashed line for the log house (LH).

Table 1.
Basic characteristics of the houses.
| Wooden Frame House | Log House | |
|---|---|---|
| Built-up area | 80 m2 | 120 m2 |
| Useful area | 117 m2 | 170 m2 |
| Enclosed volume | 400 m3 | 500 m3 |
| Total floor area | 145 m2 | 198 m2 |
| Number of floors | 2 | 1 + loft |
| Number of housing units | 1 | 1 |
| Number of occupants | 4 | 3 |
| Heat demand for DHW heating | 3800 kWh/year | 3200 kWh/year |
| Heat demand at central heating | 16,081 kWh/year | 9900 kWh/year |
Table 2.
Environmental impact categories of the life cycle for the wooden frame house.
| Impact | Materials and Construction | Use Stage | End of Life Stage | Total | ||||||
|---|---|---|---|---|---|---|---|---|---|---|
| A1–A3 | A4 | A5 | B1 | B2 | B5 | B6 | B7 | C4 | ||
| GWP (kg CO2eq) | 62.00 | 15.00 | 8.10 | 0 | 0.076 | 54.00 | 1080 | 26.00 | 8.50 | 1254 |
| ODP (kgCFC11eq) | 7.2 × 10⁻⁶ | 9.9 × 10⁻⁷ | 4.9 × 10⁻⁷ | 0 | 3.9 × 10⁻⁹ | 6.8 × 10⁻⁶ | 2.5 × 10⁻⁶ | 1.4 × 10⁻⁶ | 3.8 × 10⁻⁹ | 1.94 × 10⁻⁵ |
| AP (kg SO2eq) | 1.6 | 0.13 | 0.048 | 0 | 4.6 × 10⁻⁴ | 0.62 | 0.42 | 0.13 | 6.7 × 10⁻⁴ | 2.95 |
| EP (kg (PO4)3−eq) | 0.26 | 0.077 | 0.014 | 0 | 8.1 × 10⁻⁵ | 0.082 | 0.11 | 0.031 | 0.061 | 0.64 |
| POCP (kg C2H4eq) | 0.11 | 6.6 × 10⁻³ | 0.1 | 0 | 2.0 × 10⁻⁵ | 0.058 | 0.053 | 7.77 × 10⁻³ | 6.1 × 10⁻³ | 0.34 |
| ADPE (kg Sbeq) | 1.7 × 10⁻³ | 8.6 × 10⁻⁸ | 1.6 × 10⁻⁷ | 0 | 7.6 × 10⁻⁹ | 8.0 × 10⁻⁴ | 4.9 × 10⁻⁶ | 6.2 × 10⁻⁶ | 2.2 × 10⁻⁸ | 2.51 × 10⁻³ |
| ADPF (MJ) | 3800 | 470 | 110 | 0 | 1.2 | 840 | 770 | 410 | 0.13 | 6401 |
| PERE (MJ) | 1700 | 0.31 | 0.53 | 0 | 0.023 | 130 | 15 | 18 | 0.053 | 1864 |
| PERM (MJ) | 1.80 × 10⁻² | 2.1 × 10⁻⁶ | 3.5 × 10⁻⁶ | 0 | 7.7 × 10⁻⁷ | 2.4 × 10⁻³ | 1.2 × 10⁻⁴ | 5.5 × 10⁻⁵ | 6.5 × 10⁻⁷ | 0.0206 |
| PENRE (MJ) | 3900 | 210 | 110 | 0 | 1.5 | 900 | 930 | 500 | 0.32 | 6552 |
| FW (m3) | 19 | 0.024 | 0.045 | 0 | 2.0 × 10⁻⁴ | 0.89 | 0.7 | 37 | 2.2 × 10⁻⁴ | 57.66 |
| HWD (kg) | 0 | 0 | 0 | 0 | 0 | 0 | 0 | 0 | 0 | 0 |
| NHWD (kg) | 1.3 | 0 | 6.9 | 0 | 0 | 24 | 0 | 0 | 230 | 262.2 |
| RWD (kg) | 5.8 × 10⁻³ | 1.3 × 10⁻³ | 6.7 × 10⁻⁴ | 0 | 7.1 × 10⁻⁶ | 3.2 × 10⁻³ | 5.0 × 10⁻³ | 2.4 × 10⁻³ | 3.4 × 10⁻⁶ | 0.0184 |
| CRU (kg) | 0 | 0 | 1.3 | 0 | 0 | 1.6 | 0 | 0 | 13 | 15.9 |
| MFR (kg) | 0 | 0 | 60 | 0 | 0 | 120 | 0 | 0 | 1684 | 1702 |
| MER (kg) | 0.15 | 0 | 0.15 | 0 | 0 | 0.37 | 0 | 0 | 5.8 | 6.47 |
The colored cells in the table indicate the rate of each impact category in each life cycle phase. (red: over 60%; orange: 51–60%; violet: 41–50%; yellow: 31–40%; green: 21–30%; blue: 10–20%).
Table 3.
Environmental impact categories of the life cycle for the log house.
| Impact | Materials and Construction | Use Stage | End of Life Stage | Total | ||||||
|---|---|---|---|---|---|---|---|---|---|---|
| A1–A3 | A4 | A5 | B1 | B2 | B5 | B6 | B7 | C4 | ||
| GWP (kg CO2eq) | −160 | 28 | 5.8 | −1.4 | 0.057 | 51 | 27.5 | 19 | 2.2 | −27.84 |
| ODP (kgCFC11eq) | 8.6 × 10⁻⁶ | 1.8 × 10⁻⁶ | 3.6 × 10⁻⁷ | 0 | 2.9 × 10⁻⁹ | 5.0 × 10⁻⁶ | 9.0 × 10⁻⁷ | 9.9 × 10⁻⁷ | 4.1 × 10⁻⁸ | 1.8 × 10⁻⁵ |
| AP (kg SO2eq) | 0.89 | 0.065 | 0.049 | 0 | 2.7 × 10⁻⁴ | 0.67 | 0.22 | 0.097 | 0.11 | 2.1 |
| EP (kg (PO4)3−eq) | 0.19 | 0.014 | 0.011 | 0 | 6.1 × 10⁻⁵ | 0.075 | 0.075 | 0.023 | 0.11 | 0.49 |
| POCP (kg C2H4eq) | 0.16 | 0.012 | 7.7 × 10⁻³ | 0 | 1.5 × 10⁻⁵ | 0.066 | 0.14 | 5.6 × 10⁻³ | 4.7 × 10⁻³ | 0.396 |
| ADPE (kg Sbeq) | 1.3 × 10⁻³ | 1.6 × 10⁻⁷ | 1.2 × 10⁻⁷ | 0 | 5.7 × 10⁻⁹ | 3.2 × 10⁻⁴ | 9.0 × 10⁻⁷ | 4.6 × 10⁻⁶ | 2.1 × 10⁻⁸ | 1.63 × 10⁻³ |
| ADPF (MJ) | 2200 | 400 | 84 | 0 | 0.9 | 890 | 230 | 300 | 0.14 | 4105 |
| PERE (MJ) | 4700 | 0.6 | 0.4 | 0 | 0.017 | 120 | 13,000 | 13 | 0.064 | 17,834 |
| PERM (MJ) | 2.0 × 10⁻³ | 3.9 × 10⁻⁶ | 2.6 × 10⁻⁶ | 0 | 1.3 × 10⁻⁷ | 3.1 × 10⁻³ | 1.1 × 10⁻⁵ | 4.0 × 10⁻⁵ | 5.6 × 10⁻⁷ | 5.2 × 10⁻³ |
| PENRE (MJ) | 2300 | 380 | 84 | 0 | 1.1 | 950 | 240 | 360 | 0.37 | 4316 |
| FW (m3) | 2 | 0.045 | 0.034 | 0 | 1.4 × 10⁻³ | 0.84 | 0.14 | 61 | 2.4 × 10⁻⁴ | 64.06 |
| HWD (kg) | 3.6 × 10⁻³ | 0 | 0 | 0 | 0 | 5.8 × 10⁻³ | 0 | 0 | 2.0 × 10⁻³ | 0.011 |
| NHWD (kg) | 0.018 | 7.2 × 10⁻⁴ | 13 | 0 | 0 | 18 | 0 | 0 | 230 | 261 |
| RWD (kg) | 9.7 × 10⁻³ | 2.3 × 10⁻³ | 4.9 × 10⁻⁴ | 0 | 5.4 × 10⁻⁶ | 2.5 × 10⁻³ | 1.3 × 10⁻³ | 1.7 × 10⁻³ | 4.1 × 10⁻⁶ | 0.018 |
| CRU (kg) | 0 | 0 | 3.3 | 0 | 0 | 1.2 | 0 | 0 | 28 | 32.5 |
| MFR (kg) | 0 | 0 | 80 | 0 | 0 | 100 | 0 | 0 | 1100 | 1280 |
| MER (kg) | 0 | 8.0 × 10⁻⁵ | 0.28 | 0 | 0 | 0.27 | 0 | 0 | 14 | 14.55 |
The colored cells in the table indicate the rate of each impact category in each life cycle phase. (red: over 60%; orange: 51–60%; violet: 41–50%; yellow: 31–40%; green: 21–30%; blue: 10–20%).
Table 4.
Statistical evaluation of the measured results.
| Air Temperature (°C) | Relative Humidity (%) | Air Velocity (m/s) | CO2 (ppm) | PM2.5 (µg/m3) | PM10 (µg/m3) | ||
|---|---|---|---|---|---|---|---|
| Wooden frame house | Mean | 24.6 | 32.5 | 0.04 | 866 | 9.92 | 30.57 |
| Min | 23.3 | 26.0 | 0.00 | 755 | 8.94 | 23.34 | |
| Max | 25 | 34.5 | 0.22 | 931 | 11.77 | 45.91 | |
| SD 1 | 0.4 | 1.59 | 0.04 | 43.44 | 0.66 | 5.63 | |
| Log house | Mean | 23.7 | 27.5 | 0.01 | 639 | 5.44 | 20.24 |
| Min | 23.5 | 27.2 | 0.00 | 607 | 4.99 | 10.64 | |
| Max | 23.8 | 28.3 | 0.07 | 675 | 6.36 | 37.87 | |
| SD 1 | 0.08 | 0.19 | 0.01 | 19.85 | 0.36 | 7.25 |
1 Standard deviation.
Table 5.
The concentrations of detected VOCs in indoor air.
| Wooden Frame House | Log House | |
|---|---|---|
| Toluene (µg/m3) | <LOD 2 | <LOD 2 |
| Xylenes (m-, p-,o-) (µg/m3) | 8.62 | 123.25 |
| Styrene (µg/m3) | <LOD 2 | <LOD 2 |
| Tetrachloroethene (µg/m3) | 141.43 | 1593.86 |
| n-Butylacetate (µg/m3) | 11.53 | <LOD 2 |
| Isobutanol (µg/m3) | 8.23 | 32.78 |
| Limonene (µg/m3) | 300.57 | <LOD 2 |
2 Limit of detection.
Publisher’s Note: MDPI stays neutral with regard to jurisdictional claims in published maps and institutional affiliations. |
© 2020 by the authors. Licensee MDPI, Basel, Switzerland. This article is an open access article distributed under the terms and conditions of the Creative Commons Attribution (CC BY) license (http://creativecommons.org/licenses/by/4.0/).
Share and Cite
MDPI and ACS Style
Vilčeková, S.; Harčárová, K.; Moňoková, A.; Burdová, E.K. Life Cycle Assessment and Indoor Environmental Quality of Wooden Family Houses. Sustainability 2020, 12, 10557. https://doi.org/10.3390/su122410557
AMA Style
Vilčeková S, Harčárová K, Moňoková A, Burdová EK. Life Cycle Assessment and Indoor Environmental Quality of Wooden Family Houses. Sustainability. 2020; 12(24):10557. https://doi.org/10.3390/su122410557
Chicago/Turabian StyleVilčeková, Silvia, Katarína Harčárová, Andrea Moňoková, and Eva Krídlová Burdová. 2020. "Life Cycle Assessment and Indoor Environmental Quality of Wooden Family Houses" Sustainability 12, no. 24: 10557. https://doi.org/10.3390/su122410557
Note that from the first issue of 2016, this journal uses article numbers instead of page numbers. See further details here.