Assessment of the Impact of CO, NOx and PM10 on Air Quality during Road Construction and Operation Phases


Department of Civil, Energy, Environmental, Materials Engineering, University Mediterranea of Reggio Calabria via Graziella, Feo di Vito, 89100 Reggio Calabria, Italy
Sustainability 2020, 12(24), 10549; https://doi.org/10.3390/su122410549
Submission received: 5 November 2020
/
Revised: 9 December 2020
/
Accepted: 12 December 2020
/
Published: 17 December 2020
(This article belongs to the Special Issue Sustainable Management of Transportation Infrastructure Projects)
Abstract
:The road sector is one of the main sources of air emissions in the atmosphere during both construction and operation. The objective of the present paper is a comprehensive evaluation of the impact on air quality during the two main phases of life cycle of roads. In this case study of a motorway project, the emissions of the primary pollutants, CO, NOx, and PM10 are estimated, and the results showed that (i) CO and NOx pollutants released during both phases are comparable, while the emissions of PM10 are more significant in the construction phase; (ii) 85% of PM10 in construction is due to storage, transit on unpaved road, and crushing; (iii) the portals of the tunnel are the sites where there are higher concentrations of pollutants in operation; and (iv) the CO concentrations estimated by the dispersion model are strongly influenced by the topography.
1. Introduction
The road sector is one of the main sources of air emissions in the atmosphere during both construction and operation [1]. According to the European Commission, in 2018, the 24% of global CO2 emissions due to fuel combustion derived from the transportation sector. In particular, road transportation of passengers and goods (by car, truck, bus, or two-wheeler) was by far the main sector responsible, accounting for nearly three-quarters of emissions (72%). These figures extensively justify the growing interest towards the methods and practices in road construction, maintenance, rehabilitation, and operation aimed at reducing the air emissions. Furthermore, the increasing demand for freight and passenger transport, especially in developed countries, calls for an increasing attention to issues relating to air pollution. After all, the negative health effects of air pollutants, and particularly the particular matter, are well known and widely demonstrated by several studies [2,3], together with the economic implication deriving from the related increased premature mortality [4]. The exposure to air pollution is recognized as the major global risk factor for premature morbidity and mortality and has been linked to cardiovascular diseases [5], hypertension [6], and atherosclerosis [7]. Not negligible effects are also produced in the local vegetation [8].
All that considered, the assessment of the concentration of these substances in the air and the adoption of proper control strategies and mitigation measures are fundamental steps in achieving the environmental and social sustainability of road transportation.
During construction, the site activities such as material production and transportation, equipment and machineries, and excavation and earthmoving release into the atmosphere a large amount of pollutants [9,10]. Off-road machines, which are diesel-powered, are a significant font of direct air emissions such as carbon oxide (CO), nitrogen oxides (NOx), and particular matter (PM). The U.S. Environmental Protection Agency (EPA) estimates that off-road diesel equipment is the third largest source of NOx emissions from mobile fonts (14.5%) and the second largest source of PM (24.3%). Significant sources of PM emission are also the transits of trucks on unpaved roads, the aggregate crushing, and the storage of excavated materials [10].
During operation, the air pollution is due to vehicles exhaust gases. The pollution levels, especially in transportation microenvironments (i.e., near roadway or inside the tunnels), are higher than ambient concentrations [11,12], but the higher concentration, in case of major roads, is exhausted within few hundred meters.
In the literature, several studies have treated the topic of air pollution, but they answer the questions related to the emission and concentration of air pollutants separately for construction and operational phases of the roads. For construction, a lot of research has been dedicated to the effort of creating emission inventories for the off-road equipment [13,14,15]. Some authors [16,17] apply the portable emission measurement system to estimate the non-road machinery emission. Pirjola et al. [18] compared the exhaust emissions from a tractor in real-world and laboratory conditions. They found that emission factors were higher on-road compared to laboratory conditions and highest particle emissions were observed on-road during accelerations and engine braking. Other studies studied the influence of construction sites on air quality and focused on the estimation of emissions from road construction [9,19,20,21]. Mulenski et al. [22] investigated on PM2,5 and PM10 emission factors to assess emission inventories for the main construction activities.
Regarding the operation, different approaches have been pursued in the urban and rural contexts. At the urban scale, Munõz Miguel et al. [23] developed an air pollution model to evaluate the possible air pollution decrease in Madrid as the consequence of a hypothetical road pricing. They find that road pricing has significant effects on decreasing of air pollution during the peak operating and on shift from private car to public transport.
Wanga et al. [24] proposed a study in which the traffic-related emissions at intersections have been analyzed. Results of the study show that the average concentration of the pollutants is higher than the background site, and the level of traffic and the meteorological conditions also affects it.
In urban and rural roads, numerous studies have focused on the real-time air quality monitoring [25,26] and on the modeling of the traffic-related pollutants’ dispersion [27,28].
In the rural context, some studies have emphasized the importance of taking into account the effect of road grade in calculation of the emission, especially when duty-heavy vehicles are considered [29,30,31].
The combined assessment of the impact on air quality due to the construction and operation of road is scarcely represented in literature. In this view, the main contribution of this paper is precisely the assessment, at design stage, of the impact on air quality of the construction activities and traffic of a new motorway. The purpose is, firstly, the comparison of the impact on air quality of two important phases of the road life cycle. This is because, for main roads, such as the motorway, especially when made in complex contexts (hill or mountains), the construction phase can have a long duration due to the construction of demanding components, such as tunnels and bridges, and therefore the impact on air quality, although temporary, can produce undesirable and inacceptable effects on communities.
The second main objective of this study, which is part of wider research, is the assessment of the admissibility of the air emissions and the identification of the hotspots. In this way, it is possible to provide accurately indications in the development of effective strategies for pollution control and air quality management at roadsides for the aim of making the pollutants concentration tolerable and complying with the regulations. Previous papers reporting the results on the on-going research focused on the detailed analysis of the amount of emissions deriving from construction of the motorway [9] and on the study of the dispersion of concentration of PM10 emissions nearby the worksites [10]. The present paper takes into account also the traffic-related emissions during the operational phase for a comprehensive evaluation of the air emissions of a motorway and in order to quantify the real impact of the two road life steps on the air quality.
2. Materials and Methods
The method used in this work for assessing the air emission during construction and operation consists of the following steps:
- Definition of the study site
- Data collection on construction plan (construction sites, construction activities, duration of activities, equipment, and plants), motorway features (configuration, traffic flows), topography, and meteorology
- Calculation of emissions in construction and operation phases
- Modeling of critical pollutant dispersion in operation phase
- Comparison of impact on air quality in the two phases.
Figure 1 illustrates the conceptual framework of the study. The main steps are described in detail in the following paragraphs.
2.1. Study Site
The assessment of pollutants emissions in construction and operation in this work was carried out by considering a project of an Italian motorway, three lanes dual carriageway, belonging to the A category of Italian road standards [32]. The motorway has a length of 18 km, distributed into 5 tunnels (13.3 km), 5 bridges (1.4 km), and fills and embankments (3.2 km). The scheme of the motorway under investigation is shown in Figure 2, which also reports the distribution of the worksites.
2.2. Data Collection
The primary step for the calculation of the emissions during both construction and operational phases consists in the collection of the following data:
- Relevant characteristics (position, extension, function) of 25 work areas distinguished in construction sites (CS), in which the storage of materials and the production of the concrete and the elements for tunnels lining take place, and in technical areas (TA), where all equipment and plants needed for construction of bridges and tunnels are located.
- The type of off-road machines and the equipment used in each worksite (see Table 1). The number and type of equipment depend on the construction activities taking place in the worksite.
- The duration of construction of the motorway: 8 years.
- The traffic data. During operation, the amount of emissions depends mainly on the number and type of vehicles circulating. The motorway under examination, which has a length of 18 km, can be subdivided in two sections for the presence of two interchanges located at 4.5 km from the beginning and at the end. The day and night peak hour flow (maximum hourly flow during the day time is 6:00 a.m.–10:00 p.m. and night time is 10:00 p.m.–6:00 a.m.) and the percentage of heavy traffic (vehicle weight more than 3 tons) for the two sections are reported in Table 2.
- The data on the actual air quality gathered at five monitoring points along the site of the future motorway.
2.3. Modelling of Pollutants Emission
The calculation of the emissions was carried out separately for the construction and operation phase.
For construction, based on the gathered data, the first step of the study was the calculation of the emissions in each worksite originating from the activities that took place there.
To do this, the emission factors for all the running equipment and construction activities were calculated.
For equipment and trucks, the emission factors provided by [33,34] and reported in Table 3 were used.
In addition, in the worksites, the following activities were considered:
- Topsoil excavation
- Storage
- Transits of trucks on unpaved road
- Crushing of aggregates.
These activities produce a large amount of fine particulate. The models used for the calculation of the PM10 emission factors are reported in Table 4. Major details of the calculations are reported in [9].
For the calculation of the traffic-related emissions in operation, reference was made to the database provided by ISPRA-SINAnet [34] for the motorways.
In the definition of the emissive flows, the following hypotheses have been adopted:
- the emissions are referred to in the 2015 Italian fleet, consisting of 39.7% of diesel and 60.3% of gasoline vehicles
- the emissions are estimated considering the 2030 as reference year. According to PIARC [36], corrective factors are adopted in forecasting the future emissions. These factors consider that vehicle legislation has enforced more stringent emission rates and that vehicle technology has rapidly advanced, resulting in lower emissions.
The corrective factors applied to calculate the emissions from 2015 to 2030 are reported in Table 5.
Considering the distribution of the type of vehicles in the fleet, the emissive factor derived and applied are those reported in Table 6.
In order to quantify the emissions released in correspondence of the tunnel portals, a box model (perfectly mixed phase) is applied [37]. The model, based on the principle of mass conservation, is able to estimate, in stationary and conservative conditions, the concentrations of the different pollutants that are generated inside the tunnel.
The assumptions underlying the box model are the following:
- Perfectly blended phase
- Steady-state conditions over the time of incoming and outgoing air in the tunnel
- Stationary traffic flow
- Stationary emission flow
- Absence of abatement phenomena
- Uniform concentration within the tunnel determined by the phenomena of turbulence.
The equations for estimating the concentration inside the tunnel are the following:
where
C = C0 + (q × L)/(uwind × H)
q = C × (uwind·W·H) = C0·uwind·W·H + Q
Inlet flow = uwind·W·H·C0 + q·W·L
Output flow = uwind·W·H·C
Inlet Flow − Outlet Flow = 0
- C is the concentration inside the tunnel [g/h]
- C0 is the inlet concentration
- uwind is the constant incoming wind speed [m/s]
- W is the tunnel height [m]
- L is the tunnel length [m]
- Q is the emission of pollutant [g/s]
- q is the emission of pollutant per unit of surface = Q/Aemiss [g/s mq]
- Aemiss = W × L is the area of the emissive source [mq]
The mass flow of a generic pollutant coming out of the portal is equal to the sum of the flow rate emitted inside Q and the flow rate determined by the incoming air having a concentration C0.
It is assumed that all the emissions generated inside the tunnel are released in correspondence of the portals.
Therefore, the characterization of the source has been performed as follows:
- Estimate of the emission inside the tunnel taking into account its average length and the traffic;
- Definition of a virtual point source at the tunnel portal, diameter 6 m, height equal to half of the height of the tunnel, speed 1 m/s and temperature equal to 15 °C, at which is assigned the emission of the entire tunnel section.
The calculated emissions of each section of the motorway are summarized in Table 7.
Figure 3 and Figure 4 summarize the results of the calculation of the emissions of CO, NOx, and PM10 in the construction and operation phases, respectively.
It is possible to observe that in both cases, CO is the highest emitted pollutant in all worksites and in all motorway sections. This result complies with the existing literature [19,20,21]. Considering the average value of the pollutants, CO is about twice higher than NOx and about four times higher than PM10 in construction stage, while the prominence increases in operation, because the traffic produces a concentration of CO which is 2.6 times higher than NOx and 49 times higher than PM10. The average value of NOx in motorway construction is about double of that in operation. This is because during construction diesel powered vehicles are operated, which are the main cause of NOx emission. On the contrary, gasoline vehicles (main components in vehicular fleet) produce high emissions of CO and low emissions of NOx.
In operation, the maximum values of CO and NOx emissions are related to tunnel 3, and this is due to the fact that it is the longest tunnel in the motorway and the pollutants’ concentration at the portals is therefore the highest. For tunnel 4, it is also possible to observe emissions higher than the average of the other sections.
It is worthy to note that, except the aforementioned concentration peaks in operation, the construction phase produces in the worksites an amount of pollutants, which are averagely higher than the ones related to traffic in the corresponding section of the motorway. This outcome emphasizes the need for accurate estimates and effective control procedures of air pollution in road construction.
PM10 is a significant pollutant in the construction phase, although with a lower emission value with respect to the other pollutants. In operation, the PM10 emitted is one order of magnitude less than the one estimated in construction.
85% of the PM10 emissions in the construction phase is due to, on average, activities such as storage, crushing, and transit on unpaved roads, according to literature results [19,22], and about 15% is due to equipment and trucks operation (Figure 5).
The amount of PM10 emissions released by the equipment and trucks in construction is comparable to those released by the traffic in operational phase. The identification of the most emissive activities allows for the planning of effective strategies for control and mitigation measures.
Regarding the traffic-related emissions, in addition to the pollutants CO, NOx, and PM10, other relevant pollutants, such as benzene (C6H6) and volatile organic compounds (VOC), have also been considered. Figure 6 shows the emissions of these pollutants along the motorway separately for daytime (6 am–10 pm) and night-time (10 pm–6 am). Apart from the specific values depending on types of pollutant, the trend of variation along the motorway is similar, as is to be expected, because the traffic and the motorway configuration play a crucial role in the amount of emissions. As it is obvious, night emissions are notably reduced with respect to the daytime ones, since the traffic at night-time is about the 19% of the daily traffic.
Figure 7 illustrates the share of CO emissions for each type of motorway segment. It is possible to note that tunnels, which constitutes about the 70% of the motorway alignment, mainly contribute (72%) to the CO emissions, in particular the tunnel portals, which are the hotspots for this pollutant. Cuttings contribute for 17%, viaducts for 8%, and embankment for 3%. A similar trend is recorded also for NOx and PM10.
2.4. Modelling of CO Dispersion
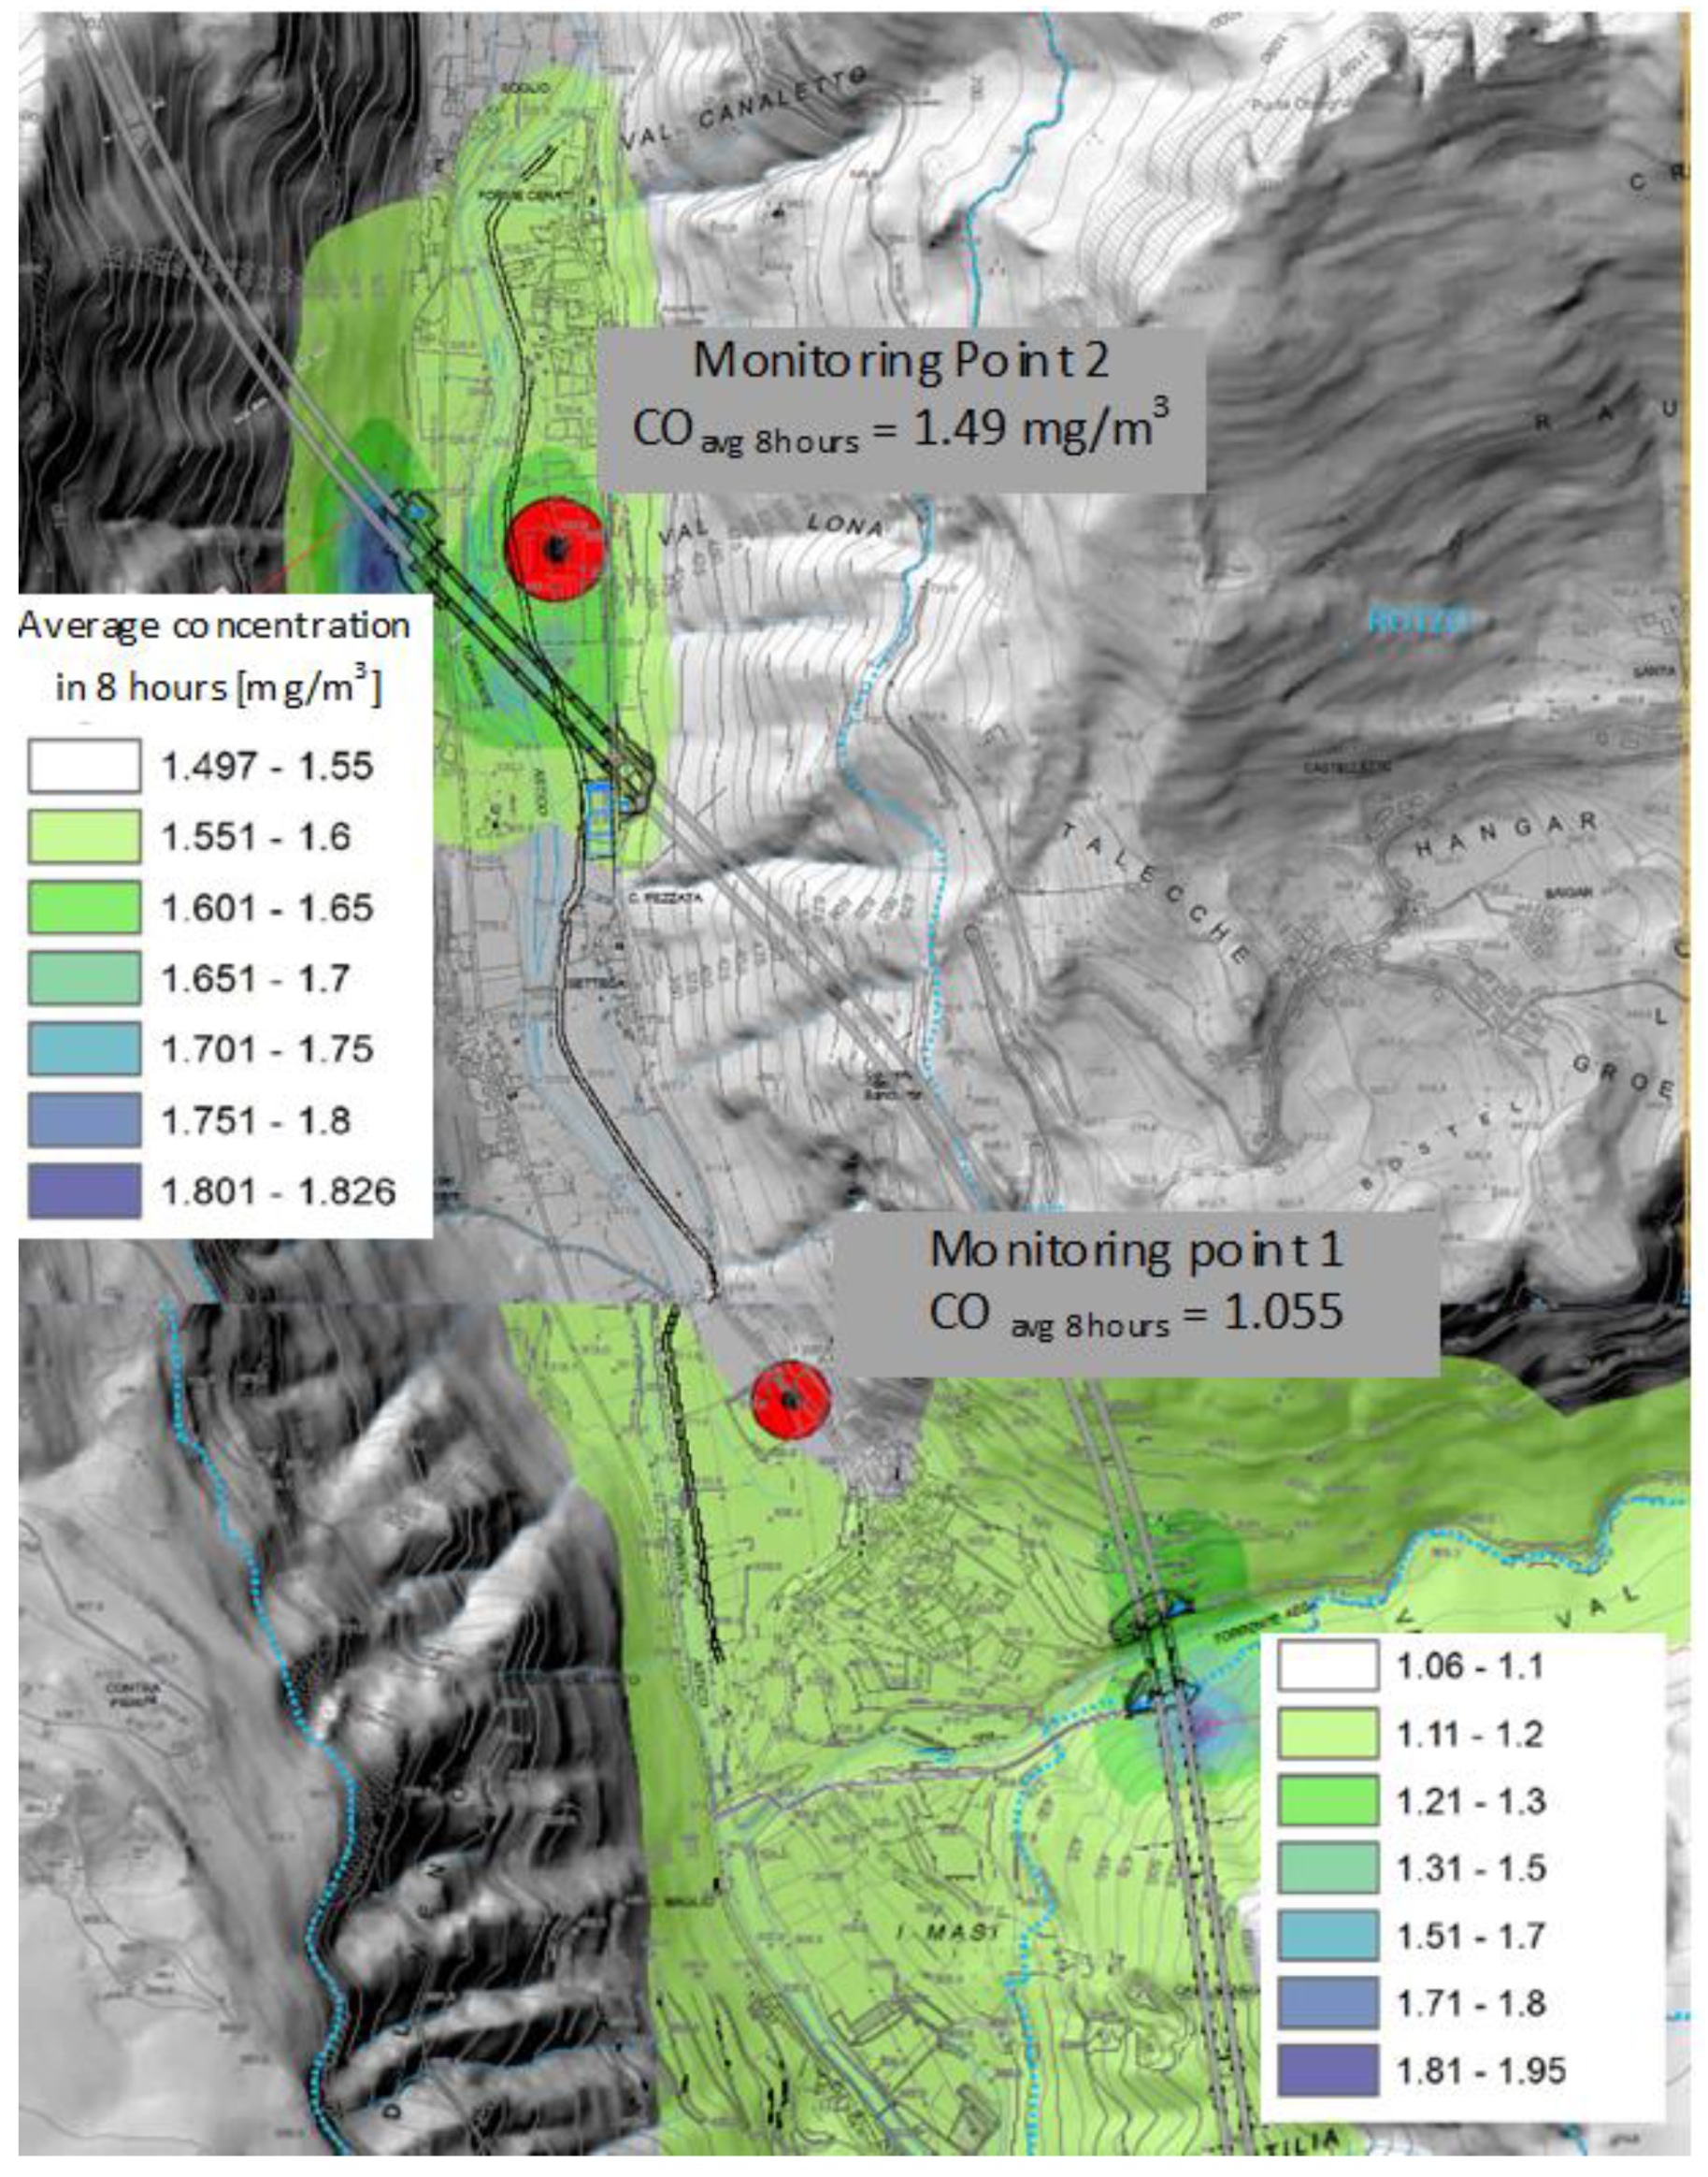
With specific reference to CO, which is the highest emitted pollutant, and to the sections of the motorway from tunnel 3 to tunnel 5 characterized by the highest value of the emissions (see Figure 2 and Figure 4), the modelling of the dispersion is carried out using the CALPUFF model [38]. This model simulates the atmospheric pollution dispersion, taking into account the topography and is based on meteorological data (wind, temperature, pressure) processed with CALMET [39].
Table 8 summarizes the characteristics of the road sections included in the modelling and simulated as an area source (embankments and viaducts), while Table 9 reports the characteristics of the tunnel portals considered as point sources.
Results of dispersion modelling are reported in the map in Figure 8, where the areas with different values of CO concentration (average of 8 h) are represented with different colors. The values of the concentration are the sum of the background concentration measured in the two monitoring points reported in the maps and the contribution of the future traffic in the motorway. By analyzing the results of the simulation, it is possible to observe how the spatial distribution of concentrations of pollutants on the ground is strongly influenced by the topography of the area. In general, the areas at higher CO concentration are those adjacent to tunnel portals. However, also in these hotspots, the concentration does not determine overcoming of the normative limits (CO limit = 10 mg/m3) in correspondence of the receptors, but on the contrary, the concentration remains well below the limit.
3. Conclusions
This study deals with the assessment of the impact on air quality of the construction and operation of a motorway. The impact on air quality is assessed in terms of the emissions of the primary pollutants CO, NOx, and PM10. The main conclusions of the analyses and evaluations carried out are:
- The rate of CO and NOx pollutants released during both phases, construction and operation, are comparable, while the emissions of PM10 are lower. However, PM10 is a significant pollutant in the construction phase, being one order of magnitude higher than in operational phase.
- PM10 in the construction phase originated in a percentage of 85% by storage, transit on unpaved road, and aggregate crushing, and in little part (15%) by the exhaust gases emissions of equipment and trucks.
- In operation, the portals of the tunnel, throughout which exit all the emissions produced inside the tunnel, are the main hotspots of the motorway. The pollutant concentrations in these points are four times higher than the maximum values estimated in the construction for CO and NOx. Except these points, in most cases, the average emissions of CO and NOx in construction is higher than the ones in the operation phase.
- As a consequence of these findings, in road construction, an accurate estimate of air emissions appears essential, as well as the constant monitoring aimed at the comparison of the estimated theoretical values from the equations and the measured ones and the implementation of proper mitigation measures, which can be eventually further tailored based on the monitoring outcomes. The attention to the construction phase should be higher, especially for the roads that require activities’ duration to be significantly higher for the presence of demanding components, tunnels and bridges.
- The most emissive activities in construction and the tunnel portals in motorway operation are the hotspots, to which the greatest attention must be directed in order to achieve objectives of sustainability in road transportation.
The overall assessment of how the motorway affects air quality in the two main phases of its life cycle has yielded interesting results of more general application than the case study covered in the paper. In fact, the detailed analysis of the construction and operation phases and their implications in terms of pollutants emission allowed highlighting the activities and sections more emissive and therefore preferable targets of mitigation strategies. Effective mitigation measures during construction can be wetting of the ground, coverage of the open-air container of the truck when filled with construction materials, and application of modern technologies for the abatement of particulate emissions in the crushing plants. In operation, roadside vegetation barriers can help to reduce the pollution dispersion.
The findings of this study can assist the stakeholders, road agencies, designers, controllers, and enterprises, to develop activity-specific (in construction) and site-specific (in construction and operation) control strategies and mitigation measures and to set up properly monitoring plans in order to reduce the emissions and make road construction and operation more environmentally and socially sustainable. The findings are related to the motorway project and therefore merit further assessment and validation in future research studies about other types of roads, locations, and traffic conditions.
Funding
This research received no external funding.
Conflicts of Interest
The author declares no conflict of interest.
References
- Iarocci, G.; Andrea Cocchiara, R.A.; Sestili, C.; Del Cimmuto, A.; La Torre, G. Variation of atmospheric emissions within the road transport sector in Italy between 1990 and 2016. Sci. Total Environ. 2019, 692, 1276–1281. [Google Scholar] [CrossRef] [PubMed]
- Hime, N.J.; Marks, G.B.; Cowie, C.T. A Comparison of the Health Effects of Ambient Particulate Matter Air Pollution from Five Emission Sources. Int. J. Environ. Res. Public Health 2018, 15, 1206. [Google Scholar] [CrossRef] [PubMed] [Green Version]
- Kim, K.H.; Kabir, E.; Kabir, S.A. Review on the human health impact of airborne particulate matter. Environ. Int. 2015, 74, 136–143. [Google Scholar] [CrossRef] [PubMed]
- Paril, V.; Tothov, D. Assessment of the burden on population due to transport-related air pollution: The Czech core motorway network. J. Clean. Prod. 2020, 275, 123111. [Google Scholar] [CrossRef]
- Brook, R.D.; Rajagopalan, S.; Pope, C.A., 3rd; Brook, J.R.; Bhatnagar, A.; Diez-Roux, A.V.; Kaufman, J.D. Particulate matter air pollution and cardiovascular disease: An update to the scientific statement from the American Heart Association. Circulation 2010, 121, 2331–2378. [Google Scholar] [CrossRef] [PubMed] [Green Version]
- Fuks, K.B.; Weinmayr, G.; Basagana, X.; Gruzieva, O.; Hampel, R.; Oftedal, B.; Hoffmann, B. Long-term exposure to ambient air pollution and traffic noise and incident hypertension in seven cohorts of the European study of cohorts for air pollution effects (ESCAPE). Eur. Heart J. 2017, 38, 983–990. [Google Scholar] [CrossRef] [Green Version]
- Rao, X.Q.; Zhong, J.X.; Maiseyeu, A.; Gopalakrishnan, B.; Villamena, F.A.; Chen, L.C.; Rajagopalan, S. CD36-dependent 7-ketocholesterol accumulation in macrophages mediate progression of atherosclerosis in response to chronic air pollution exposure. Circ. Res. 2014, 115, 770–780. [Google Scholar] [CrossRef] [Green Version]
- Bignal, K.L.; Ashmore, M.R.; Headley, A.D.; Stewart, K.; Weigert, K. Ecological impacts of air pollution from road transport on local vegetation. Appl. Geochem. 2007, 22, 1265–1271. [Google Scholar] [CrossRef]
- Giunta, M.; Lo Bosco, D.; Leonardi, G.; Scopelliti, F. Estimation of gas and dust emissions in construction sites of a motorway project. Sustainability 2019, 11, 7218. [Google Scholar] [CrossRef] [Green Version]
- Giunta, M. Assessment of the environmental impact of road construction: Modelling and prediction of fine particulate matter emissions. Build. Environ. 2020, 176, 106865. [Google Scholar] [CrossRef]
- Hitchins, J.; Morawska, L.; Wolff, R.; Gilbert, D. Concentrations of submicrometre particles from vehicle emissions near a major road. Atmos. Environ. 2000, 34, 51–59. [Google Scholar] [CrossRef] [Green Version]
- Wangchuk, T.; Knibbs, L.D.; He, C.; Morawska, L. Mobile assessment of on-road air pollution and its sources along the Easte West Highway in Bhutan. Atmos. Environ. 2015, 118, 98–106. [Google Scholar] [CrossRef]
- Lim, J.H.; Jung, S.W.; Lee, T.W.; Kim, J.C.; Seo, C.Y.; Ryu, J.H.; Hwang, J.W.; Kim, S.M.; Eom, D.S. A study on calculation of air pollutants emission factors for construction equipment. J. Korean Soc. Atmos. Environ. 2009, 25, 188–195. [Google Scholar] [CrossRef]
- Wang, F.; Li, Z.; Zhang, K.; Di, B.; Hu, B. An overview of non-road equipment emissions in China. Atmos. Environ. 2016, 13, 283–289. [Google Scholar] [CrossRef]
- Cao, T.; Durbin, T.D.; Russell, R.L.; Cocker III, D.R.; Scora, G.; Maldonado, H.; Johnson, K.C. Evaluations of in-use emission factors from off-road construction equipment. Atmos. Environ. 2016, 147, 234–245. [Google Scholar] [CrossRef] [Green Version]
- Fu, M.; Ge, Y.; Tan, J.; Teng, T.; Liang, B. Characteristics of typical non-road machinery emissions in China by using portable emission measurement system. Sci. Total Environ. 2012, 437, 255–261. [Google Scholar] [CrossRef]
- Cao, T.; Russell, R.L.; Durbina, T.D.; Cocker, D.R.; Burnette, A.; Calavita, J.; Maldonado, H.; Johnson, K.C. Characterization of the emissions impacts of hybrid excavators with a portable emissions measurement system (PEMS)-based methodology. Sci. Total Environ. 2018, 635, 112–119. [Google Scholar] [CrossRef] [Green Version]
- Pirjola, L.; Rönkkö, T.; Saukko, E.; Parviainen, H.; Malinen, A.; Alanen, J.; Saveljeff, H. Exhaust emissions of non-road mobile machine: Real-world and laboratory studies with diesel and HVO fuels. Fuel 2017, 202, 154–164. [Google Scholar] [CrossRef] [Green Version]
- Faber, P.; Drewnick, F.; Borrmann, S. Aerosol particle and trace gas emissions from earthworks, road construction, and asphalt paving in Germany: Emission factors and influence on local air quality. Atmos. Environ. 2015, 122, 662–671. [Google Scholar] [CrossRef]
- Chen, J.; Zhao, F.; Liu, Z.; Ou, X.; Hao, H. Greenhouse gas emissions from road construction in China: A province-level analysis. J. Clean. Prod. 2017, 168, 1039–1047. [Google Scholar] [CrossRef]
- Alzard, M.H.; Maraqa, M.A.; Chowdhury, R.; Khan, Q.; Albuquerque, F.D.B.; Mauga, T.I.; Aljunadi, K.N. Estimation of Greenhouse Gas Emissions Produced by Road Projects in Abu Dhabi, United Arab Emirates. Sustainability 2019, 11, 2367. [Google Scholar] [CrossRef] [Green Version]
- Muleski, G.E.; Cowherd, C., Jr.; Kinsey, J.S. Particulate emissions from construction activities. J. Air Waste Manag. Assoc. 2005, 55, 772–783. [Google Scholar] [CrossRef] [PubMed] [Green Version]
- Muñoz Miguel, J.P.; Simón de Blas, C.; García Sipols, A.E. A forecast air pollution model applied to a hypothetical urban road pricing scheme: An empirical study in Madrid. Transp. Res. Part. D 2017, 55, 21–38. [Google Scholar] [CrossRef]
- Wanga, Z.; Zhongb, S.; Hec, H.; Pengd, Z.-R.; Caib, M. Fine-scale variations in PM2.5 and black carbon concentrations and corresponding influential factors at an urban road intersection. Build. Environ. 2018, 141, 215–225. [Google Scholar] [CrossRef]
- Gong, W.; Zhang, T.; Zhu, Z.; Ma, Y.; Ma, X.; Wang, W. Characteristics of PM1.0, PM2.5, and PM10, and their relation to black carbon in Wuhan, Central China. Atmosphere 2015, 6, 1377–1387. [Google Scholar] [CrossRef] [Green Version]
- Liu, H.; Rodgers, M.O.; Guensler, R. The impact of road grade on vehicle accelerations behaviour, PM2.5 emissions, and dispersion modeling. Transp. Res. Part. D 2019, 75, 297–319. [Google Scholar] [CrossRef]
- Csikós, A.; Varga, I.; Hangos, K.M. Modeling of the dispersion of motorway traffic emission for control purposes. Transp. Res. Part C 2015, 58, 598–616. [Google Scholar]
- Antanasijevića, D.; Pocajtb, V.; Perić-Grujićb, A.; Ristićb, M. Multiple-input–multiple-output general regression neural networks model for the simultaneous estimation of traffic-related air pollutant emissions. Atmos. Pollut. Res. 2018, 9, 38–397. [Google Scholar] [CrossRef]
- Wyatt, D.W.; Li, H.; Tale, J.E. The impact of road grade on carbon dioxide (CO2) emission of a passenger vehicle in real-world driving. Transp. Res. Part D Transp. Environ. 2014, 32, 160–170. [Google Scholar] [CrossRef] [Green Version]
- Sentoff, K.M.; Aultman-Hall, L.; Holmen, B.A. Implications of driving style and road grade for accurate vehicle activity data and emissions estimates. Transp. Res. Part D Transp. Environ. 2015, 35, 175–188. [Google Scholar] [CrossRef]
- Liu, X.; Schnelle-Kreis, J.; Zhang, X.; Bendl, J.; Khedr, M.; Jakobi, G.; Schloter-Hai, B.; Hovorka, J.; Zimmermanna, R. Integration of air pollution data collected by mobile measurement to derive a preliminary spatio temporal air pollution profile from two neighboring German-Czechborder villages. Sci. Total Environ. 2020, 722, 137632. [Google Scholar] [CrossRef] [PubMed]
- Italian Ministry of Infrastructures and Transport. Decree n. 6792 5/11/2001 Norme Geometriche e Funzionali per la Costruzione Delle Strade; Italian Ministry of Infrastructures and Transport: Rome, Italy, 2001.
- United States Environmental Protection Agency (US EPA). Air Quality Analysis Guidance Handbook “(Handbook) Off-Roads Mobile Source Emission Factors AP 42, 5th ed.; United States Environmental Protection Agency: Washington, DC, USA, 2006; Volume I.
- ISPRA–SINAnet. Database of Average Emission Factors for Road Transport in Italy. 2017. Available online: http://www.sinanet.isprambiente.it/it/sia-ispra/fetransp/ (accessed on 20 October 2020).
- Tuscany Region. Regional Plan for Ambient Air Quality. Annex 2: Technical Document with Determination of Emission Limit Values and Prescription for Productive Activities. 2018. Available online: https://www.regione.toscana.it/documents/10180/14847862/Allegato-A-PRQA-All2-documentotecnico.pdf/0c520559-a270-4698-9652-7873ae007863 (accessed on 20 October 2020).
- Sturm, P.J.; Brandt, R.; Burkhart, J.F.; Clark, G.; Del Rey, I.; Ferro, E.; Fleming, C.; Harvey, N.; Hervé, F.; Lucatelli, N.; et al. Road tunnels: Vehicle Emissions and Air Demand for Ventilation; PIARC World Road Association: Paris, France, 2019; Volume 2019R02, ISBN 978-2-84060-500-3. [Google Scholar]
- Holmes, N.S.; Morawska, L. A Review of Dispersion Modelling and its application to the dispersion of particles: An overview of different dispersion models available. Atmos. Environ. 2006, 40, 5902–5928. [Google Scholar] [CrossRef] [Green Version]
- Scire, J.S.; Strimaitis, D.G.; Yamartino, R.J. User’s Guide for the CALPUFF Dispersion Model (Version 5); Earth Tech, Inc.: Concord, MA, USA, 2000; p. 01742. [Google Scholar]
- Scire, J.S.; Robe, F.R.; Fernau, M.E.; Yamartino, R.J. A User’s Guide for the CALMET Meteorological Model (Version 5); Earth Tech, Inc.: Concord, MA, USA, 2000; p. 01741. [Google Scholar]
Figure 1.
Conceptual framework of the study.

Figure 2.
Scheme of the motorway and location of construction sites.
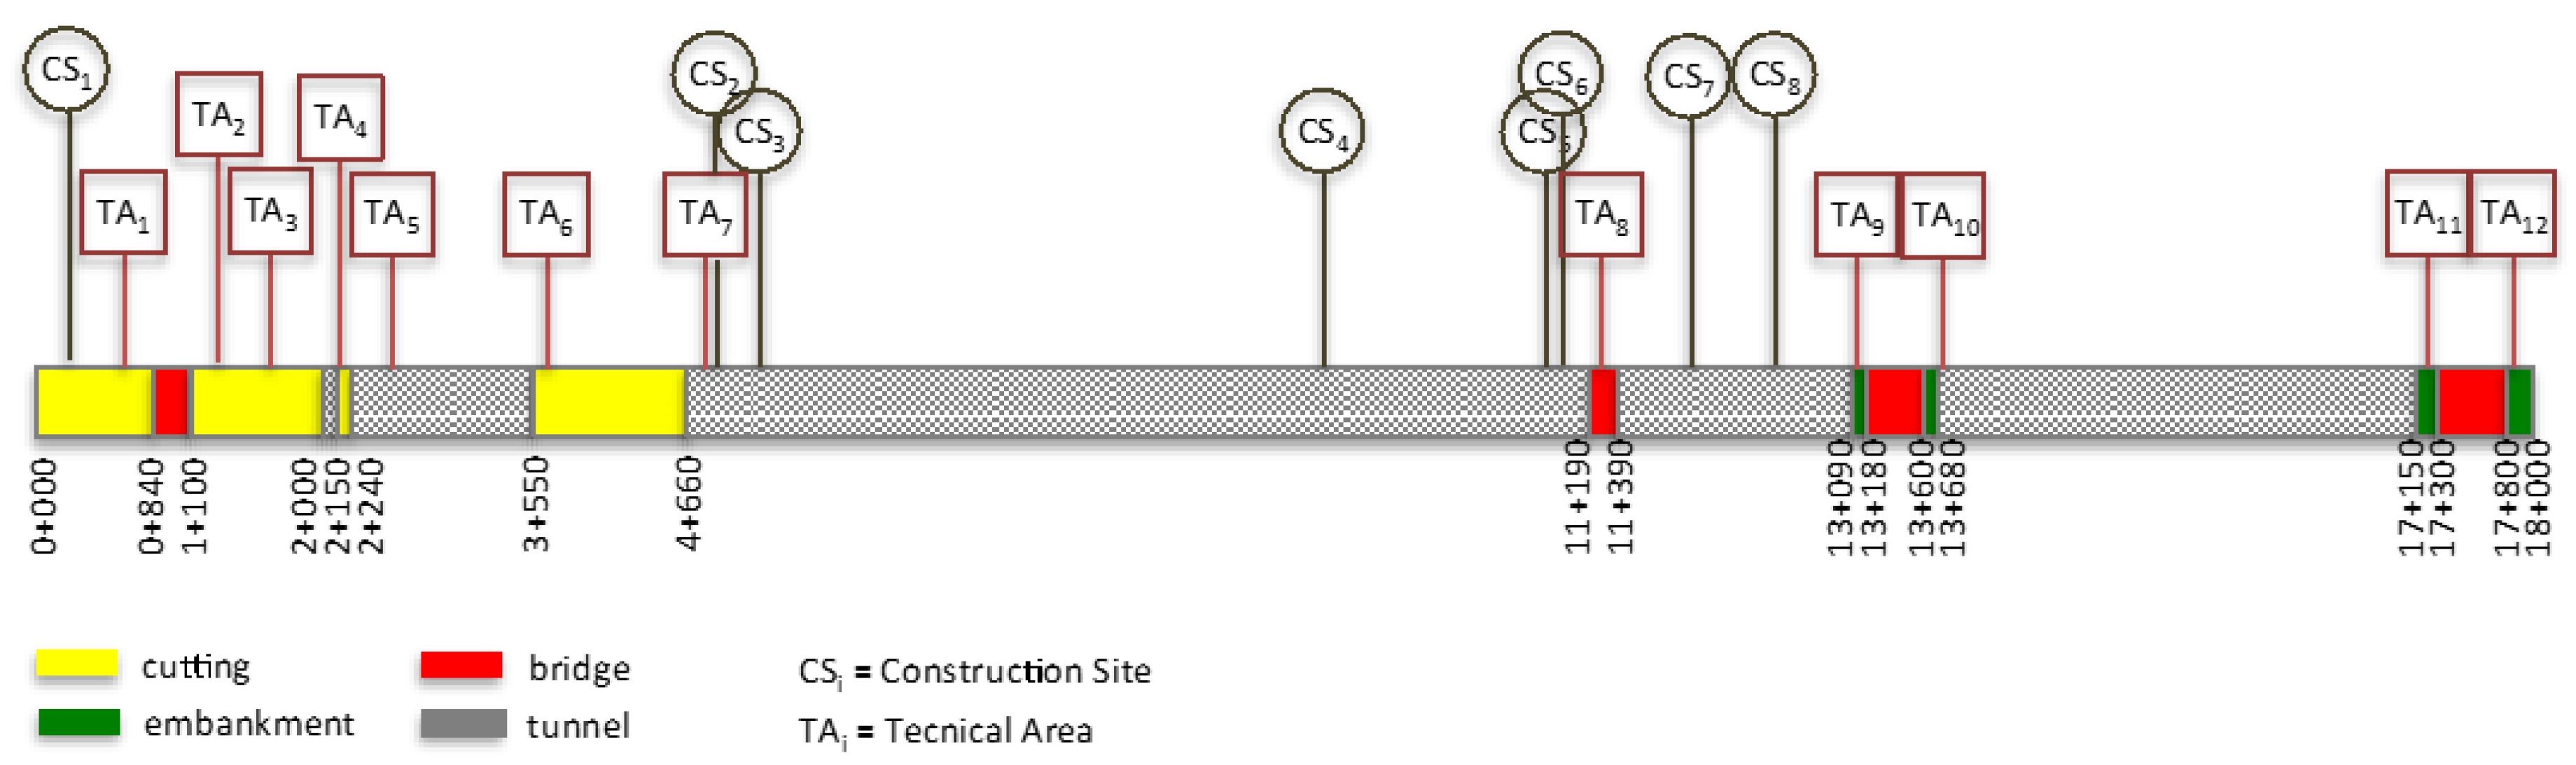
Figure 3.
Emissions in construction sites.
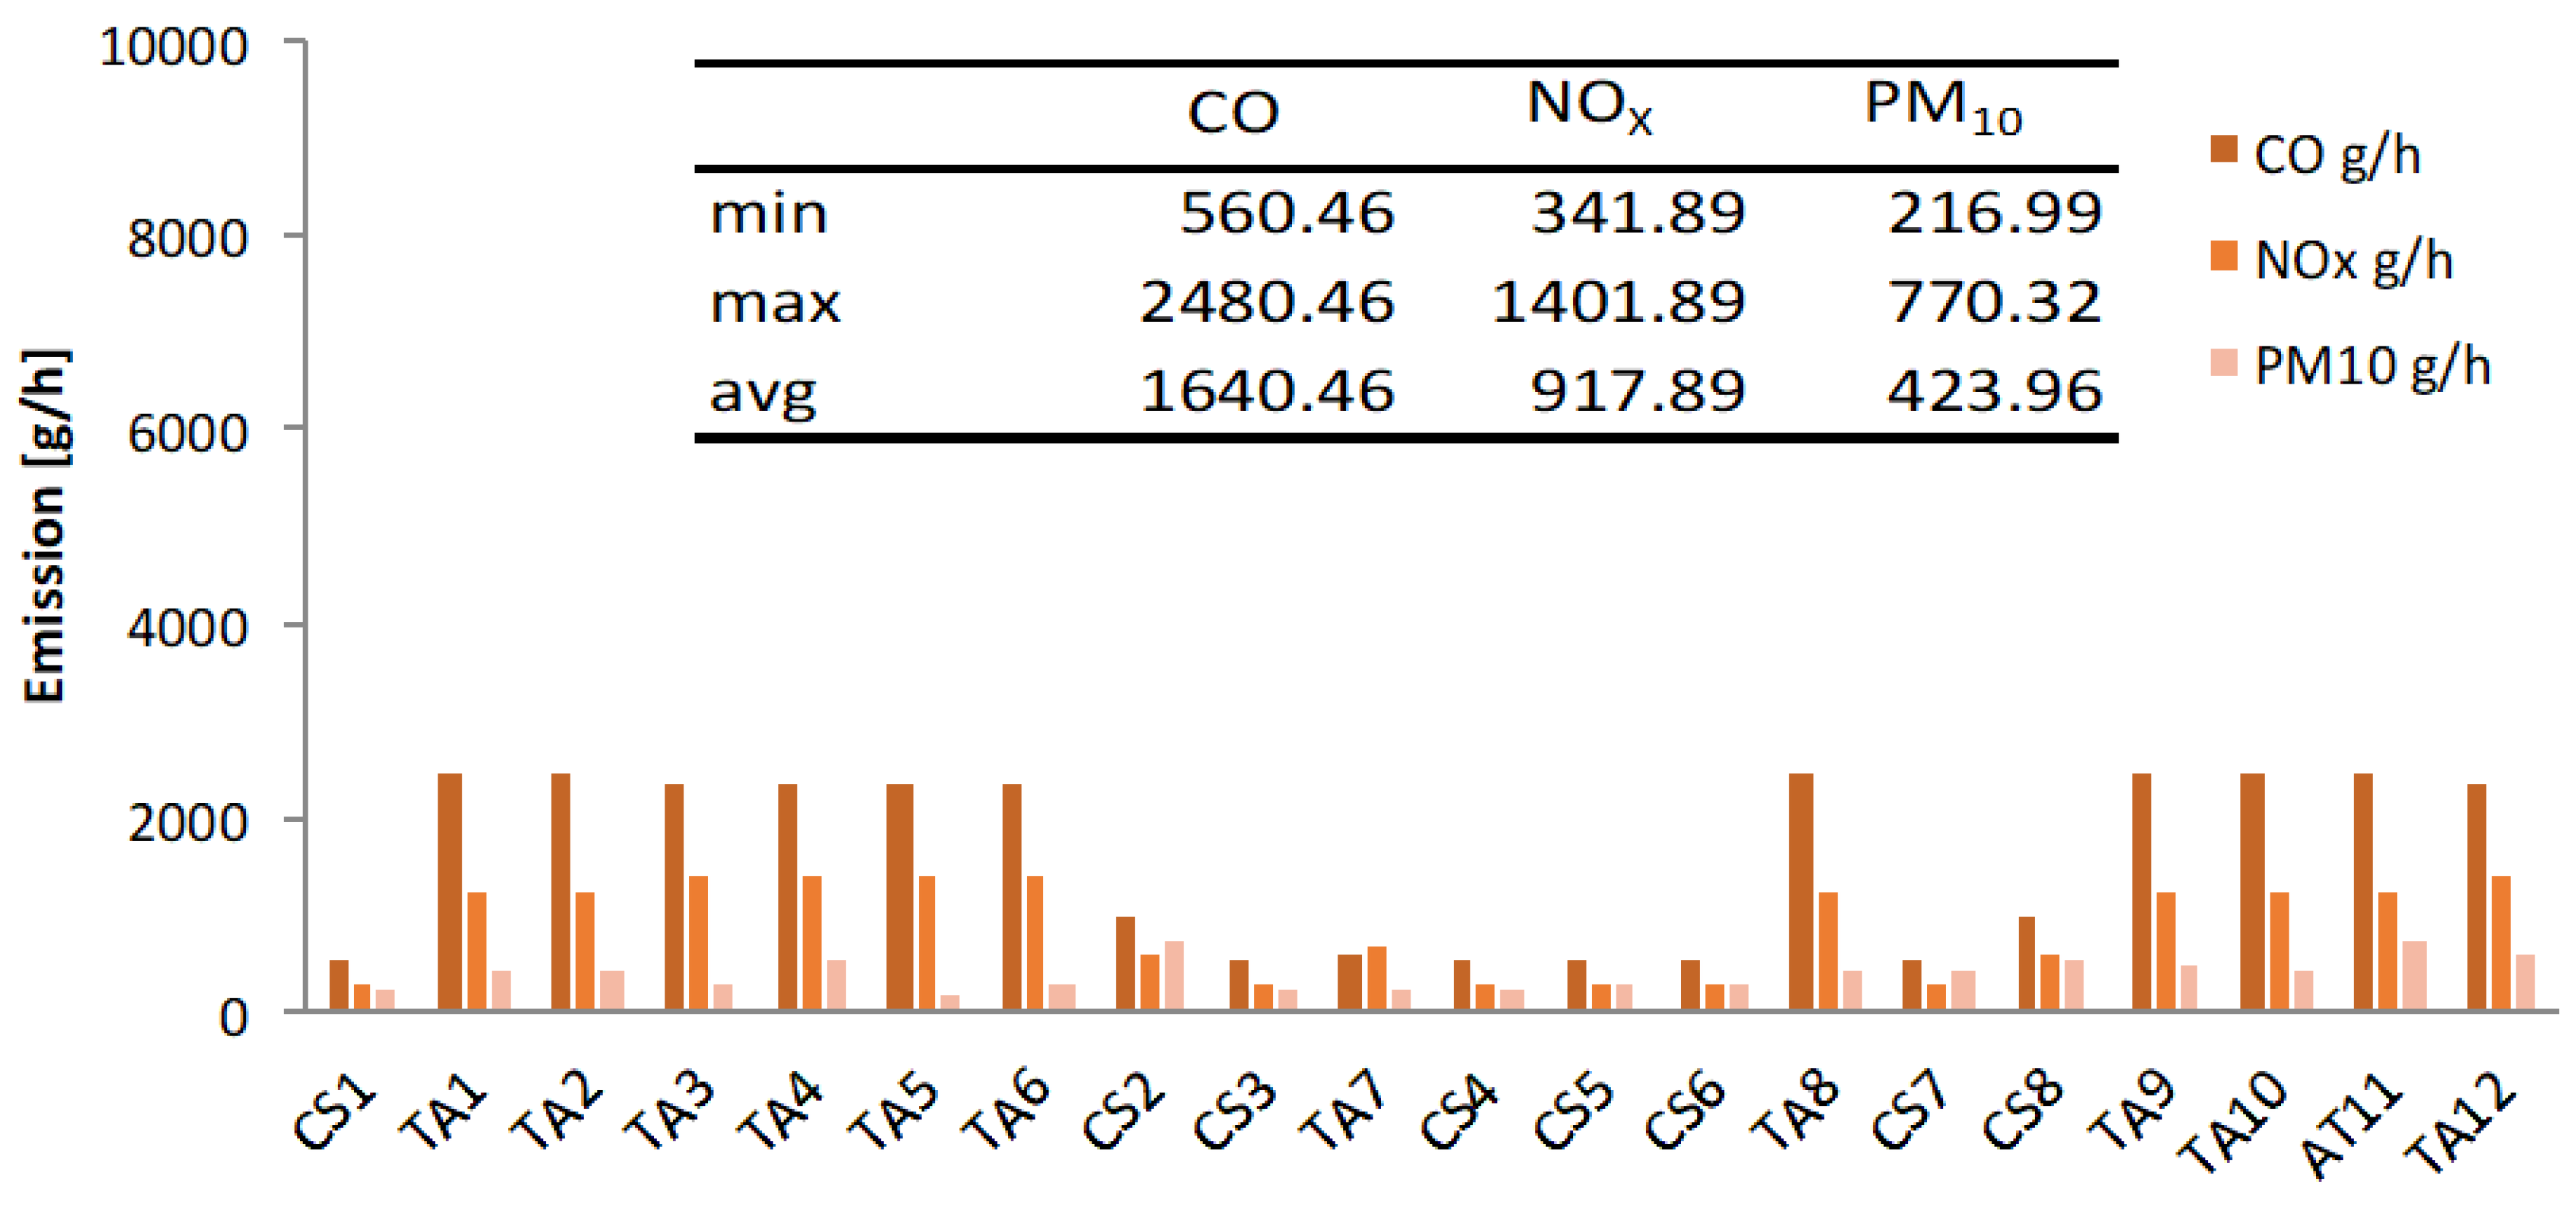
Figure 4.
Emissions within the motorway.
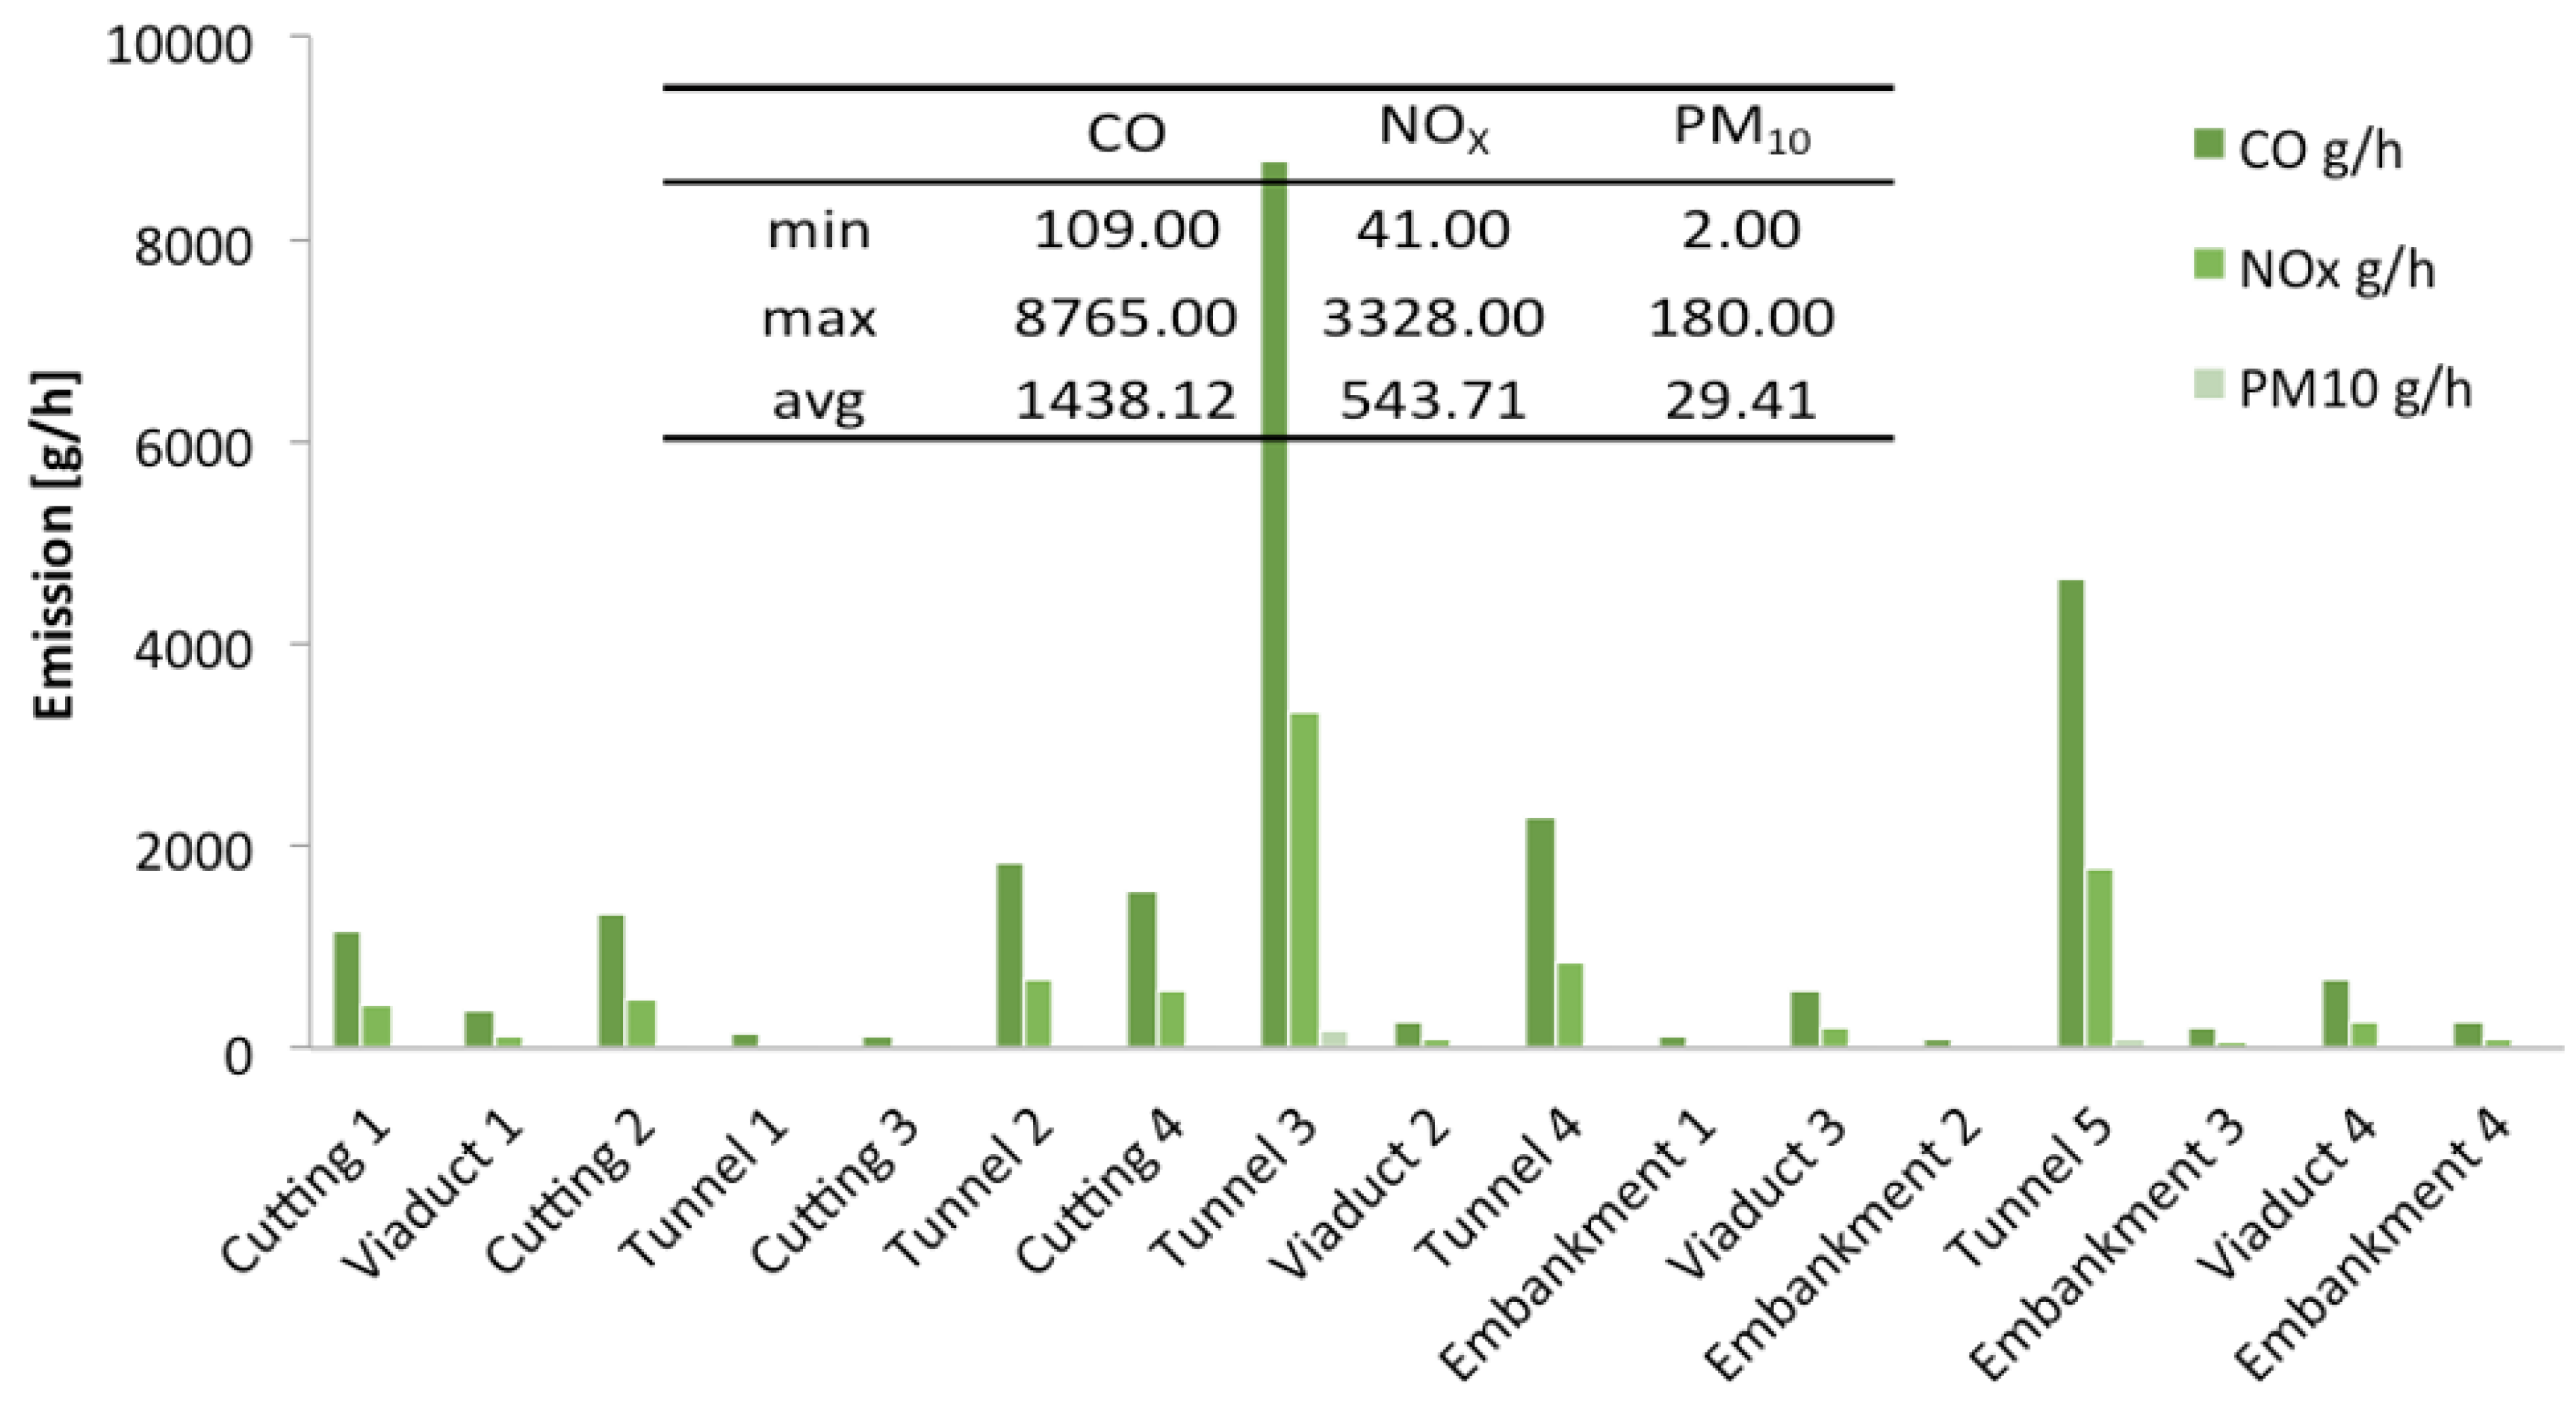
Figure 5.
Contribution of construction activities to PM10 emission.
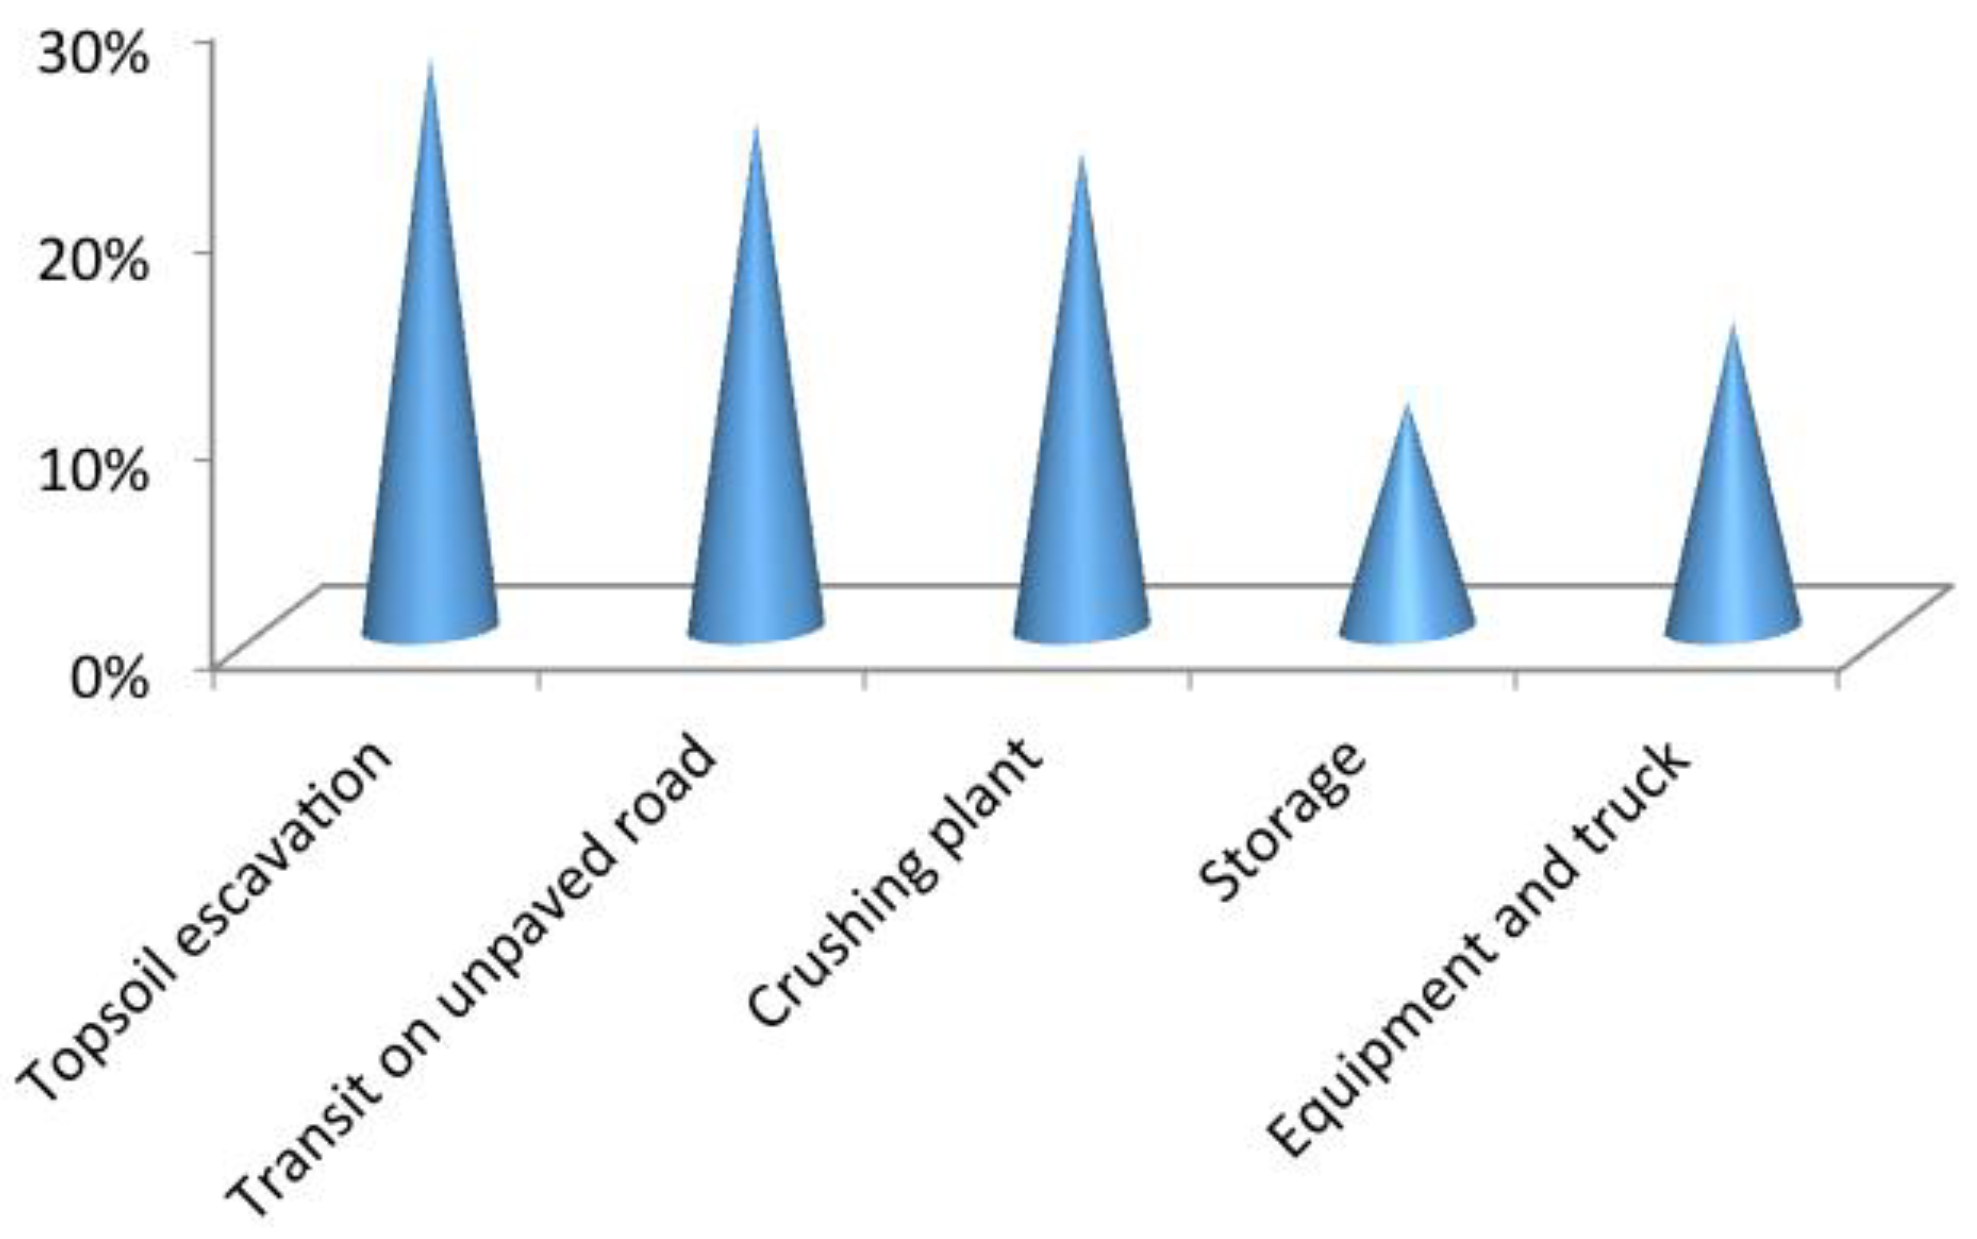
Figure 6.
Contribution of construction activities to (a) CO, (b) NOx, (c) PM10, (d) C6H6, and (e) VOC emissions.
Figure 6.
Contribution of construction activities to (a) CO, (b) NOx, (c) PM10, (d) C6H6, and (e) VOC emissions.
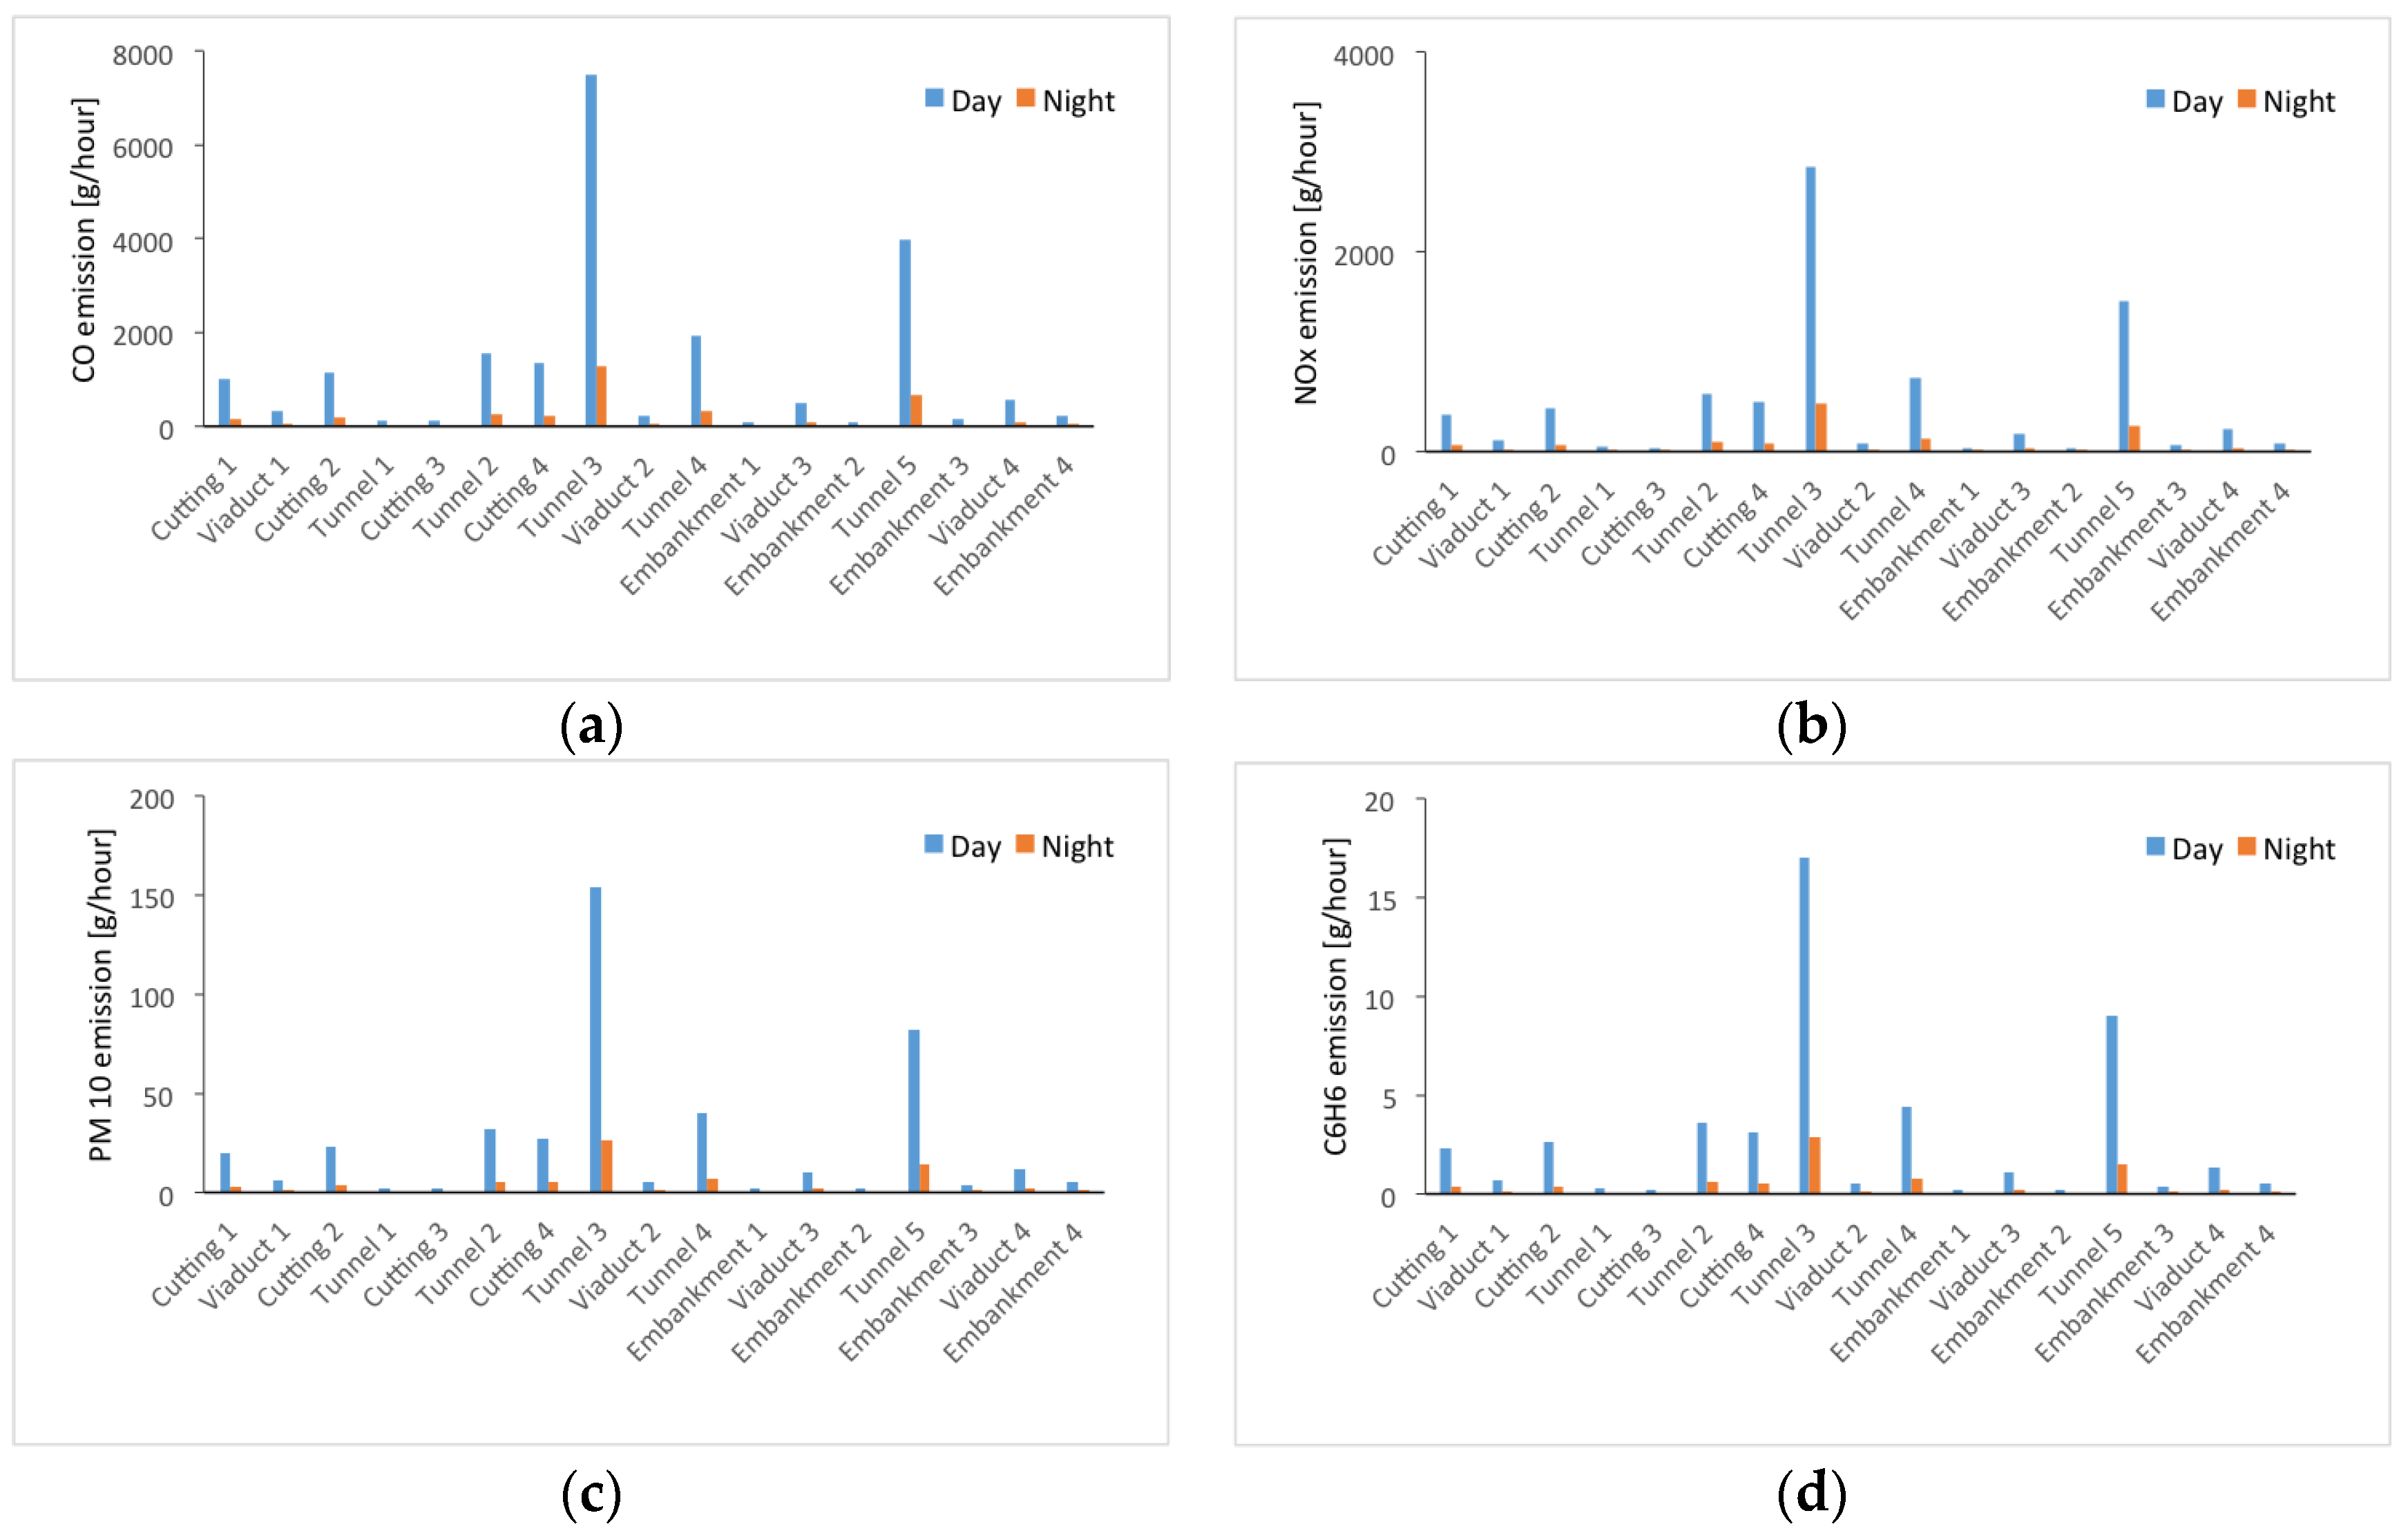
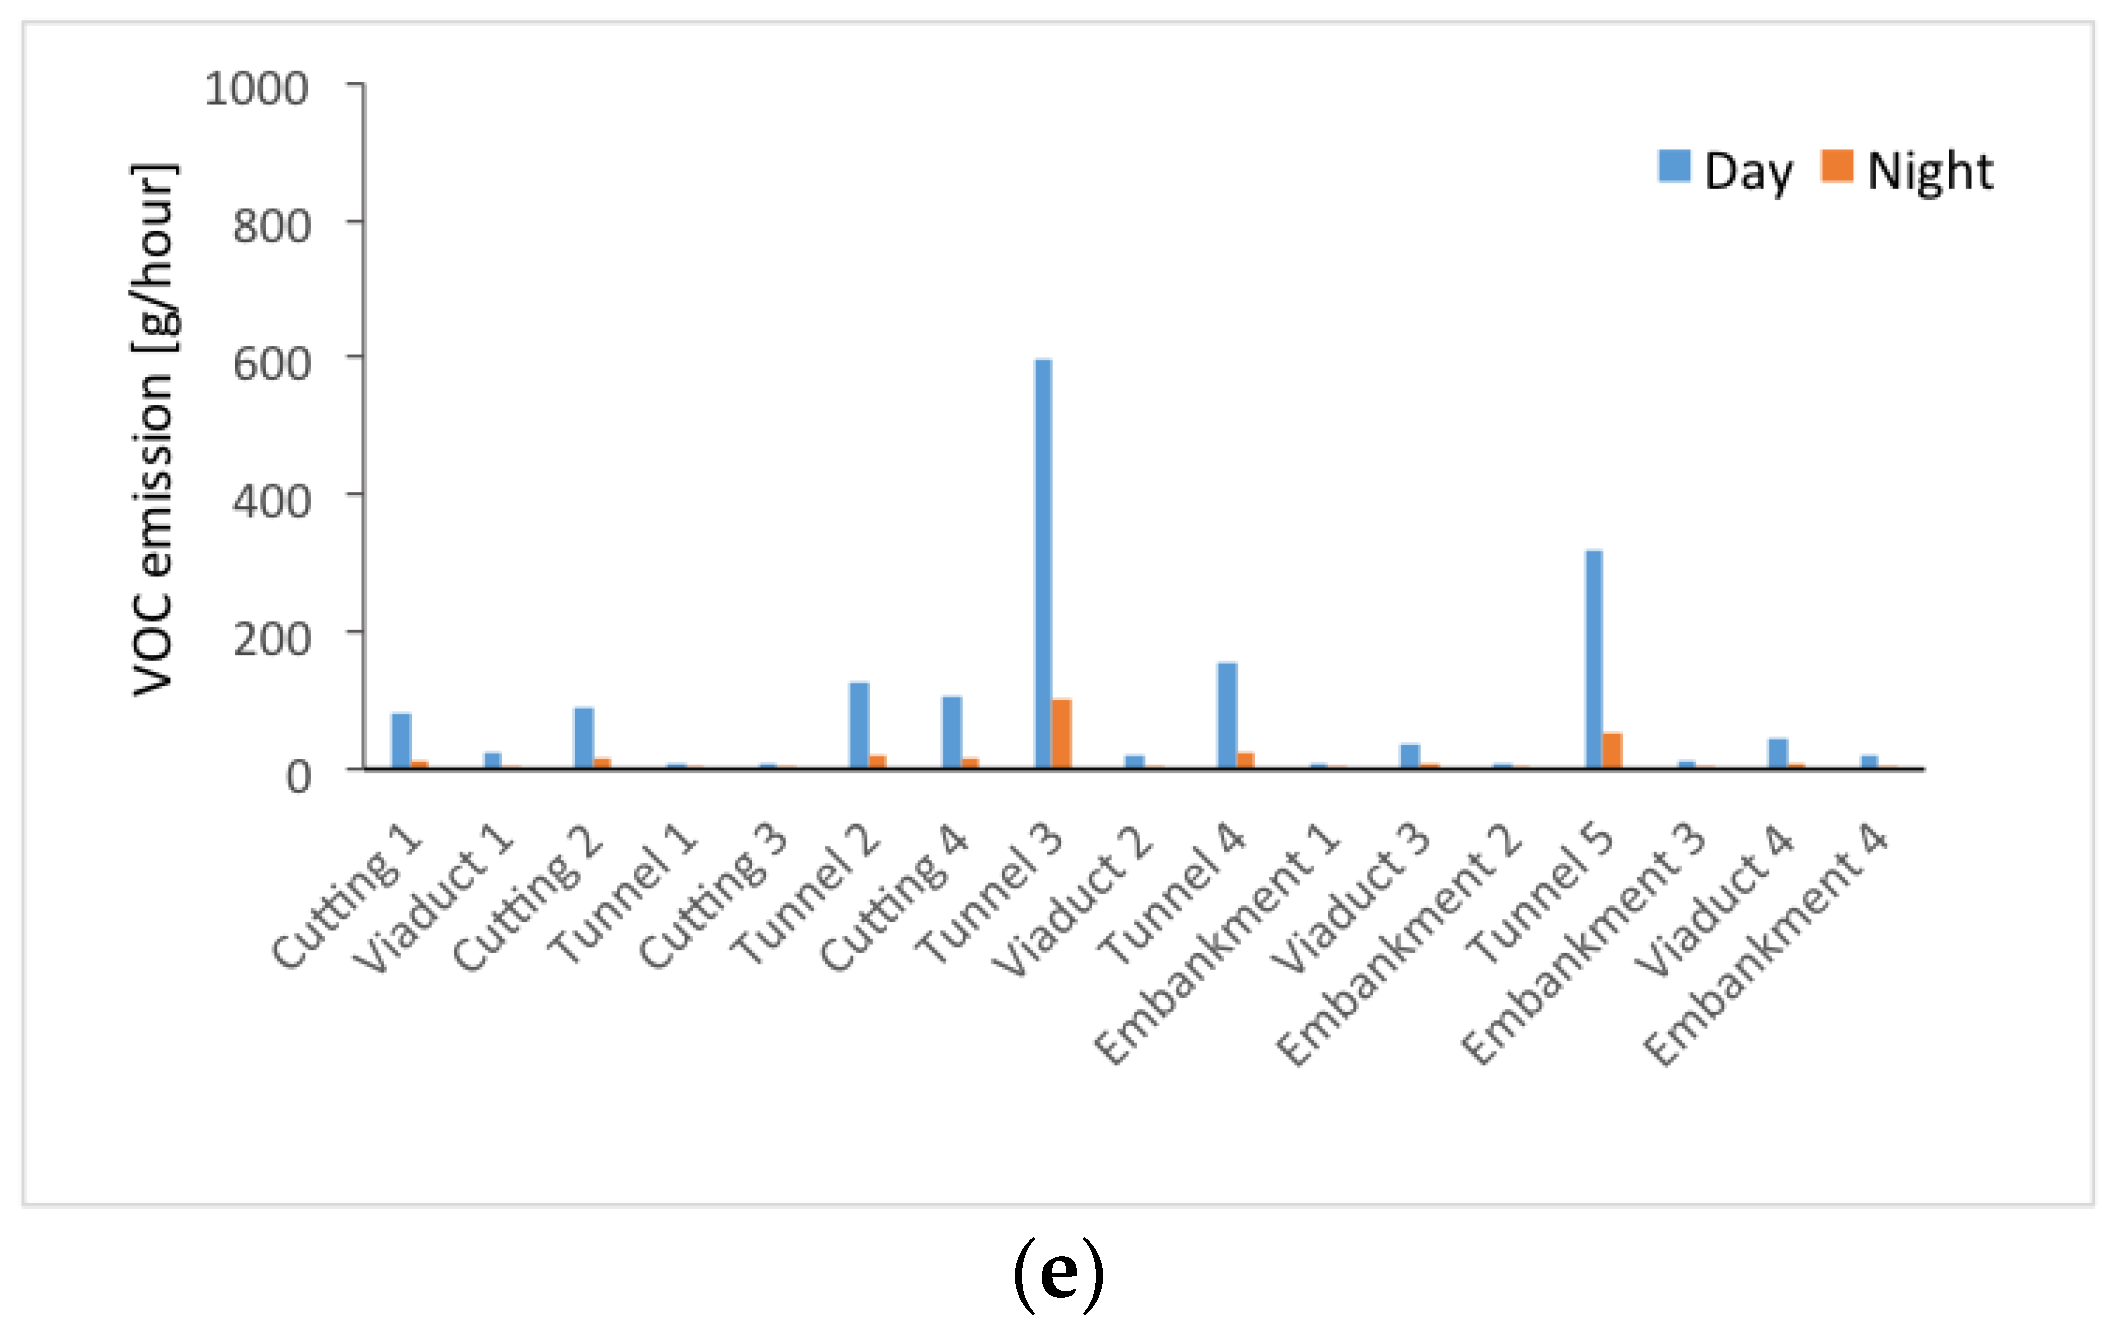
Figure 7.
Share of CO emission for motorway configuration.

Figure 8.
Concentration of CO (average on 8 h) nearby the motorway.

Table 1.
Off-road machines and equipment in construction sites [9].
Table 1.
Off-road machines and equipment in construction sites [9].
| Worksite | Equipment |
|---|---|
| CS1, CS3, CS4, CS5, CS6, CS7, TA13 | 2 Rubber-tired loaders 2 Trucks |
| TA1, TA2, TA8 | 4 Drilling machines 2 Excavators 2 Rubber-tired loaders 2 Cement mixers 2 Trucks |
| TA3, TA4, TA5, TA6, TA9, TA10, TA11, TA12 | 2 Excavators 2 Rubber-tired loaders 2 Graders 2 Roller compactors 2 Trucks |
| CS2, CS8 | 2 Rubber-tired loaders 1 Crushing plant 1 Concrete plant 2 Trucks |
| TA7 | 1 Rubber-tired loader 1 Crane 1 Conveyor belt 2 Trucks |
Table 2.
Traffic flows.
| Peak Hour Flow (Vehicle/Hour) | Heavy Vehicle (%) | ||
|---|---|---|---|
| Day | Night | ||
| Section 1 (0+000–4+500) | 910 | 154 | 26.3 |
| Section 2 (5+000–18+000) | 867 | 147 | 27.1 |
Table 3.
Emission factors for equipment.
| Equipment | Emission Factor kg/h | ||
|---|---|---|---|
| CO | NOx | PM10 | |
| Drilling machine | 0.16 | 0.05 | 0.01 |
| Excavator | 0.30 | 0.13 | 0.01 |
| Rubber Tired Loaders | 0.28 | 0.17 | 0.01 |
| Cement mixer | 0.34 | 0.21 | 0.01 |
| Grader | 0.33 | 0.20 | 0.01 |
| Roller compactor | 0.28 | 0.20 | 0.01 |
| Concrete plant | 0.03 | 0.06 | 0.01 |
| Crushing plant | 0.43 | 0.25 | 0.01 |
| Crane | 0.17 | 0.26 | 0.01 |
| Conveyor belt | 0.17 | 0.23 | 0.01 |
| Emission factor g/km·vehicle | |||
| Trucks | 1.15 | 4.72 | 0.17 |
Table 4.
PM10 emission factors.
| Activity | Model | Reference |
|---|---|---|
| Transits onunpaved road | E = specific emission factor [kg/h] k = 1.5, multiplier factor s = content of silt (%) W = average vehicle weight (tons), a and b = coefficients | [33] |
| Topsoil excavation | E = 3.42 [kg/km] | [33] |
| Storage | Heap formation E = PM10 emission factor (kg /tons removed material) U = Average wind speed M = soil moisture content in % k = multiplicative factor Loading E = 6.8 [kg/tons] Discharge E = 0.45 [kg/tons] | [33] |
| Aggregate crushing | Truck downloading E = 0.000008 [kg/tons] Secondary crushing E = 0.000370 [kg/tons] Tertiary crushing E = 0.000270 [kg/tons] Screening E = 0.000370 [kg/tons] | [35] |
Table 5.
Corrective factors [36].
Table 5.
Corrective factors [36].
| Year | CO | NOx | PM10 | ||
|---|---|---|---|---|---|
| Gasoline | Diesel | Gasoline | Diesel | Diesel | |
| 2010 | 1 | 1 | 1 | 1 | 1 |
| 2015 | 0.75 | 0.74 | 0.65 | 0.76 | 0.55 |
| 2030 | 0.40 | 0.57 | 0.22 | 0.35 | 0.13 |
| 2015–2030 | 0.53 | 0.77 | 0.34 | 0.46 | 0.24 |
Table 6.
Emissive factor COPERT (highway)—year 2030 [36].
Table 6.
Emissive factor COPERT (highway)—year 2030 [36].
| Year | CO 2030 g/km h | NOx 2030 g/km h | PM10 2030 g/km h |
|---|---|---|---|
| Passenger cars | 0.576 | 0.050 | 0.005 |
| Heavy Duty Trucks | 0.894 | 0.260 | 0.038 |
Table 7.
Day and night pollutant emissions from traffic in the motorway section.
| Length (km) | CO (g/h) | NOx (g/h) | PM10 (g/h) | ||||
|---|---|---|---|---|---|---|---|
| Day | Night | Day | Night | Day | Night | ||
| Cutting 1 | 0.84 | 1006 | 170 | 375 | 64 | 20 | 3 |
| Viaduct 1 | 0.26 | 314 | 53 | 117 | 20 | 6 | 1 |
| Cutting 2 | 0.95 | 1141 | 193 | 426 | 72 | 23 | 4 |
| Tunnel 1 | 0.10 | 120 | 20 | 45 | 8 | 2 | 0 |
| Cutting 3 | 0.09 | 105 | 18 | 39 | 7 | 2 | 0 |
| Tunnel 2 | 1.31 | 1568 | 265 | 585 | 99 | 32 | 5 |
| Cutting 4 | 1.11 | 1338 | 226 | 499 | 84 | 27 | 5 |
| Tunnel 3 | 6.53 | 7494 | 1271 | 2846 | 482 | 154 | 26 |
| Viaduct 2 | 0.20 | 231 | 39 | 88 | 15 | 5 | 1 |
| Tunnel 4 | 1.70 | 1948 | 330 | 740 | 125 | 40 | 7 |
| Embankment 1 | 0.09 | 102 | 17 | 39 | 7 | 2 | 0 |
| Viaduct 3 | 0.42 | 484 | 82 | 184 | 31 | 10 | 2 |
| Embankment 2 | 0.08 | 93 | 16 | 35 | 6 | 2 | 0 |
| Tunnel 5 | 3.47 | 3984 | 675 | 1513 | 256 | 82 | 14 |
| Embankment 3 | 0.15 | 170 | 29 | 65 | 11 | 4 | 1 |
| Viaduct 4 | 0.50 | 575 | 98 | 219 | 37 | 12 | 2 |
| Embankment 4 | 0.20 | 233 | 40 | 89 | 15 | 5 | 1 |
Table 8.
Emissive characteristics area sources.
| Section | Area [m2] | Elevation [m] | CO Flow [g/s/m2] | |
|---|---|---|---|---|
| Day (6–22) | Night (22–6) | |||
| Viaduct 2 | 6062 | 352 | 1.06 × 10⁻⁵ | 1.80 × 10⁻⁵ |
| Embankment 1 | 2663 | 331 | 1.06 × 10⁻⁵ | 1.80 × 10⁻⁵ |
| Viaduct 2 | 12,659 | 332 | 1.06 × 10⁻⁵ | 1.80 × 10⁻⁵ |
| Embankment 2 | 2441 | 335 | 1.06 × 10⁻⁵ | 1.80 × 10⁻⁵ |
Table 9.
Emissive characteristics point sources.
| Section | Height [m2] | Elevation [m] | CO Flow [g/s] | |
|---|---|---|---|---|
| Day (6–22) | Night (22–6) | |||
| Tunnel 3 | 4 | 352 | 1.04 | 1.76 × 10⁻¹ |
| Tunnel 4 (portal south) | 3 | 351 | 2.71 × 10⁻¹ | 4.59 × 10⁻² |
| Tunnel 4 (portal north) | 3 | 331 | 2.71 × 10⁻¹ | 4.59 × 10⁻² |
| Tunnel 5 | 4 | 335 | 5.53 × 10⁻¹ | 9.38 × 10⁻² |
Publisher’s Note: MDPI stays neutral with regard to jurisdictional claims in published maps and institutional affiliations. |
© 2020 by the author. Licensee MDPI, Basel, Switzerland. This article is an open access article distributed under the terms and conditions of the Creative Commons Attribution (CC BY) license (http://creativecommons.org/licenses/by/4.0/).
Share and Cite
MDPI and ACS Style
Giunta, M. Assessment of the Impact of CO, NOx and PM10 on Air Quality during Road Construction and Operation Phases. Sustainability 2020, 12, 10549. https://doi.org/10.3390/su122410549
AMA Style
Giunta M. Assessment of the Impact of CO, NOx and PM10 on Air Quality during Road Construction and Operation Phases. Sustainability. 2020; 12(24):10549. https://doi.org/10.3390/su122410549
Chicago/Turabian StyleGiunta, Marinella. 2020. "Assessment of the Impact of CO, NOx and PM10 on Air Quality during Road Construction and Operation Phases" Sustainability 12, no. 24: 10549. https://doi.org/10.3390/su122410549
Note that from the first issue of 2016, this journal uses article numbers instead of page numbers. See further details here.