Decreasing Water Footprint of Electricity and Heat by Extensive Green Roofs: Case of Southern Italy


1
Department of Mechanical, Energy and Management Engineering, University of Calabria, 87036 Rende, Italy
2
Department of Civil Engineering, University of Calabria, 87036 Rende (CS), Italy
3
Department of Environmental Engineering, University of Calabria, 87036 Rende (CS), Italy
*
Author to whom correspondence should be addressed.
Sustainability 2020, 12(23), 10178; https://doi.org/10.3390/su122310178
Submission received: 9 November 2020
/
Revised: 3 December 2020
/
Accepted: 4 December 2020
/
Published: 6 December 2020
(This article belongs to the Special Issue New Evidences of Indoor Thermal Comfort in Residential and Tertiary Buildings: Design and Evaluation Methods)
Abstract
:Electrical and energy production have a noticeable water footprint, and buildings′ share of global energy consumption is about 40%. This study presents a comprehensive experimental analysis of different thermal impacts and water consumption of green roofs in a Mediterranean climate. The study aims to investigate the use of water directly for green roofs and reduce the water footprint of energy in summer and winter due to its thermal impacts. The measurements were carried out for an extensive green roof with an area of 55 m2 and a thickness of 22 cm, and direct water consumption by a green roof and direct and indirect water consumption by cooling and heating systems were analyzed. According to the analysis, in summer, the maximum roof temperature on a conventional roof was 72 °C, while under the green roof it was 30.3 °C. In winter, the minimum roof temperature on a conventional roof was −8.6 °C, while under the green roof it was 7.4 °C. These results show that green roofs affect energy consumption in summer and winter, and the corresponding thermal requirements for the building have a water footprint regarding energy production. In summer, the thermal reduction in the water footprint by a green roof was 48 m3 if an evaporative air conditioner is used and 8.9 m3 for a compression air conditioner, whereas the water consumed in the green roof was 8.2 m3. Therefore, using water directly in the green roof would reduce the energy consumption in buildings, and thus less water has to be used in power plants to provide the same thermal impact. In winter, green roofs′ water consumption was higher than the thermal water footprint; however, there is no need to irrigate the green roof as the water consumed comes from precipitation. This experimental analysis determines that in the Mediterranean climate, green roofs allow the achievement of the same thermal conditions for buildings in both summer and winter, with a reduction in water consumption.
1. Introduction
The negative impacts of energy production, especially those by fossil fuels on the environment and climate change, are remarkable and have been mentioned by many researchers [1,2]. The 2015 electricity production data show that the worldwide share of renewable energy was about 23.1% (mostly hydroelectric), that for fossil fuels was 66.3% (mainly by coal 39.3%, natural gas 22.9%, and oil 4.1%) and that for nuclear power was 10.6% [3]. At the global level, the total water withdrawal can be divided into agricultural activities (69%), municipal (12%), and industrial (19%); however, this varies considerably between regions as in Europe 21% belongs to agriculture, 57% to industries and 22% to municipal [4].
One of the largest parts of water consumption in industry is for power plants. The amount of water supply to produce one kilowatt-hour by a coal power plant is about 1.9 × 10⁻³ m3. In hydropower systems, a calculation for Arizona in an arid and semi-arid climate showed that the necessary water supply for producing each kilowatt-hour was about 0.246 m3, excluding evaporation from the reservoir′s surface [5]. In 2010, the total water used for energy production was 583 × 109 m3, which represented 15% of the world’s total water withdrawals, and that year, the total water consumption was about 66 × 109 m3. According to the predictions, the water withdrawals for energy production will increase to 20% and water consumption by 85% in 2035 [6,7]. The freshwater consumption for electricity and heat production for over 150 countries in 2014 was estimated at approximately 52 billion cubic meters annually [8].
Sand oil production, unconventional gas development, and maintaining oil reservoir pressures also require water consumption, as well as new energy sources such as solar, wind, and biofuels [6,9,10]. In this context, the water footprint concept, i.e., the volume of water needed for the goods and service production, is also a crucial indicator [11]. Water availability is crucial for electricity and heat production, and there exists an important relationship between water and energy: water is necessary for energy production, and energy is needed for water supply [12]. The water and energy interconnection can be considered as a multifaceted topic [13]. Natural water is becoming precious and, since it is necessary not only for human and health concerns but also for production and industrial processes, mitigation strategies and conscious use are becoming key issues all over the world [14].
Geddes, L. (2020) and Frosini and Nova (2015) explained the historical roots of attentions to water and nature in Leonardo da Vinci, a form of visual thinking to understanding better nature and using nature-based solutions [15,16]. Jimenez et al. (2019) analyzed the electricity generating systems and water–electricity nexus in Ecuador and developed a dynamic method to consider the temporal fluctuations and water availability. They showed that the water footprint might change according to the fluctuation in availability, especially in dry periods [17]. Pfister et al. (2020) analyzed water scarcity and the environmental impact of hydropower plants. Their results show the advantages of many hydropower reservoirs that store water in the wet season, release it during the dry season, and underscored the important role of the meteorological condition [18]. Wu et al. (2019) investigated the water footprint of thermal power in China. Their results demonstrated that the amount of water consumption in the power plants depends on the type and capacity. Due to many coal-fired power plants in China, the corresponding share is about 8.4% of the direct freshwater withdrawal [19]. Koura et al. (2020) investigated the Life Cycle Assessment (LCA) for traditional and extensive vegetative roofs. Their results show that an extensive vegetative roof has a better water scarcity (based on m3 world eq representing a cubic meter consumed on average in the world) than a traditional one, 8.85 × 101 m3 world eq compared to 8.65 × 101 m3 [20].
Other similar studies in this field include the water footprint in the energy sector [21,22,23], electricity footprint in industry [24,25], the Life Cycle Assessment of the traditional and green roof [26,27,28], thermal simulation of the roof [29,30,31], and the impact of electricity production on regional water resources [32,33].
1.1. Water–Energy Nexus
This section highlighted the main variables in the analysis of water footprint in electricity, heat demands, air conditioners, and green roofs.
1.1.1. Water Footprint of Electricity and Heat
The total water footprint in electricity production can be divided as the following [34]:
- The water footprint of the fuel supply per unit of electricity;
- The water footprint in the construction phase of the power plant based on the life cycle of the power plant;
- The average water footprint in the operational phase.
The water footprint in electricity production by different types of power plants is presented in Table 1. The highest amount of water consumed in the fuel supply corresponds to coal power plants, and during the construction phase of the plants to photovoltaic. In the operation phase, hydropower uses the highest water amount, in part consuming water by evaporation from stream or reservoirs and the rest because of water withdrawal. Another critical factor is the type of cooling system in the power plants. The studies show that, from total global electricity production, 30% is by once-through cooling, 45% by re-circulating cooling, and only 2% by dry-cooling [35]. The water demands for the generation of electricity in different types of power plants with diverse cooling systems are indicated in Table 2.
1.1.2. The Footprint of Air Conditioners on Energy and Water Resources
Many researchers have analyzed the high electricity consumption in compression air conditioners [37,38], and some of them suggested that evaporative air conditioners are a green alternative [39]. While evaporative air conditioners are widely using in dry climates such as those of the Middle East (mostly with a dry climate and some with Mediterranean climate) and Australia, they require a considerable amount of water [40]. The result of a study in dry climates, Australia, shows that the water consumption by an evaporative air conditioner is about 60 liters/hour which is between 2 and 10% of the total annual water usage in a typical Australian household [41]. Another study for an evaporative air conditioner in Adelaide, Australia, determined an average direct water consumption of about 0.83 m3/day [42]. These values are remarkable for a country such as Australia with a dry climate and around 45% of households using rainwater tanks [43,44].
An analysis of the evaporative air conditioner in California, USA, in dry climate shows that this type of cooling method contributes by about 10% to the annual water usage of a household [45]. The analysis in another country with a dry climate, Mexico, shows similar results. The direct water consumption for an evaporative air conditioner with a capacity of 6800 m3/hour, suitable for a 60 m2 house, was about 0.8 m3/day [46]. The power and water consumptions in different air conditioners are presented in Table 3.
Some factors must be considered to calculate the water and power consumption by air conditioners, as follow [40]:
- The daily usage of the air conditioner;
- The direct water consumption by evaporative air conditioners;
- The power consumption by the compression air conditioner and evaporative cooler;
- The indirect water consumption (water withdrawal and evaporation) in the power plants for generating the electricity;
- The type of power plant and type of cooling system.
1.2. Green Roofs and Saving Energy in the Buildings
The share of buildings in total global energy consumption is about 40% [47]. Green roofs are a natural cooling method with a high potential to make energy consumption and roof temperature decrease [48]. However, in a dry climate, the water demands of the green roofs in the summer cannot come totally from precipitation and, in some cases, irrigation might be required [49]. The amount of irrigation depends on the goal for using green roofs since the green roofs can be used for several purposes, such as urban runoff, flood management, and energy management [50,51,52,53,54,55,56]. Therefore, optimization is necessary to determine the best amount of water for cooling/heating and urban water management purposes [57,58,59,60].
The type of green roof can be extensive or intensive [61,62]. In extensive green roofs, the soil layer is less than 20 cm with minimal maintenance, whereas, in intensive green roofs, the soil layer is more than 20 cm, so that plants with longer root lengths can be used [51].
The analysis showed that a dynamic thermal model could be used to determine the heat transfer in houses with a green roof, and the reduction in the thermal load by a green roof can be used for economic analysis [63]. An analysis of energy reduction by green roofs in three localities in Southern Italy (Calabria region) with Mediterranean climate shows that the maximum energy loads were reduced in summer and winter, 69% and 43%, respectively [64]. Another study in the Mediterranean climate shows that the green roof can decrease the annual need for energy by 30 to 70%, depending on the type of green roof and the layers [65].
From this overview, emerges the key role played by the interdependency of energy and water and the innovative and sustainable approaches to decrease the footprint of electricity and heat can be analyzed. A promising strategy in this direction is to look to the green roof as a tool to save energy in the buildings. However, although several studies analyzed the thermal benefits of green roofs, their efficiency in decreasing water footprint has not been widely investigated. This paper′s novelty is that we compared the water used to produce electricity in Italy and direct water consumption by green roofs that could decrease the need for energy and electricity. Therefore, to overcome the scientific gap, our paper presents a comprehensive experimental analysis of different thermal impacts and green roofs′ water consumption in a Mediterranean climate. The study will analyze the measurements carried out in an extensive green roof located at the University of Calabria (in Southern Italy) regarding direct water consumption by green roofs and direct and indirect water consumption by cooling and heating systems. The study′s main aim is to analyze the feasibility of the direct use of water on the green roof to reduce water footprint in energy production due to the green roof′s thermal impacts in summer and winter. The other aim of the study is investigating the contributions of the type of air conditioner system to indirect water consumption (in the power plants) and the feasibility of applying green roofs to reducing the use of water, achieving the same thermal conditions for the buildings. Therefore, according to the aims, we will analyze first the water footprint of electricity (in the selected case study which is Southern Italy with a Mediterranean climate), and the water consumption by green roofs. We will then calculate the water footprint for cooling and heating systems with and without a green roof to compare the results with the direct water consumption by green roof. The results show the answer to the study aims.
2. Materials and Methods
2.1. The Water Footprint of Electricity in Italy
Table 4. presents the electric production by sources in Italy for 2016. From 2007 to 2016, the share of renewable energy in Italy increased from about 15% to about 35% [34]. The highest share in 2016 (49.6%) corresponds to natural gas. Among the total renewable electricity sources, the main share belongs to hydropower. Together, these two sources have the highest share (66.3% in 2016) of total electricity production in Italy.
The water footprint of electricity by the source in Italy determines that the main percentage belongs to the renewable ones because of the massive amount of water usage in hydropower generation. However, the hydropower plants′ water consumption depends on the local climate and surface size of the reservoirs [12,34].
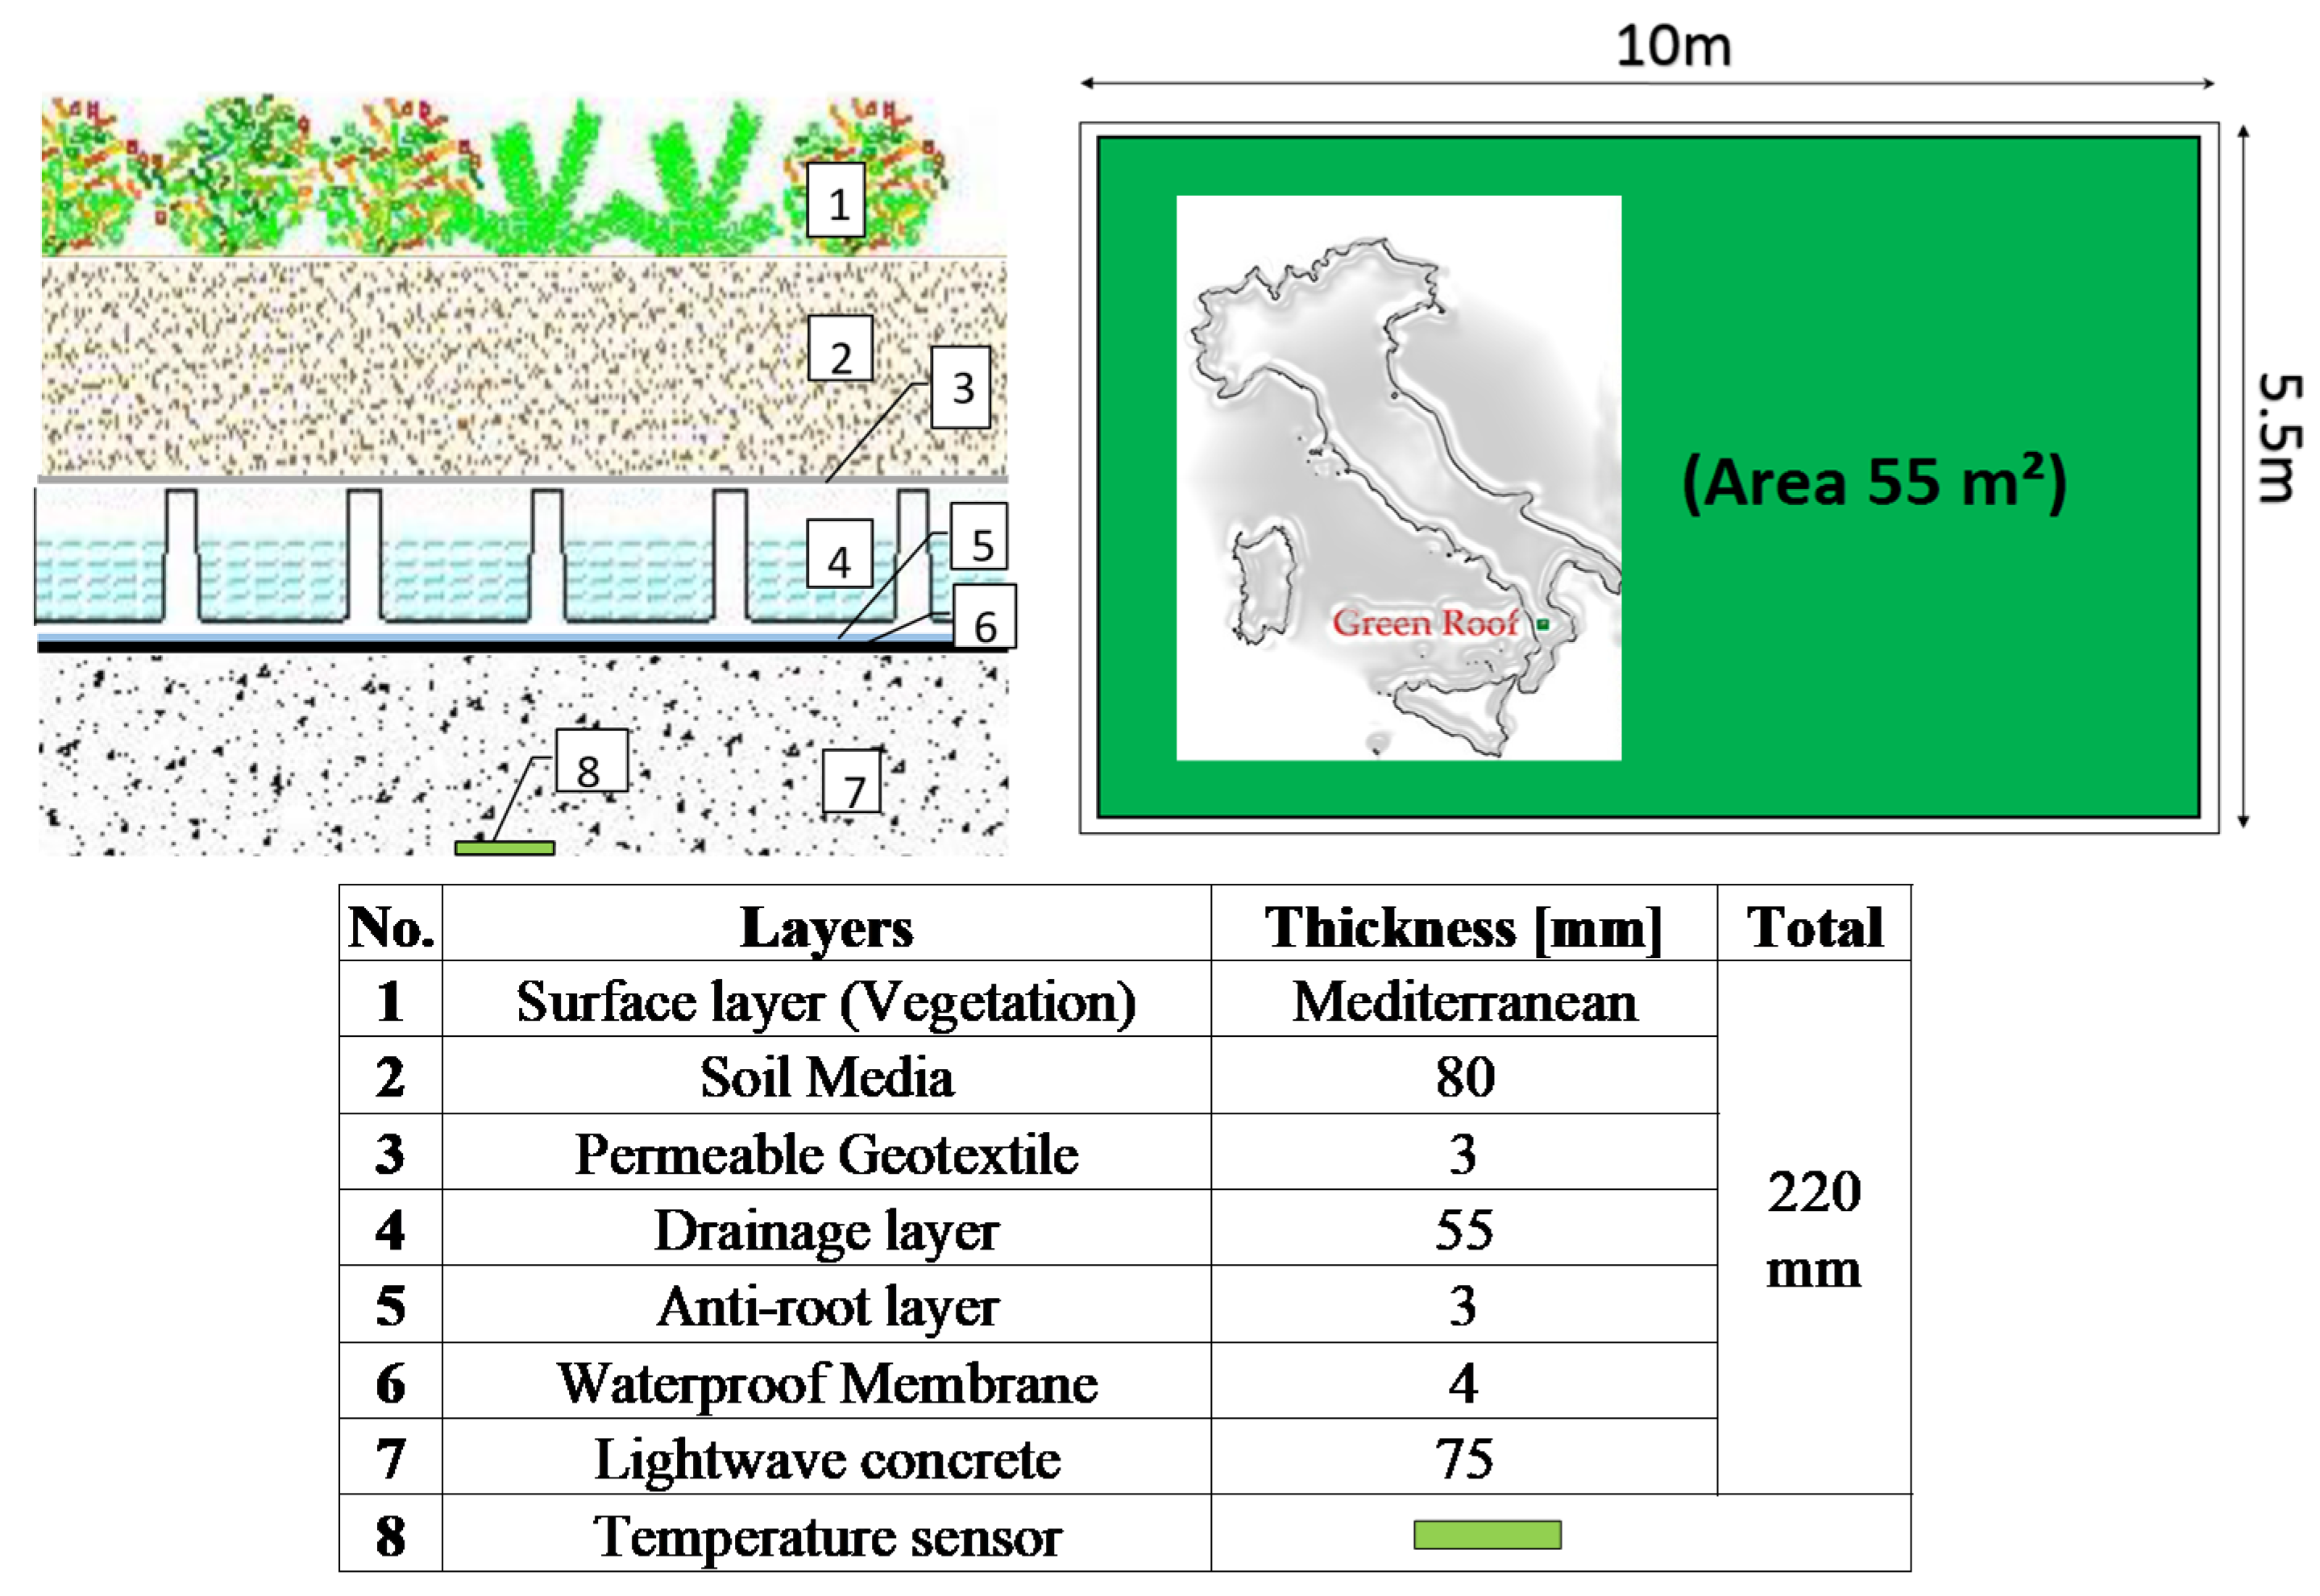
2.2. The Experimental Site
The analysis is based on the experimental data collected in 2016 on an extensive green roof located at the University of Calabria (Southern Italy, Mediterranean climate). The selected experimental green roof area is equal to 55 m2, and the type of green roof is extensive, covered with native Mediterranean plant species. The different layers and thickness are described in Figure 1. The total thickness is 220 mm.
Several papers discussed various aspects of our experimental set up of the green roof. More in detail, Palermo et al. (2019), described the hydrological monitoring and experimental elements of the green roof [51]. A deepening on the flow measurement device can be found in Piro et al. (2019) [54]. Garofalo et al. (2016) examined through a statistical regression analysis the most influencing hydrological parameters [66], and Maiolo et al. (2020) analyzed the temperature fluctuations in different layers of the green roof [56].
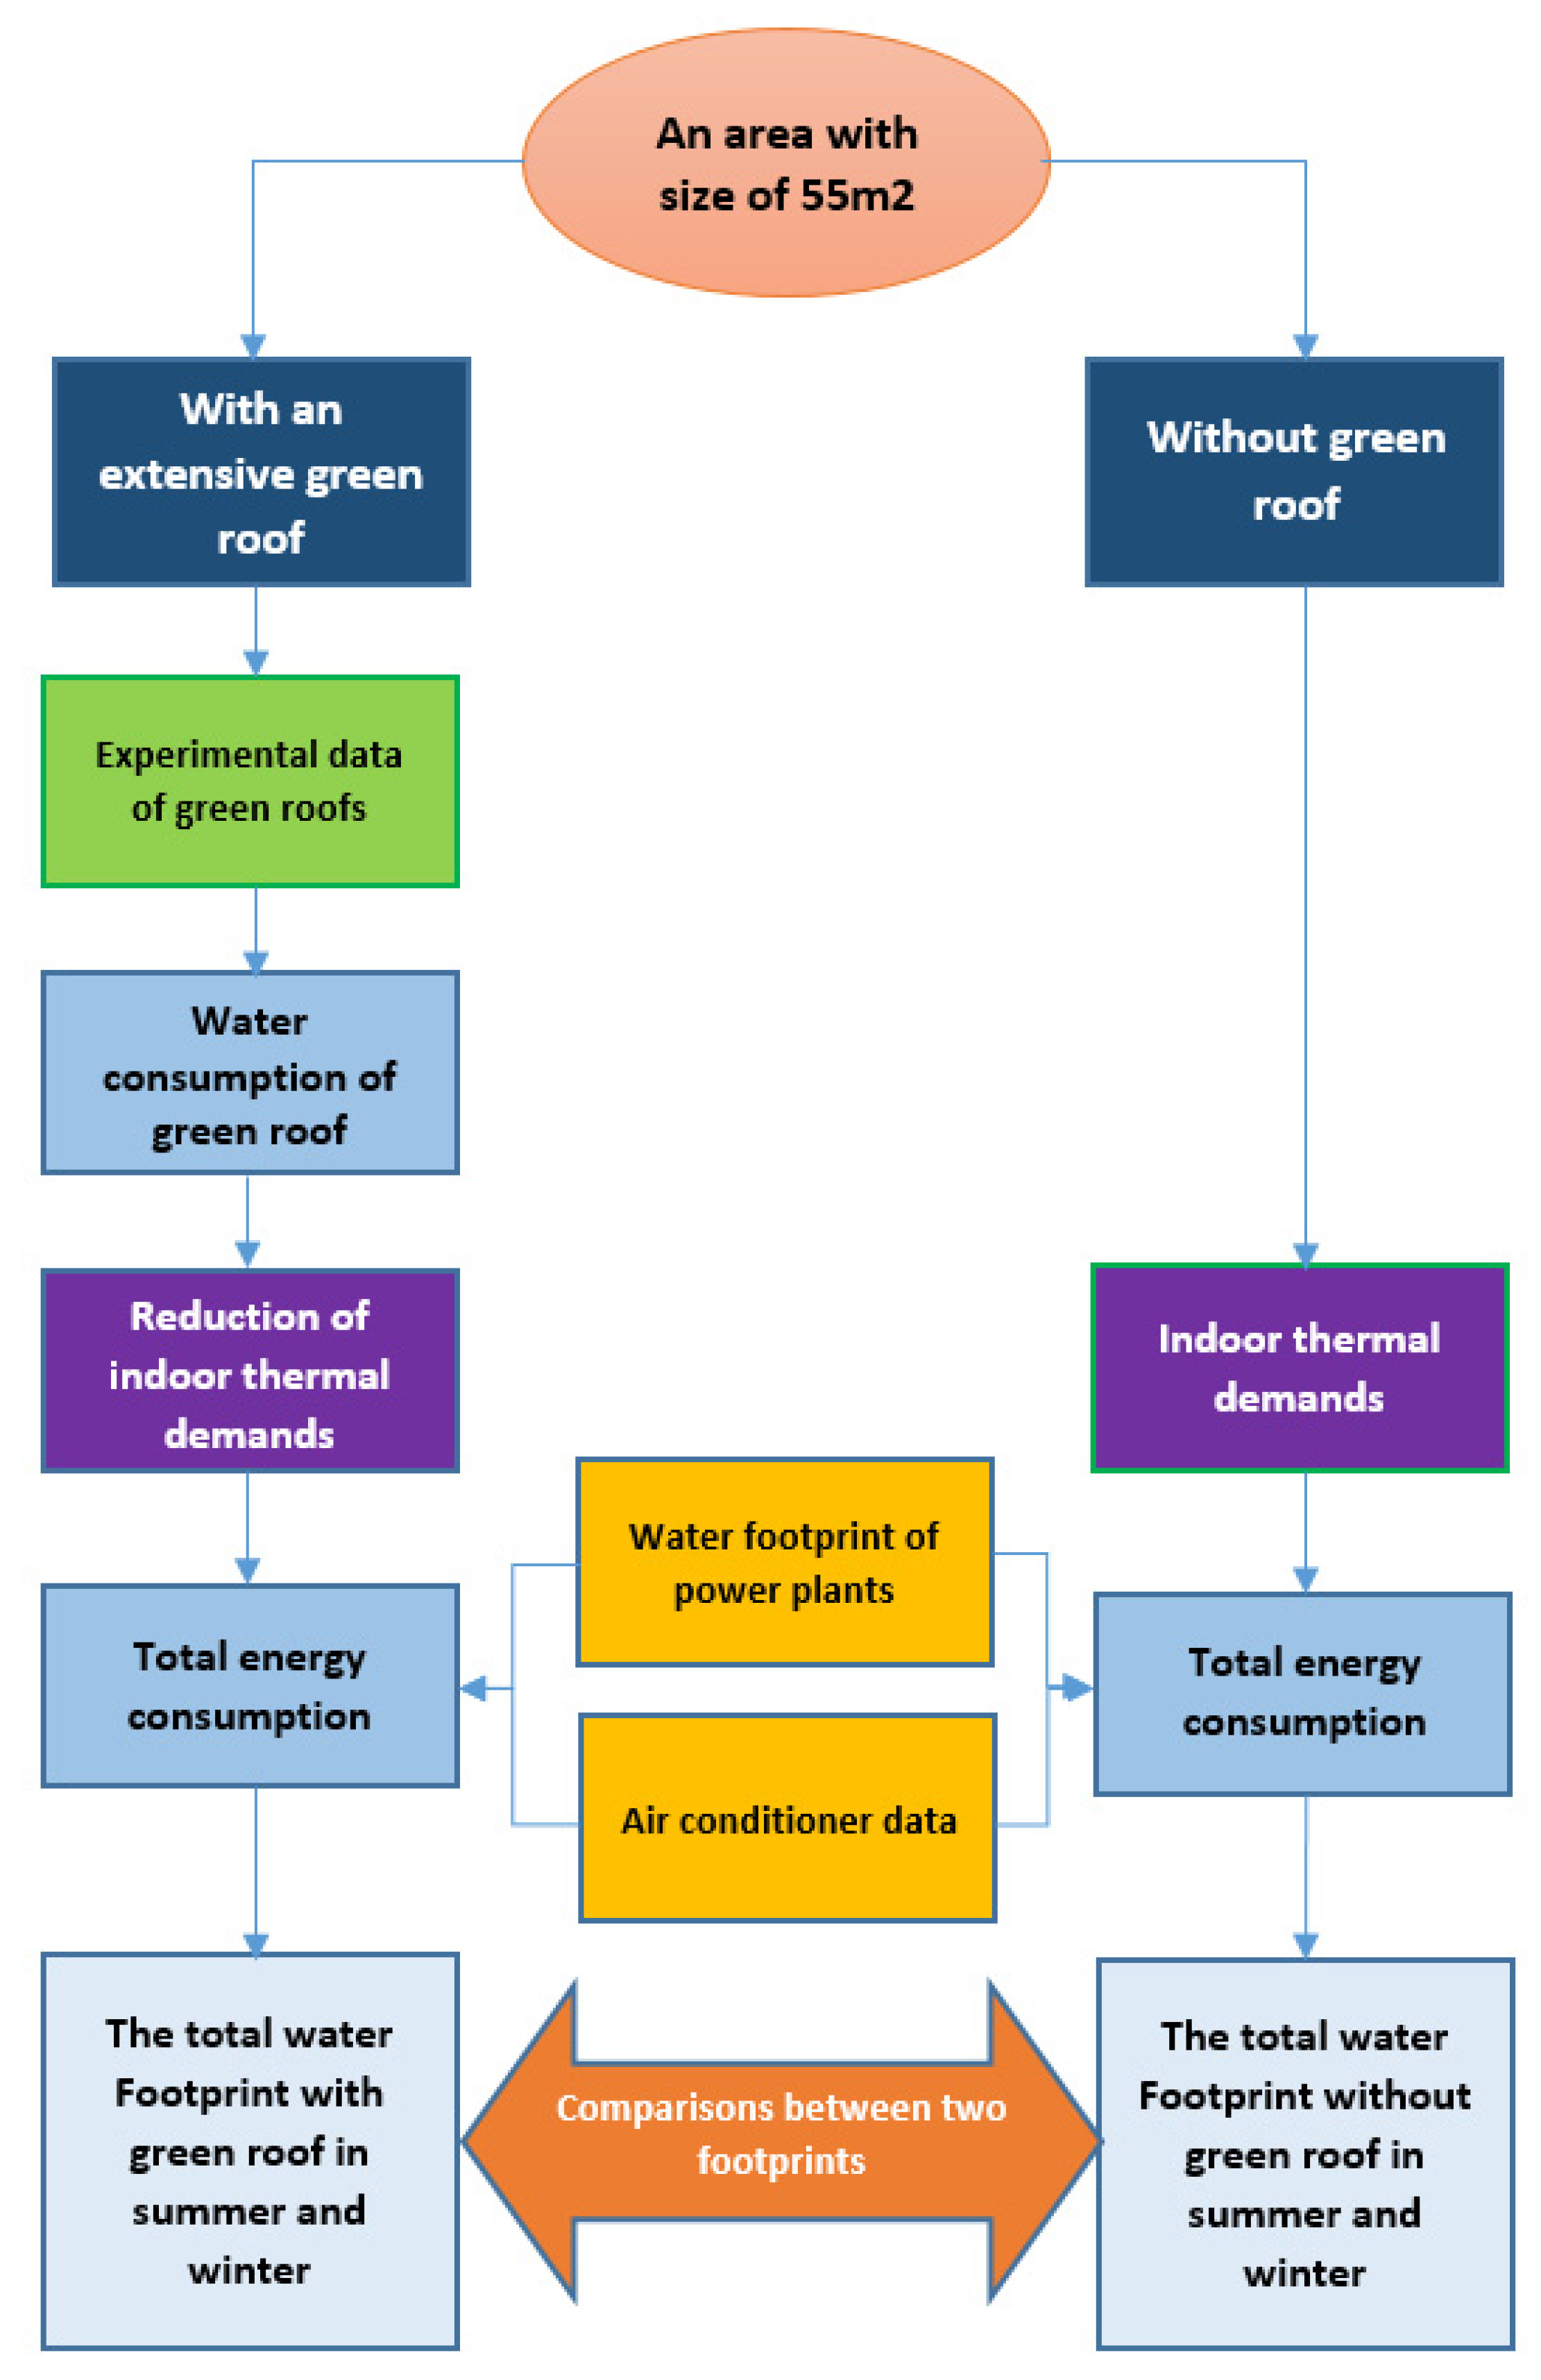
2.3. The Analysis Method
The analysis flowchart is presented in Figure 2. The evaporation from the soil media and evapotranspiration from the green roof will decrease the roof and indoor temperature, and in this cooling mechanism, water will be used. The amount of water usage in the green roof for thermal reduction in the bellowed area has been compared with the corresponded water footprint for electricity reduction in the same area. In fact, we used actual water consumption by plants through measurements, which also depends on the weather conditions and changes daily, and the actual water consumption for thermal purposes and electric consumption. In this regard, the result would be more accurate than other analyses by calculations of each element′s water footprints during the life cycle but missing the role of climate factors.
The analysis method for calculations is as follows:
- The differences among the roof temperature with or without the green roof analyzed to demonstrate the impact of the green roof in summer and winter;
- The calculations of water and power consumption for air conditioners are based on the data presented in Table 3;
- The calculations for different power plants are based on Italy’s electric production data by the source presented in Table 4. We used the 2016 data because that same year was considered for the green roof data analysis;
- The amount of thermal energy reduction by the green roof is based on the results of modeling by TRNSYS (energy simulation software) for the same green roof by Mazzeo et al. (2015) [64] and Bevilacqua et al. (2020) [53]. In this regard, the considered reductions in the energy value in summer and winter are 64% and 37%, respectively;
- Water consumption by the green roof in a continuous period, i.e., during 2016, is given by the difference between the inflow (precipitation plus irrigation) and runoff. Therefore, it was calculated on the basis of water balance on the experimental green roof and not the evapotranspiration values (water consumption of the green roof = precipitation + irrigation − runoff);
- The conventional roof is a standard roof located beside the same size extensive green roof;
- The daily hours that the thermal system is turned on is 14 h (from 5 a.m. to 7 p.m.);
- The number of inhabitants and heat islands is not the topic of this paper and is not considered.
3. Results and Discussion
3.1. The Impact of the Green Roof on Roof Surface Temperature
The average, maximum, and minimum daily roof temperature differences with and without the green roof in summer and winter are presented in Figure 3. The analysis shows the differences between the surface temperatures (for a conventional roof) and the bottom of the green roof. Summer and winter analysis comparing conventional and green roofs determined that the roof surface temperature moderation is notable. In summer, the maximum roof temperature on the conventional roof was 72 °C, while under the green roof it was 30.3 °C. In winter, the minimum roof temperature on the conventional roof was −8.6 °C, while under the green roof it was 7.4 °C. The maximum difference was about 38 °C in summer and 16.5 °C in winter. Moreover, the conventional roof temperature fluctuations were very high, whereas the maximum and minimum values were close to each other in the green roof.
3.2. The Footprint of Water for Cooling and Heating Systems with and without a Green Roof
We calculated and present in Table 5 water and power consumption for thermal systems for an area of 55 m2 (the size of green roof) with and without the green roof together with the correlated water footprints for the different types of power plants.
In Table 5, the indirect water consumed in power plants and total water consumed are calculated according to the data presented in Table 1, and water withdrawal is based on two cooling systems of the powerplants based on the data presented in Table 2.
The differences between the consumptions with and without the green roof allow the calculation of the water footprint for reduced energy in Summer and Winter. The results are presented in Table 6.
3.3. Water Consumption of Green Roof
Water consumption and water balance of the experimental green roof are shown in Figure 4. The irrigation period in the green roof was from June to October (June 2016 to October 2016). The water consumption amount also changed monthly. The total consumption can be calculated by multiplying the values of Figure 4 by the surface area of the experimental green roof (55 m2).
3.4. Comparison between Water Consumption by Different Systems
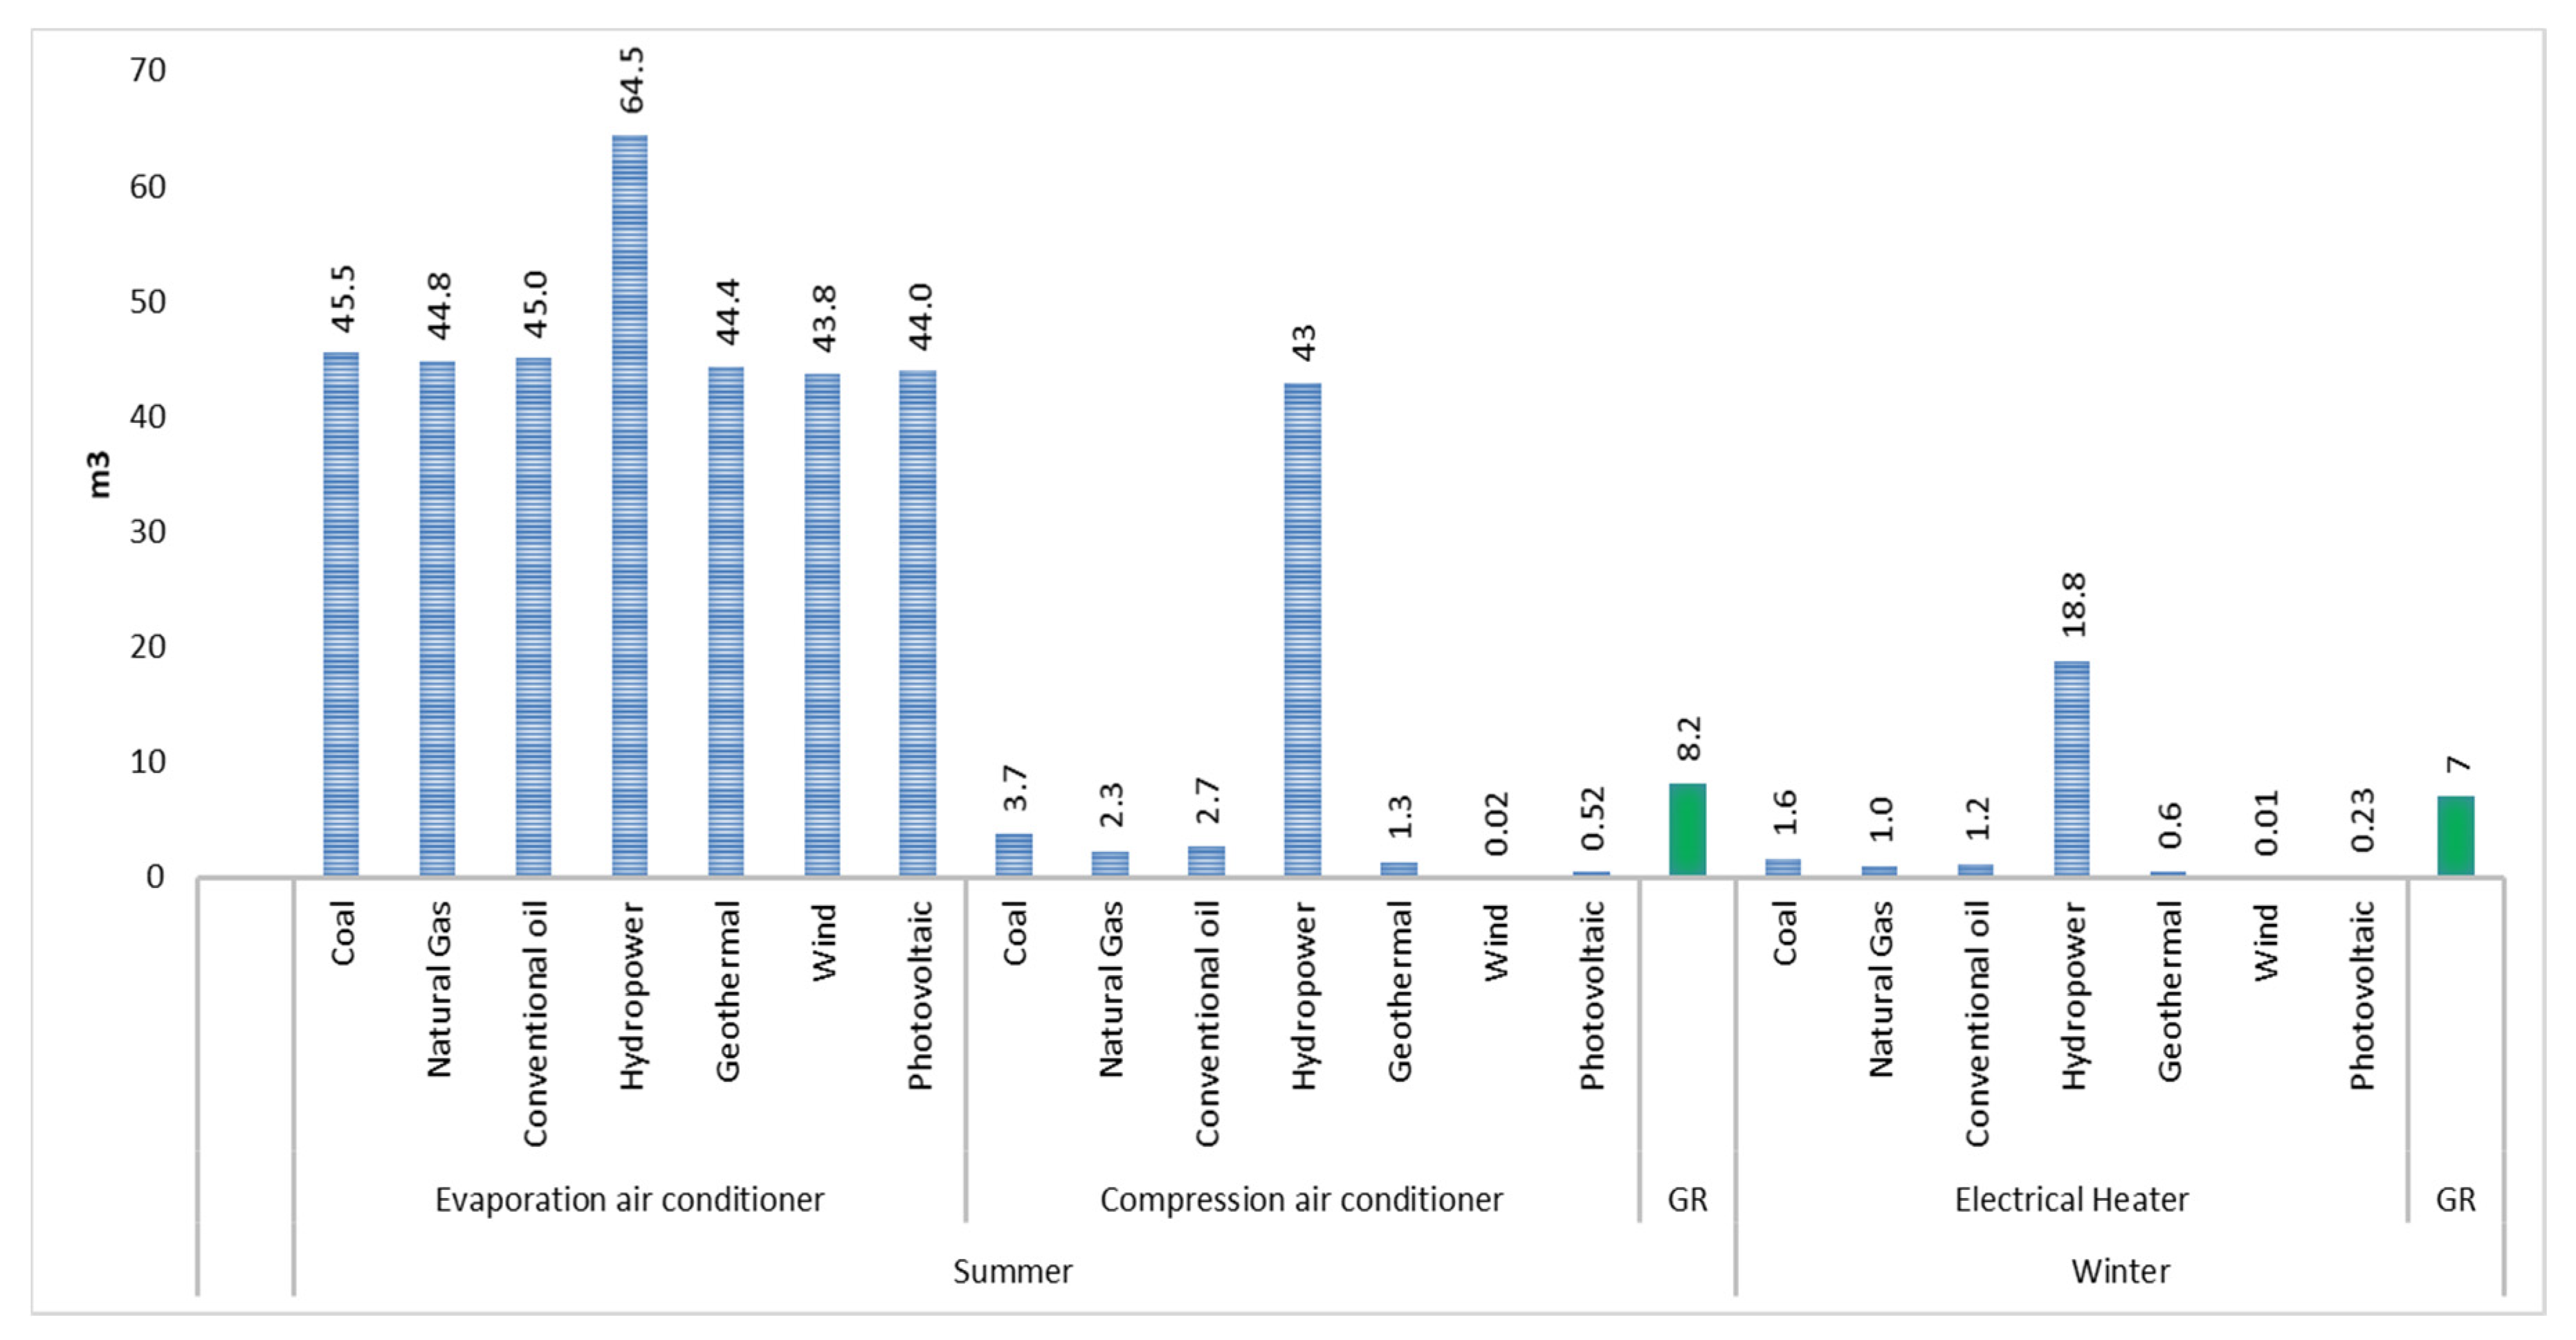
The water consumption by the green roof for summer and winter was compared with the water footprint for reducing thermal values after using the green roof, and the results are presented in Figure 5. The total water consumption by the green roof was 8.2 m3 in summer and 7 m3 in winter. In Figure 5, we considered each type of powerplant role separately, and in Figure 6, the share of each type in the total power production. The minimum water consumption corresponds to the wind powerplant and the next one to the photovoltaic powerplant. The analysis demonstrated that the evaporative air conditioner′s water usage in summer is higher than the green roof. This is because the share of the direct water usage in the evaporative air conditioner is much higher than the water footprint for the electric consumption in the powerplants. In the case of using the compression air conditioner, the green roof′s water consumption was more than for all types of powerplants except the hydropower. This might be because the evaporation from the dam’s reservoirs is larger than the evapotranspiration by plants. In winter, the green roof′s water consumption was higher than the water footprint of the electric heater for all types of powerplants except the hydropower.
Figure 6 shows the thermal water footprint according to the share of each powerplant in total electrical production in Italy.
The result shows that in summer, the thermal reduction′s water footprint due to the use of the green roof in the case of the evaporative air conditioner was 48 m3, and for the compression air conditioner was 8.9 m3, whereas in the green roof, the value of water consumed was 8.2 m3. This indicates that by using water directly for green roofs in summer, less water has to be used in the power plants because the water footprint for the thermal reduction is larger. In winter, the water consumption by green roofs was higher than the water footprint in the powerplants; however, we recall that the green roof requires irrigation only in summer and for the winter uses precipitation.
4. Conclusions
This study proposes a comprehensive experimental analysis of the different thermal impacts and water consumption of green roofs in a Mediterranean climate. The measurements were carried out on an extensive green roof with a total thickness of 22 cm. Direct water consumption by green roofs, and direct and indirect water consumption by cooling and heating systems were analyzed. The results of the study showed that when using the green roofs in the buildings and to analyze the water and energy correlation, many factors must be considered, such as type of power plants in the region, type of the cooling systems in the power plants, the type of the cooling and heating systems in the building and finally the water consumption by the green roof. The analysis demonstrated that comparing the water consumption by green roofs and the water footprint of thermal systems in the buildings can provide the basis for choosing the optimum system.
The study demonstrated a novel method in the analysis of thermal water footprint by considering the real water consumption by plants through measurements, which also depends on the weather conditions and changes daily, and the water consumption for producing electricity in the power plants. In this regard, the result would be more accurate than calculations of each element′s water footprint as the role of climate factors cannot be considered.
The roof temperature analysis results show that the green roof temperature fluctuations decrease and moderates the roof surface temperature, with a remarkable impact in the summer. Moreover, the green roof makes the thermal requirement decrease. This thermal reduction′s water footprint was less than the required water for irrigation of the green roof in summer. In winter, the water consumption by green roofs was higher than the water footprint in the power plants, but the green roof needs only irrigation in summer because, in winter, it uses precipitation.
In conclusion, the experimental analysis shows the impact of green roofs in decreasing the heat and electricity consumption in summer and winter and reducing the water footprint for electricity production in summer. Therefore, it seems that instead of using water for the production of electricity, less water might be used directly in the green roof, whilst still providing the same thermal behavior for the buildings.
Author Contributions
Conceptualization, B.P., and P.P.; methodology, B.P., and S.A.P.; formal analysis, B.P., and S.A.P.; investigation, B.P., and S.A.P.; data curation, S.A.P.; writing—original draft preparation, B.P., and S.A.P.; writing—review and editing, B.P.; supervision: P.P., M.M., and N.A. All authors have read and agreed to the published version of the manuscript.
Funding
This research received no external funding.
Acknowledgments
The study was co-funded by the Italian Operational Project (PON)—Research and Competitiveness for the convergence regions 2007/2013—I Axis “Support to structural changes” operative objective 4.1.1.1. “Scientific-technological generators of transformation processes of the productive system and creation of new sectors” Action II: “Interventions to support industrial research.”
Conflicts of Interest
The authors declare no conflict of interest.
References
- Dincer, I. Environmental impacts of energy. Energy Policy 1999, 27, 845–854. [Google Scholar] [CrossRef]
- Vallero, D.A. Environmental Impacts of Energy Production, Distribution and Transport. In Future Energy: Improved, Sustainable and Clean Options for Our Planet; Elsevier Science: Amsterdam, The Netherlands, 2013; ISBN 9780080994246. [Google Scholar]
- IEA. Key World Energy Statistics 2017; International Energy Agency: Paris, France, 2017. [Google Scholar]
- AQUASTAT Website AQUASTAT—FAO’s Information System on Water and Agriculture; Food Agriculture Organization of United Nations: Rome, Italy, 2016.
- Torcellini, P.A.; Long, N.; Judkoff, R.D. Consumptive water use for U.S. power production. In Proceedings of the 2004 Winter Meeting—Technical and Symposium Papers; American Society of Heating, Refrigerating and Air-Conditioning Engineers: Atlanta, GA, USA, 2004. [Google Scholar]
- IEA Water for Energy: Is Energy Becoming a Thirstier Resource? World Energy Outlook; OECD: Paris, France, 2012.
- World Water Assessment Programme (WWAP). The United Nations World Water Development Report 2015: Water for a Sustainable World, Facts and Figures; UN Water Report; WWAP: Paris, France, 2015. [Google Scholar]
- Spang, E.S.; Moomaw, W.R.; Gallagher, K.S.; Kirshen, P.H.; Marks, D.H. The water consumption of energy production: An international comparison. Environ. Res. Lett. 2014, 9, 105002. [Google Scholar] [CrossRef]
- Xie, X.; Zhang, T.; Wang, M.; Huang, Z. Impact of shale gas development on regional water resources in China from water footprint assessment view. Sci. Total Environ. 2019, 679, 317–327. [Google Scholar] [CrossRef] [PubMed]
- Cooley, H.; Fulton, J.; Gleick, P.H. Water for Energy: Future Water Needs for Electricity in the Intermountain West; Pacific Institute: Oakland, CA, USA, 2011; p. 64. [Google Scholar]
- Hoekstra, A.Y.; Chapagain, A.K. Water footprints of nations: Water use by people as a function of their consumption pattern. Water Resour. Manag. 2007, 21, 35–48. [Google Scholar] [CrossRef]
- Mekonnen, M.M.; Gerbens-Leenes, P.W.; Hoekstra, A.Y. The consumptive water footprint of electricity and heat: A global assessment. Environ. Sci. Water Res. Technol. 2015, 1, 285–297. [Google Scholar] [CrossRef]
- Martin, A.D.; Delgado, A.; Delgado Martin, A. Water Footprint of Electric Power Generation: Modeling Its Use and Analyzing Options for a Water-Scarce Future; International Congress on Advances in Nuclear Power Plants: Chicago, IL, USA, 2012. [Google Scholar]
- Lovarelli, D.; Bacenetti, J.; Fiala, M. Water Footprint of crop productions: A review. Sci. Total Environ. 2016, 548, 236–251. [Google Scholar] [CrossRef]
- Geddes, L. Watermarks: Leonardo da Vinci and the Mastery of Nature; Princeton University Press: Princeton, NJ, USA, 2020; ISBN 9780691192697. [Google Scholar]
- Frosini, F.; Nova, A. Leonardo da Vinci on Nature. Knowledge and Representation; Marcilo: Venice, Italy, 2015; ISBN 978-88-317-2346-6. [Google Scholar]
- Vaca-Jiménez, S.; Gerbens-Leenes, P.W.; Nonhebel, S. Water-electricity nexus in Ecuador: The dynamics of the electricity’s blue water footprint. Sci. Total Environ. 2019, 696, 133959. [Google Scholar] [CrossRef]
- Pfister, S.; Scherer, L.; Buxmann, K. Water scarcity footprint of hydropower based on a seasonal approach—Global assessment with sensitivities of model assumptions tested on specific cases. Sci. Total Environ. 2020, 724, 138188. [Google Scholar] [CrossRef]
- Wu, X.D.; Ji, X.; Li, C.; Xia, X.H.; Chen, G.Q. Water footprint of thermal power in China: Implications from the high amount of industrial water use by plant infrastructure of coal-fired generation system. Energy Policy 2019, 132, 452–461. [Google Scholar] [CrossRef]
- Koura, J.; Manneh, R.; Belarbi, R.; El Khoury, V.; El Bachawati, M. Comparative cradle to grave environmental life cycle assessment of traditional and extensive vegetative roofs: An application for the Lebanese context. Int. J. Life Cycle Assess. 2020, 25, 423–442. [Google Scholar] [CrossRef]
- Liao, X.; Zhao, X.; Jiang, Y.; Liu, Y.; Yi, Y.; Tillotson, M.R. Water footprint of the energy sector in China’s two megalopolises. Ecol. Model. 2019, 391, 9–15. [Google Scholar] [CrossRef]
- Jin, Y.; Behrens, P.; Tukker, A.; Scherer, L. Water use of electricity technologies: A global meta-analysis. Renew. Sustain. Energy Rev. 2019, 115, 109391. [Google Scholar] [CrossRef]
- Chen, Q.; An, T.; Lu, S.; Gao, X.; Wang, Y. The water footprint of coal-fired electricity production and the virtual water flows associated with coal and electricity transportation in China. Energy Procedia 2019, 158, 3519–3527. [Google Scholar] [CrossRef]
- Wang, H.; Zhang, J.; Fang, H. Electricity footprint of China’s industrial sectors and its socioeconomic drivers. Resour. Conserv. Recycl. 2017, 124, 98–106. [Google Scholar] [CrossRef]
- Sun, S.; Anwar, S. Electricity consumption, industrial production, and entrepreneurship in Singapore. Energy Policy 2015, 77, 70–78. [Google Scholar] [CrossRef]
- Saiz, S.; Kennedy, C.; Bass, B.; Pressnail, K. Comparative life cycle assessment of standard and green roofs. Environ. Sci. Technol. 2006, 40, 4312–4316. [Google Scholar] [CrossRef]
- Kosareo, L.; Ries, R. Comparative environmental life cycle assessment of green roofs. Build. Environ. 2007, 42, 2606–2613. [Google Scholar] [CrossRef]
- Rasul, M.G.; Arutla, L.K.R. Environmental impact assessment of green roofs using life cycle assessment. Energy Rep. 2020, 6, 503–508. [Google Scholar] [CrossRef]
- Baglivo, C.; Mazzeo, D.; Panico, S.; Bonuso, S.; Matera, N.; Congedo, P.M.; Oliveti, G. Complete greenhouse dynamic simulation tool to assess the crop thermal well-being and energy needs. Appl. Therm. Eng. 2020, 179, 115698. [Google Scholar] [CrossRef]
- Mazzeo, D.; Kontoleon, K.J. The role of inclination and orientation of different building roof typologies on indoor and outdoor environment thermal comfort in Italy and Greece. Sustain. Cities Soc. 2020, 60, 102111. [Google Scholar] [CrossRef]
- Mazzeo, D.; Matera, N.; De Luca, P.; Baglivo, C.; Maria Congedo, P.; Oliveti, G. Worldwide geographical mapping and optimization of stand-alone and grid-connected hybrid renewable system techno-economic performance across Köppen-Geiger climates. Appl. Energy 2020, 276, 115507. [Google Scholar] [CrossRef]
- Xie, X.; Jiang, X.; Zhang, T.; Huang, Z. Study on impact of electricity production on regional water resource in China by water footprint. Renew. Energy 2020, 152, 165–178. [Google Scholar] [CrossRef]
- Rivotti, P.; Karatayev, M.; Mourão, Z.S.; Shah, N.; Clarke, M.L.; Dennis Konadu, D. Impact of future energy policy on water resources in Kazakhstan. Energy Strateg. Rev. 2019, 24, 261–267. [Google Scholar] [CrossRef]
- Miglietta, P.P.; Morrone, D.; De Leo, F. The water footprint assessment of electricity production: An overview of the economic-water-energy nexus in Italy. Sustainability 2018, 10, 228. [Google Scholar] [CrossRef] [Green Version]
- UCS How It Works: Water for Power Plant Cooling. Available online: Ucsusa.org (accessed on 12 September 2020).
- Macknick, J.; Newmark, R.; Heath, G.; Hallett, K.C. Operational water consumption and withdrawal factors for electricity generating technologies: A review of existing literature. Environ. Res. Lett. 2012, 7, 045802. [Google Scholar] [CrossRef]
- Zhou, X.; Yan, D.; Shi, X. Comparative research on different air conditioning systems for residential buildings. Front. Archit. Res. 2017, 6, 42–52. [Google Scholar] [CrossRef]
- Randazzo, T.; De Cian, E.; Mistry, M.N. Air conditioning and electricity expenditure: The role of climate in temperate countries. Econ. Model. 2020, 90, 273–287. [Google Scholar] [CrossRef]
- Kabeel, A.E.; Abdelgaied, M.; Sathyamurthy, R.; Arunkumar, T. Performance improvement of a hybrid air conditioning system using the indirect evaporative cooler with internal baffles as a pre-cooling unit. Alex. Eng. J. 2017, 56, 395–403. [Google Scholar] [CrossRef]
- Pirouz, B.; Maiolo, M. The role of power consumption and type of air conditioner in direct and indirect water consumption. J. Sustain. Dev. Energy Water Environ. Syst. 2018, 6, 665–673. [Google Scholar] [CrossRef] [Green Version]
- Saman, W.Y.; Bruno, F.; Tay, S. Technical Research on Evaporative Air Conditioners and Feasibility of Rating Their Energy Performance; University of South Australia: Adelaide, Australia, 2010. [Google Scholar]
- Bruno, F. Technical Background Research on Evaporative Air Conditioners and Feasibility of Rating Their Water Consumption; University of South Australia: Adelaide, Australia, 2009. [Google Scholar]
- Australian Bureau of Statistics. Environmental Issues: Water Use and Conservation; Australian Bureau of Statistics: Canberra, Australia, 2013. [Google Scholar]
- Australian Bureau of Statistics. Environmental Issues: Energy Use and Conservation; Australian Bureau of Statistics: Canberra, Australia, 2014. [Google Scholar]
- Bisbee, D. Technology Evaluation Report: The Coolerado; SMUD: Sacramento, CA, USA, 2010. [Google Scholar]
- Herrera, L.C.; Gómez-Azpeitia, G. Impact on water consumption by cooling equipment in arid region of Mexico. In Proceedings of the PLEA 2006—23rd International Conference on Passive and Low Energy Architecture, Conference Proceedings, Geneva, Switzerland, 6–8 September 2006. [Google Scholar]
- Zhao, B.; Hu, M.; Ao, X.; Pei, G. Conceptual development of a building-integrated photovoltaic–radiative cooling system and preliminary performance analysis in Eastern China. Appl. Energy 2017, 205, 626–634. [Google Scholar] [CrossRef]
- Niachou, A.; Papakonstantinou, K.; Santamouris, M.; Tsangrassoulis, A.; Mihalakakou, G. Analysis of the green roof thermal properties and investigation of its energy performance. Energy Build. 2001, 33, 719–729. [Google Scholar] [CrossRef]
- Ganguly, A.; Chowdhury, D.; Neogi, S. Performance of Building Roofs on Energy Efficiency—A Review. Energy Procedia 2016, 90, 200–208. [Google Scholar] [CrossRef]
- Palermo, S.A.; Zischg, J.; Sitzenfrei, R.; Rauch, W.; Piro, P. Parameter Sensitivity of a Microscale Hydrodynamic Model. In Green Energy and Technology; Springer: Palermo, Italy, 2019. [Google Scholar] [CrossRef]
- Palermo, S.A.; Turco, M.; Principato, F.; Piro, P. Hydrological effectiveness of an extensive green roof in Mediterranean climate. Water (Switz.) 2019, 11, 1378. [Google Scholar] [CrossRef] [Green Version]
- Piro, P.; Carbone, M.; Garofalo, G.; Sansalone, J. CSO treatment strategy based on constituent index relationships in a highly urbanised catchment. Water Sci. Technol. 2007, 56, 85–91. [Google Scholar] [CrossRef] [PubMed]
- Bevilacqua, P.; Bruno, R.; Arcuri, N. Green roofs in a Mediterranean climate: Energy performances based on in-situ experimental data. Renew. Energy 2020, 152, 1414–1430. [Google Scholar] [CrossRef]
- Piro, P.; Carbone, M.; Morimanno, F.; Palermo, S.A. Simple flowmeter device for LID systems: From laboratory procedure to full-scale implementation. Flow Meas. Instrum. 2019, 65, 240–249. [Google Scholar] [CrossRef]
- Pirouz, B.; Arcuri, N.; Pirouz, B.; Palermo, S.A.; Turco, M.; Maiolo, M. Development of an assessment method for evaluation of sustainable factories. Sustainability 2020, 12, 1841. [Google Scholar] [CrossRef] [Green Version]
- Maiolo, M.; Pirouz, B.; Bruno, R.; Palermo, S.A.; Arcuri, N.; Piro, P. The role of the extensive green roofs on decreasing building energy consumption in the mediterranean climate. Sustainability 2020, 12, 359. [Google Scholar] [CrossRef] [Green Version]
- Palermo, S.A.; Talarico, V.C.; Pirouz, B. Optimizing Rainwater Harvesting Systems for Non-potable Water Uses and Surface Runoff Mitigation. In Lecture Notes in Computer Science (Including Subseries Lecture Notes in Artificial Intelligence and Lecture Notes in Bioinformatics); Springer: Crotone, Italy, 2020. [Google Scholar] [CrossRef]
- Pirouz, B.; Palermo, S.A.; Turco, M.; Piro, P. New Mathematical Optimization Approaches for LID Systems. In Lecture Notes in Computer Science (Including Subseries Lecture Notes in Artificial Intelligence and Lecture Notes in Bioinformatics); Springer: Crotone, Italy, 2020. [Google Scholar] [CrossRef]
- Oberascher, M.; Zischg, J.; Palermo, S.A.; Kinzel, C.; Rauch, W.; Sitzenfrei, R. Smart Rain Barrels: Advanced LID Management Through Measurement and Control. In Green Energy and Technology; Springer: Palermo, Italy, 2019. [Google Scholar] [CrossRef]
- Mazzeo, D.; Oliveti, G.; de Gracia, A.; Coma, J.; Solé, A.; Cabeza, L.F. Experimental validation of the exact analytical solution to the steady periodic heat transfer problem in a PCM layer. Energy 2017, 140, 1131–1147. [Google Scholar] [CrossRef] [Green Version]
- Li, W.C.; Yeung, K.K.A. A comprehensive study of green roof performance from environmental perspective. Int. J. Sustain. Built Environ. 2014, 3, 127–134. [Google Scholar] [CrossRef] [Green Version]
- Nektarios, P.A. Green roofs: Irrigation and maintenance. In Nature Based Strategies for Urban and Building Sustainability; Butterworth-Heinemann: Oxford, UK, 2018; ISBN 9780128123249. [Google Scholar]
- Jaffal, I.; Ouldboukhitine, S.E.; Belarbi, R. A comprehensive study of the impact of green roofs on building energy performance. Renew. Energy 2012, 43, 157–164. [Google Scholar] [CrossRef]
- Mazzeo, D.; Bevilacqua, P.; De Simone, M.; Arcuri, N. A new simulation tool for the evaluation of energy performances of green roofs. In Proceedings of the Building Simulation Applications, Bozen, Italy, 4–6 February 2015. [Google Scholar]
- Silva, C.M.; Gomes, M.G.; Silva, M. Green roofs energy performance in Mediterranean climate. Energy Build. 2016. [Google Scholar] [CrossRef]
- Garofalo, G.; Palermo, S.; Principato, F.; Theodosiou, T.; Piro, P. The influence of hydrologic parameters on the hydraulic efficiency of an extensive green roof in Mediterranean area. Water (Switz.) 2016, 8, 44. [Google Scholar] [CrossRef]
Figure 1.
The experimental extensive Green Roof.

Figure 2.
The flowchart of the analysis.

Figure 3.
Thermal impact of green roof in summer and winter.

Figure 4.
The water consumption (water balance) of the green roof.

Figure 5.
Water consumption by the green roof and reduction in the thermal water footprint in the power plants after using the green roof.
Figure 5.
Water consumption by the green roof and reduction in the thermal water footprint in the power plants after using the green roof.

Figure 6.
Water consumption by the green roof in summer, winter, and the corresponding reduction in the thermal water footprint.
Figure 6.
Water consumption by the green roof in summer, winter, and the corresponding reduction in the thermal water footprint.


Table 1.
The water footprint in different types of power plants, m3 of water per GWh [12].
Table 1.
The water footprint in different types of power plants, m3 of water per GWh [12].
| Type | Fuel Supply | Construction | Operation | Total |
|---|---|---|---|---|
| Coal (C) | 61–2394 | 1.2–94 | 220–5076 | 282–7563 |
| Natural Gas (NG) | 4–126 | 1.2–4 | 266–4320 | 272–4450 |
| Conventional oil (CO) | 72–1965 | 1.2–94 | 698–2214 | 771–4273 |
| Hydropower (HP) | N/A | 1.1 | 5400–68,000 | 5400–68,000 Evaporation |
| 1080–3,059,755 | 1081–3,059,756 Operation | |||
| Geothermal (GT) | N/A | 7.2 | 19–2725 | 26–2732 |
| Wind (W) | N/A | 0.4–34 | 0.4–8 | 0.7–42 |
| Photovoltaic (PV) | N/A | 19.1–796 | 4–295 | 23–1091 |
Table 2.
Water withdrawal (W) and Consumption (C) in power plant cooling systems, m3 of water per MWh of electricity produced [36].
Table 2.
Water withdrawal (W) and Consumption (C) in power plant cooling systems, m3 of water per MWh of electricity produced [36].
| Type of Power Plant | Once-through | Re-Circulating | Dry-Cooling | |||
|---|---|---|---|---|---|---|
| W | C | W | C | W | C | |
| Coal (conventional) | 75–187.5 | 0.38–1.20 | 1.89–4.54 | 1.82–4.16 | N/A | N/A |
| Natural gas | 28–75 | 0.08–0.38 | 0.57–1.07 | 0.49–1.14 | 0–0.02 | 0–0.02 |
| Nuclear | 94–225 | 0.38–1.54 | 3.03–9.84 | 2.27–3.03 | N/A | N/A |
| Solar thermal | N/A | N/A | 2.70–4.20 | 2.74–4.20 | 0.16–0.30 | 0.16–0.30 |
Table 3.
Power consumption in two types of air conditioner for different house areas up to 140 m2 [40].
Table 3.
Power consumption in two types of air conditioner for different house areas up to 140 m2 [40].
| House Area (m2) | Type of Air Conditioner | Thermal Capacity | Power Consumption of the Devices (W) | Direct Water Consumption (L/h) |
|---|---|---|---|---|
| Up to ≈60 | Compression | 9000 | 1100 | N/A |
| Evaporative | 3500 (m3/h) | 530 | 35 | |
| Up to ≈110 | Compression | 20,000 | 2500 | N/A |
| Evaporative | 5500 (m3/h) | 690 | 53 | |
| Up to ≈140 | Compression | 24,000 | 3000 | N/A |
| Evaporative | 9360 (m3/h) | 950 | 59.4 |
Table 4.
Electric production by source for 2016 in Italy [34].
Table 4.
Electric production by source for 2016 in Italy [34].
| Type | 2007 | 2016 | |||||||
|---|---|---|---|---|---|---|---|---|---|
| GWh | % | GWh | % | GWh | % | GWh | % | ||
| Fossil | Coal | 44,112 | 15.6 | 239,623 | 84.9 | 35,608 | 14.0 | 165,883 | 65.2 |
| Natural Gas | 172,646 | 61.2 | 126,148 | 49.6 | |||||
| Conventional oil | 22,865 | 8.1 | 4127 | 1.6 | |||||
| Renewable | Hydropower | 32,815 | 11.6 | 42,457 | 15.1 | 42,432 | 16.7 | 88,514 | 34.8 |
| Geothermal | 5569 | 2.0 | 6289 | 2.5 | |||||
| Wind | 4034 | 1.4 | 17,689 | 7.0 | |||||
| Photovoltaic | 39 | 0.01 | 22,104 | 8.7 | |||||
| Total | 282,080 | 100 | 254,397 | 100 | |||||
Table 5.
Water and power consumption systems for an area of 55 m2 in summer and winter with and without a green roof.
Table 5.
Water and power consumption systems for an area of 55 m2 in summer and winter with and without a green roof.
| Season | Type of Roof | Type of Air Conditioner | Direct Water Consume (m3) | Power Consume (kW) | Type of Power Plant | Indirect Water Consumed in Power Plants (m3) | Total Water Consumed (m3) | Water Withdrawal (m3) | |
|---|---|---|---|---|---|---|---|---|---|
| Re-Circulating | Once-through | ||||||||
| Summer | Without green roof | Evaporative air conditioner, 3500 (m3/h) 530 W | 45.6 | 690 * | C | 0.19–5.22 | 71.2 | 2.22 | 90.57 |
| NG | 0.19–3.07 | 70.1 | 0.57 | 35.54 | |||||
| CO | 0.53–2.95 | 70.4 | - | - | |||||
| HP | 3.73–57.27 | 100.7 | 0.75–2111 | ||||||
| GT | 0.02–1.89 | 69.3 | 2.42 | N/A | |||||
| W | 0–0.03 | 68.4 | N/A | N/A | |||||
| PV | 0.02–0.75 | 68.7 | N/A | N/A | |||||
| Compression air conditioner, 1100 W | N/A | 1432 ** | C | 0.40–10.83 | 5.82 | 4.61 | 188.0 | ||
| NG | 0.39–6.37 | 3.58 | 1.17 | 73.8 | |||||
| CO | 1.10–6.12 | 4.16 | - | - | |||||
| HP | 7.73–118.87 | 67.17 | 1.55–4382 | ||||||
| GT | 0.04–3.91 | 1.99 | 5.01 | N/A | |||||
| W | 0–0.06 | 0.03 | N/A | N/A | |||||
| PV | 0.03–1.56 | 0.81 | N/A | N/A | |||||
| With green roof | Evaporative air conditioner, 3500 (m3/h) 530 W | 16.4 | 248 | C | 0.07–1.88 | 25.6 | 0.80 | 32.6 | |
| NG | 0.07–1.11 | 25.2 | 0.20 | 12.8 | |||||
| CO | 0.19–1.06 | 25.3 | - | - | |||||
| HP | 1.34–20.62 | 36.3 | 0.27–760 | ||||||
| GT | 0.01–0.68 | 25.0 | 0.87 | N/A | |||||
| W | 0–0.01 | 24.6 | N/A | N/A | |||||
| PV | 0.01–0.27 | 24.7 | N/A | N/A | |||||
| Compression air conditioner, 1100 W | N/A | 516 | C | 0.15–3.90 | 2.10 | 1.66 | 67.7 | ||
| NG | 0.14–2.29 | 1.29 | 0.42 | 26.6 | |||||
| CO | 0.40–2.20 | 1.50 | - | - | |||||
| HP | 2.78–42.79 | 24.18 | 0.54–1577 | ||||||
| GT | 0.01–1.41 | 0.72 | 1.80 | N/A | |||||
| W | 0–0.02 | 0.01 | N/A | N/A | |||||
| PV | 0.01–0.56 | 0.29 | N/A | N/A | |||||
| Winter | Without green roof | Electrical Heater | N/A | 1084 | C | 0.31–8.19 | 4.40 | 3.49 | 142.2 |
| NG | 0.29–4.82 | 2.71 | 0.89 | 55.8 | |||||
| CO | 0.84–4.63 | 3.15 | - | - | |||||
| HP | 5.85–89.93 | 50.82 | 1.17–3315 | ||||||
| GT | 0.03–2.96 | 1.51 | 3.79 | N/A | |||||
| W | 0–0.05 | 0.02 | N/A | N/A | |||||
| PV | 0.02–1.18 | 0.62 | N/A | N/A | |||||
| With green roof | Electrical Heater | N/A | 682 | C | 0.19–5.16 | 2.77 | 2.19 | 89.5 | |
| NG | 0.19–3.03 | 1.70 | 0.56 | 35.1 | |||||
| CO | 0.53–2.91 | 1.98 | - | - | |||||
| HP | 3.68–56.61 | 31.99 | 0.74–2087 | ||||||
| GT | 0.02–1.86 | 0.95 | 2.39 | N/A | |||||
| W | 0–0.03 | 0.01 | N/A | N/A | |||||
| PV | 0.02–0.74 | 0.39 | N/A | N/A | |||||
* 690 KW (Power consumed in summer by evaporative air conditioner) = (530 W × 14 h × 31 Days × 3 Months)/1000. ** 1432 KW (Power consumed in summer by compression air conditioner) = (1100 W × 14 h × 31 Days × 3 Months)/1000.
Table 6.
The total amount of power and water reduction in summer and winter by the green roof.
| Season | Type of Air Conditioner | Type of Power Plant | The Total Reduction in Power Consumption (kW) | The Total Reduction in Water Consumption (m3) | The Total Reduction in Water Withdrawal (m3) | |
|---|---|---|---|---|---|---|
| Re-Circulating | Once-through | |||||
| Summer, energy reduction equal to 64% | Evaporation air conditioner | C | 442 | 45.5 | 1.4 | 58.0 |
| NG | 44.8 | 0.4 | 22.7 | |||
| CO | 45.0 | - | - | |||
| HP | 64.5 | 0.5 | 1351.3 | |||
| GT | 44.4 | 1.5 | N/A | |||
| W | 43.8 | N/A | N/A | |||
| PV | 44.0 | N/A | N/A | |||
| Compression air conditioner | C | 916 | 3.72 | 2.95 | 120.30 | |
| NG | 2.29 | 0.75 | 47.21 | |||
| CO | 2.67 | - | - | |||
| HP | 42.99 | 0.99 | 2804.60 | |||
| GT | 1.28 | 3.21 | N/A | |||
| W | 0.02 | N/A | N/A | |||
| PV | 0.52 | N/A | N/A | |||
| Winter, energy reduction equal to 15% | Electrical Heater | C | 402 | 1.63 | 1.29 | 52.70 |
| NG | 1.00 | 0.33 | 20.68 | |||
| CO | 1.17 | - | - | |||
| HP | 18.83 | 0.43 | 1228.49 | |||
| GT | 0.56 | 1.41 | N/A | |||
| W | 0.01 | N/A | N/A | |||
| PV | 0.23 | N/A | N/A | |||
Publisher’s Note: MDPI stays neutral with regard to jurisdictional claims in published maps and institutional affiliations. |
© 2020 by the authors. Licensee MDPI, Basel, Switzerland. This article is an open access article distributed under the terms and conditions of the Creative Commons Attribution (CC BY) license (http://creativecommons.org/licenses/by/4.0/).
Share and Cite
MDPI and ACS Style
Pirouz, B.; Palermo, S.A.; Maiolo, M.; Arcuri, N.; Piro, P. Decreasing Water Footprint of Electricity and Heat by Extensive Green Roofs: Case of Southern Italy. Sustainability 2020, 12, 10178. https://doi.org/10.3390/su122310178
AMA Style
Pirouz B, Palermo SA, Maiolo M, Arcuri N, Piro P. Decreasing Water Footprint of Electricity and Heat by Extensive Green Roofs: Case of Southern Italy. Sustainability. 2020; 12(23):10178. https://doi.org/10.3390/su122310178
Chicago/Turabian StylePirouz, Behrouz, Stefania Anna Palermo, Mario Maiolo, Natale Arcuri, and Patrizia Piro. 2020. "Decreasing Water Footprint of Electricity and Heat by Extensive Green Roofs: Case of Southern Italy" Sustainability 12, no. 23: 10178. https://doi.org/10.3390/su122310178
Note that from the first issue of 2016, this journal uses article numbers instead of page numbers. See further details here.