Water-Energy Nexus: A Pathway of Reaching the Zero Net Carbon in Wastewater Treatment Plants


Department of Process Engineering, Industrial and Civil Engineering School, Universidad de Las Palmas de Gran Canaria, Campus de Tafira Baja, 35017 Las Palmas de Gran Canaria, Spain
*
Author to whom correspondence should be addressed.
Sustainability 2020, 12(22), 9377; https://doi.org/10.3390/su12229377
Submission received: 18 September 2020
/
Revised: 5 November 2020
/
Accepted: 9 November 2020
/
Published: 11 November 2020
(This article belongs to the Special Issue Climate Adaptation and Mitigation through Sustainable Energy Solutions)
Abstract
:The water-energy nexus, together with the need for sustainable management of these interconnected resources, has attracted growing attention from the scientific community. This paper focuses on this nexus from the point of view of the energy that is required by wastewater treatment plants, which are intensive energy consumers and major emitters of greenhouse gases. The main objective of the study is to investigate the possible use of a wastewater plant’s internal chemical, potential, and kinetic energy, and the addition of external renewable technologies with a view to achieving clean energy consumption and reducing greenhouse gas emissions. For this purpose, an analysis is made of the feasibility of introducing alternative technologies—anaerobic digestion, hydraulic turbines, wind turbines, and photovoltaic modules— to meet the plant’s energy needs. The plant chosen as case study (Jinamar plant, Canary Islands, Spain) has an energy consumption of 2956 MWh/year, but the employed methodological framework is suitable for other plants in locations where the renewable energy potential has previously been analyzed. The results show that a renewable energy production of 3396 MWh/year can be obtained, more than enough to meet plant consumption, but also confirm the need for an energy storage system, due to seasonal variability in energy resource availability. In terms of climate change mitigation, the emission of 2754 tons/year of greenhouse gases is avoided. In addition, the economic viability of the proposed system is also confirmed.
1. Introduction
Throughout history, water and energy have been determining factors in the development of humanity [1]. Despite being conceptually different, water needs energy for the diverse stages that make up its cycle [2], and it can likewise be argued that, certainly since the invention of the steam engine in 1712, energy needs water [3]. While water may be a source of energy (hydroelectric, geothermal, and oceanic), the water industry is undoubtedly energy intensive [4] and it consumes 1723 TWh, which is the equivalent of 8% of world energy production [5]. Consumption is forecast to double by the year 2040, highlighting the intensification of desalination processes in the Middle East and North Africa and wastewater treatment processes in emerging economies [5].
According to data from the International Energy Agency, 583 billion m3 of water are consumed in electricity production (approximately 15% of the water used globally), of which 66 billion will not be returned to their source [6]. Depending on the type of fuel used for electricity production, the water consumption ranges from 0.7 m3/MWh (combined cycle) to 2.7 m3/MWh (nuclear power) [7].
Despite their interconnection, water and energy tended to be studied and managed independently until Dr. Peter H. Gleick demonstrated an intrinsic relationship between these two resources in the 1990s, developing the concept that is known as the “water-energy nexus” [8]. Scientific and technological developments have since confirmed the close interrelation between the water and energy sectors [9,10,11].
In the management of water and energy cycles, this water-energy nexus needs to be considered in terms of its contribution to global warming through the emission of greenhouse gases (GHGs). This is supported by the various conclusions of the Kyoto Protocol, the Climate Change Summit, as well as other different international bodies [12,13]. In progress alongside this, the European Union’s perspective is to reduce 30% GHG emissions by 2020 and around 80% by 2050, relative to the 1990 levels [14].
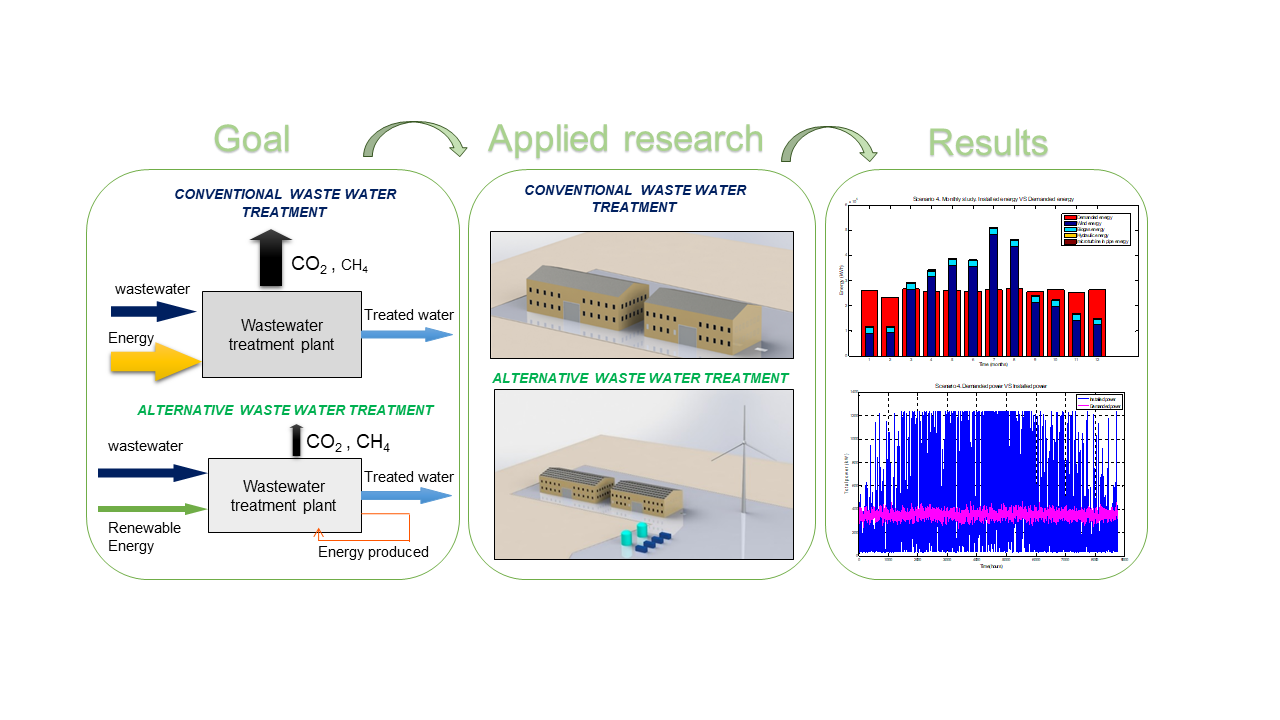
The main objective of this work is to quantitatively demonstrate that, by introducing different clean technologies that allow for them to be less dependent on fossil energy, wastewater treatment plants (WWTPs) do not necessarily need to be considered as intensive energy consumers and high GHG emitters, but can instead even be considered as ‘green factories’. This problem is intensified in island regions that are unable to meet water demand with own resources and are also energy dependent, needing to import fossil fuels in order to produce electricity.
While several investigations have been carried out in recent years in this respect [15,16,17,18,19], none of them integrate a complex mix of technologies into their analysis, nor do they prioritize (in the case of working with several technologies) the use of the intrinsic energy resources of the plant. In this regard, most of them, such as the works of R. K. Bhatia et al., and Y. Gu et al., analyze different alternatives to recover the internal energy of the plant using sewage sludge [15,16]. Among these alternatives, S. Waclawek et al., choose anaerobic digestion as one of the most profitable technologies but they still do not use external technologies [17]. It will be the research of M. Maktabifard et al., and that of E. Gürtekin that complement the production of internal renewable energy, together with external renewable technologies, but only implement solar energy and a hybrid heat pump-solar energy system, respectively [18,19]. Thus, to our knowledge, is the first time that a complete integration mix of renewable technologies is been studied for a WWTP. In addition, a completely clean emissions energy storage has been proposed for solving the problem of intermittent mismatch between renewable energy supply and demand [20,21]. This also contribute to achieving higher grid capacity, more efficient and sustainable use of final energy, and greater network security [22].
In this work, a simulation of the integration of five different renewable technologies in a WWTP is developed. The selection of technologies can be divided into two sections. The first aims to take advantage of the intrinsic (internal) energy resources that the plant can provide through its infrastructure (flows and heads) and generated waste (sludge). The second section uses the available natural resources that characterize the island (solar radiation and wind), implementing solar photovoltaic (PV) and wind technology as external contributions to the plant. A series of simulations are carried out that establish various scenarios with different configurations of the technologies employed in order to ensure the viability of the study from an environmental and techno-economic perspective.
2. Materials and Methods
2.1. Wastewater Treatment Plant Selection
This present study focuses on the island of Gran Canaria (Canary Islands, Spain), where 91.9% of the energy coverage of the island is met by imported conventional fossil fuel-based energies [23]. Approximately 11% of this polluting energy ends up in the water cycle. For the purposes of this study, WWTPs were chosen, as they are one of the greatest GHG emitters (2.66–3.40 kg CO2/m3) [24], producing 56% of GHG emissions in the water industry [25]. They are also intensive energy consumers in local city loads (0.38–1.22 kWhe/m3), causing indirect emissions at the same time [26,27,28].
All of the 25 WWTPs operated by the Gran Canaria Insular Water Council were previously evaluated (solar radiation, wind characteristics, pipe layout, and sludge production) with the objective of choosing a suitable plant for the implementation of the five renewable technologies [29]. The Jinamar WWTP, with a design capacity of 10,000 m3/d, was selected as test site for this study. This plant is one of the few that allows for the multiple integration of all renewable energies and, in terms of internal energy resources, it is in a leading position in the island’s WWTP ranking.
The Jinamar WWTP is located in the eastern part of the island. The primary (roughing filter, grease and grit separators, and balancing tank) and secondary treatments (membrane bioreactor) are able to achieve the quality criteria required to irrigate a nearby golf course with the treated effluent.
The annual energy consumption of the plant amounts to 2956 MWh [30]. Plant loads, in accordance with the plant design (pumping, aeration, primary treatment, sludge treatment, and disposal) were grouped and distributed over the operating hours of the plant to make up its load profile.
2.2. Design and Estimation of Green Energy Production Technologies
With a view to reducing fossil fuel energy consumption and thereby mitigating climate change, alternative technologies have been considered, classified according to their implementation in the plant—external or internal. The range of priorities begins with the use of the internal energy that the WWTP can develop, thus contributing to the circular economy [31].
2.2.1. Energy Recovery Technologies Internal to the Plant. Sludge Treatment and Microturbines in Pipes
The chemical energy that can be obtained through the sludge treatment solves a dual problem unilaterally. The main waste of the plant becomes a second-generation product that provides energy to the plant and, thereby, avoids its immediate environmental impact [32,33]. Wastewater sludge would be a viable wet feedstock for biofuels production [34].
Critical reviews, such as the one that was carried out by Tyagi and Lo [35], describe all of the technologies analyzed for sludge treatment. Of these, anaerobic digestion was selected for its industrial maturity, simple operation and maintenance, affordable cost, circular economy contribution, energy production (as one of the main objectives) [36], and low GHG emissions provided that the digested biogas is properly managed.
Sludge characterization was the first step in the design of the anaerobic digester. For this, eight tests were carried out, including the analysis of total organic carbon (TOC), chemical oxygen demand (COD), pH, conductivity, total, volatile and fixed solids, humidity, density, and an elemental analysis of the carbon, nitrogen, hydrogen, and sulfur content. A total of 26 samples were analyzed following standard APHA (American Public Health Association) methods [37] and different UNE (Spanish Association for Standardization) regulations.
With respect to the anaerobic digester configuration, low speed reactors were discarded due to their high residence time and their limited capacity of approximately 3450 m3/day. Likewise, the thermophilic temperature range was dismissed, as it is mostly used in specialized biogas plants. Although these types of reactor provide higher loading rates, the destruction of pathogens and biogas production, they have high levels of ammonia, are very susceptible to loading problems, have a higher cost of heating, pronounced odors, and auxiliary equipment, such as pipes, valves, and accessories, are more expensive [38].
For the calculation of the digester dimensions, the load factor method was used, which considers the kilograms of volatile solids per day and cubic meter of digester capacity. Finally, the configuration of the digester selected to treat the 3600 tons of mixed sludge daily consists of a two-stage digestion system that works in a mesophilic temperature range (optimal value ~35 °C) at high speed and with complete mixing in the first reactor. A hydraulic retention time was established of 10 days (which will have the same value as the cellular retention time when working in a complete mixing reactor without recirculation) [39].
After deciding how to obtain the biogas, the different energy recovery systems had to be evaluated. The fuel cell (FC) technology was selected, as the intention is to work with zero carbon footprint technologies. Its modular nature and silent operation with low aesthetic impact and high efficiency in the direct production of electricity suggest its use in urban WWTPs [40].
The biogas has first to be transformed into hydrogen in order to use the FCs. Steam reforming is one of the most widely used methods in order to produce hydrogen enriched gases (obtaining 69% of hydrogen concentration) [41]. The main drawback is that the biogas may contain potentially harmful compounds that have to be eliminated to avoid structural damage to the equipment. Prior to steam reforming, a condenser (moisture removal), an adsorption system with active carbon (elimination of siloxanes), and a Binax system (elimination of volatile organic carbons) have to be implemented [42].
The final step before electricity can be obtained from the sludge was to select the FC model. The proton exchange membrane fuel cell (PEM FC) was chosen, due to its low operating temperatures, low corrosion, and easy maintenance. These FCs are characterized by their high sensitivity to carbon monoxide [43]. The use of a pressure swing adsorption (PSA) system was also adopted in order to eliminate the last harmful components of the gas obtaining 89% of hydrogen in its composition, as recommended in several references [44]. Figure 1 shows a schematic representation of the entire process.
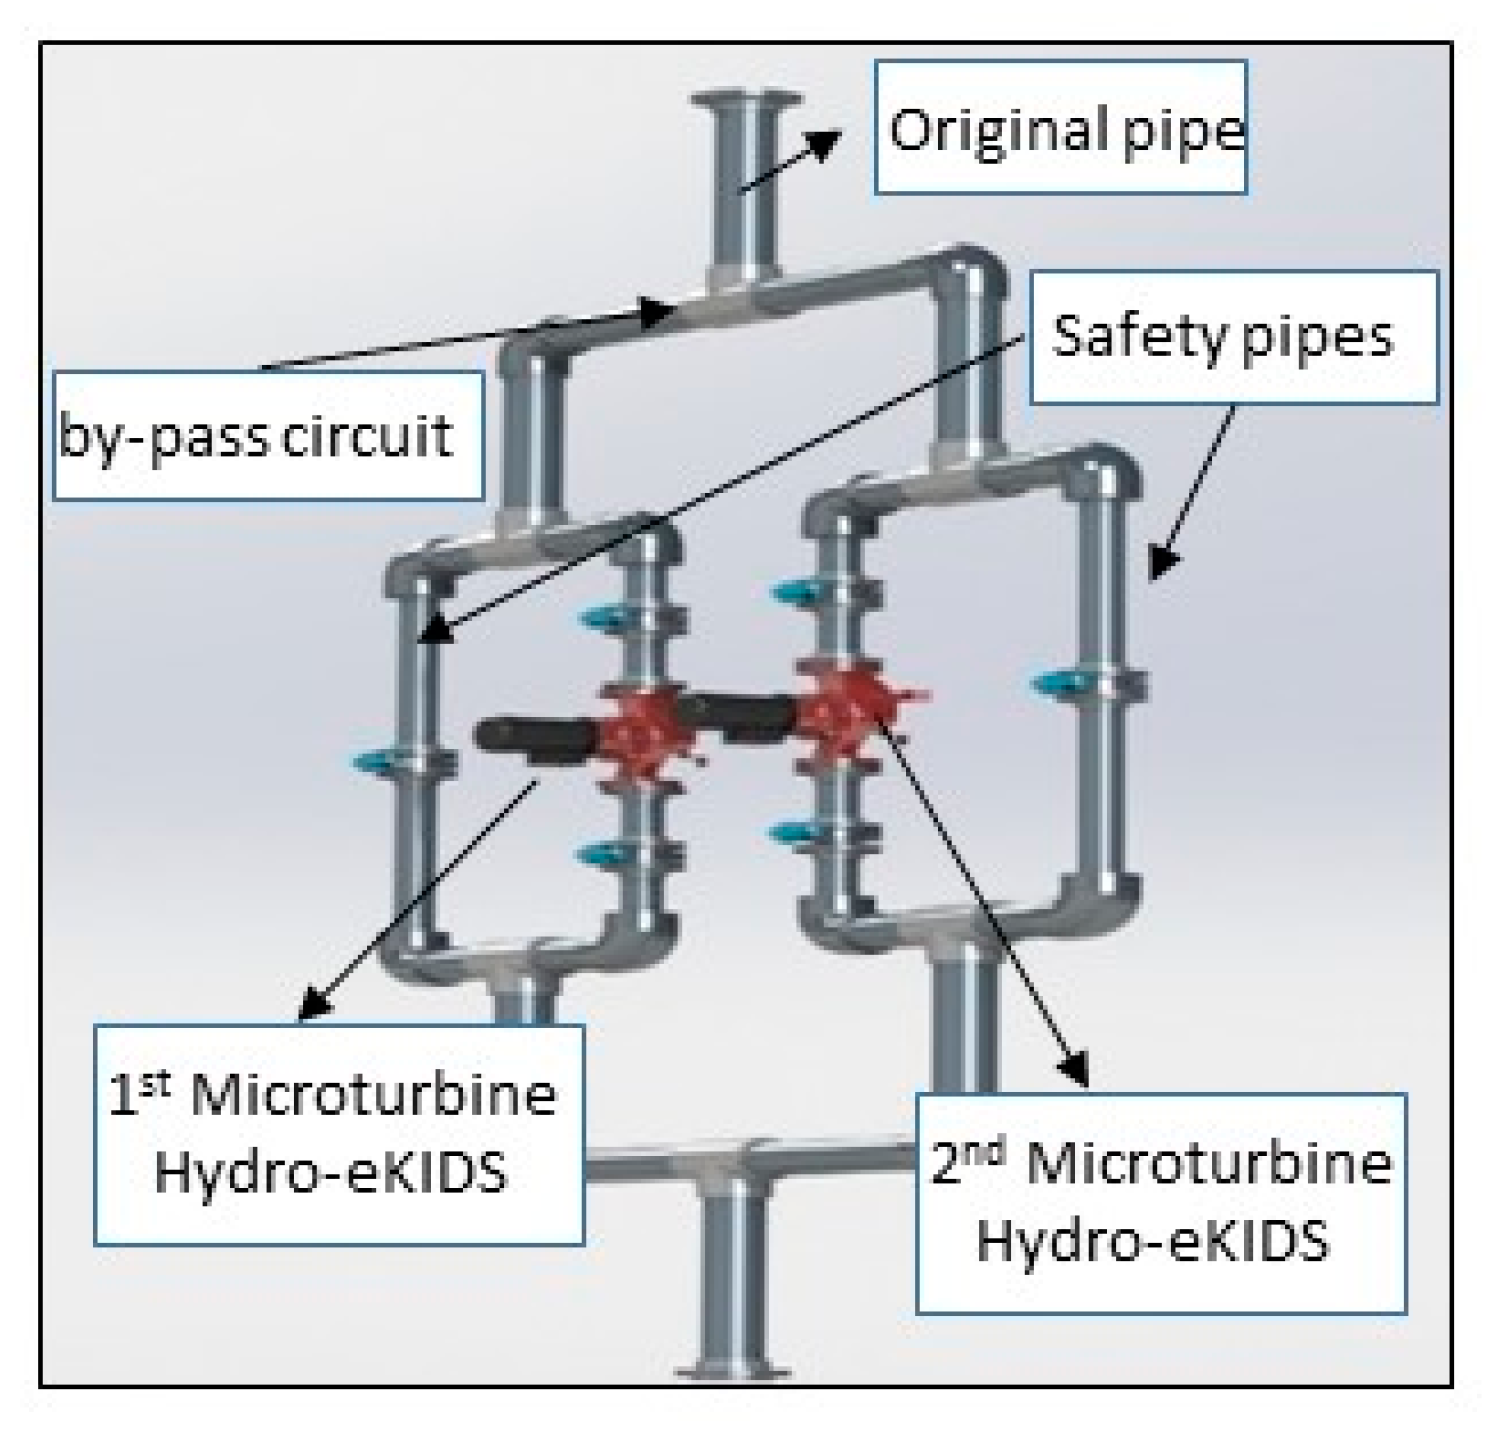
Another intrinsic energy resource in a WTTP is the kinetic energy that is produced by the passage of effluent through its pipes. This energy can be used in order to move the blades of microturbines installed in them. The standard pipe diameter of the plant is 280 mm. The flow is kept constant, thanks to the balancing tank and the correct operation of the biological reactor membranes.
The selected pipe contains the treated effluent of the secondary treatment (avoiding problems of obstruction inherent to the raw water), which goes to the permeate and washing water tank. The characteristics that it presents correspond to a flow of 0.061 m3/s and a net head of 3 m.
These data suggest the use of a pico-turbine system. The optimal solution of the systems evaluated was to perform a bypass and install two pico-turbines in parallel (Figure 2). For an estimation of the energy production, an efficiency rate of 70% is assumed [45] and an inverter efficiency of 85% [46].
2.2.2. Energy Production Technologies External to the Plant. Photovoltaic, Wind, and Hydroelectric Energy
First of all, an evaluation of the solar resource available to the plant was made. The operational data were obtained with the Hybrid Optimization of Multiple Energy Resources simulation program [47]. Using a geographic coordinate system, HOMER provides the average global solar radiation on a horizontal surface via NASA’s satellite system. The irradiation correction coefficient as a function of inclination was applied to these data. The latitude of the plant makes this coefficient between 15–30°. The optimal location in terms of orientation is on the south face of the two roofs of the WWTP. The slope of the roofs is 15°, and this same angle was chosen for the selection of the correction factor, as the panels can be placed flush with the roof and the costs of the support structure or possible losses due to shadow between them can, thus, be avoided. The annual global radiation obtained after applying the correction factor is 1914 kWh/m2.
The performance ratio (PR) values for new systems typically range from 0.6 to 0.9 [48]. After calculating losses due to wiring, dispersion of characteristics in the module, dust and dirt, orientation and inclination, shading, inverter performance, and temperature, a PR was obtained of 0.75 for the first ten years and 0.65 for the following years. The average PR of 0.7 was used for the calculations in the present study.
In terms of wind potential, the windiest areas of Gran Canaria include the northwest and southeast [49]. The Jinamar WWTP is located in the northeast, at a short distance from the area of highest wind intensity.
The wind data were obtained from a 10 m agl (above ground level) anemometer installed at the facilities of the ITC (Spanish initials of the Technological Institute of the Canary Islands) on the east coast of the island and very close to the plant. The power law was applied to the wind speed distribution in order to obtain the values at 60 m (turbine hub height) [50]. Subsequently, these values were introduced into the HOMER simulation program, giving an average wind speed of 7.7 m/s, a form factor C = 8.72 m/s and a scale factor K = 2.
The selection of the wind turbine depends on the peak load to be supplied (432 kW). It is also intended to comply with all the legislative criteria stipulated in the Canary Islands [51] with respect to the minimum distances from the coast of 150 m and urban centers of 250 m [52].
Related to hydroelectric energy, the plant has a 5 m head behind the storage tank of the treated effluent. The nominal diameter is 500 mm and the flow rate varies, depending on two time periods: 180 m3/h from 08:00 to 24:00 and 120 m3/h from 24:00 to 08:00. Therefore, the hydraulic resource will provide a constant energy altered only by the time variable.
2.3. System Analysis
A series of scenarios were simulated using MATLAB software (Global Optimization Toolbox: User’s Guide, R2018b version, United States, 2018) in order to meet the energy needs of the plant and evaluate which technological configuration is the most efficient [53]. This tool allows for the customization of the selection criteria and prioritization of the installation of internal technologies in the plant that contribute directly to a circular economy [54,55]. Table 1 shows four scenarios, all of which contain the internal sludge and microturbine energy production systems with varying arrangements of the external technologies.
2.4. Energy Storage
The behavior of renewable energies throughout the year predicts the need to implement an energy storage system. Among all of the validated storage systems, such as batteries, flywheels, ultracapacitors, magnetic superconductors, compressed air, hydro-pumping, and hydrogen [56], the last three provide long-duration energy storage. Conventional systems, such as batteries, have severe drawbacks in the fields of action where long-term storage is required, including the dissipation of energy, a low energy density, and the need to install a relatively large number of units [57]. For this study, hydrogen storage was selected for its high density and low energy loss, as well as its good adaptability and efficiency when used with renewable energy resources [58].
An alkaline electrolyzer system was chosen, as its suitability for use with wind turbines has been shown, with a fast response time (<1 s) and a wide operating range (10%–00%) [59]. Specifically, the HySTAT®100-10 model that was manufactured by Hydrogenics Corporation was selected as it works with the supply voltage of the wind turbines in alternating current (440 V), a frequency of 50 Hz, and a consumption of 5.3 kWh/m3. The equipment includes a refrigeration and air conditioning system, as well as a reverse osmosis water treatment system, which uses 1.5 liters of the ultra-filtered water left over from the membrane bioreactor treatment per cubic meter of hydrogen. As the standard electrolyzer production pressure is 10 bar, a compressor is also required in order to raise the pressure to the selected 200 bar for hydrogen storage in compressed gas bottles.
Hydrogen production from the energy surplus was calculated on the basis of the peak power output of the renewable mix after subtracting the WWTP demand. The electrolyzer has a minimum production rate of 6 Nm³/h, so at least 33 kW must be supplied to the unit to start production. If the supply is below this value, then the unit does not produce hydrogen, but it is placed in standby mode (for which approximately 0.5 kW is required).
After hydrogen storage, a fuel cell and its corresponding inverter are used in order to produce electricity. The sizing of this system is calculated on the basis of the highest energy deficit value that needs to be covered.
3. Results and Discussion
This section shows the energy that is produced with each renewable technology. Subsequently, an analysis of the energy integration to the plant is performed evaluating the different technological configurations. The economic viability of the different scenarios is calculated in the final part of this section.
3.1. Internal Renewable Energy Production
While using the load factor method with the volatile solids experimental data (3.3 kg/m3), a digester volume of 144 m3 (height 7.5 m and diameter 5.5 m) was determined. The amount of biogas that can be obtained is 190,800 m3/year. This is stored in the second reactor, which serves as a bio-solids stabilizer and storage system. The gas flow obtained (19.38 Nm3/h) is introduced into the FCs in order to produce electricity (after PSA purification). Knowing the density of hydrogen (0.0899 kg/m3), FC consumption (119 L/min), its power (10.5 kW), and efficiency (50%), it is possible to install three FCs that are capable of producing 31.95 kWhe of energy while releasing a certain amount of water at 80 °C that can be used to schedule internal processes of the plant, such as anaerobic digestion.
In order to harness the kinetic energy in the selected pipe, the microturbine that best fits its characteristics is the Toshiba Hydro-eKIDS S3 model. The conditions allow for the installation of two microturbines in series and a total obtainable power of 4 kW.
3.2. External Renewable Energy Production
In terms of solar energy, the limiting factor in the design is found on the surface of the roofs. Taking into account their dimensions, as well as those of the PV panels, it is possible to install 105.6 kWp of power through a total of 440 Q.Base 240 modules of the Q-cell brand. These 440 modules are divided into two generating groups, each with 220 panels and a SolarMax 50C inverter in a distribution of 11 strings of 20 modules. The resulting energy production amounts to 141,512 kWh/year.
On the other hand, wind technology provides 1,620,578 kWh/year through an Enercon E-40/500 wind turbine. The calculation procedure takes the power curve of the turbine, as well as the wind speed and the respective probability distribution, into account. This selection provides 3241 equivalent hours and a load factor of 36.99%; the optimal values that confirm the feasibility of implantation.
Finally, with regard to hydroelectric energy, 11,359 kWh per year can be produced in this way configuring the selected system.
3.3. System Analysis
Once the energy outputs of each technology are known, the simulated scenarios are distributed, as follows (see Table 2). It is worth highlighting the differences in the installed power between internal plant technologies and wind and solar energy.
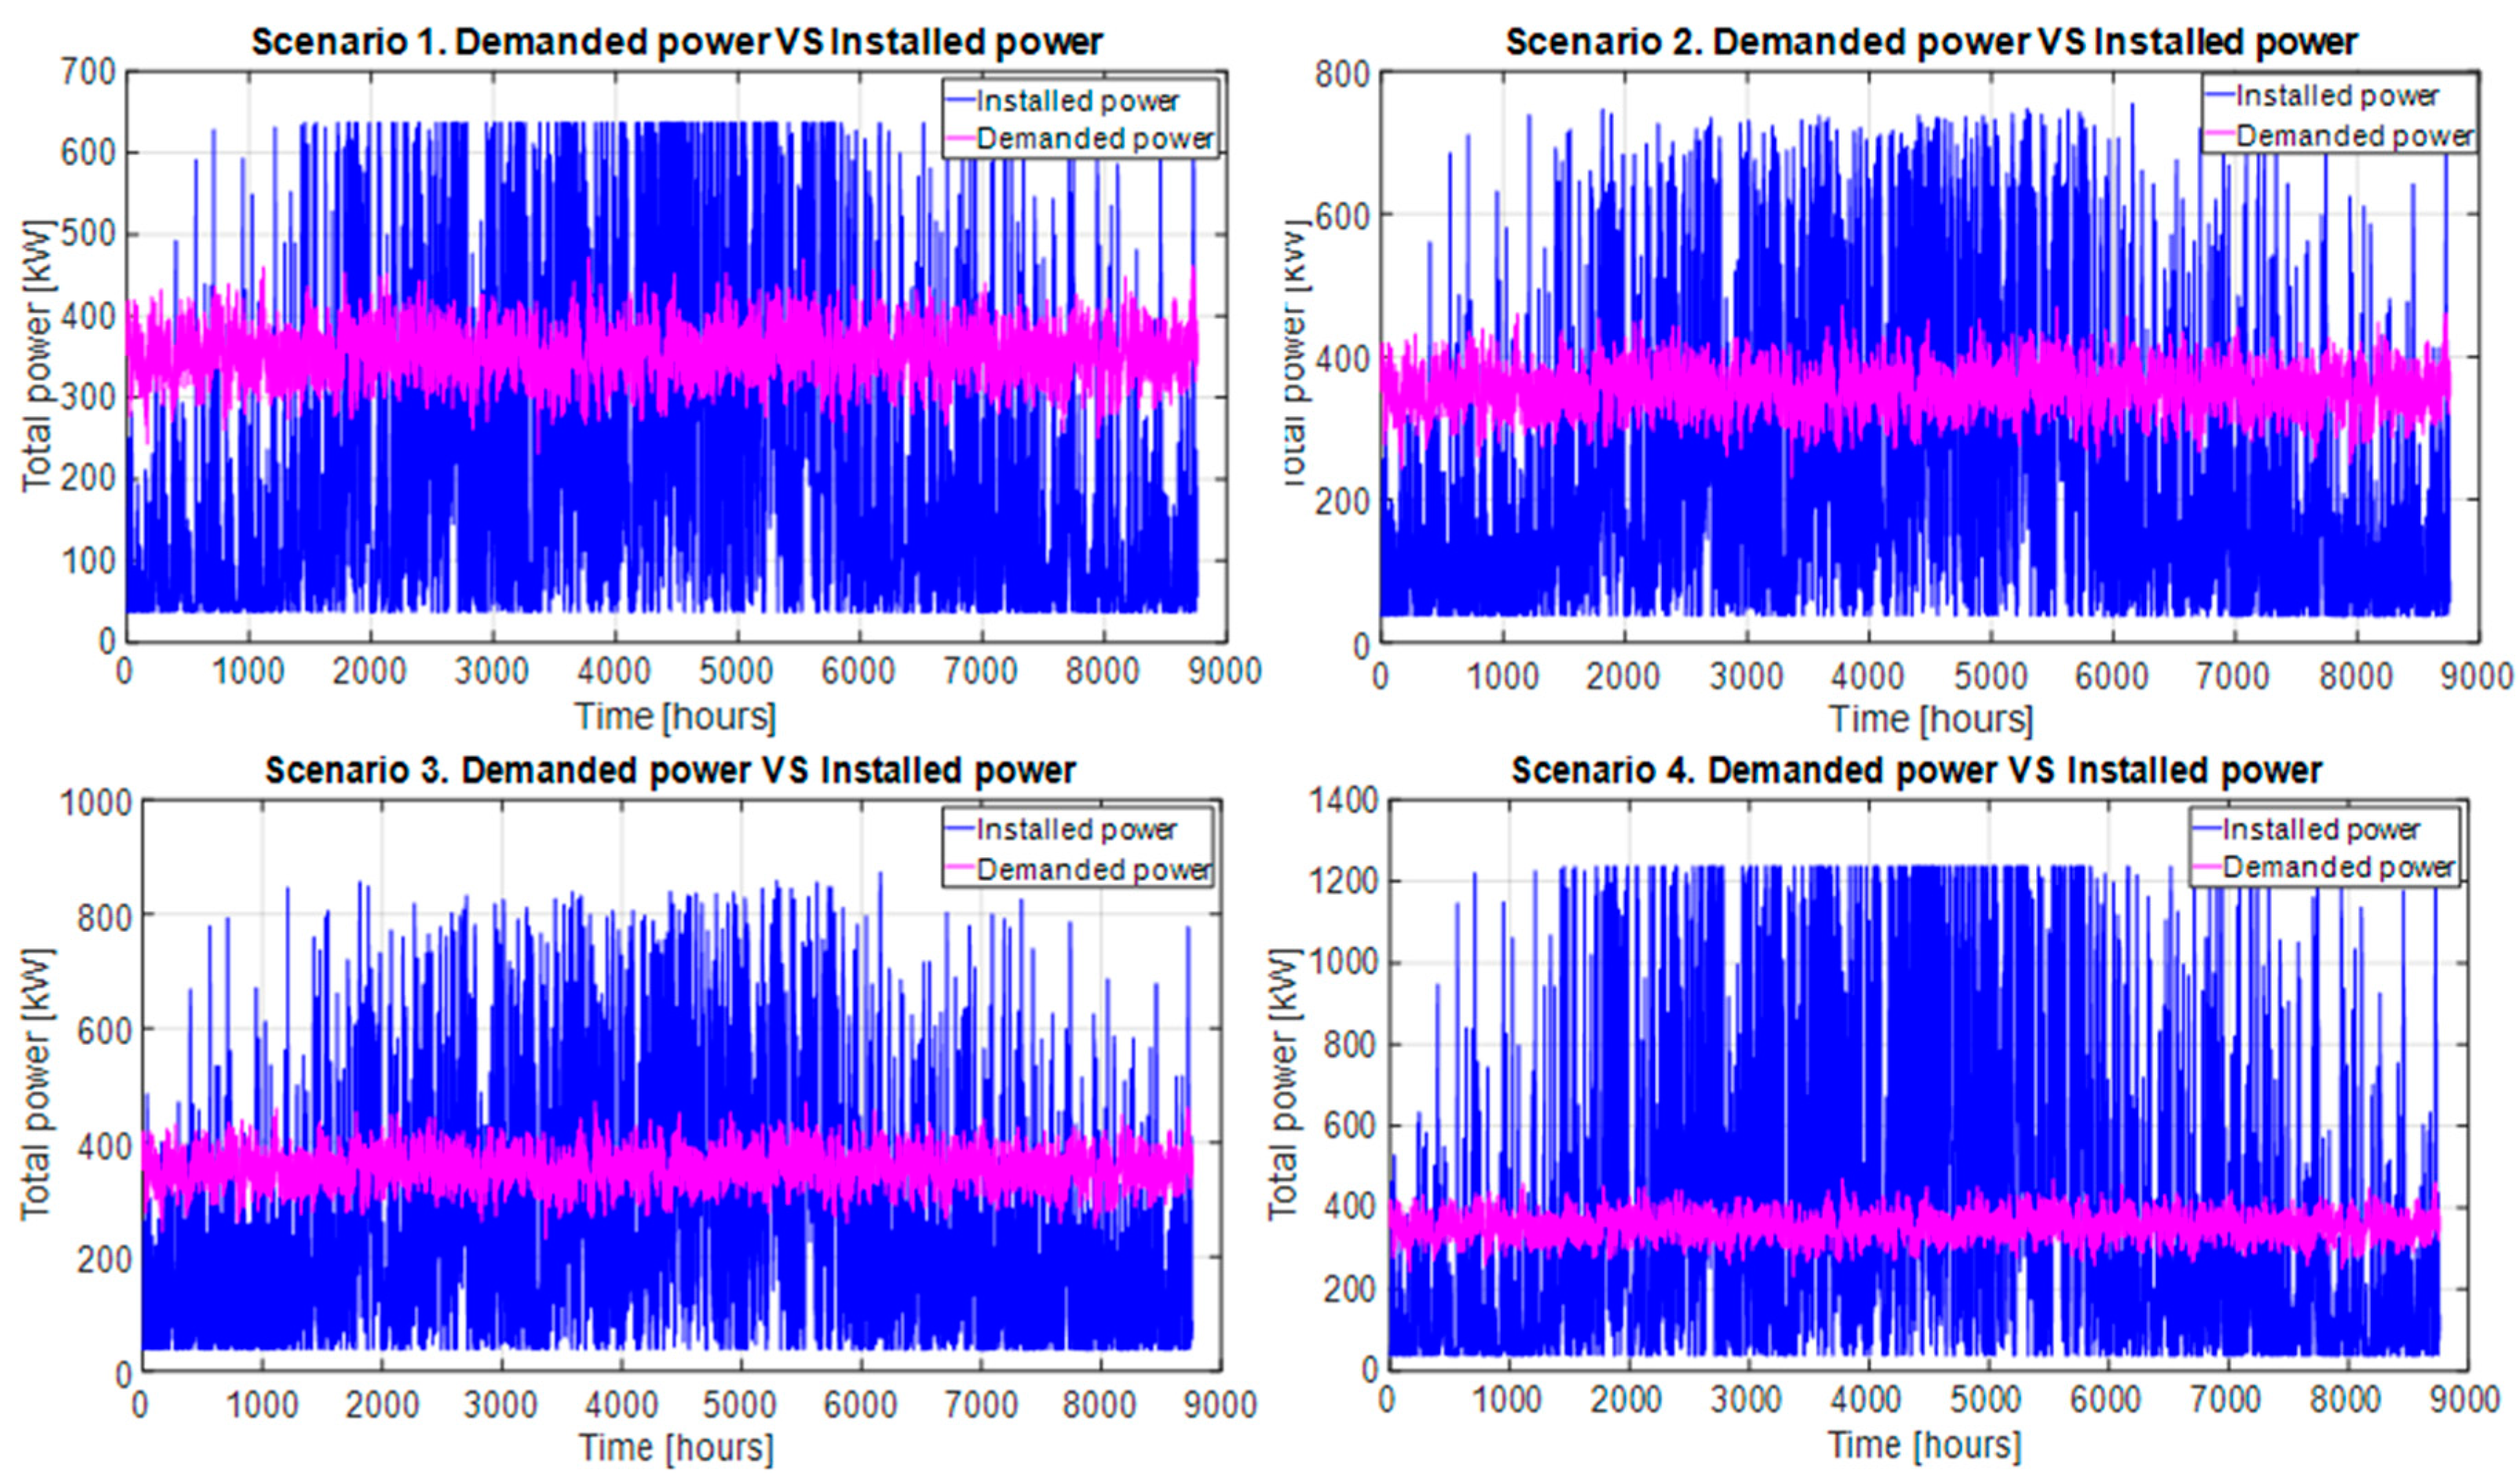
With the intention of evaluating the contribution of each scenario, Figure 3 compares the annual power demand of the plant with the annual installed renewable power. Although, at first glance, it may seem that plant demand is covered, the reality is that, in most of the scenarios, a significant number of hours are found with a fairly pronounced renewable power deficit, while demand remains more or less constant over time.
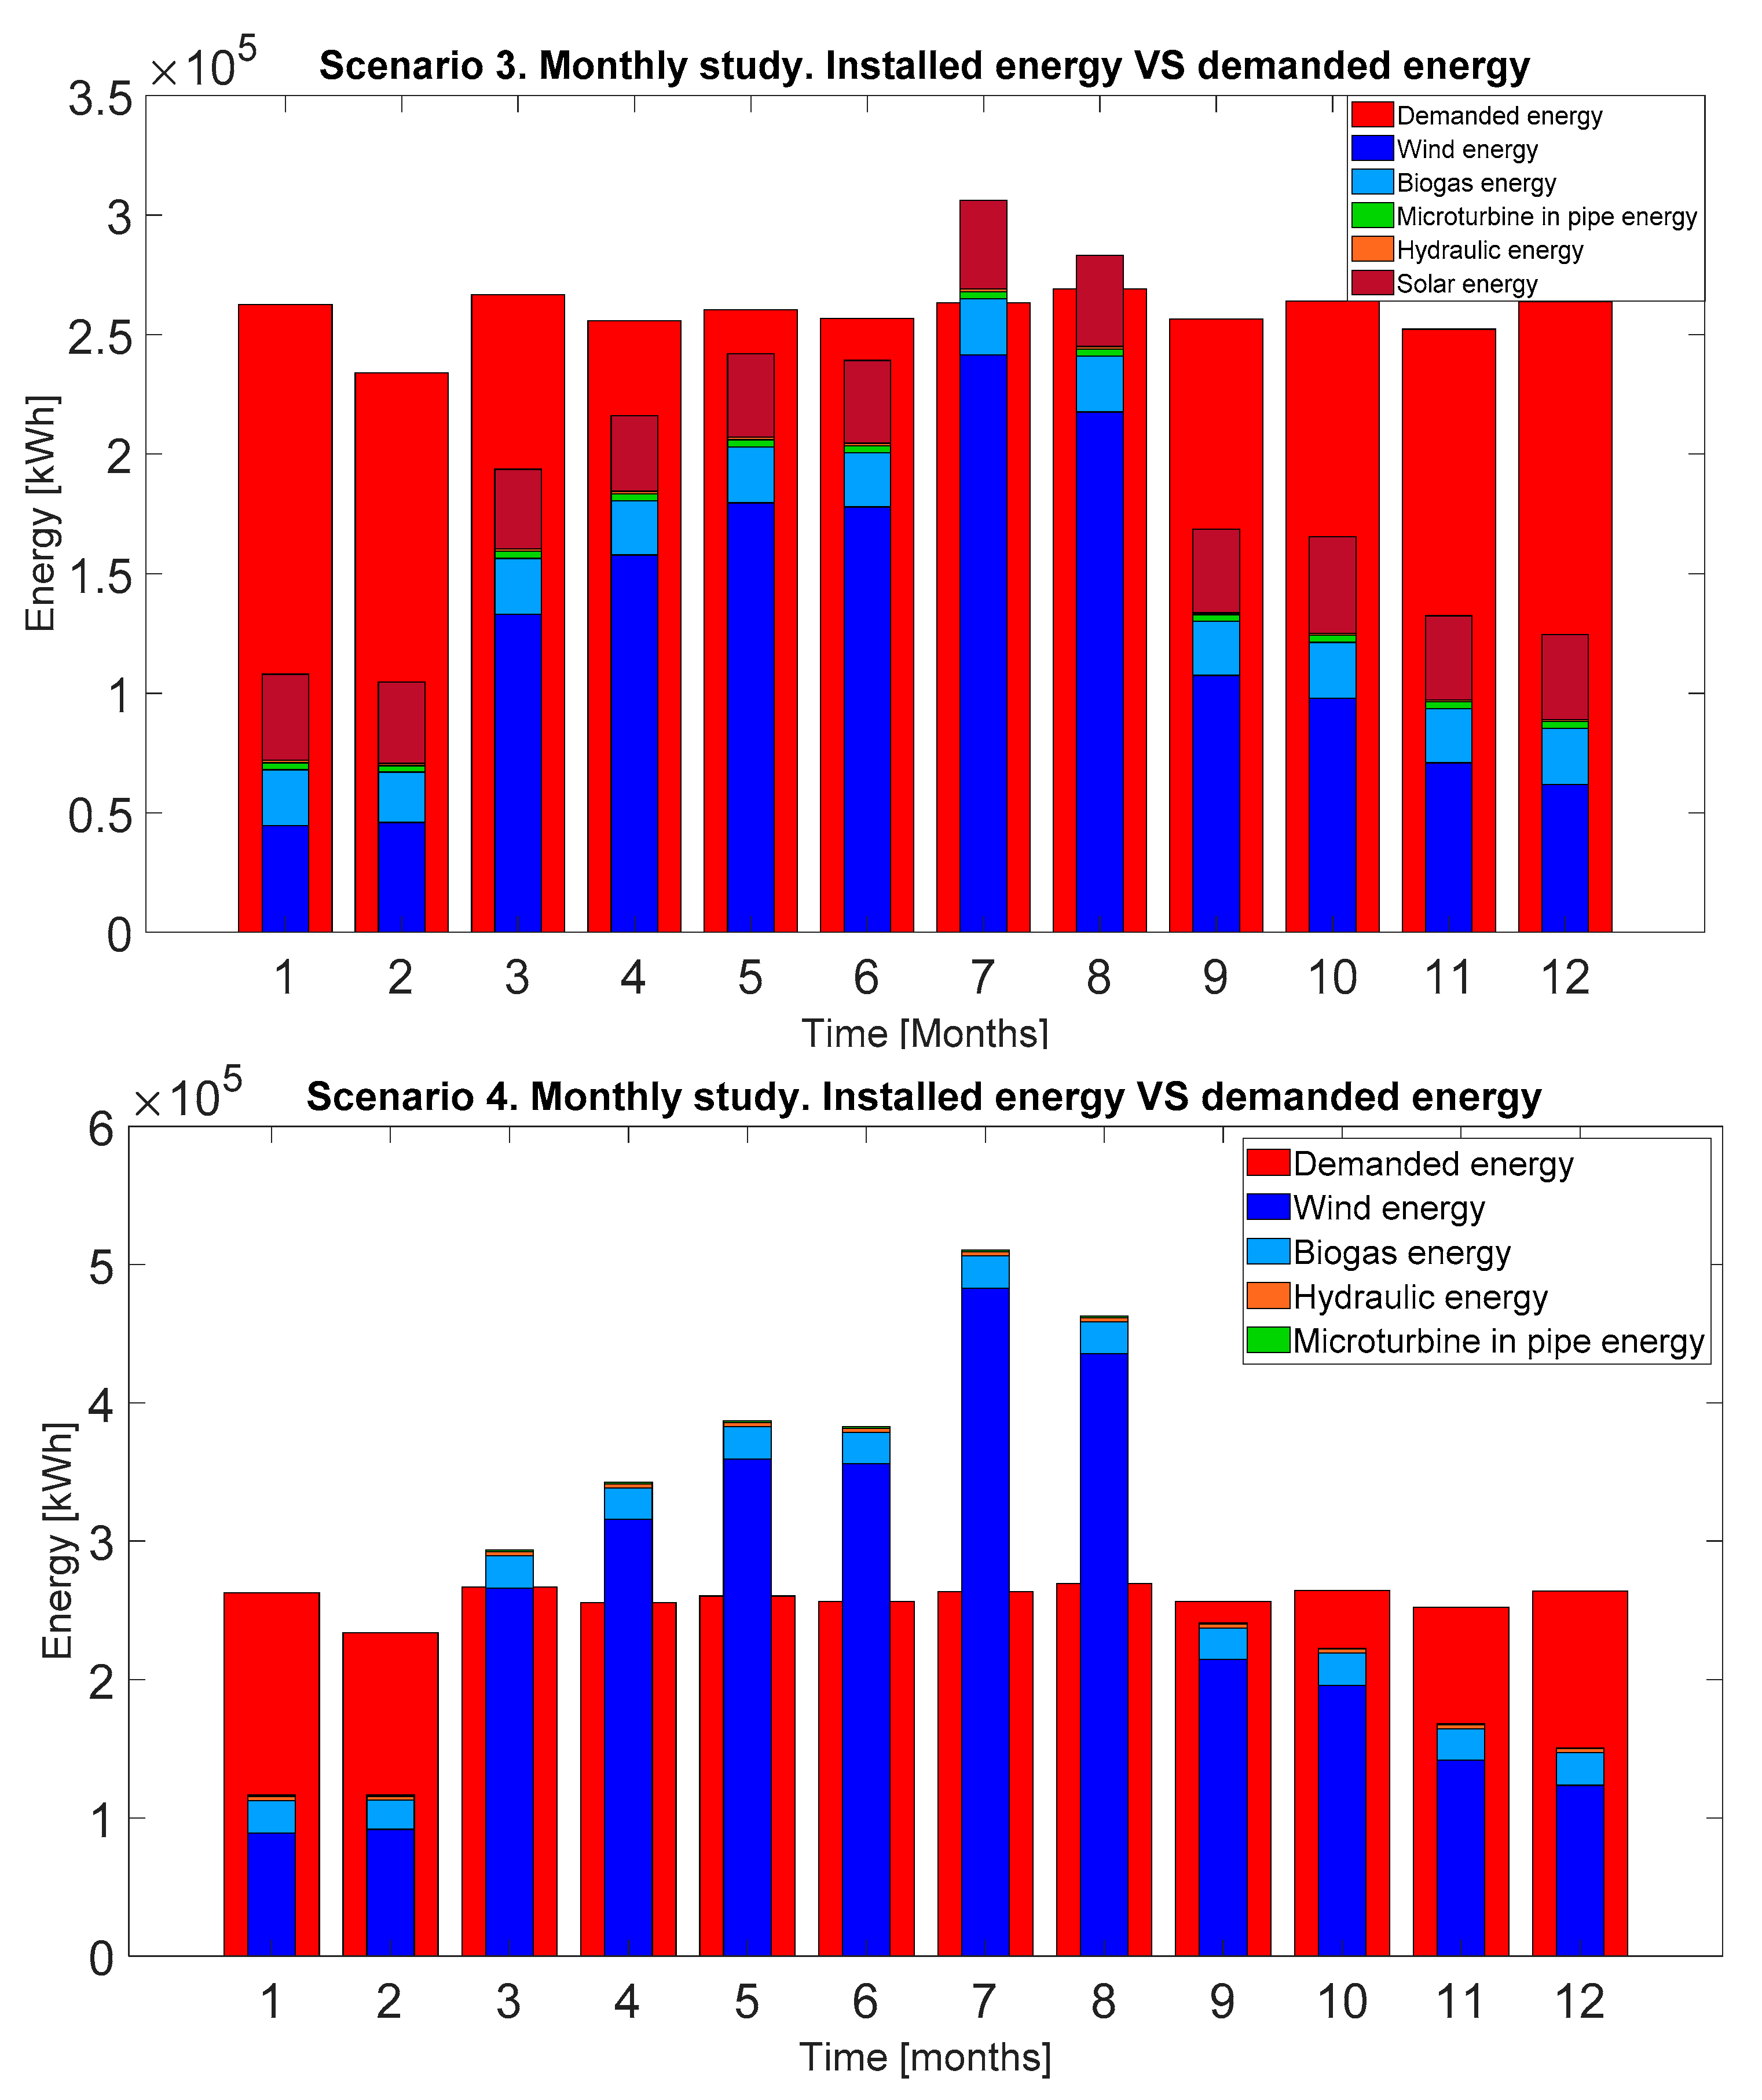
These fluctuations can be more easily seen in a monthly analysis, where it also possible to see the influence of the seasons on renewable energy. When comparing the two most extreme months (January and July) from Scenarios 3 and 4, it can be seen how the installed power generally fails to match demand in January, whereas, in July, it is not uncommon for installed power to be twice or even three times as high as the plant’s power demand (Figure 4).
Related to climate change mitigation, and using the emission factor of 0.811 kg CO2 equivalent/kWhe, as published by the Spanish Institute for the Diversification and Saving of Energy [60], the plant energy consumptions is equivalent to an emission of 2397.60 tons of CO2 equivalent. In this sense, each simulated scenario potentially decreases the conventional electricity consumption and the consequent reduction of atmospheric emissions, as follows:
- Scenario 1 gave a net alternative energy production of 1,859,333 kWh per year, which would avoid the emission of 1,508 tons of CO2 equivalent, reducing the emission value to 889 tons of CO2 per year from a conventional consumption of 1,096,980 kWh/year.
- Scenario 2 gave an annual energy production of 2,072,262 kWh, which would avoid the emission of 1681 tons of CO2 equivalent, with the emission into the atmosphere of a total of 716 tons per year after reducing the conventional energy demand of the plant by 70%.
- Scenario 3 avoided the emission of 1853 tons of greenhouse gases through the production of 2,285,190.6 kWh/year, which is very close to the demand needs of the plant. This scenario reduces the annual emission rate to 544 tons of CO2 being produced by the conventional consumption of 671,123 kWh.
- Scenario 4 confirmed the technical possibility of a 100% power consumption reduction, thereby avoiding the annual emission of 2754 tons of greenhouse gases with a production of 3,396,326.39 kWh/year.
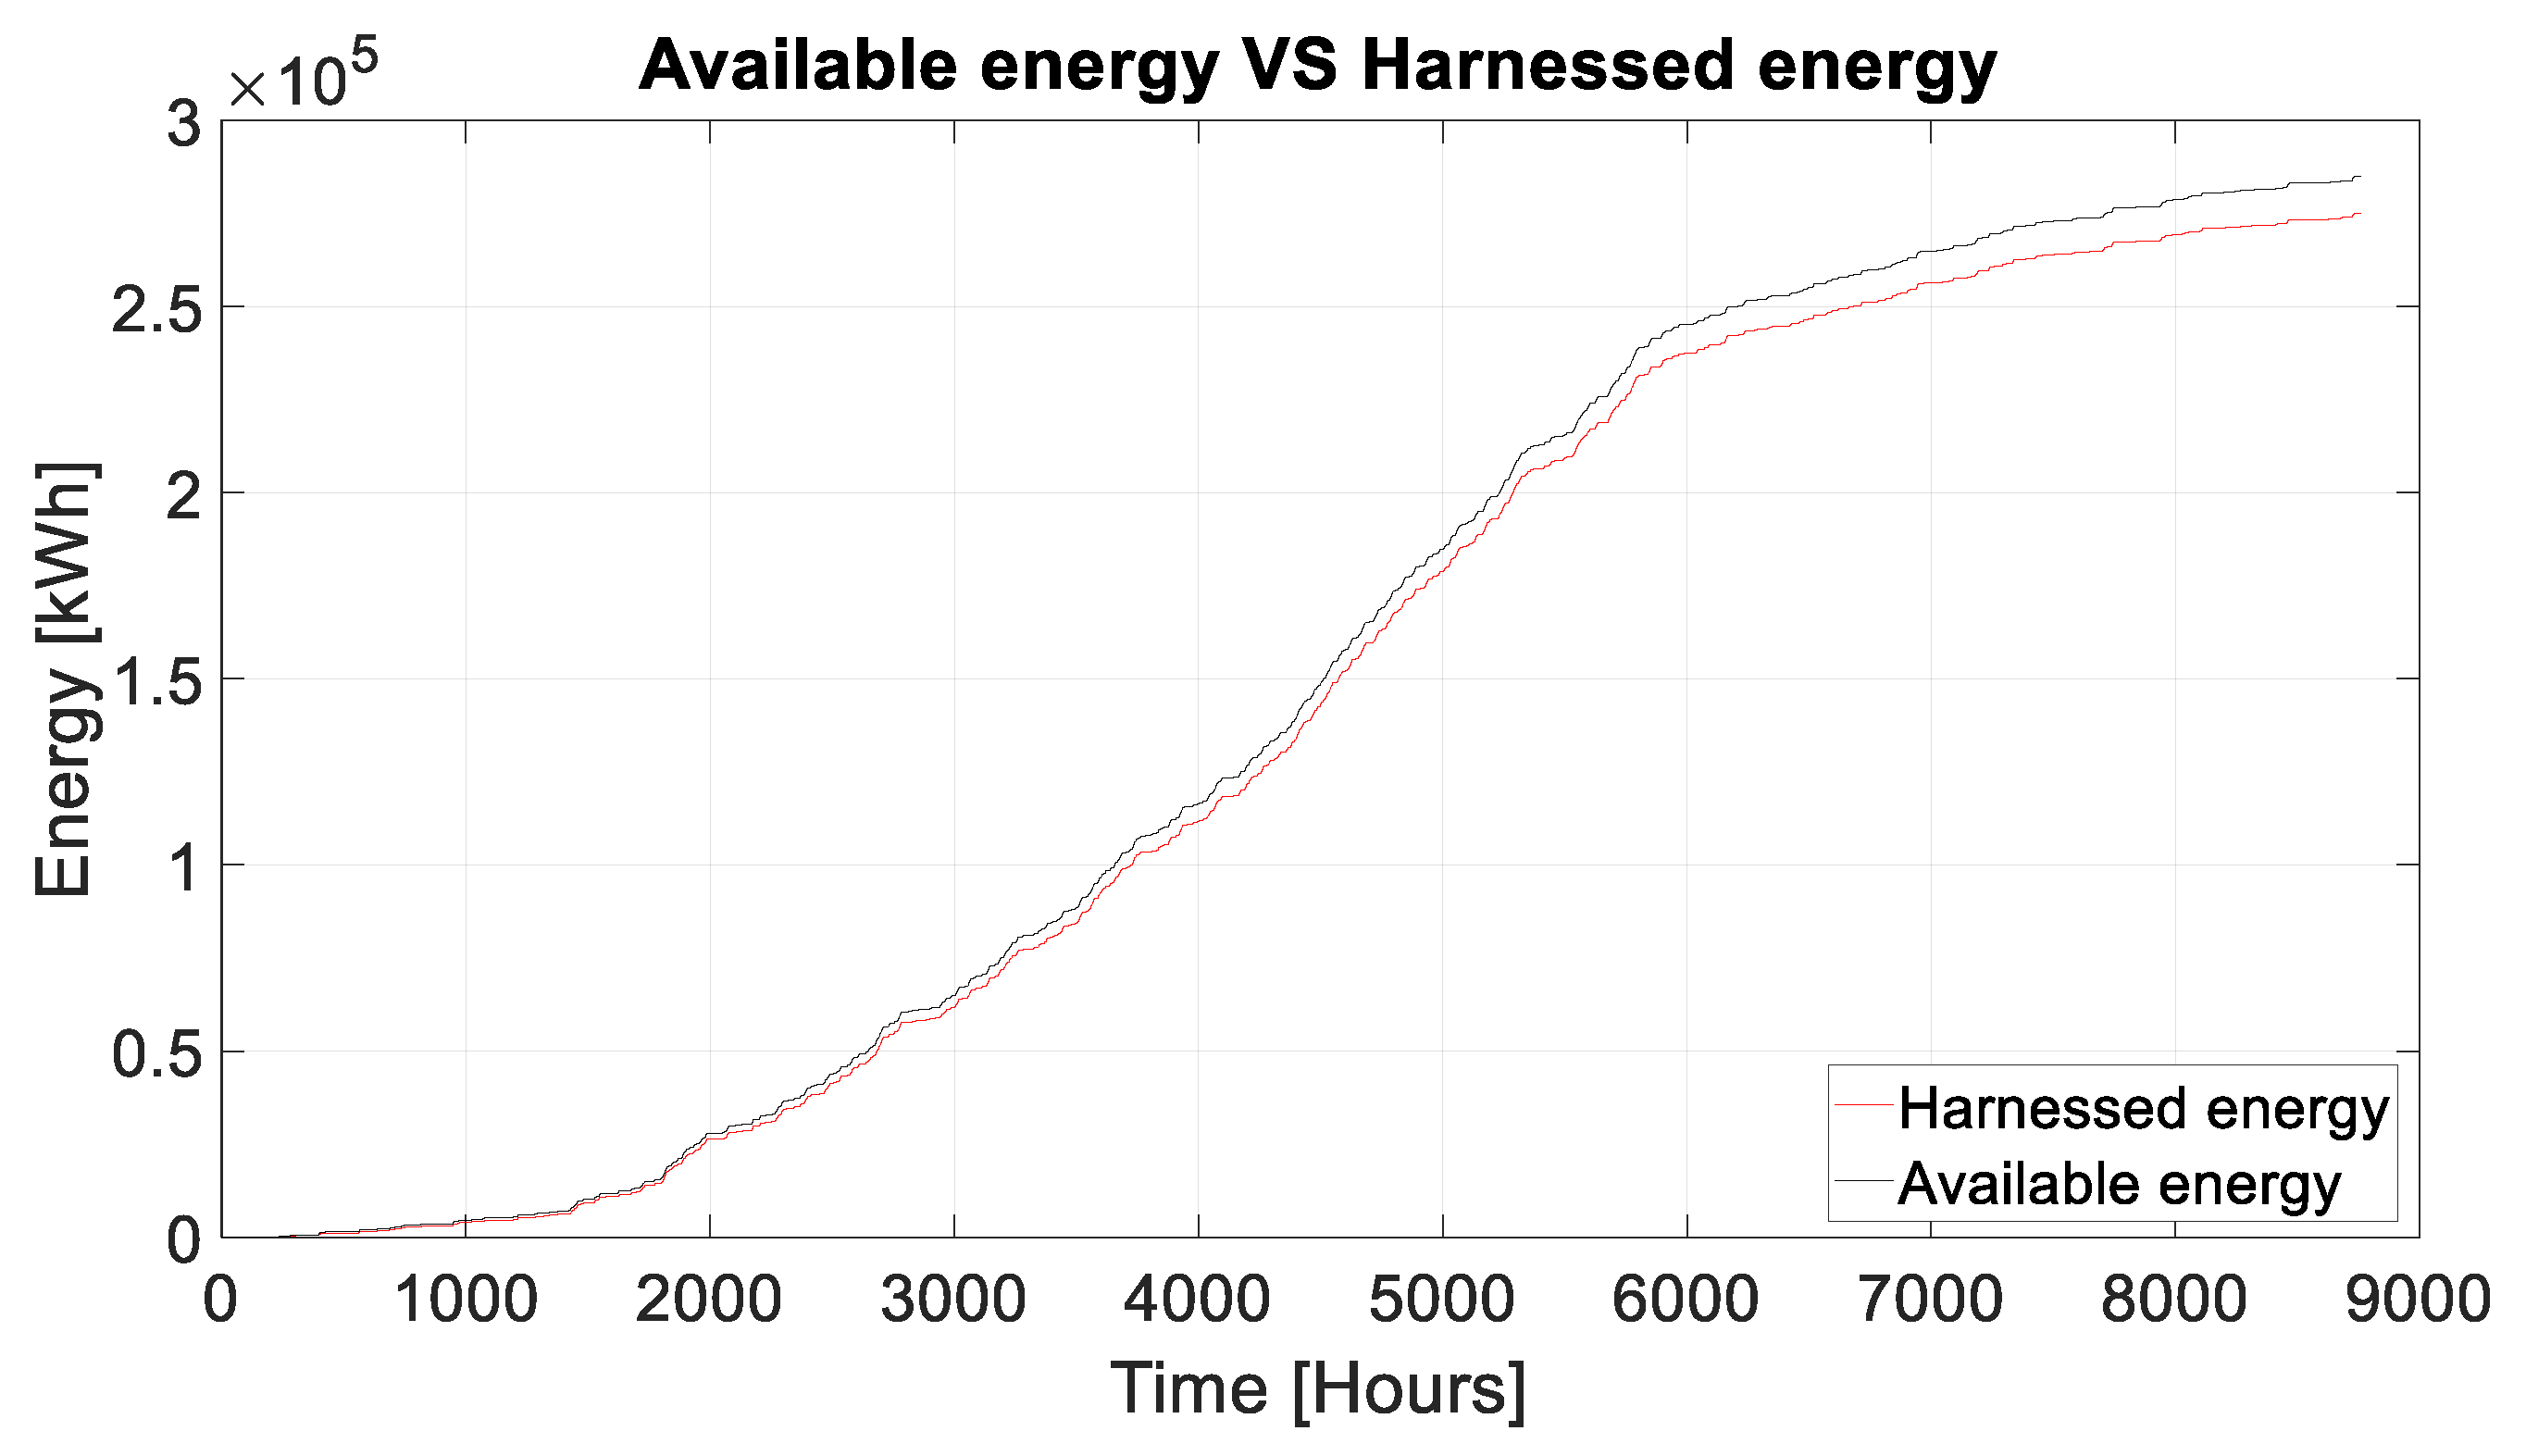
Through an evaluation of a time summation of energy powers and the difference between both vectors (which shows the evolution of possible energy storage), it is confirmed that only Scenario 4 is found to be capable of exceeding the demand, with a turning point at 4000 hours (Figure 5).
This hour marks the beginning of summer, the season of the year that is characterized by high wind resource potential in the area where the plant is installed, due to the influence of the trade winds. This situation is reflected in the energy production base of Scenario 4 (two installed wind turbines).
The following bar chart (Figure 6) shows, in a discrete way, the energy contribution of each of the renewable technologies in Scenarios 3 and 4.
The results confirm the clear influence of wind technology and the possibility of implementing a storage system that takes advantage of the energy surplus of the summer months in order to cover the deficit of the winter months (most pronounced in Scenario 4).
3.4. Management of Energy Surplus
3.4.1. Energy Storage
The peak power output of the renewable mix after subtracting the WWTP demand is known (959 kW on July 3). Two units of fuel cells are incorporated, each with a maximum hydrogen production of 100 Nm³/h and consumption of 530 kW.
Periods of no energy surplus were included in the simulation in order to take into account the decrease in performance when the electrolyzer was not in operation for longer than 48 hours (time it is kept pressurized). After such events, there is a 25% fall in yield in the first hour of production as the volume of hydrogen produced during the first 10–15 min. is discarded due to its low quality.
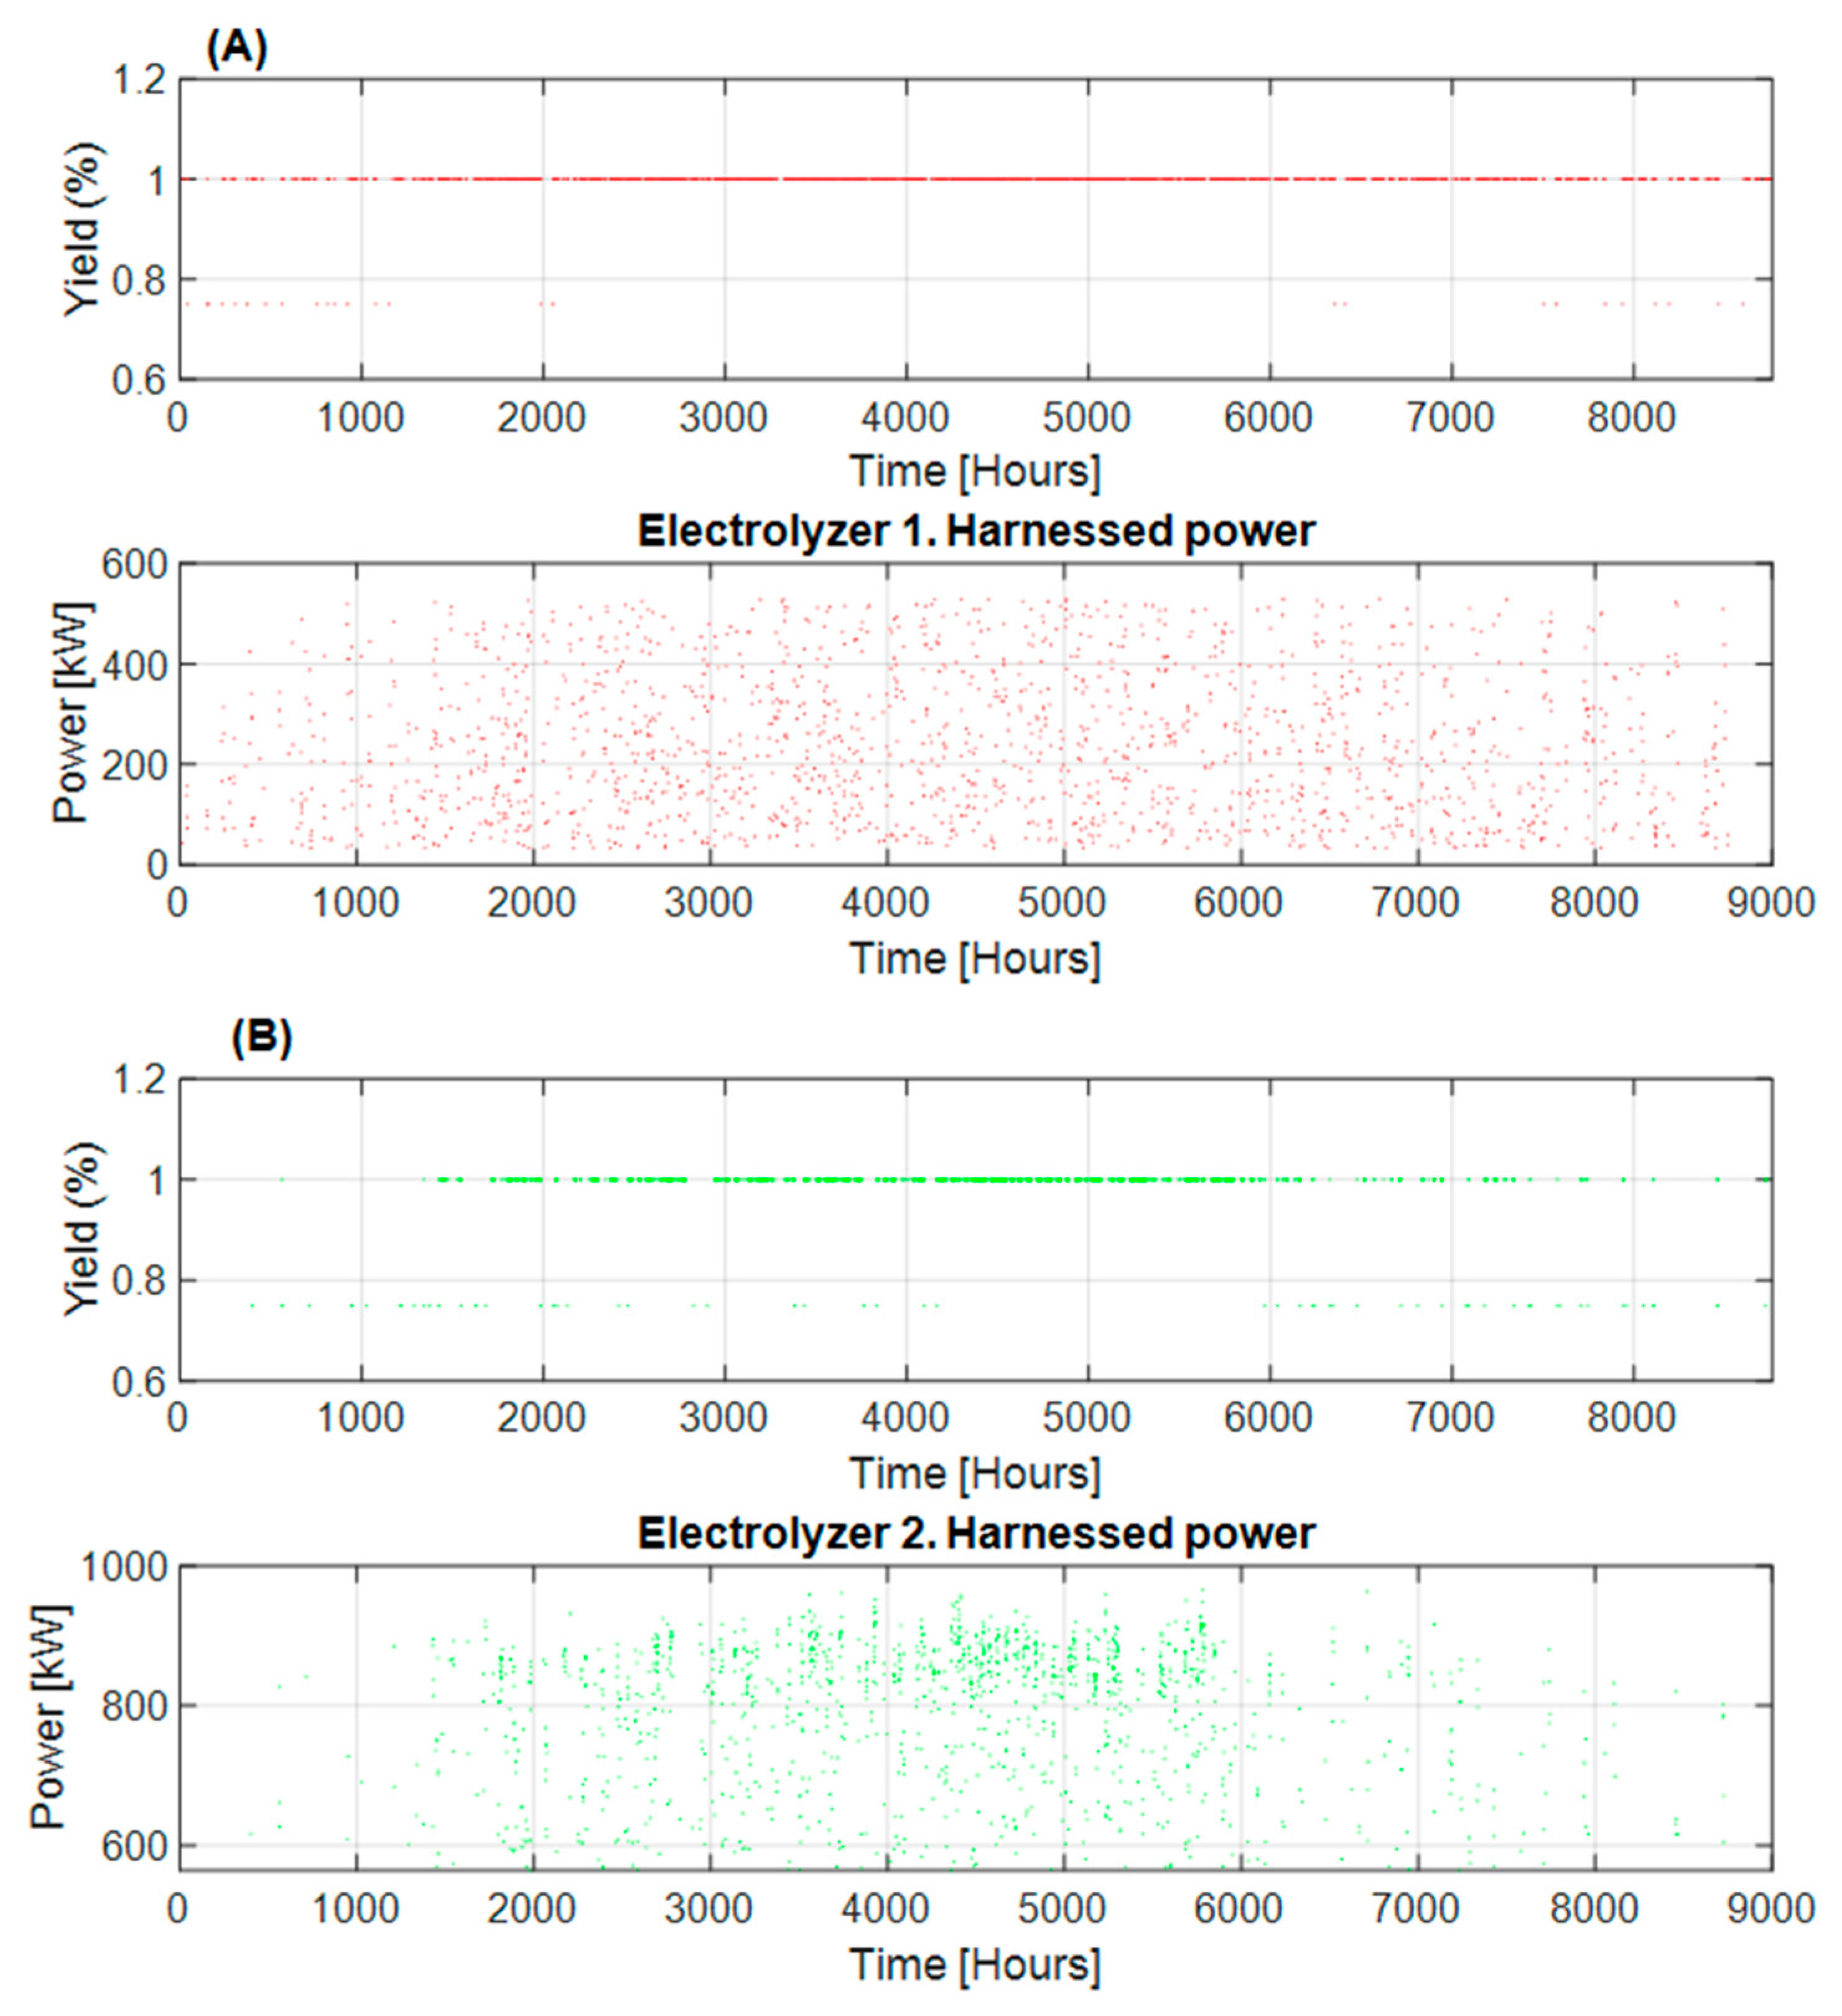
In the event that the useful power is higher than the maximum that can be used by the electrolyzer (530 kW), the second electrolyser starts up as long as 33 kW is available. Figure 7 confirms that almost all of the available energy is used and transformed into hydrogen through this system. Each year 48 racks of 12 bottles of hydrogen pressurized to 200 bar are filled.
Figure 8 similarly shows the behavior of the two electrolyzers. The first electrolyser works at a much more constant rate than the second, in addition to which it usually operates at 100% efficiency. In contrast, the second electrolyzer has many more operating points at 75% efficiency.
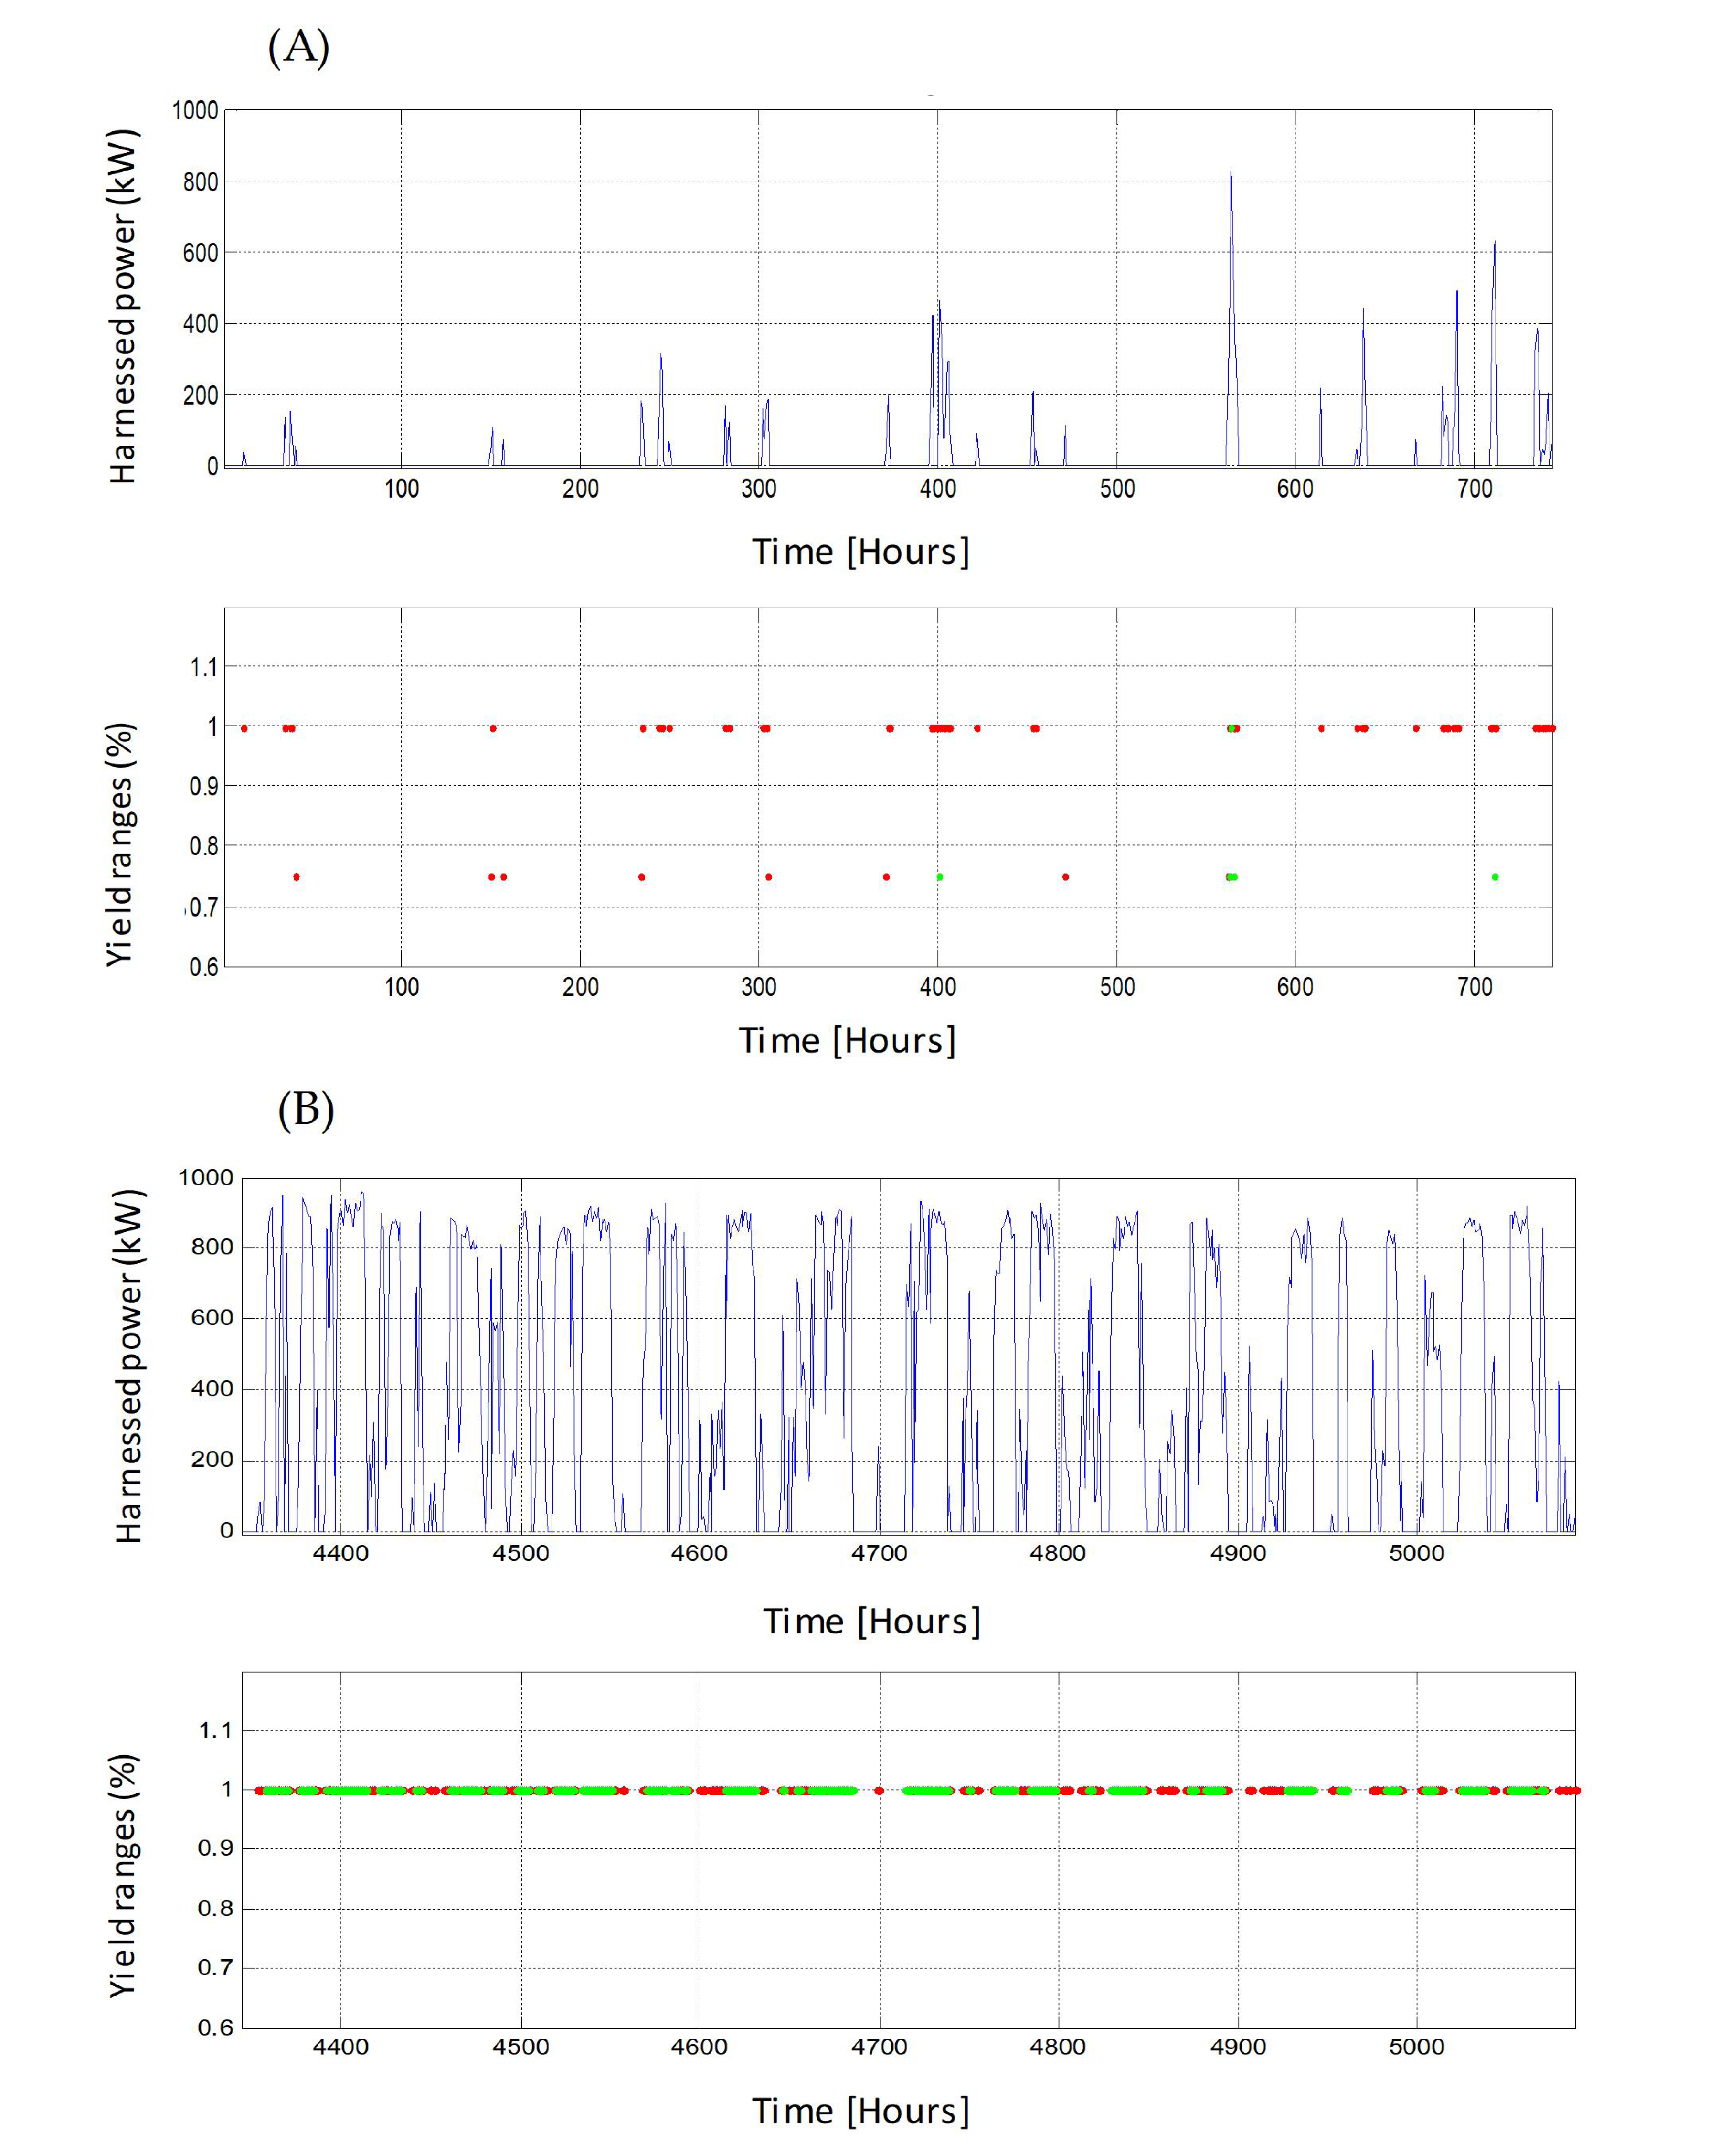
Figure 9 shows the months of January and July in order to compare seasonal behavior. The activity and efficiency are considerably lower in January than in July when the impact of the trade winds in the Canary archipelago is considerable.
Finally, hydrogen storage is introduced in the fuel cell to produce electricity. The highest energy deficit value that needs to be covered arise 406 kW (December), so the fuel cell size must be able to operate between a range of 10–400 kW. The large-scale technology that is required remains mostly at the research stage, with the conversion factors of hydrogen to electricity still far from optimal (average yield just over 40%), attaining a total of 177,205 kWh of final useful energy when the annual energy surplus is 443,013 kWh. In addition, the high cost of fuel cells that operate in this order of energy magnitude underlines the need for further research on this question and the creation of new lines of research.
3.4.2. Network Reinjection
Given the high costs of the storage system, it was decided to include an analysis of the sale of the energy surplus to the network. Because the wind turbine is not directly connected to the grid, a converter is required in order to rectify the signal and set the output voltage to 690 volts (from the 440 volts output of the wind turbine) with a frequency of 50 Hz. Subsequently, a transformer needs to be installed to raise the voltage from 690 volts to 20 kV (grid voltage). Although these conversions can cause a small loss of power, the performance of the equipment does not drop below 98%, even when at 50% load, and was therefore not taken into account when calculating the energy surplus that was sold to the grid.
3.5. Economic Feasibility Analysis
An economic feasibility study was carried out with budgets and operation and maintenance costs of each sized technology (Table 3). The data come from the budgets that were obtained through catalog or consultations with the respective manufacturers.
The cost per unit of electricity generation was calculated using the energy efficiency of each technology. The economic balance took the total energy production of the technological configuration of each scenario into account (Table 4).
The results are quite competitive with respect to the conventional energy cost (average price of the daily market in the Spanish area: 0.06 €/kWh) [60]. However, it should be noted that the generation costs that are shown in Table 3 do not take into account costs related to the transformation of biogas into hydrogen as insufficient data are available to identify this transformation. Hence, a small uncertainty is assumed that will increase the values obtained. Assuming an inflation rate of 0.8%, a discount rate of 5% and an increase in the price of energy of 1.7%, Scenarios 1–3 are amortized in 6–7 years and Scenario 4 in 7–8 years (due to the installation of two wind turbines).
In terms of energy surplus use, scenario 4 incorporates the equipment that is required for the treatment of this surplus in both applications (storage with hydrogen and reinjection to the grid). Table 5 summarizes the respective costs.
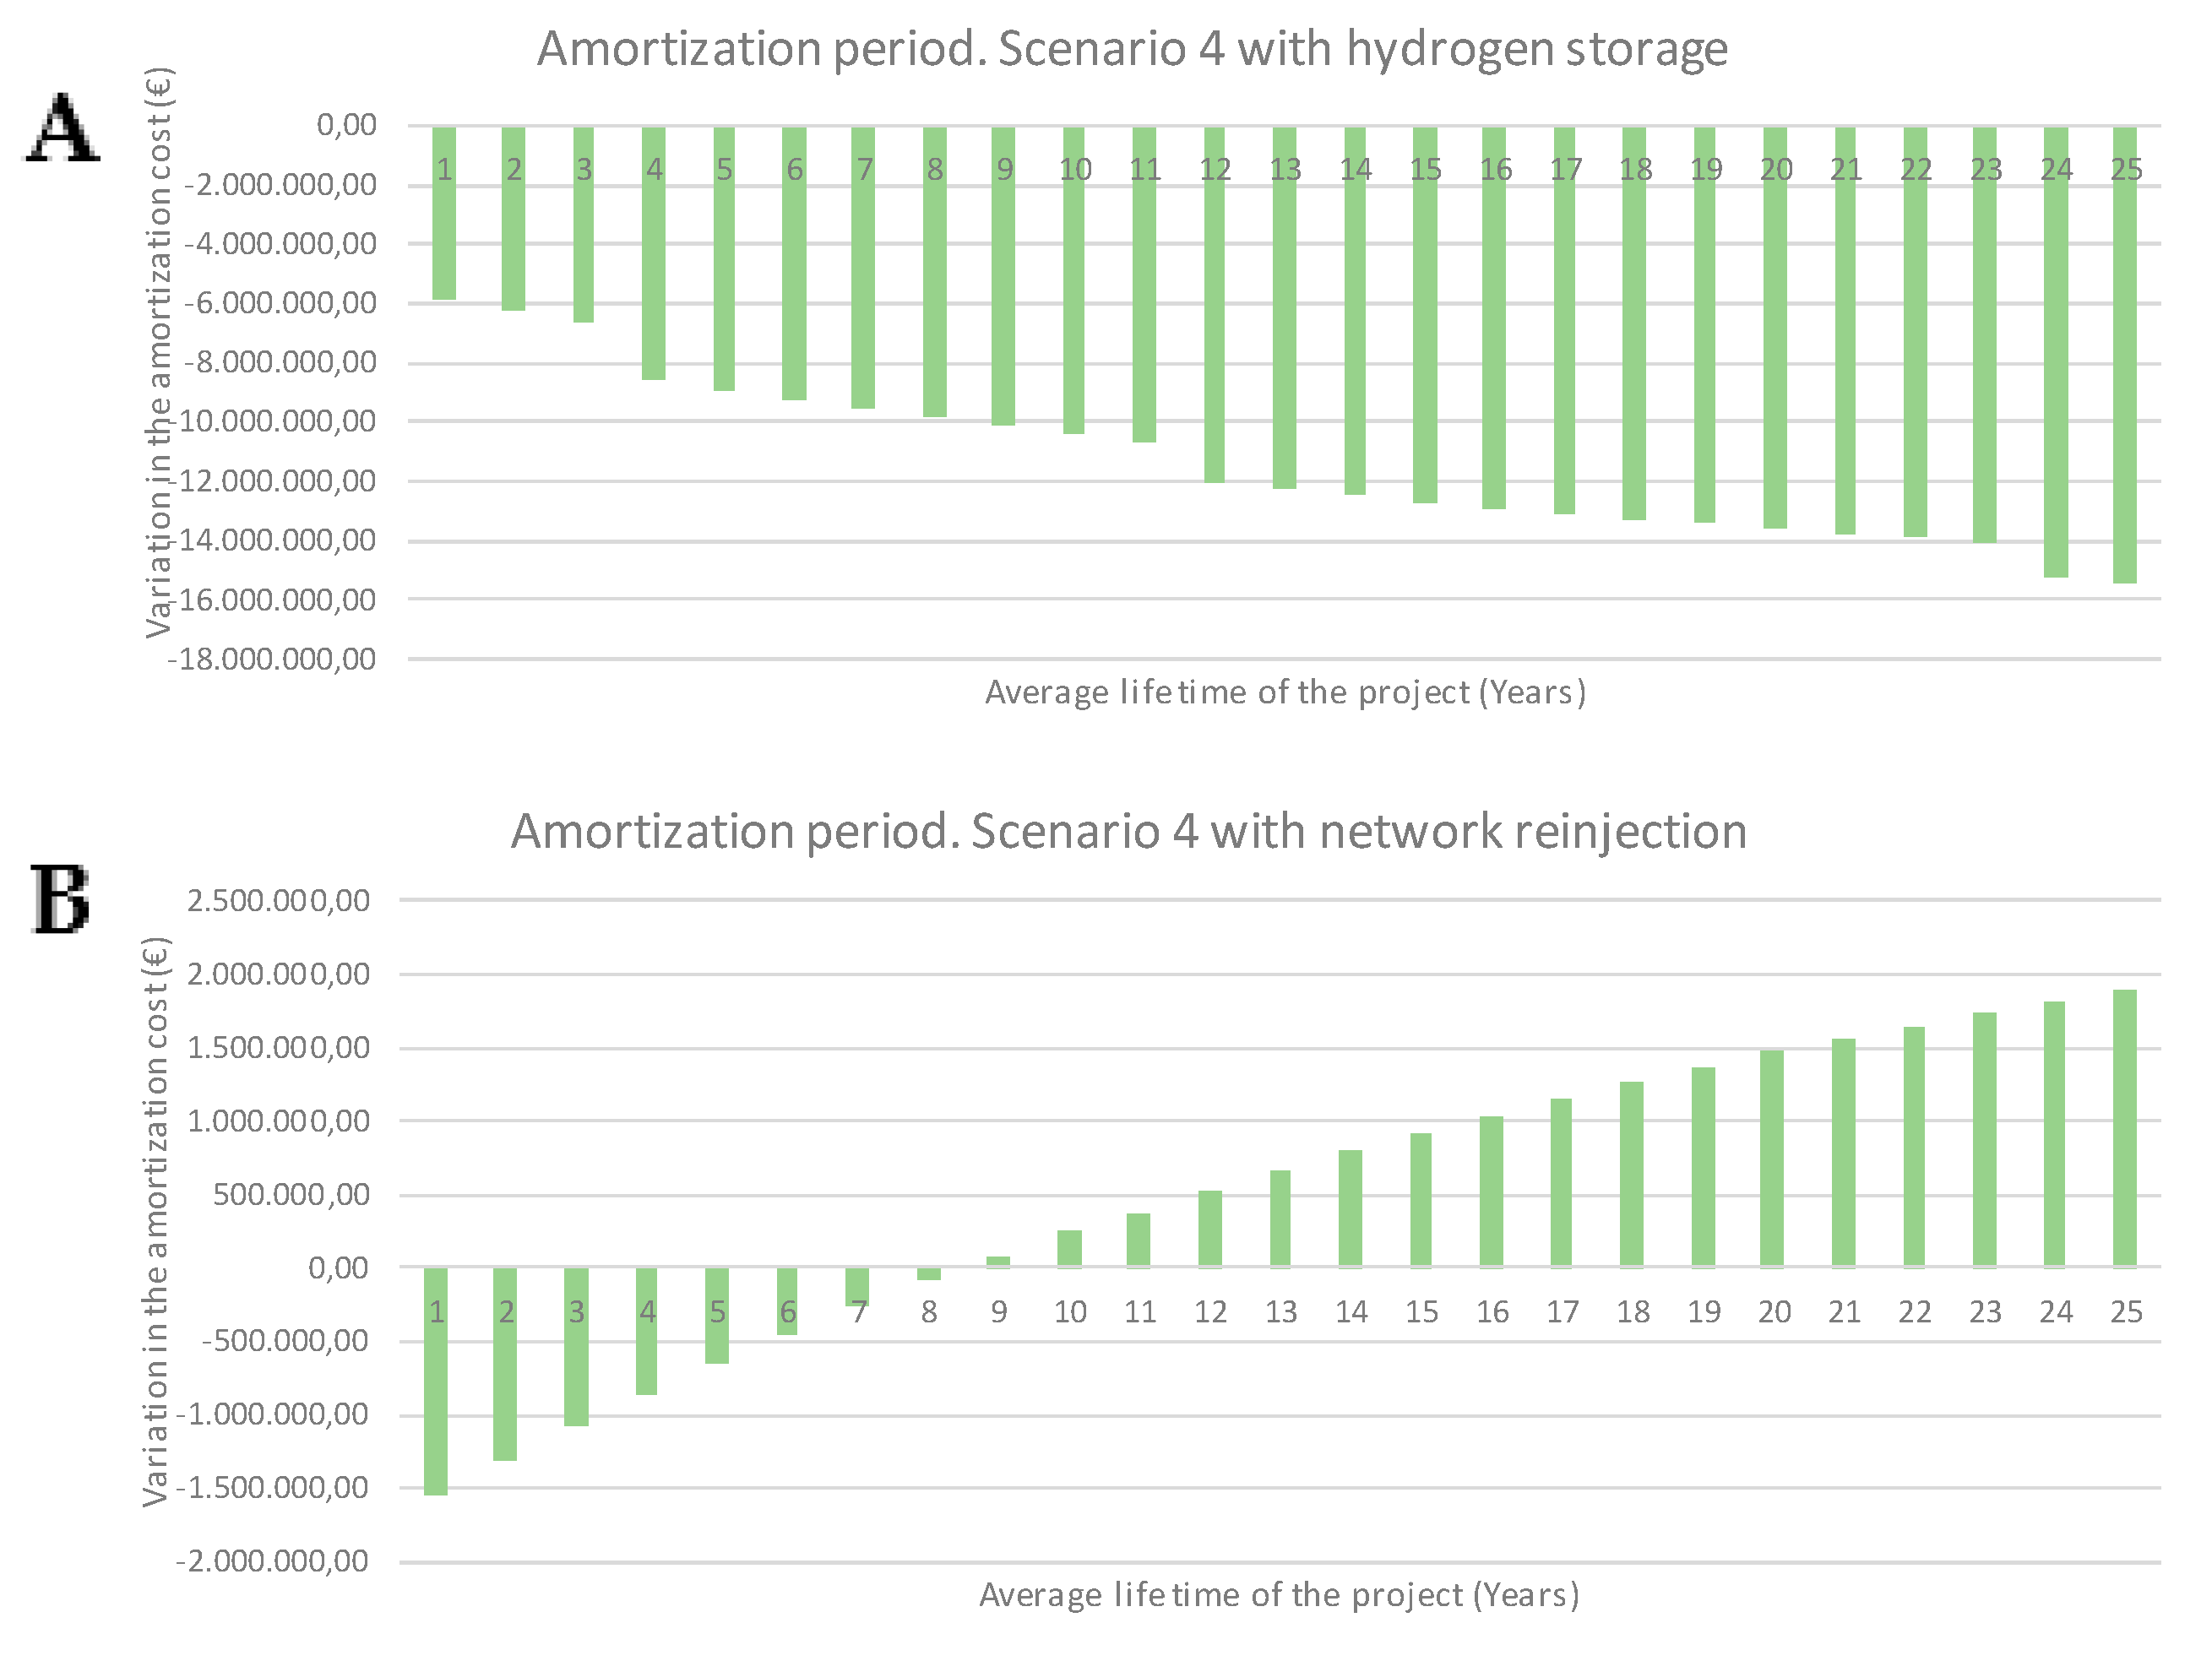
In the case of Application 2 (network reinjection), the income from the sale of the surplus in the electricity market also needs to be taken into account. For this, an average daily market price in the Spanish zone was determined while using the price report that was prepared by the Nominated Electricity Market Operator, amounting to € 54.24/MWh [61]. In this case, an income mix is made in which the energy surplus sold is stipulated at the free market price and the energy generated and consumed by the plant uses the economic computation that is shown in Table 3. Figure 10 shows the evolution of the amortization period.
The results of storage simulation show that the immediate implementation of the hydrogen economy is not feasible, and advances and improvements are still required in order to find answers to important technological, economic and social challenges. Factors, such as the number of pressurized bottles for hydrogen storage (810), or a total capital investment (€ 5,837,397), which is not amortized over the average lifetime of the plant (25 years), confirm this. However, reinjection into the grid did offer economically viable results. Taking the daily energy market of the Iberian system into account, the total capital investment is amortized after eight/nine years for such an energy trading system, making it a potential starting point when considering the integration of renewable energies in this type of plant.
4. Conclusions
This work confirms the possibility of reducing and even eliminating the emission of greenhouse gases in wastewater treatment plants through the implementation of different renewable energy technologies.
The proposed methodological framework is suitable for any wastewater treatment plant that is located in an area whose potential energy resources have been previously analyzed.
The Jinamar wastewater treatment plant (Canary Islands, Spain), with an energy consumption of 2956 MWh/year, was selected as case study to carry out the simulation of four scenarios with different technological configurations designed to supply its energy demand.
In all simulations, the energy that is generated by the plant itself (anaerobic digestion and in-pipe microturbines) took priority. Although greater energy potential is obtained with external renewables, they are characterized by permanent energy fluctuations as opposed to the internal technologies which provide a constant flow of energy and a greater degree of control. Likewise, the waste that is generated by the plant could be given a second use, thereby contributing to the circular economy of the environment.
Of the four simulated scenarios, scenario 4 confirmed the technical and economic feasibility of a 100% conventional power consumption reduction, thereby avoiding the annual emission of 2754 tons of greenhouse gases while still producing 3,396,326.39 kWh/year. This possibility is mainly due to the consolidated use of wind technology, as the islands are characterized by very windy months in summer. The amortization of the total capital investment of € 1,343,750 would take place in the middle of the seventh year of operation.
In addition, due to the seasonality and variability of renewable resources, it was found that an energy storage system needed to be installed. In order to be as environmentally friendly as possible throughout the entire process, the chosen system involved hydrogen and fuel cells. However, the results show that such a system is still not technically or economically viable, which leaves the sale of surplus energy as the starting point when considering the economic feasibility of integrating renewable energies in WWTPs.
Author Contributions
Conceptualization, B.D.R.-G., N.M.-M., and S.P.-B.; methodology, B.D.R.-G. and S.P.-B.; software, B.D.R.-G. and. A.R.-M.; validation, B.D.R.-G. and S.P.-B.; formal analysis, B.R.G., N.M.-M. and A.R.-M.; investigation, B.D.R.-G. and. A.R.-M.; resources, B.D.R.-G.; data curation, B.R.G., N.M.-M. and A.R.-M.; writing—original draft preparation, B.D.R.-G.; writing—review and editing, B.R.G., N.M.-M. and A.R.-M.; visualization, B.D.R.-G.; supervision, S.P.-B.; project administration, S.P.-B. All authors have read and agreed to the published version of the manuscript.
Funding
This research has been co-funded by ERDF funds, INTERREG MAC 2014-2020 program, MITIMAC project (MAC2/1.1a/263).
Acknowledgments
The authors would like to acknowledge all the facilities provided by the Institute of Environmental Studies and Natural Resources of the University of Las Palmas de Gran Canaria (IUNAT-ULPGC).
Conflicts of Interest
The authors declare that there is no conflict of interests regarding the publication of this paper. The funders had no role in the design of the study; in the collection, analyses, or interpretation of data; in the writing of the manuscript, or in the decision to publish the results.
References
- Hamiche, A.M.; Stambouli, A.B.; Flazi, S. A review of the water-energy nexus. Renew. Sustain. Energy Rev. 2016, 65, 319–331. [Google Scholar] [CrossRef]
- Hardy, A.L.; Garrido, L.J.S. Análisis y Evaluación de Las Relaciones Entre El Agua y La Energía En España; Fundación Marcelino Botín: Santander, Spain, 2010. [Google Scholar]
- Siddiqi, A.; Anadon, L.D. The water–energy nexus in Middle East and North Africa. Energy Policy 2011, 39, 4529–4540. [Google Scholar] [CrossRef]
- Liu, Y.; Hejazi, M.; Kyle, P.; Kim, S.H.; Davies, E.; Miralles, D.G.; Teuling, A.J.; He, Y.; Niyogi, D. Global and Regional Evaluation of Energy for Water. Environ. Sci. Technol. 2016, 50, 9736–9745. [Google Scholar] [CrossRef] [PubMed]
- World Energy Outlook 2016; Paris. 2016. Available online: https://www.iea.org/reports/world-energy-outlook-2016 (accessed on 23 June 2020).
- World Energy Outlook 2012; Paris. 2012. Available online: https://www.iea.org/reports/world-energy-outlook-2012 (accessed on 25 June 2020).
- Spang, E.S.; Moomaw, W.R.; Gallagher, K.S.; Kirshen, P.H.; Marks, D.H. The water consumption of energy production: An international comparison. Environ. Res. Lett. 2014, 9, 105002. [Google Scholar] [CrossRef]
- Gleick, P.H. Water and Energy. Annu. Rev. Energy Environ. 1994, 19, 267–299. [Google Scholar] [CrossRef]
- Stang, S.; Wang, H.; Gardner, K.H.; Mo, W. Influences of water quality and climate on the water-energy nexus: A spatial comparison of two water systems. J. Environ. Manag. 2018, 218, 613–621. [Google Scholar] [CrossRef]
- Tan, C.; Zhi, Q. The Energy-water Nexus: A literature Review of the Dependence of Energy on Water. Energy Procedia 2016, 88, 277–284. [Google Scholar] [CrossRef] [Green Version]
- Sixt, G.N.; Strambo, C.; Zhang, J.; Chow, N.; Liu, J.; Han, G. Assessing the Level of Inter-Sectoral Policy Integration for Governance in the Water–Energy Nexus: A Comparative Study of Los Angeles and Beijing. Sustainability 2020, 12, 7220. [Google Scholar] [CrossRef]
- Council of the European Union. Paris Agreement on Climate Change. European Council Conclusions on Climate Neutrality. Available online: https://www.consilium.europa.eu/en/policies/climate-change/paris-agreement/ (accessed on 29 October 2020).
- United States Environmental Protection Agency. Reducing Operating Costs and Energy Consumption at Water Utilities Report. Available online: https://www.epa.gov/sustainable-water-infrastructure/reducing-operating-costs-and-energy-consumption-water-utilities (accessed on 29 October 2020).
- Guilera, J.; Andreu, T.; Basset, N.; Boeltken, T.; Timm, F.; Mallol, I.; Morante, J.R. Synthetic natural gas production from biogas in a waste water treatment plant. Renew. Energy 2020, 146, 1301–1308. [Google Scholar] [CrossRef]
- Bhatia, R.K.; Sakhuja, D.; Mundhe, S.; Walia, A. Renewable Energy Products through Bioremediation of Wastewater. Sustainability 2020, 12, 7501. [Google Scholar] [CrossRef]
- Gu, Y.; Li, Y.; Li, X.; Luo, P.; Wang, H.; Robinson, Z.P.; Wang, X.; Wu, J.; Li, F. The feasibility and challenges of energy self-sufficient wastewater treatment plants. Appl. Energy 2017, 204, 1463–1475. [Google Scholar] [CrossRef]
- Wacławek, S.; Grübel, K.; Silvestri, D.; Padil, V.V.T.; Wacławek, M.; Černík, M.; Varma, R.S. Disintegration of Wastewater Activated Sludge (WAS) for Improved Biogas Production. Energies 2018, 12, 21. [Google Scholar] [CrossRef] [Green Version]
- Maktabifard, M.; Zaborowska, E.; Makinia, J. Achieving energy neutrality in wastewater treatment plants through energy savings and enhancing renewable energy production. Rev. Environ. Sci. Biotechnol. 2018, 17, 655–689. [Google Scholar] [CrossRef] [Green Version]
- Gürtekin, E. Experimental and numerical design of renewable-energy-supported advanced biological wastewater treatment plant. Int. J. Environ. Sci. Technol. 2018, 16, 1183–1192. [Google Scholar] [CrossRef]
- Franzen, S.; Madlener, R. Optimal expansion of a hydrogen storage system for wind power (H2-WESS): A real options analysis. Energy Procedia 2017, 105, 3816–3823. [Google Scholar] [CrossRef]
- Kalinci, Y.; Dincer, I.; Hepbasli, A. Energy and exergy analyses of a hybrid hydrogen energy system: A case study for Bozcaada. Int. J. Hydrogen Energy 2017, 42, 2492–2503. [Google Scholar] [CrossRef]
- Gil, A.; Medrano, M.; Martorell, I.; Lázaro, A.; Dolado, P.; Zalba, B.; Cabeza, L.F. State of the art on high temperature thermal energy storage for power generation. Part 1—Concepts, materials and modellization. Renew. Sustain. Energy Rev. 2010, 14, 31–55. [Google Scholar] [CrossRef]
- Gobierno de Canarias. Anuario Energético de Canarias 2017. Available online: http://energiagrancanaria.com/wp-content/uploads/2019/02/A-energetico-canarias-2017.pdf (accessed on 13 July 2020).
- Gikas, P. Towards energy positive wastewater treatment plants. J. Environ. Manag. 2017, 203, 621–629. [Google Scholar] [CrossRef]
- Vo, P.T.; Ngo, H.H.; Guo, W.; Zhou, J.L.; Nguyen, P.D.; Listowski, A.; Wang, X.C. A mini-review on the impacts of climate change on wastewater reclamation and reuse. Sci. Total Environ. 2014, 9–17. [Google Scholar] [CrossRef]
- Torregrossa, D.; Castellet-Viciano, L.; Hernández-Sancho, F. A data analysis approach to evaluate the impact of the capacity utilization on the energy consumption of wastewater treatment plants. Sustain. Cities Soc. 2019, 45, 307–313. [Google Scholar] [CrossRef]
- Awad, H.; Alalm, M.G.; El-Etriby, H.K. Environmental and cost life cycle assessment of different alternatives for improvement of wastewater treatment plants in developing countries. Sci. Total Environ. 2019, 660, 57–68. [Google Scholar] [CrossRef] [PubMed]
- Helal, A.; Ghoneim, W.; Halaby, A. Feasibility Study for Self-Sustained Wastewater Treatment Plants—Using Biogas CHP Fuel Cell, Micro-Turbine, PV and Wind Turbine Systems. Smart Grid Renew. Energy 2013, 4, 227–235. [Google Scholar] [CrossRef] [Green Version]
- Del Rio-Gamero, B. Mitigación del Cambio Climático en el Ciclo Integral del Agua: Aplicación al Proceso de Tratamiento de Aguas Residuals. Ph.D Thesis, Universidad de Las Palmas de Gran Canaria, Las Palmas, Spain, 2018. Available online: https://accedacris.ulpgc.es/handle/10553/55375 (accessed on 30 October 2020).
- Consejo Insular de Aguas de Gran Canaria. Consumo Energético de La Estación Depuradora de Aguas de Jinamar. 2018. Available online: http://www.aguasgrancanaria.com/ (accessed on 2 April 2020).
- Picardo, A.; Soltero, V.M.; Álvarez, M.E.P.; Chacartegui, R. District heating based on biogas from wastewater treatment plant. Energy 2019, 180, 649–664. [Google Scholar] [CrossRef]
- Kollmann, R.; Neugebauer, G.; Kretschmer, F.; Truger, B.; Kindermann, H.; Stoeglehner, G.; Ertl, U.-P.D.D.T.; Narodoslawsky, M. Renewable energy from wastewater - Practical aspects of integrating a wastewater treatment plant into local energy supply concepts. J. Clean. Prod. 2017, 155, 119–129. [Google Scholar] [CrossRef]
- Guven, H.; Ersahin, M.E.; Dereli, R.K.; Ozgun, H.; Isik, I.; Ozturk, I. Energy recovery potential of anaerobic digestion of excess sludge from high-rate activated sludge systems co-treating municipal wastewater and food waste. Energy 2019, 172, 1027–1036. [Google Scholar] [CrossRef]
- Seiple, T.E.; Coleman, A.M.; Skaggs, R.L. Municipal wastewater sludge as a sustainable bioresource in the United States. J. Environ. Manag. 2017, 197, 673–680. [Google Scholar] [CrossRef]
- Tyagi, V.K.; Lo, S.-L. Sludge: A waste or renewable source for energy and resources recovery? Renew. Sustain. Energy Rev. 2013, 25, 708–728. [Google Scholar] [CrossRef]
- Shilpi, S.; Lamb, D.; Bolan, N.; Seshadri, B.; Choppala, G.; Naidu, R. Waste to watt: Anaerobic digestion of wastewater irrigated biomass for energy and fertiliser production. J. Environ. Manag. 2019, 239, 73–83. [Google Scholar] [CrossRef]
- American Public Health Association; American Water Works Association; Water Pollution Control Federation; Water Environment Federation. Standard Methods for the Examination of Water and Wastewater, 2nd ed.; 1915. Available online: https://trove.nla.gov.au/work/16646325 (accessed on 25 April 2020).
- Metcalf and Eddy; Montsoriu, J.D.D.T. Ingeniería Sanitaria: Tratamineto, Evacuación y Reutilización de Aguas Residuales; Labor: Barcelona, Spain, 1985. [Google Scholar]
- Cabanes, J.L. Digestión Anaerobia de Lodos de Depuradora, Etapas Controlantes y Cinética Del Proceso. Ph.D Thesis, Universidad de Alicante, Alicante, Spain, June 1989. [Google Scholar]
- Martínez, M.; Santianes, M.; Crespí, S.; Jimenez, J. Utilización de Biogás En Pilas de Combustible; Madrid. 2008. Available online: http://kimerius.com/app/download/5781446527/Utilizaci%C3%B3n+del+biog%C3%A1s+en+pilas+de+combustible.pdf (accessed on 14 May 2020).
- Ferreira-Aparicio, P.; Benito, M.J.; Sanz, J.L. New Trends in Reforming Technologies: From Hydrogen Industrial Plants to Multifuel Microreformers. Catal. Rev. 2005, 47, 491–588. [Google Scholar] [CrossRef]
- Monteith, H.; Bagley, M.D.; MacLean, M.H.; Kalogo, Y. An Assessment Tool for Managing Cost-Effective Energy Recovery from Anaerobically Digested Wastewater Solids; Alexandria, 2006. Available online: http://assets.matchbin.com/sites/274/assets/IQMT_DigesterGasUse.pdf (accessed on 14 May 2020).
- Santos, J.C.; Cruz, P.; Regala, T.; Magalhães, F.D.; Mendes, A. High-Purity Oxygen Production by Pressure Swing Adsorption. Ind. Eng. Chem. Res. 2007, 46, 591–599. [Google Scholar] [CrossRef]
- Silva, B.; Solomon, I.; Ribeiro, A.M.; Lee, U.-H.; Hwang, Y.K.; Chang, J.-S.; Loureiro, J.M.; Rodrigues, A.E. H2 purification by pressure swing adsorption using CuBTC. Sep. Purif. Technol. 2013, 118, 744–756. [Google Scholar] [CrossRef]
- Forget, A. Manual Para Ayudar La Comprensión Del Diseño de Microaerogeneradores; Lima. 2011. Available online: http://www.astridforget.com/wp-content/uploads/2014/09/Manual-t%C3%A9cnico-AF-eolico-VF-110617.pdf (accessed on 17 May 2020).
- Vargas, F.E.S.; Alarcón, A.F.S.; Fajardo, C.A.G. Pequeñas y microcentrales hidroeléctricas: Alternativa real de generación eléctrica. Informador Técnico 2011, 75, 73–85. [Google Scholar] [CrossRef] [Green Version]
- HOMER. Hybrid Optimization of Multiple Energy Resources. Available online: http://analysis.nrel.gov/homer/ (accessed on 15 June 2018).
- Dierauf, T.; Growitz, A.; Kurtz, S.; Cruz, J.L.B.; Riley, E.; Hansen, C. Weather-Corrected Performance Ratio; National Renewable Energy Laboratory: Golden, CO, USA, 2013; pp. 1–16. [CrossRef] [Green Version]
- Gobierno de Canarias. Visor Grafcan. Sistema de información territorial de Canarias. Available online: https://visor.grafcan.es/visorweb/ (accessed on 22 March 2019).
- Arnés González, C. Estudio del Potencial Eólico Para Generación Eléctrica en el Itsmo de Tehuantepec, Oaxaca, México, Escuela Técnica de Ingenieros Industriales y Telecomunicación. México. 2014. Available online: http://academica-e.unavarra.es/bitstream/handle/2454/11924/Arnes_Gonzalez_Carlos.pdf?sequence=1 (accessed on 24 May 2020).
- Guerrero-Lemus, R.; González-Díaz, B.; Ríos, G.; Dib, R.N. Study of the new Spanish legislation applied to an insular system that has achieved grid parity on PV and wind energy. Renew. Sustain. Energy Rev. 2015, 49, 426–436. [Google Scholar] [CrossRef]
- Consejería de Industria, Comercio y Nuevas Tecnologías. Decreto 32/2006, de 27 de Marzo, Por El Que Se Regula La Instalación y Explotación de Los Parques Eólicos En El Ámbito de La Comunidad Autónoma de Canarias. Available online: http://www.gobiernodecanarias.org/boc/2006/061/002.html (accessed on 1 June 2020).
- Mathworks. Global Optimization Toolbox: User’s Guide (R2018b). 2018. Available online: https://es.mathworks.com/products/global-optimization.html (accessed on 22 May 2020).
- Kim, J.; Choi, H.; Kim, S.; Yu, J. Feasibility analysis of introducing renewable energy systems in environmental basic facilities: A case study in Busan, South Korea. Energy 2018, 150, 702–708. [Google Scholar] [CrossRef]
- Nguyen, H.T.; Safder, U.; Nguyen, X.N.; Yoo, C. Multi-objective decision-making and optimal sizing of a hybrid renewable energy system to meet the dynamic energy demands of a wastewater treatment plant. Energy 2020, 191, 116570. [Google Scholar] [CrossRef]
- Ayodele, T.; Ogunjuyigbe, A. Mitigation of wind power intermittency: Storage technology approach. Renew. Sustain. Energy Rev. 2015, 44, 447–456. [Google Scholar] [CrossRef]
- Khosravi, A.; Koury, R.; Machado, L.; Pabon, J. Energy, exergy and economic analysis of a hybrid renewable energy with hydrogen storage system. Energy 2018, 148, 1087–1102. [Google Scholar] [CrossRef]
- Bhogilla, S.S.; Ito, H.; Segawa, T.; Kato, A.; Nakano, A. Experimental study on laboratory scale Totalized Hydrogen Energy Utilization System using wind power data. Int. J. Hydrogen Energy 2017, 42, 13827–13838. [Google Scholar] [CrossRef]
- Loisel, R.; Baranger, L.; Chemouri, N.; Spinu, S.; Pardo, S. Economic evaluation of hybrid off-shore wind power and hydrogen storage system. Int. J. Hydrogen Energy 2015, 40, 6727–6739. [Google Scholar] [CrossRef]
- de España, G. Factores de Emisión de CO2 y Coeficientes de Paso a Energía Primaria de Diferentes Fuentes de Energía Final Consumidas En El Sector Edificios En España; Madrid. 2014. Available online: https://energia.gob.es/desarrollo/EficienciaEnergetica/RITE/Reconocidos/Reconocidos/Otros%20documentos/Factores_emision_CO2.pdf (accessed on 22 June 2020).
- OMIE. Price Report. 2018. Available online: https://www.omie.es/sites/default/files/publications/omie_informe_precios_2018.pdf (accessed on 20 August 2020).
Figure 1.
Energy production system using the sewage sludge.
Figure 2.
Selected turbines and sketch of the installation.

Figure 3.
Simulated scenarios in Jinamar wastewater treatment plants (WWTP). Plant power demand vs. installed power.
Figure 3.
Simulated scenarios in Jinamar wastewater treatment plants (WWTP). Plant power demand vs. installed power.

Figure 4.
Simulated scenarios in Jinamar WWTP. Monthly analysis of Scenarios 3 and 4.
Figure 5.
Offered energy vs. demanded energy.
Figure 6.
Energy contribution of the different renewable energies in Scenarios 3 & 4.

Figure 7.
Available energy vs. energy harnessed in hydrogen storage system.

Figure 8.
Electrolyzer operation. (A) Electrolyzer 1 & (B) electrolyzer 2.

Figure 9.
Seasonal behavior of electrolyzers. January (A) and July (B).

Figure 10.
Amortization period. Scenario 4 with: (A) hydrogen storage & (B) network reinjection.


Table 1.
Technological configuration of the simulated scenarios for renewable energy production.
| Scenarios | Sludge Energy Production | Microturbine Energy Production | Photovoltaic Energy Production | Wind Energy Production | Hydroelectric Energy Production |
|---|---|---|---|---|---|
| 1 |  |  | N.A. |  |  |
| 2 |  |  |  |  |  |
| 3 |  |  |  |  |  |
| 4 |  |  | N.A. |  |  |
In Scenario 1, in addition to the internal technologies, a wind turbine and pico-turbine system are employed. Scenario 2 additionally incorporates a PV solar installation. Scenario 3 differs from the second in that the installed power in PV technology is doubled. Finally, Scenario 4 has no PV resource, but it incorporates a second wind turbine.
Table 2.
Installed power in each simulated scenario.
| Scenarios | Sludge Energy Production | Microturbine Energy Production | Photovoltaic Energy Production | Wind Energy Production | Hydroelectric Energy Production |
|---|---|---|---|---|---|
| 1 | 31.5 kW | 4 kW | N.A. | 500 kW | 0.97–1.46 kW |
| 2 | 31.5 kW | 4 kW | 100 kW | 500 kW | 0.97–1.46 kW |
| 3 | 31.5 kW | 4 kW | 2 × 100 kW | 500 kW | 0.97–1.46 kW |
| 4 | 31.5 kW | 4 kW | N.A. | 2 × 500 kW | 0.97–1.46 kW |
Table 3.
Specific cost per component.
| Equipment | Total Capital Invested (€) | Operation and Maintenance (€/year) | Replacement (€) | Useful Life (years) |
|---|---|---|---|---|
| Anaerobic digesters | 42,993 | 748 | 26,169 | 30 |
| Reformed steam | 85,160 | 3000 | 51,837 | 10 |
| Fuel cells for sludge | 1459 | 507 | 1142 | 2.5 |
| Fuel cell inverter | 2700 | N/A | 1878 | 25 |
| Hydro-eKIDS microturbines | 5876 | 350 | 4701 | 17 |
| Photovoltaic modules | 172,500 | N/A | 120,000 | 25 |
| Photovoltaic inverters | 7723 | N/A | 5372 | 25 |
| Wind turbine | 509,795 | 7757 | 354,640 | 25 |
| Pico-turbines | 5745 | 700 | 4496 | 30 |
Table 4.
Specific generation cost of the renewable systems.
| Specific Cost of the Renewable System (€/kWh) | |||
|---|---|---|---|
| Scenario 1 | Scenario 2 | Scenario 3 | Scenario 4 |
| 0.087 | 0.10 | 0.11 | 0.088 |
Table 5.
Specific cost per component for the management of energy surplus.
| Equipment | Total Capital Invested (€) | Operation and Maintenance (€/year) | Replacement (€) | Useful Life (years) |
|---|---|---|---|---|
| Application 1. Hydrogen storage | ||||
| Electrolyzers | 2,254,000 | 58,800 | 1,470,000 | 7 |
| Hydrogen bottles | 549,516 | N/A | 477,840 | 3 |
| Fuel cells | 1,853,800 | 644,800 | 1,449,188 | 3 |
| Fuel cell inverter | 16,555 | N/A | 11,516 | 25 |
| Application 2. Network reinjection | ||||
| Converter | 189,750 | 2887 | 148,500 | 25 |
| Transformer | 12,420 | 189 | 9720 | 30 |
Publisher’s Note: MDPI stays neutral with regard to jurisdictional claims in published maps and institutional affiliations. |
© 2020 by the authors. Licensee MDPI, Basel, Switzerland. This article is an open access article distributed under the terms and conditions of the Creative Commons Attribution (CC BY) license (http://creativecommons.org/licenses/by/4.0/).
Share and Cite
MDPI and ACS Style
Del Río-Gamero, B.; Ramos-Martín, A.; Melián-Martel, N.; Pérez-Báez, S. Water-Energy Nexus: A Pathway of Reaching the Zero Net Carbon in Wastewater Treatment Plants. Sustainability 2020, 12, 9377. https://doi.org/10.3390/su12229377
AMA Style
Del Río-Gamero B, Ramos-Martín A, Melián-Martel N, Pérez-Báez S. Water-Energy Nexus: A Pathway of Reaching the Zero Net Carbon in Wastewater Treatment Plants. Sustainability. 2020; 12(22):9377. https://doi.org/10.3390/su12229377
Chicago/Turabian StyleDel Río-Gamero, Beatriz, Alejandro Ramos-Martín, Noemi Melián-Martel, and Sebastián Pérez-Báez. 2020. "Water-Energy Nexus: A Pathway of Reaching the Zero Net Carbon in Wastewater Treatment Plants" Sustainability 12, no. 22: 9377. https://doi.org/10.3390/su12229377
Note that from the first issue of 2016, this journal uses article numbers instead of page numbers. See further details here.